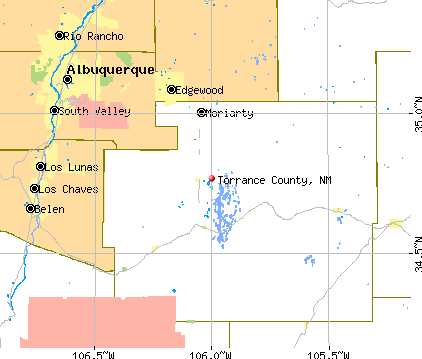
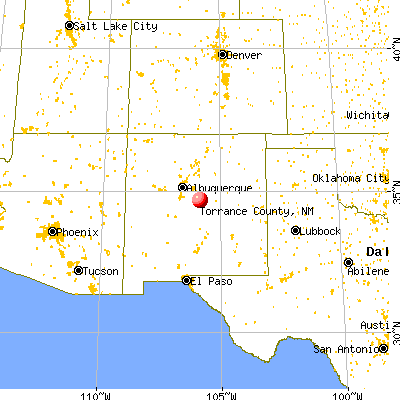
Torrance County, New Mexico (NM)
County owner-occupied free and clear houses and condos in 2010: 2,177
County owner-occupied houses and condos in 2000: 5,057
Renter-occupied apartments: 1,237 (it was 967 in 2000)
| % of renters here: | 16% |
| State: | 31% |
Land area: 3345 sq. mi.
Water area: 1.0 sq. mi.
Population density: 5 people per square mile (very low).
Industries providing employment: Public administration (15.0%), Educational, health and social services (13.9%), Arts, entertainment, recreation, accommodation and food services (12.6%), Retail trade (10.6%).
Type of workers:
- Private wage or salary: 65%
- Government: 27%
- Self-employed, not incorporated: 8%
- Unpaid family work: 0%
- OSM Map
- General Map
- Google Map
- MSN Map

- 7,10446.7%White Non-Hispanic Alone
- 6,85345.1%Hispanic or Latino
- 5163.4%Two or more races
- 2291.5%Black Non-Hispanic Alone
- 1891.2%Some other race alone
- 1811.2%American Indian and Alaska Native alone
- 1280.8%Asian alone

| Median resident age: | 43.9 years |
| New Mexico median age: | 39.4 years |
| Males: 7,767 | |
| Females: 7,442 |

 | Where's the best place for Off-Grid Land in New Mexico? (20 replies) |
| Oldest fossilized human footprints in North America discovered at White Sands NP (6 replies) |
| Warning: Do not move to this state or city (62 replies) |
| Realistically living in Torrance County (1 reply) |
| How is scenery, outdoor activities, and social life in NM? (48 replies) |
| Albuquerque Weather (314 replies) |
| Torrance County: | 2.0 people |
| New Mexico: | 3 people |
Estimated median household income in 2022: $51,594 ($30,446 in 1999)
| This county: | $51,594 |
| New Mexico: | $59,726 |
Median contract rent in 2022 for apartments: $563 (lower quartile is $441, upper quartile is $723)
| This county: | $563 |
| State: | $816 |
Estimated median house or condo value in 2022: $149,236 (it was $79,400 in 2000)
| Torrance: | $149,236 |
| New Mexico: | $243,100 |
Median monthly housing costs for homes and condos with a mortgage: $1,115
Median monthly housing costs for units without a mortgage: $349
Institutionalized population: 609
Crime in 2020 (reported by the sheriff's office or county police, not the county total):
- Murders: 0
- Rapes: 0
- Robberies: 0
- Assaults: 99
- Burglaries: 31
- Thefts: 21
- Auto thefts: 24
Crime in 2019 (reported by the sheriff's office or county police, not the county total):
- Murders: 0
- Rapes: 5
- Robberies: 1
- Assaults: 59
- Burglaries: 57
- Thefts: 25
- Auto thefts: 23
Health of residents in Torrance County based on CDC Behavioral Risk Factor Surveillance System Survey Questionnaires from 2013 to 2021:
General health status score of residents in this county from 1 (poor) to 5 (excellent) is 3.5. This is about average.77.5% of residents exercised in the past month. This is about average.
43.3% of residents smoked 100+ cigarettes in their lives. This is about average.
52.3% of adult residents drank alcohol in the past 30 days. This is less than average.
69.3% of residents visited a dentist within the past year. This is about average.
Average weight of males is 192 pounds. This is about average.
Average weight of females is 158 pounds. This is about average.
Median real estate property taxes paid for housing units with mortgages in 2022: $980 (0.5%)
Median real estate property taxes paid for housing units with no mortgage in 2022: $517 (0.5%)


| Torrance County: | 20.5% |
| New Mexico: | 17.6% |
Median age of residents in 2022: 43.9 years old
(Males: 43.8 years old, Females: 44.4 years old)
(Median age for: White residents: 53.9 years old, Black residents: 19.2 years old, American Indian residents: 36.3 years old, Asian residents: 17.8 years old, Hispanic or Latino residents: 37.4 years old, Other race residents: 37.5 years old)
Area name: Albuquerque, NM MSA
Fair market rent in 2006 for a 1-bedroom apartment in Torrance County is $571 a month.
Fair market rent for a 2-bedroom apartment is $721 a month.
Fair market rent for a 3-bedroom apartment is $1050 a month.
Cities in this county include: Moriarty, Estancia, McIntosh, Mountainair, Indian Hills, Willard, Tajique, Manzano Springs, Encino, Manzano.
Neighboring counties: DeKalb County, Alabama  , Socorro County
  , Kiowa County, Oklahoma , Montgomery County, North Carolina , Donley County, Texas , Parmer County, Texas .
| Here: | 5.2% |
| New Mexico: | 3.6% |


Current college students: 569
People 25 years of age or older with a high school degree or higher: 86.0%
People 25 years of age or older with a bachelor's degree or higher: 14.5%
Number of foreign born residents: 867 (40.6% naturalized citizens)
| Torrance County: | 5.7% |
| Whole state: | 9.3% |

- Year of entry for the foreign-born population
- 2612010 or later
- 2932000 to 2009
- 2081990 to 1999
- 2011980 to 1989
- 1001970 to 1979
- 128Before 1970
Mean travel time to work (commute): % minutes
Percentage of county residents living and working in this county: 100.4%
Housing units in structures:
- One, detached: 3,905
- One, attached: 44
- Two: 36
- 3 or 4: 35
- 5 to 9: 29
- 20 or more: 23
- Mobile homes: 3,141
- Boats, RVs, vans, etc.: 22
Housing units in Torrance County with a mortgage: 2,230 (104 second mortgage, 25 home equity loan, 23 both second mortgage and home equity loan)
Houses without a mortgage: 0
| Here: | 100.0% with mortgage |
| State: | 98.8% with mortgage |
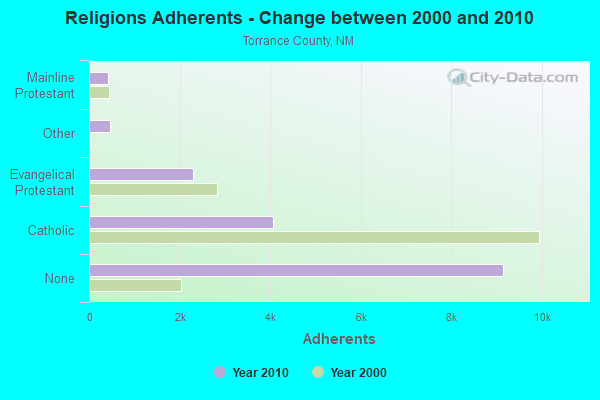
Religion statistics for Torrance County
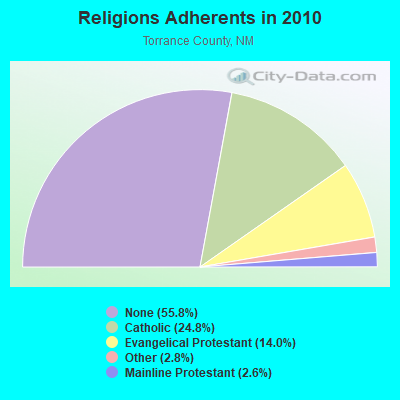
| Religion | Adherents | Congregations |
|---|---|---|
| Catholic | 4,055 | 12 |
| Evangelical Protestant | 2,301 | 20 |
| Other | 461 | 3 |
| Mainline Protestant | 428 | 3 |
| None | 9,138 | - |
Source: Clifford Grammich, Kirk Hadaway, Richard Houseal, Dale E.Jones, Alexei Krindatch, Richie Stanley and Richard H.Taylor. 2012. 2010 U.S.Religion Census: Religious Congregations & Membership Study. Association of Statisticians of American Religious Bodies. Jones, Dale E., et al. 2002. Congregations and Membership in the United States 2000. Nashville, TN: Glenmary Research Center.
Food Environment Statistics:
| Torrance County: | 4.23 / 10,000 pop. |
| State: | 1.44 / 10,000 pop. |
| Torrance County: | 4.84 / 10,000 pop. |
| New Mexico: | 4.06 / 10,000 pop. |
| This county: | 7.26 / 10,000 pop. |
| State: | 7.12 / 10,000 pop. |
| Torrance County: | 5.1% |
| New Mexico: | 6.4% |
| Torrance County: | 21.3% |
| State: | 22.1% |
Agriculture in Torrance County:
Average size of farms: 3681 acresAverage value of agricultural products sold per farm: $78,920
Average value of crops sold per acre for harvested cropland: $546.13
The value of livestock, poultry, and their products as a percentage of the total market value of agricultural products sold: 73.89%
Average total farm production expenses per farm: $79,841
Harvested cropland as a percentage of land in farms: 1.03%
Irrigated harvested cropland as a percentage of land in farms: 93.41%
Average market value of all machinery and equipment per farm: $56,126
The percentage of farms operated by a family or individual: 88.29%
Average age of principal farm operators: 57 years
Average number of cattle and calves per 100 acres of all land in farms: 2.88
Corn for grain: 456 harvested acres
Land in orchards: 108 acres
Earthquake activity:
Torrance County-area historical earthquake activity is significantly above New Mexico state average. It is 610% greater than the overall U.S. average.On 1/29/1990 at 13:16:10, a magnitude 4.8 (4.5 MB, 4.8 LG, Depth: 7.5 mi, Class: Light, Intensity: IV - V) earthquake occurred 54.0 miles away from Torrance County center
On 8/23/2011 at 05:46:18, a magnitude 5.3 (5.3 MW, Depth: 2.5 mi, Class: Moderate, Intensity: VI - VII) earthquake occurred 174.9 miles away from the county center
On 6/28/1992 at 11:57:34, a magnitude 7.6 (6.2 MB, 7.6 MS, 7.3 MW, Depth: 0.7 mi, Class: Major, Intensity: VIII - XII) earthquake occurred 601.4 miles away from the county center, causing 3 deaths (1 shaking deaths, 2 other deaths) and 400 injuries, causing $100,000,000 total damage and $40,000,000 insured losses
On 8/10/2005 at 22:08:22, a magnitude 5.0 (5.0 MB, 4.7 MS, 5.0 MW) earthquake occurred 164.4 miles away from the county center
On 8/10/2005 at 22:08:22, a magnitude 5.0 (5.0 MW, Depth: 3.1 mi) earthquake occurred 164.6 miles away from Torrance County center
On 6/29/2014 at 04:59:35, a magnitude 5.3 (5.3 MW, Depth: 4.0 mi) earthquake occurred 236.5 miles away from the county center
Magnitude types: regional Lg-wave magnitude (LG), body-wave magnitude (MB), surface-wave magnitude (MS), moment magnitude (MW)
Most recent natural disasters:
- New Mexico Covid-19 Pandemic, Incident Period: January 20, 2020, FEMA Id: 4529, Natural disaster type: Other
- New Mexico Severe Storms, Flooding, and Mudslides, Incident Period: September 09, 2013 to September 22, 2013, Major Disaster (Presidential) Declared DR-4152: October 29, 2013, FEMA Id: 4152, Natural disaster type: Storm, Mudslide, Flood
- New Mexico Big Springs Fire, Incident Period: June 25, 2008, Fire Management Assistance Declared: June 25, 2008, FEMA Id: 2777, Natural disaster type: Fire
- New Mexico Trigo Fire, Incident Period: April 21, 2008 to July 02, 2008, Fire Management Assistance Declared: April 21, 2008, FEMA Id: 2762, Natural disaster type: Fire
- New Mexico Ojo Peak Fire, Incident Period: November 18, 2007 to January 16, 2008, Fire Management Assistance Declared: November 21, 2007, FEMA Id: 2741, Natural disaster type: Fire
- New Mexico Severe Storms & Flooding, Incident Period: July 26, 2006 to September 18, 2006, Major Disaster (Presidential) Declared DR-1659: August 30, 2006, FEMA Id: 1659, Natural disaster type: Storm, Flood
- New Mexico Hurricane Katrina Evacuation, Incident Period: August 29, 2005 to October 01, 2005, Emergency Declared EM-3229: September 07, 2005, FEMA Id: 3229, Natural disaster type: Hurricane
- New Mexico New Mexico Wildfire, Incident Period: May 05, 2000 to June 09, 2000, Major Disaster (Presidential) Declared DR-1329: May 13, 2000, FEMA Id: 1329, Natural disaster type: Fire
- New Mexico New Mexico Fire, Incident Period: May 05, 2000 to July 07, 2000, Emergency Declared EM-3154: May 10, 2000, FEMA Id: 3154, Natural disaster type: Fire
- New Mexico Severe Winter Storms, Incident Period: December 22, 1997 to December 25, 1997, Major Disaster (Presidential) Declared DR-1202: January 29, 1998, FEMA Id: 1202, Natural disaster type: Winter Storm
- 1 other natural disasters have been reported since 1953.
The number of natural disasters in Torrance County (11) is smaller than the US average (15).
Major Disasters (Presidential) Declared: 5
Emergencies Declared: 2
Causes of natural disasters: Fires: 5, Floods: 3, Storms: 3, Hurricane: 1, Mudslide: 1, Winter Storm: 1, Other: 1 (Note: some incidents may be assigned to more than one category).

Means of transportation to work:
- Drove a car alone: 2,460 (68.1%)
- Carpooled: 254 (7.0%)
- Taxicab, motorcycle, or other means: 128 (3.5%)
- Bicycle: 17 (0.5%)
- Walked: 120 (3.3%)
- Worked at home: 696 (19.3%)


- Health care and social assistance (13%)
- Accommodation and food services (11%)
- Public administration (8%)
- Retail trade (8%)
- Educational services (5%)
- Professional, scientific, and technical services (5%)
- Other services, except public administration (3%)

- Health care and social assistance (18%)
- Accommodation and food services (15%)
- Public administration (12%)
- Retail trade (11%)
- Educational services (8%)
- Professional, scientific, and technical services (6%)
- Other services, except public administration (5%)

- Transportation occupations (14%)
- Management occupations (10%)
- Construction and extraction occupations (10%)
- Law enforcement workers including supervisors (9%)
- Installation, maintenance, and repair occupations (8%)
- Building and grounds cleaning and maintenance occupations (7%)
- Food preparation and serving related occupations (7%)

- Office and administrative support occupations (22%)
- Food preparation and serving related occupations (12%)
- Management occupations (11%)
- Healthcare support occupations (9%)
- Sales and related occupations (9%)
- Business and financial operations occupations (9%)
- Educational instruction, and library occupations (3%)

- Mexico (59%)
- Germany (15%)
- China, excluding Hong Kong and Taiwan (11%)
- El Salvador (4%)
- Argentina (4%)
- Korea (2%)
- Peru (2%)

- American (11%)
- English (10%)
- German (7%)
- European (7%)
- Irish (4%)
- Scottish (2%)
- Scotch-Irish (1%)


6 people in workers' group living quarters and job corps centers
524 people in other types of correctional institutions
10.48% of this county's 2021 resident taxpayers lived in other counties in 2020 ($40,933 average adjusted gross income)
| Here: | 10.48% |
| New Mexico average: | 6.50% |
10 or fewer of this county's residents moved from foreign countries.
7.37% relocated from other counties in New Mexico ($28,617 average AGI)
3.10% relocated from other states ($12,315 average AGI)
Torrance County: 3.10% New Mexico average: 3.84%

Top counties from which taxpayers relocated into this county between 2020 and 2021:
| from Bernalillo County, NM | |
| from Santa Fe County, NM | |
| from Valencia County, NM | |
| from Sandoval County, NM |
8.67% of this county's 2020 resident taxpayers moved to other counties in 2021 ($40,856 average adjusted gross income)
| Here: | 8.67% |
| New Mexico average: | 6.53% |
10 or fewer of this county's residents moved to foreign countries.
5.92% relocated to other counties in New Mexico ($26,452 average AGI)
2.75% relocated to other states ($14,404 average AGI)
Torrance County: 2.75% New Mexico average: 3.90%

Top counties to which taxpayers relocated from this county between 2020 and 2021:
| to Bernalillo County, NM | |
| to Santa Fe County, NM | |
| to Valencia County, NM |
Births per 1000 population from 1990 to 1999: 13.8
Births per 1000 population from 2000 to 2006: 10.9

Deaths per 1000 population from 1990 to 1999: 7.0
Deaths per 1000 population from 2000 to 2009: 7.7
Deaths per 1000 population from 2010 to 2020: 10.0

Infant deaths per 1000 live births from 1990 to 1999: 7.7
Infant deaths per 1000 live births from 2000 to 2006: 11.7

Persons under 19 years old without health insurance coverage in 2018: 6.5%


Persons enrolled in hospital insurance and/or supplemental medical insurance (Medicare) in July 1, 2007: 2,350 (1,772 aged, 578 disabled)
Children under 18 without health insurance coverage in 2007: 441 (12%)


Most common underlying causes of death in Torrance County, New Mexico in 1999 - 2019:
- Chronic obstructive pulmonary disease, unspecified (106)
- Atherosclerotic cardiovascular disease, so described (92)
- Bronchus or lung, unspecified - Malignant neoplasms (55)
- Atherosclerotic heart disease (22)
- Acute myocardial infarction, unspecified (11)
Population without health insurance coverage in 2000: 26%
Children under 18 without health insurance coverage in 2000: 23%
Medical specialist MDs per 100,000 population in 2005: 709
Dentists per 100,000 population in 1998: 6
Total births per 100,000 population, July 2005 - July 2006 : 13
Total deaths per 100,000 population, July 2005 - July 2006: 34
EPA green book nonattainment status in 2004-2006: 1
Suicides per 1,000,000 population from 2000 to 2006: 195.4. This is more than state average.
Household type by relationship:
Households: 15,209- Male householders: 3,294 (815 living alone), Female householders: 2,540 (823 living alone)
2,864 spouses (2,826 opposite-sex spouses), 484 unmarried partners, (449 opposite-sex unmarried partners), 3,995 children (3,643 natural, 248 adopted, 114 stepchildren), 403 grandchildren, 125 brothers or sisters, 406 parents, 99 foster children, 420 other relatives, 512 non-relatives
- In group quarters: 8
Size of family households: 1,849 2-persons, 1,193 3-persons, 529 4-persons, 167 5-persons, 134 6-persons, 76 7-or-more-persons.
Size of nonfamily households: 1,638 1-person, 220 2-persons, 8 3-persons, 8 5-persons.
1,597 married couples with children.
867 single-parent households (454 men, 413 women).
79.2% of residents of Torrance speak English at home.
19.6% of residents speak Spanish at home (82% speak English very well, 7% speak English well, 9% speak English not well, 1% don't speak English at all).
1.4% of residents speak other Indo-European language at home (100% speak English very well).
0.9% of residents speak Asian or Pacific Island language at home (100% speak English very well).
In fiscal year 2004:
Federal Government expenditure: $79,922,000 ($4,739 per capita)
Department of Defense expenditure: $2,382,000
Federal direct payments to individuals for retirement and disability: $36,319,000
Federal other direct payments to individuals: $10,475,000
Federal direct payments not to individuals: $999,000
Federal grants: $27,871,000
Federal procurement contracts: $714,000 ($56,000 Department of Defense)
Federal salaries and wages: $3,543,000 ($0,000 Department of Defense)
Federal Government direct loans: $786,000
Federal guaranteed/insured loans: $8,659,000
Federal Government insurance: $8,640,000
Population change from April 1, 2000 to July 1, 2005:
Births: 947| Here: | 54 per 1000 residents |
| State: | 74 per 1000 residents |
Deaths: 619
| Here: | 35 per 1000 residents |
| State: | 36 per 1000 residents |
Net international migration: +98
| Here: | +6 per 1000 residents |
| State: | +15 per 1000 residents |
Net internal migration: +182
| Here: | +10 per 1000 residents |
| State: | +5 per 1000 residents |

Total withdrawal of fresh water for public supply: 0.84 millions of gallons per day (all from ground)
| Here: | 5.7 |
| State: | 5.9 |
| Here: | 5.2 |
| State: | 4.2 |

- Year house built in Torrance County, New Mexico
- 02020 or later
- 2832010 to 2019
- 6122000 to 2009
- 1,8481990 to 1999
- 1,9121980 to 1989
- 8201970 to 1979
- 2091960 to 1969
- 3441950 to 1959
- 3071940 to 1949
- 6431939 or earlier

- Rooms in owner-occupied houses in Torrance County, New Mexico
- 551 room
- 762 rooms
- 1713 rooms
- 5244 rooms
- 1,4275 rooms
- 1,0786 rooms
- 6577 rooms
- 5848 rooms
- 4349+ rooms

- Rooms in renter-occupied apartments in Torrance County, New Mexico
- 201 room
- 112 rooms
- 673 rooms
- 2204 rooms
- 1895 rooms
- 2726 rooms
- 657 rooms
- 258 rooms
- 229+ rooms

- Bedrooms in owner-occupied houses in Torrance County, New Mexico
- 54no bedroom
- 2421 bedroom
- 8252 bedrooms
- 2,8443 bedrooms
- 9134 bedrooms
- 1275+ bedrooms

- Bedrooms in renter-occupied apartments in Torrance County, New Mexico
- 19no bedroom
- 731 bedroom
- 2792 bedrooms
- 4503 bedrooms
- 624 bedrooms
- 05+ bedrooms

- Cars and other vehicles available in Torrance County in owner-occupied houses/condos
- 104no vehicle
- 9381 vehicle
- 1,8362 vehicles
- 1,3163 vehicles
- 4834 vehicles
- 3595+ vehicles

- Cars and other vehicles available in Torrance County in renter-occupied apartments
- 157no vehicle
- 4111 vehicle
- 2612 vehicles
- 553 vehicles
- 94 vehicles
- 155+ vehicles
91.8% of Torrance County residents lived in the same house 1 years ago.
Out of people who lived in different houses, 12% lived in this county.
Out of people who lived in different counties, 26% lived in New Mexico.
| Torrance County: | 91.8% |
| State average: | 88.2% |
Place of birth for U.S.-born residents:
- This state: 8,704
- Other state: 5,561
- Northeast: 552
- Midwest: 1,048
- South: 1,804
- West: 2,162


- 46.4%Utility gas
- 23.9%Wood
- 10.9%Bottled, tank, or LP gas
- 10.2%Electricity
- 8.4%Other fuel
- 0.2%Solar energy

- 42.0%Utility gas
- 18.6%Wood
- 16.6%Electricity
- 16.0%Bottled, tank, or LP gas
- 3.9%Other fuel
- 2.9%Coal or coke
Private vs. public school enrollment:
| Here: | 3.4% |
| New Mexico: | 10.2% |
| Here: | 0.0% |
| New Mexico: | 10.0% |
| Here: | 18.6% |
| New Mexico: | 12.3% |


Torrance County government finances - Expenditure in 2020:
- Charges - Other: $411,000
Regular Highways: $4,000
- Construction - Correctional Institutions: $1,000,000
Local Fire Protection: $750,000
Police Protection: $450,000
General Public Buildings: $360,000
Regular Highways: $335,000
Regular Highways: $264,000
General Public Buildings: $195,000
Central Staff Services: $185,000
Financial Administration: $19,000
Corrections - Other: $5,000
- Current Operations - Health - Other: $2,722,000
Central Staff Services: $2,629,000
Central Staff Services: $1,900,000
Correctional Institutions: $1,651,000
Police Protection: $1,645,000
Police Protection: $1,300,000
Financial Administration: $1,213,000
Regular Highways: $1,088,000
Local Fire Protection: $778,000
General Public Buildings: $298,000
Local Fire Protection: $250,000
Financial Administration: $187,000
General Public Buildings: $180,000
Solid Waste Management: $102,000
Regular Highways: $80,000
Corrections - Other: $55,000
Judicial and Legal Services: $24,000
- Federal Intergovernmental - Other: $679,000
General Local Government Support: $351,000
General Local Government Support: $338,000
Highways: $80,000
- General - Interest on Debt: $7,195,000
Interest on Debt: $45,000
- Local Intergovernmental - General Local Government Support: $145,000
Public Welfare: $133,000
Highways: $22,000
- Long Term Debt - Outstanding Nonguaranteed - Industrial Revenue: $195,000,000
Beginning Outstanding - Public Debt for Private Purpose: $195,000,000
Outstanding Nonguaranteed - Industrial Revenue: $195,000,000
Beginning Outstanding - Public Debt for Private Purpose: $195,000,000
Outstanding Unspecified Public Purpose: $3,600,000
Beginning Outstanding - Unspecified Public Purpose: $3,600,000
Beginning Outstanding - Unspecified Public Purpose: $1,159,000
Outstanding Unspecified Public Purpose: $634,000
Retired Unspecified Public Purpose: $525,000
- Miscellaneous - Interest Earnings: $13,978,000
General Revenue - Other: $582,000
Rents: $152,000
Fines and Forfeits: $113,000
Interest Earnings: $100,000
- Other Capital Outlay - Local Fire Protection: $350,000
Police Protection: $190,000
Local Fire Protection: $181,000
Regular Highways: $141,000
Regular Highways: $120,000
Correctional Institutions: $52,000
Central Staff Services: $41,000
Health - Other: $41,000
- Other Funds - Cash and Securities: $3,704,000
- Sinking Funds - Cash and Securities: $215,357,000
Cash and Securities: $195,000,000
- State Intergovernmental - Other: $1,544,000
Highways: $975,000
General Local Government Support: $813,000
Highways: $633,000
Other: $250,000
- Tax - Property: $5,337,000
Property: $5,275,000
General Sales and Gross Receipts: $2,860,000
General Sales and Gross Receipts: $2,353,000
Motor Vehicle License: $53,000
Other License: $37,000
Occupation and Business License - Other: $15,000
Occupation and Business License - Other: $12,000
Public Utility License: $10,000
Alcoholic Beverage License: $1,000
- Total Salaries and Wages: $3,384,000
Torrance County government finances - Revenue in 2020:
- Charges - Other: $411,000
Regular Highways: $4,000
- Construction - Correctional Institutions: $1,000,000
Local Fire Protection: $750,000
Police Protection: $450,000
General Public Buildings: $360,000
Regular Highways: $335,000
Regular Highways: $264,000
General Public Buildings: $195,000
Central Staff Services: $185,000
Financial Administration: $19,000
Corrections - Other: $5,000
- Current Operations - Health - Other: $2,722,000
Central Staff Services: $2,629,000
Central Staff Services: $1,900,000
Correctional Institutions: $1,651,000
Police Protection: $1,645,000
Police Protection: $1,300,000
Financial Administration: $1,213,000
Regular Highways: $1,088,000
Local Fire Protection: $778,000
General Public Buildings: $298,000
Local Fire Protection: $250,000
Financial Administration: $187,000
General Public Buildings: $180,000
Solid Waste Management: $102,000
Regular Highways: $80,000
Corrections - Other: $55,000
Judicial and Legal Services: $24,000
- Federal Intergovernmental - Other: $679,000
General Local Government Support: $351,000
General Local Government Support: $338,000
Highways: $80,000
- General - Interest on Debt: $7,195,000
Interest on Debt: $45,000
- Local Intergovernmental - General Local Government Support: $145,000
Public Welfare: $133,000
Highways: $22,000
- Long Term Debt - Outstanding Nonguaranteed - Industrial Revenue: $195,000,000
Beginning Outstanding - Public Debt for Private Purpose: $195,000,000
Outstanding Nonguaranteed - Industrial Revenue: $195,000,000
Beginning Outstanding - Public Debt for Private Purpose: $195,000,000
Outstanding Unspecified Public Purpose: $3,600,000
Beginning Outstanding - Unspecified Public Purpose: $3,600,000
Beginning Outstanding - Unspecified Public Purpose: $1,159,000
Outstanding Unspecified Public Purpose: $634,000
Retired Unspecified Public Purpose: $525,000
- Miscellaneous - Interest Earnings: $13,978,000
General Revenue - Other: $582,000
Rents: $152,000
Fines and Forfeits: $113,000
Interest Earnings: $100,000
- Other Capital Outlay - Local Fire Protection: $350,000
Police Protection: $190,000
Local Fire Protection: $181,000
Regular Highways: $141,000
Regular Highways: $120,000
Correctional Institutions: $52,000
Central Staff Services: $41,000
Health - Other: $41,000
- Other Funds - Cash and Securities: $3,704,000
- Sinking Funds - Cash and Securities: $215,357,000
Cash and Securities: $195,000,000
- State Intergovernmental - Other: $1,544,000
Highways: $975,000
General Local Government Support: $813,000
Highways: $633,000
Other: $250,000
- Tax - Property: $5,337,000
Property: $5,275,000
General Sales and Gross Receipts: $2,860,000
General Sales and Gross Receipts: $2,353,000
Motor Vehicle License: $53,000
Other License: $37,000
Occupation and Business License - Other: $15,000
Occupation and Business License - Other: $12,000
Public Utility License: $10,000
Alcoholic Beverage License: $1,000
- Total Salaries and Wages: $3,384,000
Torrance County government finances - Debt in 2020:
- Charges - Other: $411,000
Regular Highways: $4,000
- Construction - Correctional Institutions: $1,000,000
Local Fire Protection: $750,000
Police Protection: $450,000
General Public Buildings: $360,000
Regular Highways: $335,000
Regular Highways: $264,000
General Public Buildings: $195,000
Central Staff Services: $185,000
Financial Administration: $19,000
Corrections - Other: $5,000
- Current Operations - Health - Other: $2,722,000
Central Staff Services: $2,629,000
Central Staff Services: $1,900,000
Correctional Institutions: $1,651,000
Police Protection: $1,645,000
Police Protection: $1,300,000
Financial Administration: $1,213,000
Regular Highways: $1,088,000
Local Fire Protection: $778,000
General Public Buildings: $298,000
Local Fire Protection: $250,000
Financial Administration: $187,000
General Public Buildings: $180,000
Solid Waste Management: $102,000
Regular Highways: $80,000
Corrections - Other: $55,000
Judicial and Legal Services: $24,000
- Federal Intergovernmental - Other: $679,000
General Local Government Support: $351,000
General Local Government Support: $338,000
Highways: $80,000
- General - Interest on Debt: $7,195,000
Interest on Debt: $45,000
- Local Intergovernmental - General Local Government Support: $145,000
Public Welfare: $133,000
Highways: $22,000
- Long Term Debt - Outstanding Nonguaranteed - Industrial Revenue: $195,000,000
Beginning Outstanding - Public Debt for Private Purpose: $195,000,000
Outstanding Nonguaranteed - Industrial Revenue: $195,000,000
Beginning Outstanding - Public Debt for Private Purpose: $195,000,000
Outstanding Unspecified Public Purpose: $3,600,000
Beginning Outstanding - Unspecified Public Purpose: $3,600,000
Beginning Outstanding - Unspecified Public Purpose: $1,159,000
Outstanding Unspecified Public Purpose: $634,000
Retired Unspecified Public Purpose: $525,000
- Miscellaneous - Interest Earnings: $13,978,000
General Revenue - Other: $582,000
Rents: $152,000
Fines and Forfeits: $113,000
Interest Earnings: $100,000
- Other Capital Outlay - Local Fire Protection: $350,000
Police Protection: $190,000
Local Fire Protection: $181,000
Regular Highways: $141,000
Regular Highways: $120,000
Correctional Institutions: $52,000
Central Staff Services: $41,000
Health - Other: $41,000
- Other Funds - Cash and Securities: $3,704,000
- Sinking Funds - Cash and Securities: $215,357,000
Cash and Securities: $195,000,000
- State Intergovernmental - Other: $1,544,000
Highways: $975,000
General Local Government Support: $813,000
Highways: $633,000
Other: $250,000
- Tax - Property: $5,337,000
Property: $5,275,000
General Sales and Gross Receipts: $2,860,000
General Sales and Gross Receipts: $2,353,000
Motor Vehicle License: $53,000
Other License: $37,000
Occupation and Business License - Other: $15,000
Occupation and Business License - Other: $12,000
Public Utility License: $10,000
Alcoholic Beverage License: $1,000
- Total Salaries and Wages: $3,384,000
Torrance County government finances - Cash and Securities in 2020:
- Charges - Other: $411,000
Regular Highways: $4,000
- Construction - Correctional Institutions: $1,000,000
Local Fire Protection: $750,000
Police Protection: $450,000
General Public Buildings: $360,000
Regular Highways: $335,000
Regular Highways: $264,000
General Public Buildings: $195,000
Central Staff Services: $185,000
Financial Administration: $19,000
Corrections - Other: $5,000
- Current Operations - Health - Other: $2,722,000
Central Staff Services: $2,629,000
Central Staff Services: $1,900,000
Correctional Institutions: $1,651,000
Police Protection: $1,645,000
Police Protection: $1,300,000
Financial Administration: $1,213,000
Regular Highways: $1,088,000
Local Fire Protection: $778,000
General Public Buildings: $298,000
Local Fire Protection: $250,000
Financial Administration: $187,000
General Public Buildings: $180,000
Solid Waste Management: $102,000
Regular Highways: $80,000
Corrections - Other: $55,000
Judicial and Legal Services: $24,000
- Federal Intergovernmental - Other: $679,000
General Local Government Support: $351,000
General Local Government Support: $338,000
Highways: $80,000
- General - Interest on Debt: $7,195,000
Interest on Debt: $45,000
- Local Intergovernmental - General Local Government Support: $145,000
Public Welfare: $133,000
Highways: $22,000
- Long Term Debt - Outstanding Nonguaranteed - Industrial Revenue: $195,000,000
Beginning Outstanding - Public Debt for Private Purpose: $195,000,000
Outstanding Nonguaranteed - Industrial Revenue: $195,000,000
Beginning Outstanding - Public Debt for Private Purpose: $195,000,000
Outstanding Unspecified Public Purpose: $3,600,000
Beginning Outstanding - Unspecified Public Purpose: $3,600,000
Beginning Outstanding - Unspecified Public Purpose: $1,159,000
Outstanding Unspecified Public Purpose: $634,000
Retired Unspecified Public Purpose: $525,000
- Miscellaneous - Interest Earnings: $13,978,000
General Revenue - Other: $582,000
Rents: $152,000
Fines and Forfeits: $113,000
Interest Earnings: $100,000
- Other Capital Outlay - Local Fire Protection: $350,000
Police Protection: $190,000
Local Fire Protection: $181,000
Regular Highways: $141,000
Regular Highways: $120,000
Correctional Institutions: $52,000
Central Staff Services: $41,000
Health - Other: $41,000
- Other Funds - Cash and Securities: $3,704,000
- Sinking Funds - Cash and Securities: $215,357,000
Cash and Securities: $195,000,000
- State Intergovernmental - Other: $1,544,000
Highways: $975,000
General Local Government Support: $813,000
Highways: $633,000
Other: $250,000
- Tax - Property: $5,337,000
Property: $5,275,000
General Sales and Gross Receipts: $2,860,000
General Sales and Gross Receipts: $2,353,000
Motor Vehicle License: $53,000
Other License: $37,000
Occupation and Business License - Other: $15,000
Occupation and Business License - Other: $12,000
Public Utility License: $10,000
Alcoholic Beverage License: $1,000
- Total Salaries and Wages: $3,384,000
Supplemental Security Income (SSI) in 2006:
- Total number of recipients: 528
- Number of aged recipients: 52
- Number of blind and disabled recipients: 476
- Number of recipients under 18: 65
- Number of recipients between 18 and 64: 345
- Number of recipients older than 64: 118
- Number of recipients also receiving OASDI: 205
- Amount of payments (thousands of dollars): 230
| Most common first names in Torrance County, NM among deceased individuals | ||
| Name | Count | Lived (average) |
|---|---|---|
| William | 52 | 75.5 years |
| John | 44 | 76.0 years |
| James | 34 | 73.5 years |
| Mary | 34 | 81.0 years |
| Robert | 30 | 60.4 years |
| George | 20 | 76.5 years |
| Charles | 19 | 73.3 years |
| Helen | 19 | 81.9 years |
| Frank | 18 | 75.4 years |
| Joe | 17 | 71.6 years |
| Most common last names in Torrance County, NM among deceased individuals | ||
| Last name | Count | Lived (average) |
|---|---|---|
| Chavez | 63 | 77.9 years |
| Garcia | 23 | 73.0 years |
| Zamora | 18 | 71.8 years |
| Sanchez | 17 | 74.9 years |
| Lopez | 16 | 60.5 years |
| Smith | 16 | 73.6 years |
| Montoya | 13 | 73.8 years |
| Davis | 13 | 78.2 years |
| Romero | 13 | 65.3 years |
| Gonzales | 12 | 71.4 years |
| Businesses in Torrance County, NM | ||||
| Name | Count | Name | Count | |
|---|---|---|---|---|
| Alco Stores | 1 | H&R Block | 1 | |
| Arby's | 1 | KFC | 1 | |
| Best Western | 1 | McDonald's | 1 | |
| Burger King | 1 | Motel 6 | 1 | |
| Chevrolet | 1 | RadioShack | 1 | |
| Circle K | 1 | Super 8 | 1 | |
| Comfort Inn | 1 | Taco Bell | 1 | |
| FedEx | 1 | UPS | 1 | |
Torrance County on our top lists:
- #3 on the list of "Top 101 counties with highest percentage of residents voting for 3rd party candidates in the 2012 Presidential Election"