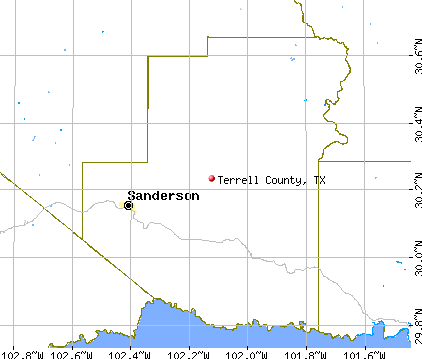
Terrell County, Texas (TX)
County owner-occupied free and clear houses and condos in 2010: 213
County owner-occupied houses and condos in 2000: 344
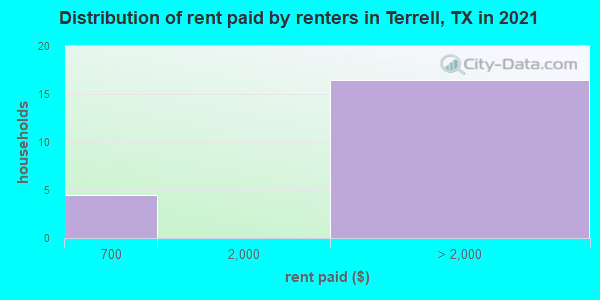
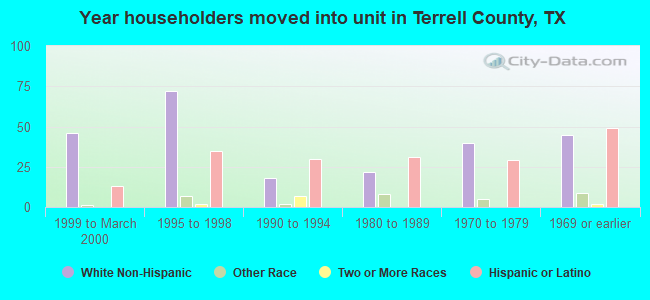
Renter-occupied apartments: 124 (it was 99 in 2000)
| % of renters here: | 22% |
| State: | 36% |
Land area: 2358 sq. mi.
Water area: 0.0 sq. mi.
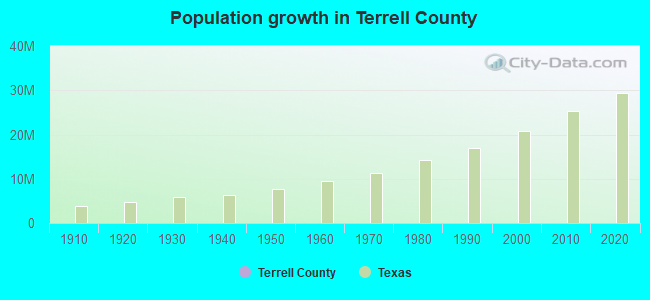
Population density: 0 people per square mile (very low).
Industries providing employment: Educational, health and social services (37.7%), Agriculture,forestry,fishing and hunting, and mining (14.1%), Professional, scientific, management, administrative, and waste management services (11.9%).
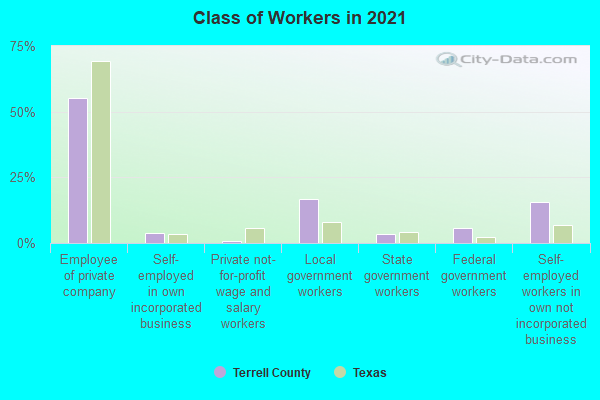
Type of workers:
- Private wage or salary: 50%
- Government: 33%
- Self-employed, not incorporated: 17%
- Unpaid family work: 0%
- OSM Map
- General Map
- Google Map
- MSN Map

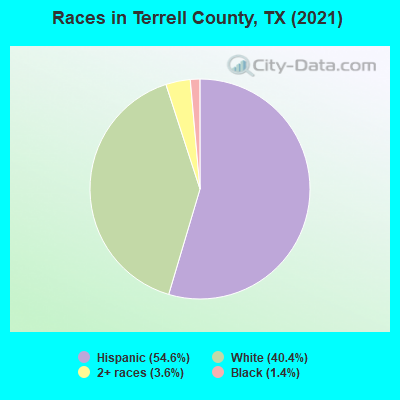
- 45552.1%White Non-Hispanic Alone
- 41947.9%Hispanic or Latino
| Median resident age: | 58.4 years |
| Texas median age: | 35.6 years |
| Males: 514 | |
| Females: 371 |


| Terrell County: | 2.0 people |
| Texas: | 3 people |
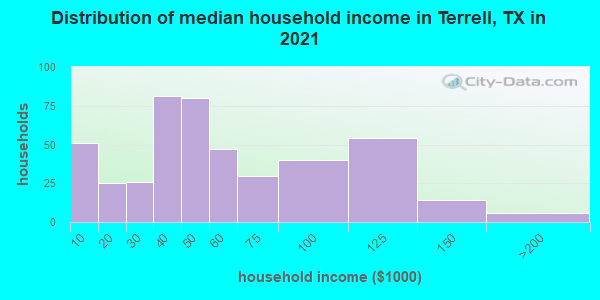
Estimated median household income in 2022: $52,269 ($24,219 in 1999)
| This county: | $52,269 |
| Texas: | $72,284 |
Median contract rent in 2022 for apartments: $-689,506,172
| This county: | |
| State: |
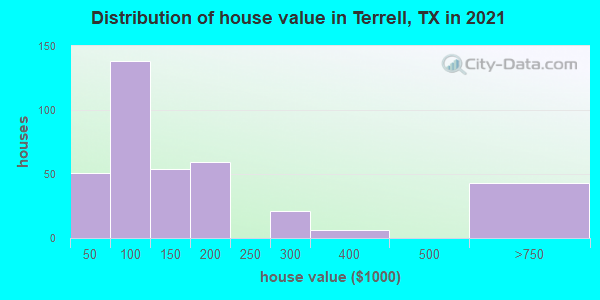
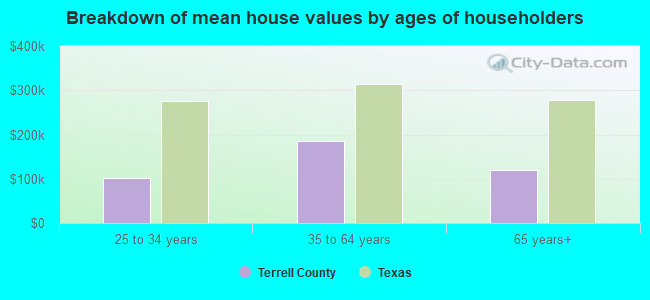
Estimated median house or condo value in 2022: $138,626 (it was $26,900 in 2000)
| Terrell: | $138,626 |
| Texas: | $275,400 |
Mean price in 2022:
Median monthly housing costs for homes and condos with a mortgage: $1,268Detached houses: $156,313
Here: $156,313 State: $369,058
Median monthly housing costs for units without a mortgage: $511
Institutionalized population: 0
Crime in 2020 (reported by the sheriff's office or county police, not the county total):
- Murders: 0
- Rapes: 0
- Robberies: 0
- Assaults: 0
- Burglaries: 0
- Thefts: 0
- Auto thefts: 0
Crime in 2019 (reported by the sheriff's office or county police, not the county total):
- Murders: 0
- Rapes: 0
- Robberies: 0
- Assaults: 0
- Burglaries: 0
- Thefts: 0
- Auto thefts: 0

Median real estate property taxes paid for housing units with mortgages in 2022: $1,275 (1.0%)
Median real estate property taxes paid for housing units with no mortgage in 2022: $1,391 (1.0%)
| Terrell County: | 6.3% |
| Texas: | 14.0% |
Median age of residents in 2022: 58.4 years old
(Males: 57.7 years old, Females: 61.8 years old)
(Median age for: White residents: 65.0 years old, Hispanic or Latino residents: 55.7 years old, Other race residents: 57.5 years old)
Fair market rent in 2006 for a 1-bedroom apartment in Terrell County is $425 a month.
Fair market rent for a 2-bedroom apartment is $484 a month.
Fair market rent for a 3-bedroom apartment is $628 a month.
Cities in this county include: West Terrell, Sanderson, East Terrell.
Neighboring counties: Acadia Parish, Louisiana  , Ascension Parish, Louisiana , Hancock County, Mississippi , Harrison County, Mississippi , Burnet County , Mobile County, Alabama , Grady County, Georgia .
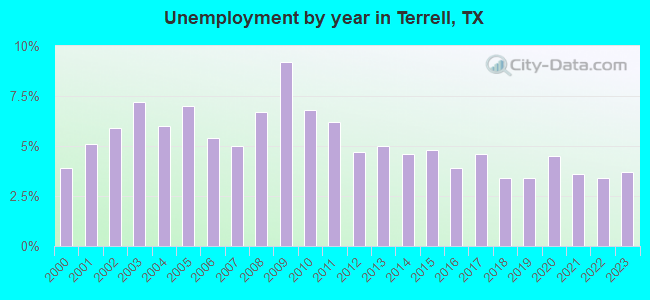
| Here: | 2.9% |
| Texas: | 3.5% |

Current college students: 17
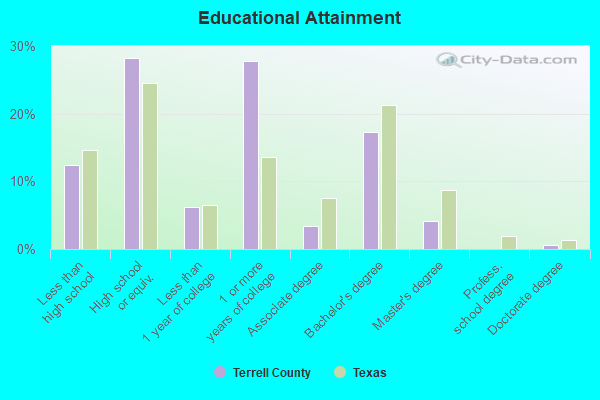
People 25 years of age or older with a high school degree or higher: 93.7%
People 25 years of age or older with a bachelor's degree or higher: 29.5%
Number of foreign born residents: 20 (63.8% naturalized citizens)
| Terrell County: | 2.3% |
| Whole state: | 17.2% |
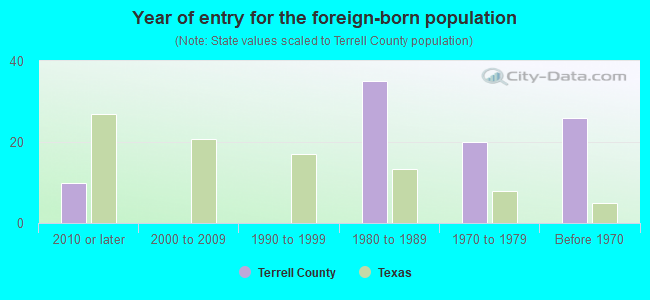
- Year of entry for the foreign-born population
- 252010 or later
- 02000 to 2009
- 01990 to 1999
- 351980 to 1989
- 201970 to 1979
- 26Before 1970
Mean travel time to work (commute): minutes
Percentage of county residents living and working in this county: 100.0%


Housing units in structures:
- One, detached: 640
- One, attached: 9
- Mobile homes: 32
Housing units in Terrell County with a mortgage: 82 (0 second mortgage, 0 home equity loan, 0 both second mortgage and home equity loan)
Houses without a mortgage: 0
| Here: | 100.0% with mortgage |
| State: | 98.4% with mortgage |
Religion statistics for Terrell County
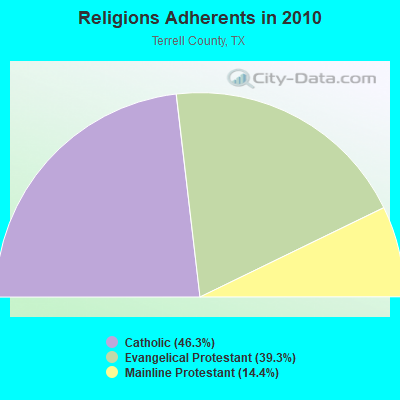
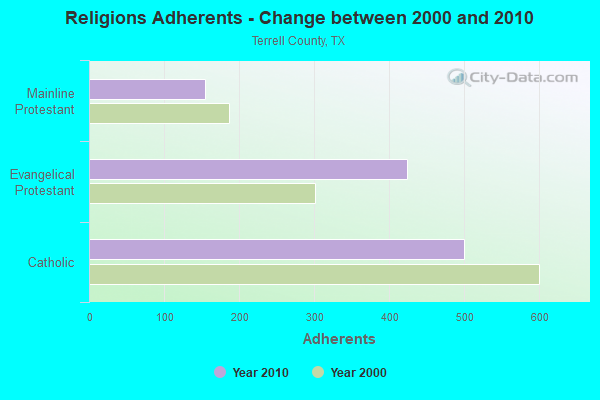
| Religion | Adherents | Congregations |
|---|---|---|
| Catholic | 500 | 1 |
| Evangelical Protestant | 424 | 3 |
| Mainline Protestant | 155 | 4 |
| None | - | - |
Source: Clifford Grammich, Kirk Hadaway, Richard Houseal, Dale E.Jones, Alexei Krindatch, Richie Stanley and Richard H.Taylor. 2012. 2010 U.S.Religion Census: Religious Congregations & Membership Study. Association of Statisticians of American Religious Bodies. Jones, Dale E., et al. 2002. Congregations and Membership in the United States 2000. Nashville, TN: Glenmary Research Center.
Food Environment Statistics:
| Terrell County: | 21.46 / 10,000 pop. |
| Texas: | 3.95 / 10,000 pop. |
| This county: | 10.73 / 10,000 pop. |
| State: | 6.13 / 10,000 pop. |
| Terrell County: | 11.6% |
| Texas: | 8.9% |
| Terrell County: | 26.1% |
| State: | 26.6% |
Agriculture in Terrell County:
Average size of farms: 18593 acresAverage value of agricultural products sold per farm: $51,256
The value of nursery, greenhouse, floriculture, and sod as a percentage of the total market value of agricultural products sold: 0.00%
Average total farm production expenses per farm: $88,541
Average market value of all machinery and equipment per farm: $43,870
The percentage of farms operated by a family or individual: 84.21%
Average age of principal farm operators: 57 years
Average number of cattle and calves per 100 acres of all land in farms: 0.51
Earthquake activity:
Terrell County-area historical earthquake activity is significantly above Texas state average. It is 17% greater than the overall U.S. average.On 4/14/1995 at 00:32:56, a magnitude 5.7 (5.6 MB, 5.7 MS, 5.7 MW, Depth: 11.1 mi, Class: Moderate, Intensity: VI - VII) earthquake occurred 74.2 miles away from Terrell County center
On 6/16/1978 at 11:46:54, a magnitude 5.3 (4.4 MB, 4.6 UK, 5.3 ML) earthquake occurred 209.4 miles away from the county center
On 3/26/2020 at 15:16:27, a magnitude 5.0 (5.0 MW, Depth: 5.9 mi) earthquake occurred 153.1 miles away from the county center
On 1/2/1992 at 11:45:35, a magnitude 5.0 (4.6 MB, 5.0 LG, Depth: 3.1 mi) earthquake occurred 156.4 miles away from the county center
On 5/14/2015 at 17:41:14, a magnitude 4.0 (4.0 MB, Depth: 9.8 mi, Class: Light, Intensity: IV - V) earthquake occurred 63.6 miles away from Terrell County center
On 8/28/1995 at 10:46:12, a magnitude 6.9 (5.7 MB, 6.5 MS, 6.9 ME, 6.6 MW, Depth: 7.6 mi, Class: Strong, Intensity: VII - IX) earthquake occurred 573.7 miles away from the county center
Magnitude types: regional Lg-wave magnitude (LG), body-wave magnitude (MB), energy magnitude (ME), local magnitude (ML), surface-wave magnitude (MS), moment magnitude (MW)
Most recent natural disasters:
- Texas Covid-19 Pandemic, Incident Period: January 20, 2020, FEMA Id: 4485, Natural disaster type: Other
- Texas Wildfires, Incident Period: March 14, 2008 to September 01, 2008, Emergency Declared EM-3284: March 14, 2008, FEMA Id: 3284, Natural disaster type: Fire
- Texas Hurricane Rita, Incident Period: September 23, 2005 to October 14, 2005, Major Disaster (Presidential) Declared DR-1606: September 24, 2005, FEMA Id: 1606, Natural disaster type: Hurricane
- Texas Hurricane Rita, Incident Period: September 20, 2005 to October 14, 2005, Emergency Declared EM-3261: September 21, 2005, FEMA Id: 3261, Natural disaster type: Hurricane
- Texas Hurricane Katrina, Incident Period: August 29, 2005 to October 01, 2005, Emergency Declared EM-3216: September 02, 2005, FEMA Id: 3216, Natural disaster type: Hurricane
- Texas Extreme Fire Hazards, Incident Period: August 01, 1999 to December 10, 1999, Emergency Declared EM-3142: September 01, 1999, FEMA Id: 3142, Natural disaster type: Fire
- Texas Extreme Fire Hazard, Incident Period: August 30, 1993 to November 15, 1993, Emergency Declared EM-3113: September 10, 1993, FEMA Id: 3113, Natural disaster type: Fire
- Texas TORNADOES, FLOODING, Incident Period: June 19, 1965, Major Disaster (Presidential) Declared DR-199: June 19, 1965, FEMA Id: 199, Natural disaster type: Tornado, Flood
The number of natural disasters in Terrell County (8) is smaller than the US average (15).
Major Disasters (Presidential) Declared: 2
Emergencies Declared: 5
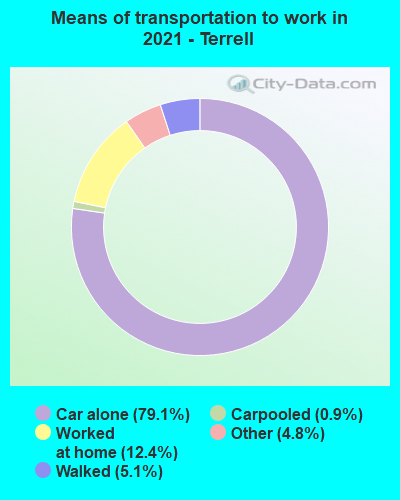
Means of transportation to work:
- Drove a car alone: 392 (77.6%)
- Carpooled: 4 (0.8%)
- Taxicab, motorcycle, or other means: 24 (4.8%)
- Walked: 25 (5.0%)
- Worked at home: 80 (15.8%)
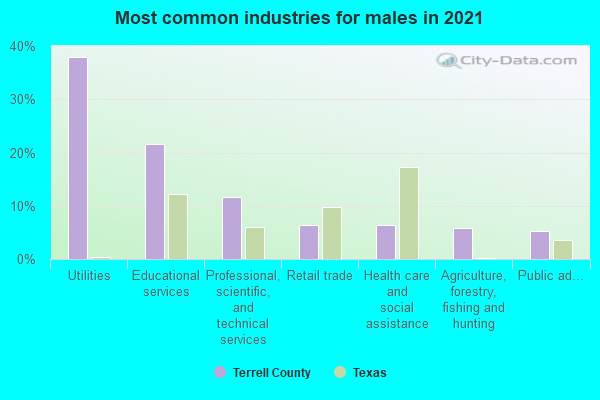
- Educational services (30%)
- Retail trade (8%)
- Health care and social assistance (7%)
- Agriculture, forestry, fishing and hunting (6%)
- Professional, scientific, and technical services (5%)
- Accommodation and food services (4%)
- Public administration (4%)
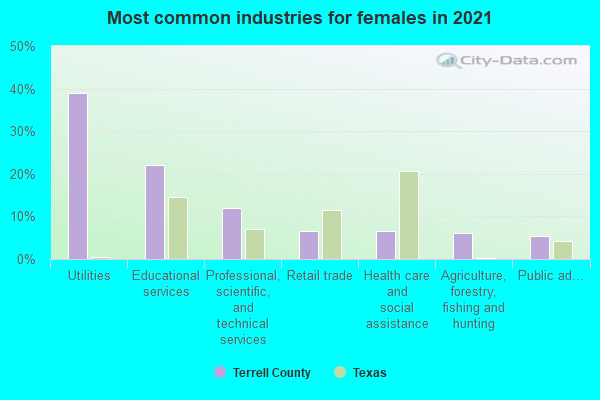
- Educational services (42%)
- Retail trade (11%)
- Health care and social assistance (10%)
- Agriculture, forestry, fishing and hunting (9%)
- Professional, scientific, and technical services (7%)
- Accommodation and food services (6%)
- Public administration (6%)
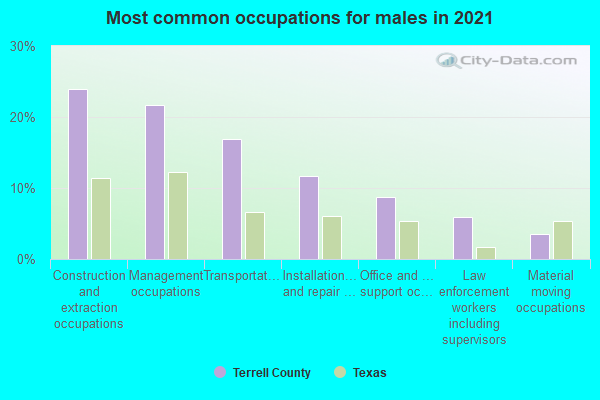
- Management occupations (30%)
- Transportation occupations (21%)
- Construction and extraction occupations (10%)
- Installation, maintenance, and repair occupations (10%)
- Office and administrative support occupations (9%)
- Building and grounds cleaning and maintenance occupations (8%)
- Material moving occupations (8%)
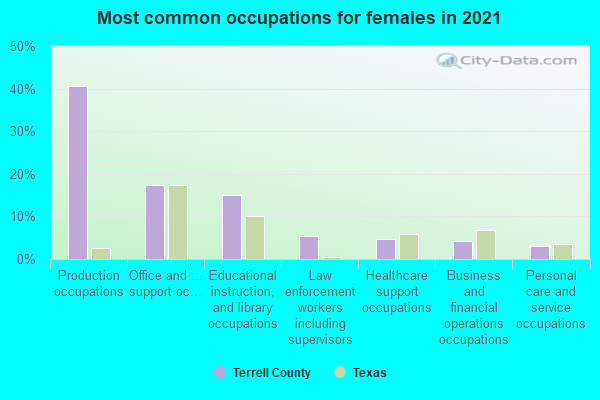
- Office and administrative support occupations (23%)
- Educational instruction, and library occupations (22%)
- Management occupations (12%)
- Healthcare support occupations (8%)
- Law enforcement workers including supervisors (7%)
- Sales and related occupations (6%)
- Personal care and service occupations (4%)

- Mexico (95%)
- Ireland (0%)
- Norway (0%)
- Sweden (0%)
- United Kingdom, excluding England and Scotland (0%)
- England (0%)
- Scotland (0%)
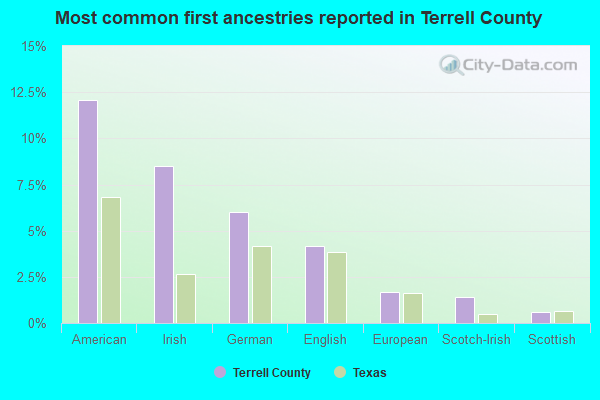
- American (13%)
- Irish (11%)
- German (8%)
- European (2%)
- English (2%)
- Scottish (1%)
- Scotch-Irish (1%)
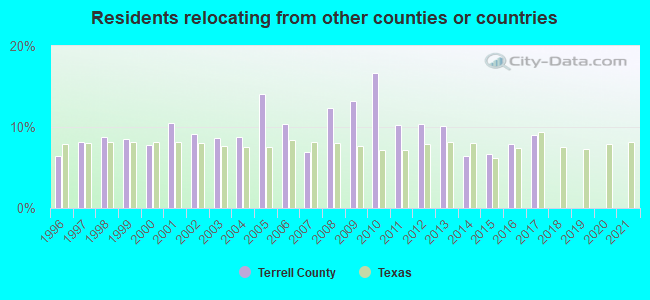
10 or fewer of this county's residents relocated from other counties between 2020 and 2021.1,000 average adjusted gross income)
10 or fewer of this county's residents moved from foreign countries.
10 or fewer of this county's residents relocated from other counties in Texas.
10 or fewer of this county's residents relocated from other states.
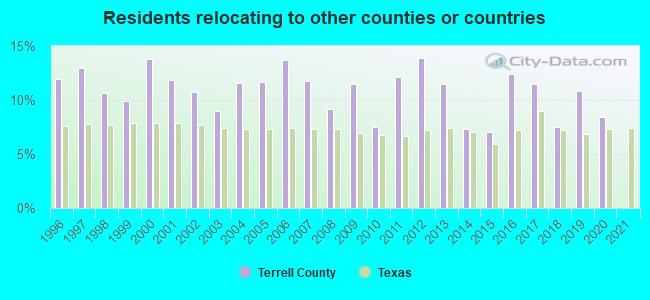
10 or fewer of this county's residents relocated to other counties between 2020 and 2021.1,000 average adjusted gross income)
10 or fewer of this county's residents moved to foreign countries.
10 or fewer of this county's residents relocated to other counties in Texas.
10 or fewer of this county's residents relocated to other states.
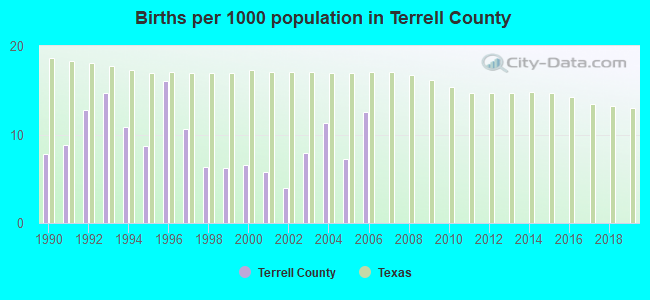
Births per 1000 population from 1990 to 1999: 10.3
Births per 1000 population from 2000 to 2006: 7.9
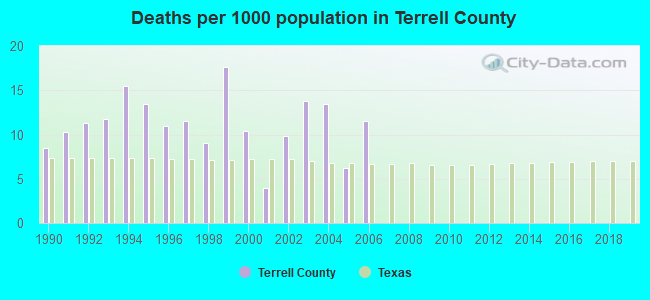
Deaths per 1000 population from 1990 to 1999: 12.0
Deaths per 1000 population from 2000 to 2009: 6.9
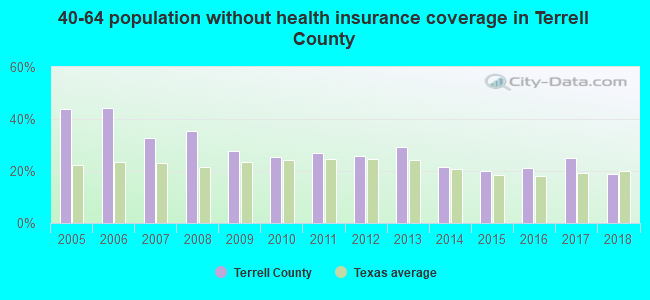
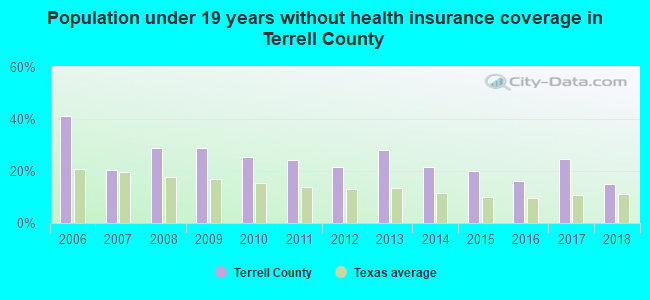
Persons under 19 years old without health insurance coverage in 2018: 14.9%

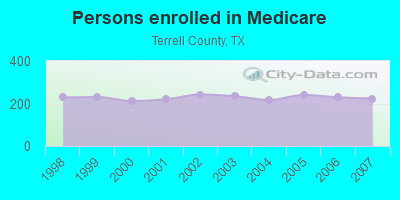
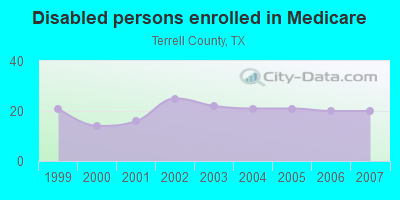
Persons enrolled in hospital insurance and/or supplemental medical insurance (Medicare) in July 1, 2007: 223 (203 aged, 20 disabled)
Children under 18 without health insurance coverage in 2007: 37 (19%)

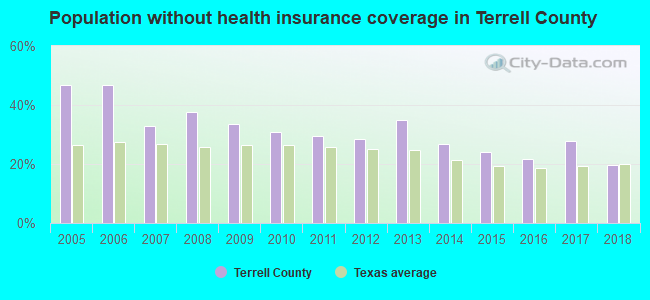
Population without health insurance coverage in 2000: 26%
Children under 18 without health insurance coverage in 2000: 27%
Medical specialist MDs per 100,000 population in 2005: 803
Household type by relationship:
Households: 885- Male householders: 208 (126 living alone), Female householders: 252 (104 living alone)
211 spouses (211 opposite-sex spouses), 0 unmarried partners, (0 opposite-sex unmarried partners), 166 children (166 natural, 0 adopted, 0 stepchildren), 0 grandchildren, 18 brothers or sisters, 12 parents, 0 foster children, 21 other relatives, 0 non-relatives
Size of family households: 187 2-persons, 26 3-persons, 17 4-persons, 5 6-persons.
Size of nonfamily households: 230 1-person.
69 married couples with children.
32 single-parent households (12 men, 20 women).
62.7% of residents of Terrell speak English at home.
38.6% of residents speak Spanish at home (86% speak English very well, 10% speak English well, 1% speak English not well, 2% don't speak English at all).
In fiscal year 2004:
Federal Government expenditure: $12,776,000 ($13,350 per capita)
Department of Defense expenditure: $4,535,000
Federal direct payments to individuals for retirement and disability: $3,186,000
Federal other direct payments to individuals: $1,651,000
Federal direct payments not to individuals: $230,000
Federal grants: $2,200,000
Federal procurement contracts: $4,497,000 ($4,464,000 Department of Defense)
Federal salaries and wages: $1,013,000 ($0,000 Department of Defense)
Federal Government direct loans: $16,000
Federal guaranteed/insured loans: $308,000
Federal Government insurance: $150,000
Population change from April 1, 2000 to July 1, 2005:
Births: 35| Here: | 35 per 1000 residents |
| State: | 85 per 1000 residents |
Deaths: 49
| Here: | 49 per 1000 residents |
| State: | 35 per 1000 residents |
Net international migration: +25
| Here: | +25 per 1000 residents |
| State: | +29 per 1000 residents |
Net internal migration: -93
| Here: | |
| State: |
Total withdrawal of fresh water for public supply: 0.17 millions of gallons per day (all from ground)
| Here: | 5.6 |
| State: | 6.3 |
| Here: | 5.3 |
| State: | 4.0 |
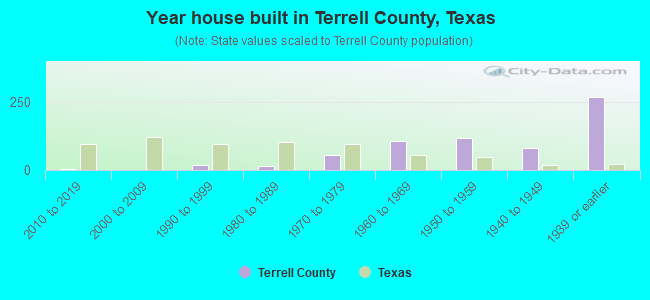
- Year house built in Terrell County, Texas
- 02020 or later
- 92010 to 2019
- 02000 to 2009
- 101990 to 1999
- 231980 to 1989
- 451970 to 1979
- 1201960 to 1969
- 1281950 to 1959
- 771940 to 1949
- 2291939 or earlier
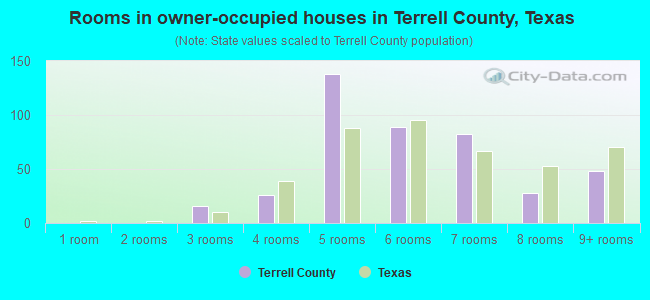
- Rooms in owner-occupied houses in Terrell County, Texas
- 01 room
- 52 rooms
- 223 rooms
- 164 rooms
- 1515 rooms
- 1276 rooms
- 527 rooms
- 278 rooms
- 209+ rooms
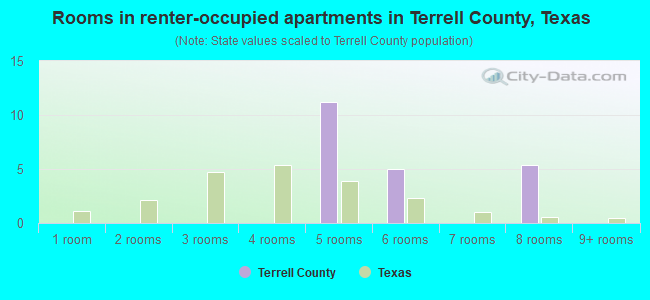
- Rooms in renter-occupied apartments in Terrell County, Texas
- 01 room
- 02 rooms
- 03 rooms
- 04 rooms
- 215 rooms
- 116 rooms
- 07 rooms
- 78 rooms
- 09+ rooms
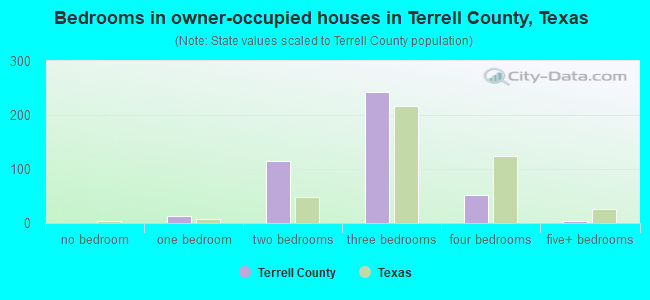
- Bedrooms in owner-occupied houses in Terrell County, Texas
- 0no bedroom
- 211 bedroom
- 1302 bedrooms
- 2463 bedrooms
- 204 bedrooms
- 05+ bedrooms
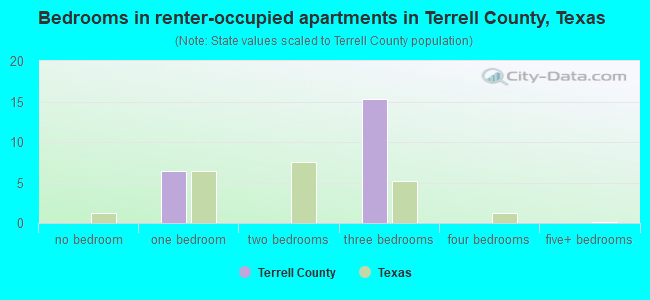
- Bedrooms in renter-occupied apartments in Terrell County, Texas
- 0no bedroom
- 231 bedroom
- 02 bedrooms
- 163 bedrooms
- 04 bedrooms
- 05+ bedrooms

- Cars and other vehicles available in Terrell County in owner-occupied houses/condos
- 16no vehicle
- 1141 vehicle
- 1622 vehicles
- 973 vehicles
- 334 vehicles
- 05+ vehicles
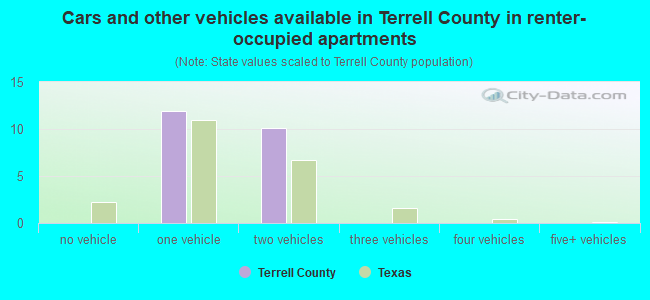
- Cars and other vehicles available in Terrell County in renter-occupied apartments
- 0no vehicle
- 241 vehicle
- 162 vehicles
- 03 vehicles
- 04 vehicles
- 05+ vehicles
100.2% of Terrell County residents lived in the same house 1 years ago.
| Terrell County: | 100.2% |
| State average: | 85.7% |
Place of birth for U.S.-born residents:
- This state: 761
- Other state: 85
- Northeast: 20
- Midwest: 6
- South: 15
- West: 43

- 57.0%Bottled, tank, or LP gas
- 28.4%Electricity
- 11.1%Fuel oil, kerosene, etc.
- 2.0%Other fuel
- 1.5%Wood
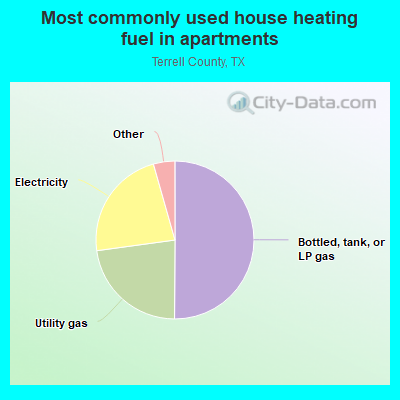
- 84.2%Bottled, tank, or LP gas
- 15.8%Utility gas
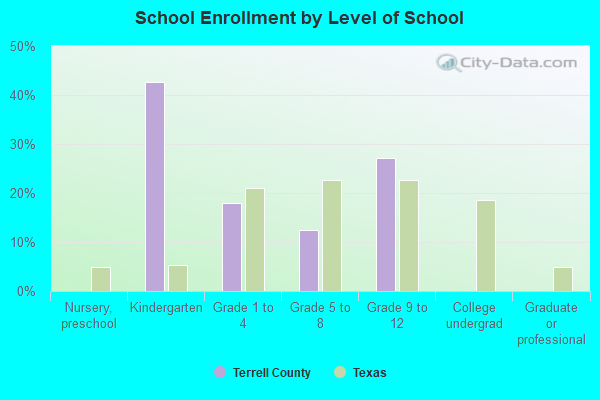
Private vs. public school enrollment:
| Here: | 0.0% |
| Texas: | 8.8% |
| Here: | 0.0% |
| Texas: | 8.0% |
Terrell County government finances - Expenditure in 2017:
- Charges - Solid Waste Management: $134,000
Other: $10,000
Air Transportation: $7,000
Parks and Recreation: $1,000
- Current Operations - Regular Highways: $1,303,000
Police Protection: $1,231,000
Central Staff Services: $603,000
Health - Other: $567,000
Judicial and Legal Services: $400,000
Solid Waste Management: $241,000
Financial Administration: $202,000
General Public Buildings: $162,000
Corrections - Other: $130,000
General - Other: $114,000
Libraries: $87,000
Air Transportation: $71,000
Parks and Recreation: $63,000
Local Fire Protection: $56,000
Transit Utilities: $37,000
- Federal Intergovernmental - Other: $217,000
Natural Resources: $30,000
- Local Intergovernmental - Transit Utilities: $39,000
- Miscellaneous - Fines and Forfeits: $270,000
Interest Earnings: $14,000
General Revenue - Other: $5,000
- Other Capital Outlay - Health - Other: $51,000
Regular Highways: $28,000
Local Fire Protection: $4,000
- Other Funds - Cash and Securities: $1,834,000
- State Intergovernmental - Highways: $753,000
Other: $23,000
- Tax - Property: $3,503,000
General Sales and Gross Receipts: $228,000
Motor Vehicle License: $82,000
- Total Salaries and Wages: $1,130,000
Terrell County government finances - Revenue in 2017:
- Charges - Solid Waste Management: $134,000
Other: $10,000
Air Transportation: $7,000
Parks and Recreation: $1,000
- Current Operations - Regular Highways: $1,303,000
Police Protection: $1,231,000
Central Staff Services: $603,000
Health - Other: $567,000
Judicial and Legal Services: $400,000
Solid Waste Management: $241,000
Financial Administration: $202,000
General Public Buildings: $162,000
Corrections - Other: $130,000
General - Other: $114,000
Libraries: $87,000
Air Transportation: $71,000
Parks and Recreation: $63,000
Local Fire Protection: $56,000
Transit Utilities: $37,000
- Federal Intergovernmental - Other: $217,000
Natural Resources: $30,000
- Local Intergovernmental - Transit Utilities: $39,000
- Miscellaneous - Fines and Forfeits: $270,000
Interest Earnings: $14,000
General Revenue - Other: $5,000
- Other Capital Outlay - Health - Other: $51,000
Regular Highways: $28,000
Local Fire Protection: $4,000
- Other Funds - Cash and Securities: $1,834,000
- State Intergovernmental - Highways: $753,000
Other: $23,000
- Tax - Property: $3,503,000
General Sales and Gross Receipts: $228,000
Motor Vehicle License: $82,000
- Total Salaries and Wages: $1,130,000
Terrell County government finances - Debt in 2017:
- Charges - Solid Waste Management: $134,000
Other: $10,000
Air Transportation: $7,000
Parks and Recreation: $1,000
- Current Operations - Regular Highways: $1,303,000
Police Protection: $1,231,000
Central Staff Services: $603,000
Health - Other: $567,000
Judicial and Legal Services: $400,000
Solid Waste Management: $241,000
Financial Administration: $202,000
General Public Buildings: $162,000
Corrections - Other: $130,000
General - Other: $114,000
Libraries: $87,000
Air Transportation: $71,000
Parks and Recreation: $63,000
Local Fire Protection: $56,000
Transit Utilities: $37,000
- Federal Intergovernmental - Other: $217,000
Natural Resources: $30,000
- Local Intergovernmental - Transit Utilities: $39,000
- Miscellaneous - Fines and Forfeits: $270,000
Interest Earnings: $14,000
General Revenue - Other: $5,000
- Other Capital Outlay - Health - Other: $51,000
Regular Highways: $28,000
Local Fire Protection: $4,000
- Other Funds - Cash and Securities: $1,834,000
- State Intergovernmental - Highways: $753,000
Other: $23,000
- Tax - Property: $3,503,000
General Sales and Gross Receipts: $228,000
Motor Vehicle License: $82,000
- Total Salaries and Wages: $1,130,000
Terrell County government finances - Cash and Securities in 2017:
- Charges - Solid Waste Management: $134,000
Other: $10,000
Air Transportation: $7,000
Parks and Recreation: $1,000
- Current Operations - Regular Highways: $1,303,000
Police Protection: $1,231,000
Central Staff Services: $603,000
Health - Other: $567,000
Judicial and Legal Services: $400,000
Solid Waste Management: $241,000
Financial Administration: $202,000
General Public Buildings: $162,000
Corrections - Other: $130,000
General - Other: $114,000
Libraries: $87,000
Air Transportation: $71,000
Parks and Recreation: $63,000
Local Fire Protection: $56,000
Transit Utilities: $37,000
- Federal Intergovernmental - Other: $217,000
Natural Resources: $30,000
- Local Intergovernmental - Transit Utilities: $39,000
- Miscellaneous - Fines and Forfeits: $270,000
Interest Earnings: $14,000
General Revenue - Other: $5,000
- Other Capital Outlay - Health - Other: $51,000
Regular Highways: $28,000
Local Fire Protection: $4,000
- Other Funds - Cash and Securities: $1,834,000
- State Intergovernmental - Highways: $753,000
Other: $23,000
- Tax - Property: $3,503,000
General Sales and Gross Receipts: $228,000
Motor Vehicle License: $82,000
- Total Salaries and Wages: $1,130,000
Supplemental Security Income (SSI) in 2006:
- Total number of recipients: 27
- Number of aged recipients: 8
- Number of blind and disabled recipients: 19
- Number of recipients under 18: 3
- Number of recipients between 18 and 64: 12
- Number of recipients older than 64: 12
- Number of recipients also receiving OASDI: 14
- Amount of payments (thousands of dollars): 10
| Most common first names in Terrell County, TX among deceased individuals | ||
| Name | Count | Lived (average) |
|---|---|---|
| Jose | 7 | 76.0 years |
| Maria | 6 | 81.9 years |
| Mary | 6 | 88.0 years |
| William | 5 | 74.6 years |
| Robert | 5 | 76.8 years |
| Manuel | 4 | 86.5 years |
| Francisco | 4 | 70.3 years |
| Frank | 4 | 70.5 years |
| Emma | 4 | 80.5 years |
| Francisca | 4 | 82.7 years |
| Most common last names in Terrell County, TX among deceased individuals | ||
| Last name | Count | Lived (average) |
|---|---|---|
| Flores | 8 | 73.7 years |
| Lopez | 8 | 72.6 years |
| Rodriguez | 8 | 76.9 years |
| Villarreal | 7 | 63.0 years |
| Garcia | 6 | 80.3 years |
| Mitchell | 6 | 74.7 years |
| Calzada | 4 | 80.5 years |
| Grigsby | 4 | 76.0 years |
| Bustos | 4 | 71.3 years |
| Garza | 4 | 76.7 years |
Terrell County on our top lists:
- #55 on the list of "Top 101 counties with the highest percentage of residents relocating to other counties in 2011"