Taylor County, Georgia (GA)
County owner-occupied free and clear houses and condos in 2010: 1,313
County owner-occupied houses and condos in 2000: 2,520
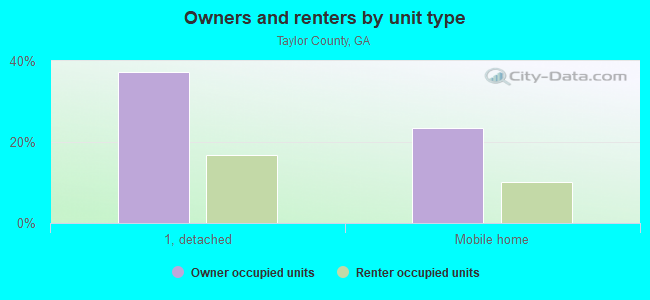
Renter-occupied apartments: 1,037 (it was 761 in 2000)
| % of renters here: | 23% |
| State: | 34% |
Land area: 377 sq. mi.
Water area: 2.2 sq. mi.
Population density: 21 people per square mile (low).
Industries providing employment: Educational, health and social services (21.4%), Manufacturing (15.4%).
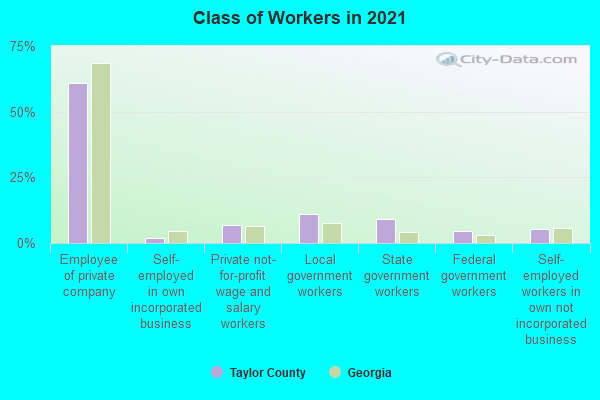
Type of workers:
- Private wage or salary: 74%
- Government: 21%
- Self-employed, not incorporated: 5%
- Unpaid family work: 0%
- OSM Map
- General Map
- Google Map
- MSN Map

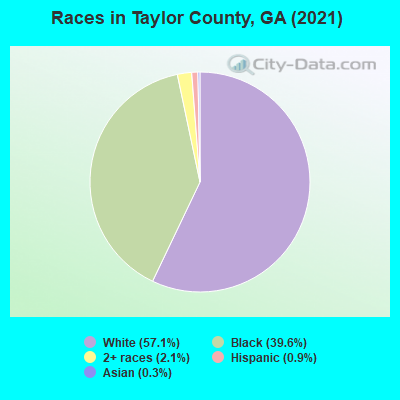
- 4,49957.3%White Non-Hispanic Alone
- 3,01338.4%Black Non-Hispanic Alone
- 2032.6%Two or more races
- 720.9%Asian alone
- 560.7%Hispanic or Latino
- 30.04%American Indian and Alaska Native alone
| Median resident age: | 43.7 years |
| Georgia median age: | 37.6 years |
| Males: 3,797 | |
| Females: 4,140 |

 | Taylor County (0 replies) |
| Georgia House passes Interstate 14 resolution (36 replies) |
| The dangers of a White Mayor of Atlanta by CBS News Atlanta (Article) (58 replies) |
| Coastal region disasters: Will they affect metro Atlanta's economy? (47 replies) |
| Georgia tornado count by county (1950-2018) (1 reply) |
| Thoughts on Fort Valley, GA??? (3 replies) |
| Taylor County: | 2.0 people |
| Georgia: | 3 people |
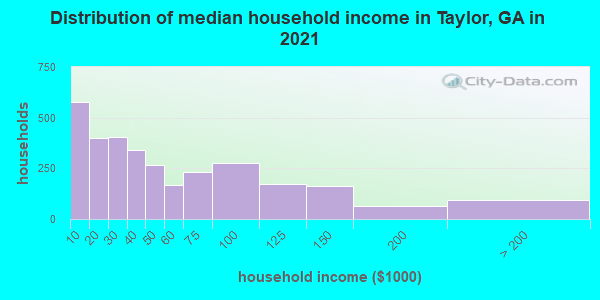
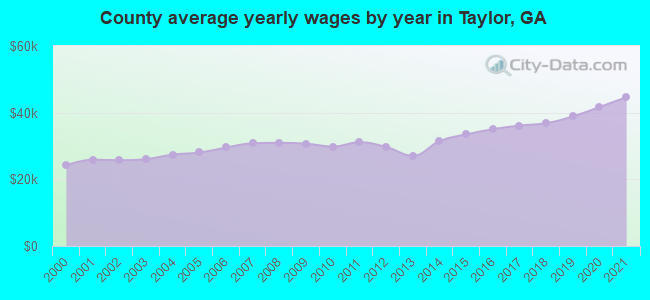
Estimated median household income in 2022: $41,572 ($25,148 in 1999)
| This county: | $41,572 |
| Georgia: | $72,837 |
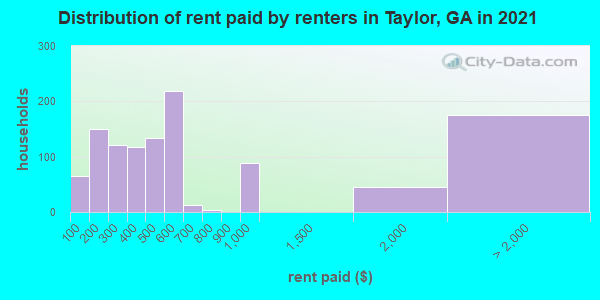
Median contract rent in 2022 for apartments: $435
| This county: | $435 |
| State: | $1065 |
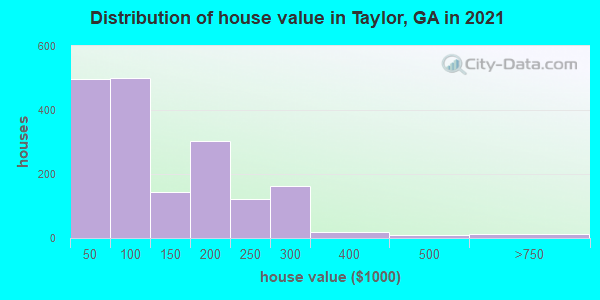
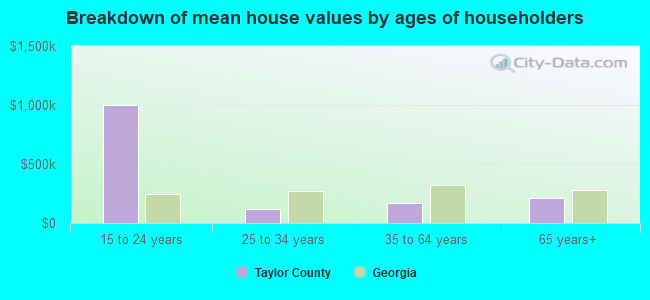
Estimated median house or condo value in 2022: $108,970 (it was $48,900 in 2000)
| Taylor: | $108,970 |
| Georgia: | $297,400 |
Mean price in 2022:
Median monthly housing costs for homes and condos with a mortgage: $1,036Detached houses: $186,077
Here: $186,077 State: $376,364 Mobile homes: $81,547
Here: $81,547 State: $102,413
Median monthly housing costs for units without a mortgage: $478
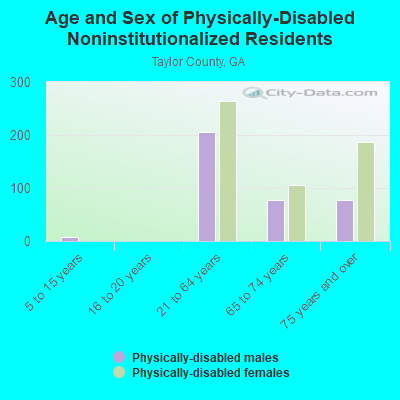
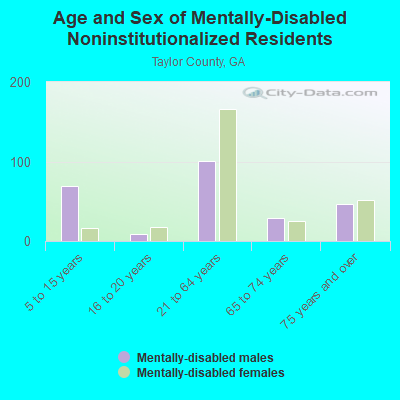
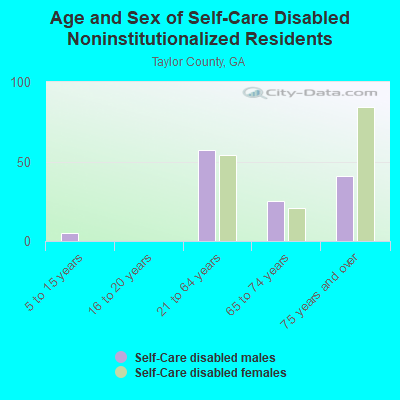
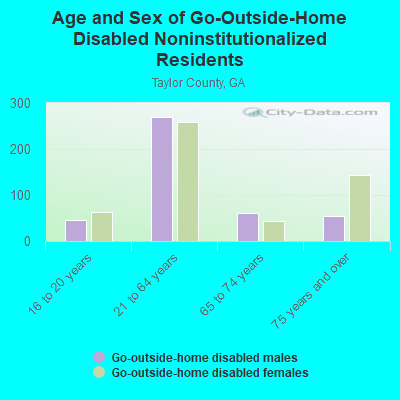
Institutionalized population: 290
Crime in 2019 (reported by the sheriff's office or county police, not the county total):
- Murders: 0
- Rapes: 1
- Robberies: 0
- Assaults: 5
- Burglaries: 14
- Thefts: 24
- Auto thefts: 2
Crime in 2018 (reported by the sheriff's office or county police, not the county total):
- Murders: 0
- Rapes: 0
- Robberies: 0
- Assaults: 7
- Burglaries: 21
- Thefts: 24
- Auto thefts: 2
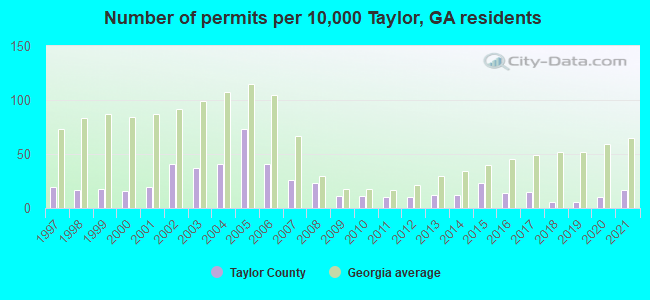
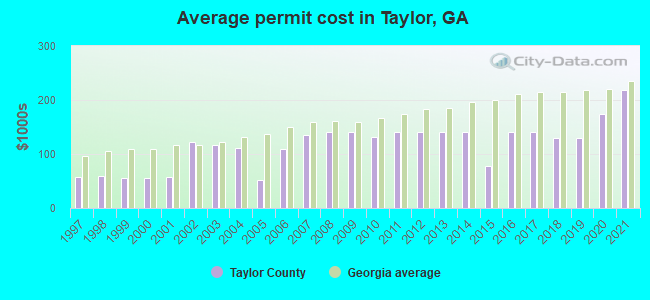
Single-family new house construction building permits:
- 2022: 19 buildings, average cost: $240,900
- 2021: 15 buildings, average cost: $217,500
- 2020: 9 buildings, average cost: $175,400
- 2019: 5 buildings, average cost: $130,000
- 2018: 5 buildings, average cost: $130,000
- 2017: 13 buildings, average cost: $140,700
- 2016: 12 buildings, average cost: $140,700
- 2015: 20 buildings, average cost: $76,600
- 2014: 11 buildings, average cost: $140,700
- 2013: 11 buildings, average cost: $140,700
- 2012: 9 buildings, average cost: $140,700
- 2011: 9 buildings, average cost: $140,700
- 2010: 10 buildings, average cost: $130,600
- 2009: 10 buildings, average cost: $140,700
- 2008: 20 buildings, average cost: $140,200
- 2007: 23 buildings, average cost: $135,700
- 2006: 36 buildings, average cost: $108,500
- 2005: 64 buildings, average cost: $52,200
- 2004: 36 buildings, average cost: $112,200
- 2003: 33 buildings, average cost: $116,800
- 2002: 36 buildings, average cost: $122,400
- 2001: 17 buildings, average cost: $57,500
- 2000: 14 buildings, average cost: $55,800
- 1999: 16 buildings, average cost: $55,500
- 1998: 15 buildings, average cost: $59,400
- 1997: 17 buildings, average cost: $58,100
Median real estate property taxes paid for housing units with mortgages in 2022: $1,172 (0.7%)
Median real estate property taxes paid for housing units with no mortgage in 2022: $605 (0.7%)
| Taylor County: | 27.1% |
| Georgia: | 12.7% |
Median age of residents in 2022: 43.7 years old
(Males: 41.6 years old, Females: 47.1 years old)
(Median age for: White residents: 48.0 years old, Black residents: 38.5 years old, Asian residents: 29.6 years old, Hispanic or Latino residents: 13.0 years old)
Fair market rent in 2006 for a 1-bedroom apartment in Taylor County is $393 a month.
Fair market rent for a 2-bedroom apartment is $458 a month.
Fair market rent for a 3-bedroom apartment is $578 a month.
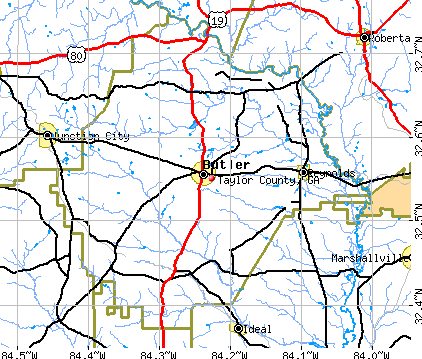
Cities in this county include: Butler, Carsonville-Panhandle, Reynolds, Rupert, Howard.
Notable locations in this county outside city limits:
Reservoir: Bartletts Ferry Lake (A). Display/hide its location on the map
Neighboring counties: Chambers County, Alabama  , Luna County, New Mexico
  , Greene County, Alabama , Perry County, Alabama , Warren County, Mississippi , Treutlen County
  .
.
| Here: | 3.6% |
| Georgia: | 2.9% |
Current college students: 256
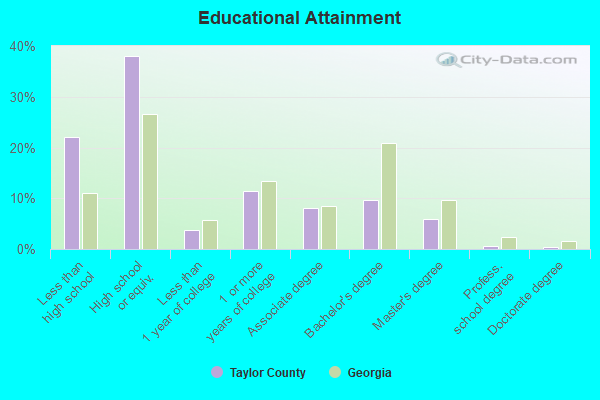
People 25 years of age or older with a high school degree or higher: 74.0%
People 25 years of age or older with a bachelor's degree or higher: 16.3%
Number of foreign born residents: 125 (48.1% naturalized citizens)
| Taylor County: | 1.6% |
| Whole state: | 10.7% |
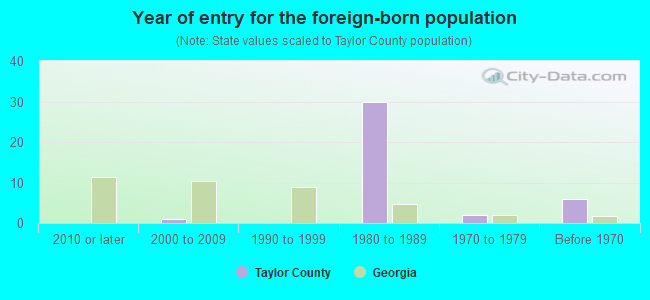
- Year of entry for the foreign-born population
- 732010 or later
- 12000 to 2009
- 291990 to 1999
- 301980 to 1989
- 21970 to 1979
- 6Before 1970
Mean travel time to work (commute): minutes
Percentage of county residents living and working in this county: 98.2%
Housing units in structures:
- One, detached: 2,297
- One, attached: 6
- Two: 117
- 3 or 4: 76
- 5 to 9: 84
- 20 to 49: 30
- 50 or more: 4
- Mobile homes: 1,414
Housing units in Taylor County with a mortgage: 839 (24 second mortgage, 0 home equity loan, 25 both second mortgage and home equity loan)
Houses without a mortgage: 14
| Here: | 98.4% with mortgage |
| State: | 98.2% with mortgage |
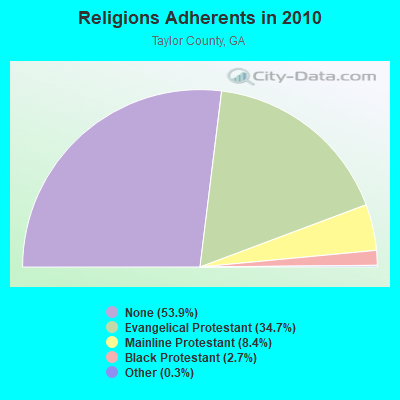
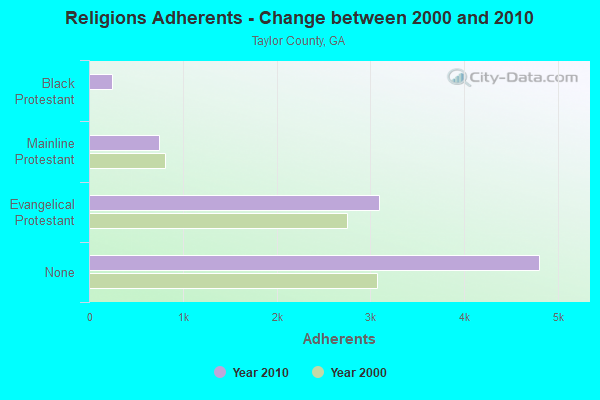
Religion statistics for Taylor County
| Religion | Adherents | Congregations |
|---|---|---|
| Evangelical Protestant | 3,087 | 16 |
| Mainline Protestant | 744 | 10 |
| Black Protestant | 243 | 3 |
| Other | 30 | - |
| None | 4,802 | - |
Source: Clifford Grammich, Kirk Hadaway, Richard Houseal, Dale E.Jones, Alexei Krindatch, Richie Stanley and Richard H.Taylor. 2012. 2010 U.S.Religion Census: Religious Congregations & Membership Study. Association of Statisticians of American Religious Bodies. Jones, Dale E., et al. 2002. Congregations and Membership in the United States 2000. Nashville, TN: Glenmary Research Center.
Food Environment Statistics:
| Taylor County: | 5.74 / 10,000 pop. |
| State: | 1.91 / 10,000 pop. |
| This county: | 1.15 / 10,000 pop. |
| Georgia: | 0.86 / 10,000 pop. |
| Taylor County: | 4.59 / 10,000 pop. |
| Georgia: | 5.12 / 10,000 pop. |
| This county: | 3.45 / 10,000 pop. |
| State: | 7.41 / 10,000 pop. |
| Taylor County: | 14.1% |
| Georgia: | 10.4% |
| Taylor County: | 30.9% |
| State: | 27.8% |
| Here: | 14.6% |
| State: | 14.6% |
Agriculture in Taylor County:
Average size of farms: 328 acresAverage value of agricultural products sold per farm: $107,681
Average value of crops sold per acre for harvested cropland: $527.41
The value of nursery, greenhouse, floriculture, and sod as a percentage of the total market value of agricultural products sold: 1.46%
The value of livestock, poultry, and their products as a percentage of the total market value of agricultural products sold: 57.83%
Average total farm production expenses per farm: $81,940
Harvested cropland as a percentage of land in farms: 26.23%
Average market value of all machinery and equipment per farm: $49,987
The percentage of farms operated by a family or individual: 91.63%
Average age of principal farm operators: 56 years
Average number of cattle and calves per 100 acres of all land in farms: 8.59
Corn for grain: 508 harvested acres
All wheat for grain: 710 harvested acres
Upland cotton: 5885 harvested acres
Soybeans for beans: 578 harvested acres
Vegetables: 873 harvested acres
Earthquake activity:
Taylor County-area historical earthquake activity is significantly above Georgia state average. It is 17% greater than the overall U.S. average.On 8/2/1974 at 08:52:09, a magnitude 4.9 (4.3 MB, 4.9 LG, Class: Light, Intensity: IV - V) earthquake occurred 136.0 miles away from Taylor County center
On 4/29/2003 at 08:59:39, a magnitude 4.9 (4.4 MB, 4.6 MW, 4.9 LG) earthquake occurred 156.9 miles away from the county center
On 10/24/1997 at 08:35:17, a magnitude 4.9 (4.8 MB, 4.2 MS, 4.9 LG, Depth: 6.2 mi) earthquake occurred 204.3 miles away from the county center
On 1/18/1999 at 07:00:53, a magnitude 4.8 (4.8 MB, 4.0 LG, Depth: 0.6 mi) earthquake occurred 185.4 miles away from the county center
On 4/29/2003 at 08:59:39, a magnitude 4.6 (4.6 MW, Depth: 12.3 mi) earthquake occurred 156.9 miles away from Taylor County center
On 11/30/1973 at 07:48:41, a magnitude 4.7 (4.7 MB, 4.6 ML) earthquake occurred 225.2 miles away from the county center
Magnitude types: regional Lg-wave magnitude (LG), body-wave magnitude (MB), local magnitude (ML), surface-wave magnitude (MS), moment magnitude (MW)
Most recent natural disasters:
- Georgia Covid-19 Pandemic, Incident Period: January 20, 2020, FEMA Id: 4501, Natural disaster type: Other
- Georgia Severe Storms and Flooding, Incident Period: December 22, 2015 to January 13, 2016, Major Disaster (Presidential) Declared DR-4259: February 26, 2016, FEMA Id: 4259, Natural disaster type: Storm, Flood
- Georgia Severe Storms and Flooding, Incident Period: September 18, 2009 to October 08, 2009, Major Disaster (Presidential) Declared DR-1858: September 24, 2009, FEMA Id: 1858, Natural disaster type: Storm, Flood
- Georgia Severe Storms and Tornadoes, Incident Period: March 01, 2007 to March 02, 2007, Major Disaster (Presidential) Declared DR-1686: March 03, 2007, FEMA Id: 1686, Natural disaster type: Storm, Tornado
- Georgia Hurricane Katrina Evacuation, Incident Period: August 27, 2005 to October 01, 2005, Emergency Declared EM-3218: September 05, 2005, FEMA Id: 3218, Natural disaster type: Hurricane
- Georgia Tropical Storm Frances, Incident Period: September 03, 2004 to October 30, 2004, Major Disaster (Presidential) Declared DR-1560: September 24, 2004, FEMA Id: 1560, Natural disaster type: Tropical Storm
- Georgia Tornadoes, Flooding, Heavy Rain, Tropical Storm Alberto, Incident Period: July 03, 1994 to July 25, 1994, Major Disaster (Presidential) Declared DR-1033: July 07, 1994, FEMA Id: 1033, Natural disaster type: Tropical Storm, Tornado, Flood, Heavy Rain
- Georgia Drought, Incident Period: July 20, 1977, Emergency Declared EM-3044: July 20, 1977, FEMA Id: 3044, Natural disaster type: Drought
- Georgia FLOODING, Incident Period: March 14, 1966, Major Disaster (Presidential) Declared DR-214: March 14, 1966, FEMA Id: 214, Natural disaster type: Flood
The number of natural disasters in Taylor County (9) is smaller than the US average (15).
Major Disasters (Presidential) Declared: 6
Emergencies Declared: 2
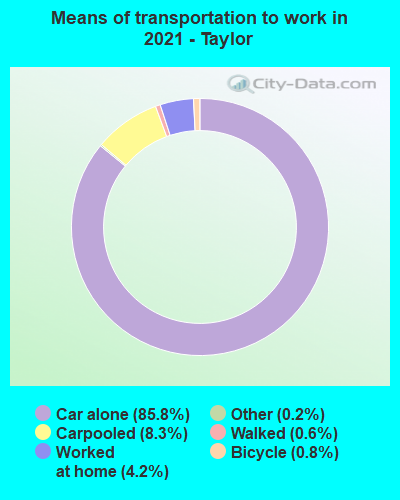
Means of transportation to work:
- Drove a car alone: 1,498 (78.3%)
- Carpooled: 165 (8.6%)
- Taxicab, motorcycle, or other means: 12 (0.6%)
- Bicycle: 14 (0.7%)
- Walked: 9 (0.5%)
- Worked at home: 181 (9.5%)
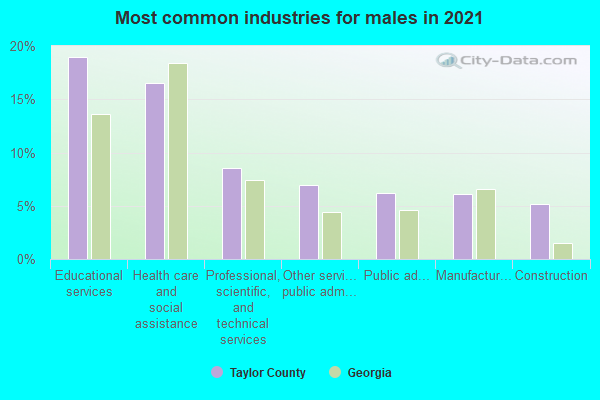
- Health care and social assistance (19%)
- Educational services (17%)
- Other services, except public administration (9%)
- Public administration (6%)
- Manufacturing (6%)
- Retail trade (6%)
- Professional, scientific, and technical services (4%)
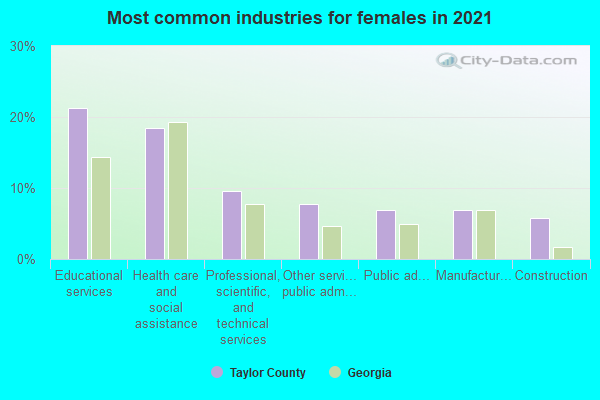
- Health care and social assistance (21%)
- Educational services (19%)
- Other services, except public administration (10%)
- Public administration (7%)
- Manufacturing (6%)
- Retail trade (6%)
- Professional, scientific, and technical services (5%)
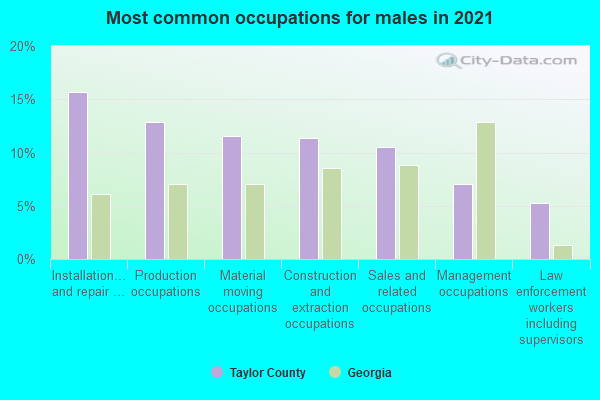
- Production occupations (14%)
- Installation, maintenance, and repair occupations (14%)
- Material moving occupations (13%)
- Construction and extraction occupations (12%)
- Sales and related occupations (12%)
- Management occupations (7%)
- Transportation occupations (5%)
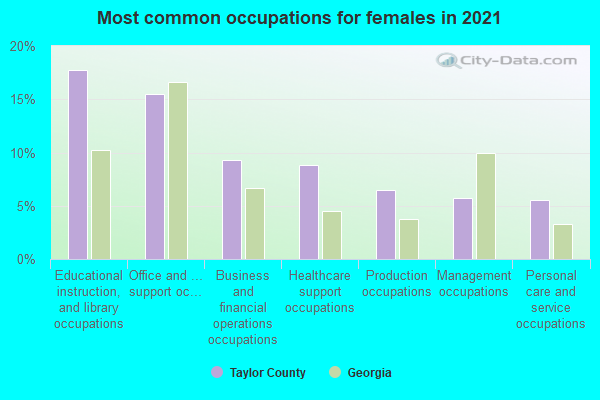
- Office and administrative support occupations (18%)
- Educational instruction, and library occupations (15%)
- Management occupations (7%)
- Business and financial operations occupations (7%)
- Personal care and service occupations (7%)
- Production occupations (7%)
- Healthcare support occupations (6%)
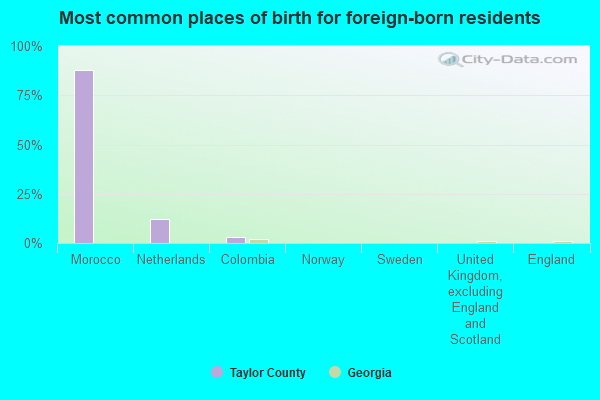
- Korea (26%)
- Morocco (18%)
- Japan (18%)
- France (10%)
- Czechoslovakia (includes Czech Republic and Slovakia) (6%)
- Argentina (5%)
- Netherlands (1%)
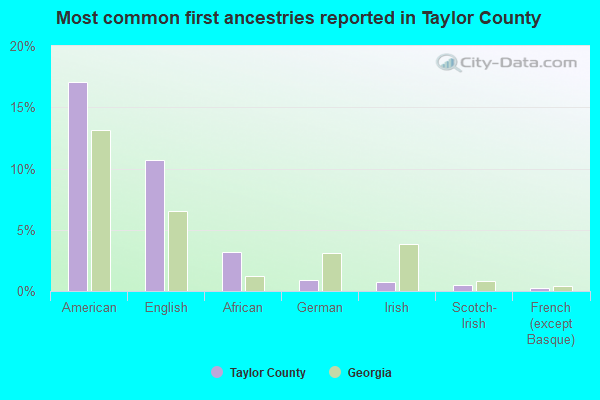
- American (15%)
- English (11%)
- German (2%)
- Irish (1%)
- African (1%)
- French (except Basque) (1%)
- Czech (0%)
People in group quarters in Taylor County, Georgia in 2010:
- 211 people in state prisons
- 37 people in residential treatment centers for juveniles (non-correctional)
- 32 people in residential treatment centers for adults
- 22 people in nursing facilities/skilled-nursing facilities
- 20 people in local jails and other municipal confinement facilities
People in group quarters in Taylor County, Georgia in 2000:
- 199 people in state prisons
- 71 people in nursing homes
- 64 people in agriculture workers' dormitories on farms
- 61 people in other group homes
- 14 people in other noninstitutional group quarters
- 9 people in local jails and other confinement facilities (including police lockups)
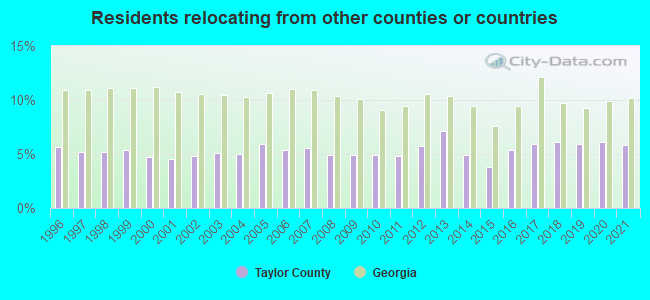
5.81% of this county's 2021 resident taxpayers lived in other counties in 2020 ($42,292 average adjusted gross income)
| Here: | 5.81% |
| Georgia average: | 10.21% |
10 or fewer of this county's residents moved from foreign countries.
4.68% relocated from other counties in Georgia ($35,364 average AGI)
1.13% relocated from other states ($6,929 average AGI)
Taylor County: 1.13% Georgia average: 3.80%
Top counties from which taxpayers relocated into this county between 2020 and 2021:
| from Houston County, GA |
5.38% of this county's 2020 resident taxpayers moved to other counties in 2021 ($35,500 average adjusted gross income)
| Here: | 5.38% |
| Georgia average: | 9.60% |
10 or fewer of this county's residents moved to foreign countries.
4.51% relocated to other counties in Georgia ($29,430 average AGI)
0.87% relocated to other states ($6,070 average AGI)
Taylor County: 0.87% Georgia average: 3.15%

Top counties to which taxpayers relocated from this county between 2020 and 2021:
| to Houston County, GA |
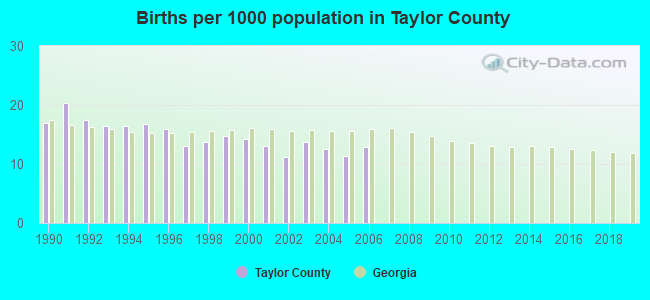
Births per 1000 population from 1990 to 1999: 16.2
Births per 1000 population from 2000 to 2006: 12.7
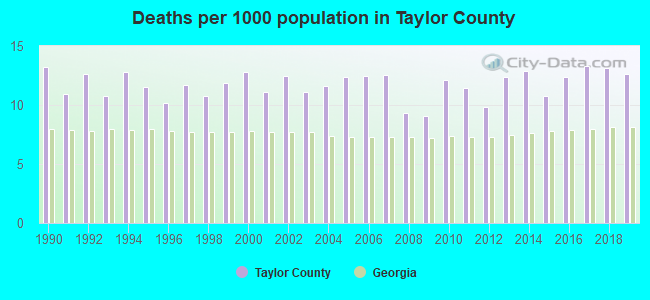
Deaths per 1000 population from 1990 to 1999: 11.6
Deaths per 1000 population from 2000 to 2009: 11.5
Deaths per 1000 population from 2010 to 2020: 12.3
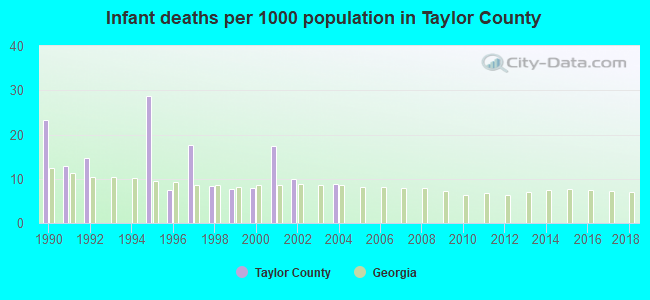
Infant deaths per 1000 live births from 1990 to 1999: 12.0
Infant deaths per 1000 live births from 2000 to 2006: 6.3
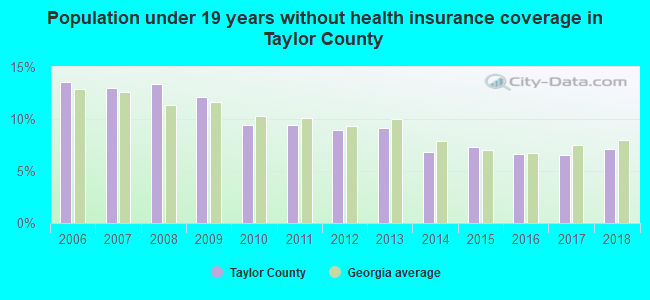
Persons under 19 years old without health insurance coverage in 2018: 7.1%
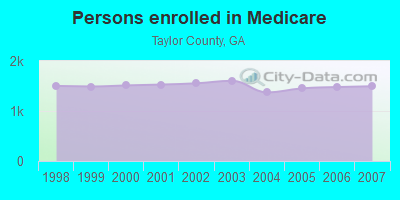
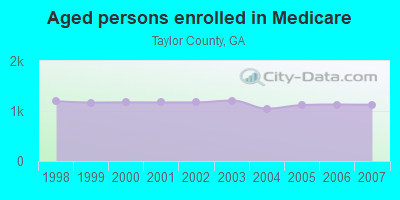
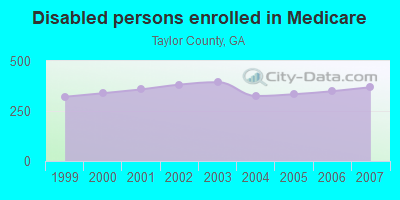
Persons enrolled in hospital insurance and/or supplemental medical insurance (Medicare) in July 1, 2007: 1,495 (1,126 aged, 369 disabled)
Children under 18 without health insurance coverage in 2007: 280 (12%)
Most common underlying causes of death in Taylor County, Georgia in 1999 - 2019:
- Acute myocardial infarction, unspecified (110)
- Bronchus or lung, unspecified - Malignant neoplasms (31)
- Unspecified diabetes mellitus, without complications (10)
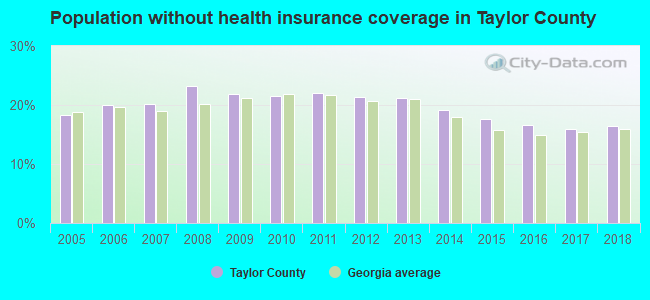
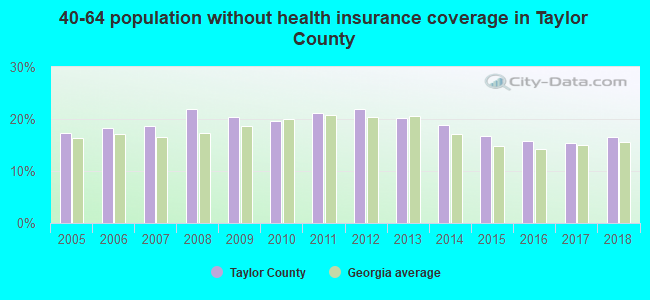
Population without health insurance coverage in 2000: 19%
Children under 18 without health insurance coverage in 2000: 16%
Medical specialist MDs per 100,000 population in 2005: 1,204
Total deaths per 100,000 population, July 2005 - July 2006: 56
Limited-service eating places per 100,000 population in 2005 : 11
Crimes per 100,000 population in 1996: 1
Household type by relationship:
Households: 7,937- Male householders: 1,482 (269 living alone), Female householders: 1,678 (672 living alone)
1,237 spouses (1,237 opposite-sex spouses), 161 unmarried partners, (136 opposite-sex unmarried partners), 2,247 children (2,063 natural, 145 adopted, 41 stepchildren), 320 grandchildren, 160 brothers or sisters, 76 parents, 13 foster children, 155 other relatives, 201 non-relatives
- In group quarters: 202
Size of family households: 923 2-persons, 425 3-persons, 469 4-persons, 102 5-persons, 97 6-persons, 29 7-or-more-persons.
Size of nonfamily households: 936 1-person, 151 2-persons, 16 4-persons.
810 married couples with children.
434 single-parent households (78 men, 356 women).
97.7% of residents of Taylor speak English at home.
0.5% of residents speak Spanish at home (100% speak English very well).
1.0% of residents speak other Indo-European language at home (54% speak English very well, 46% speak English not well).
0.8% of residents speak Asian or Pacific Island language at home (100% speak English very well).
In fiscal year 2004:
Federal Government expenditure: $63,082,000 ($7,021 per capita)
Department of Defense expenditure: $1,687,000
Federal direct payments to individuals for retirement and disability: $26,826,000
Federal other direct payments to individuals: $13,148,000
Federal direct payments not to individuals: $1,353,000
Federal grants: $20,067,000
Federal procurement contracts: $494,000 ($179,000 Department of Defense)
Federal salaries and wages: $1,194,000 ($0,000 Department of Defense)
Federal Government direct loans: $295,000
Federal guaranteed/insured loans: $2,947,000
Federal Government insurance: $3,641,000
Population change from April 1, 2000 to July 1, 2005:
Births: 642| Here: | 72 per 1000 residents |
| State: | 79 per 1000 residents |
Deaths: 563
| Here: | 63 per 1000 residents |
| State: | 38 per 1000 residents |
Net international migration: +21
| Here: | +2 per 1000 residents |
| State: | +21 per 1000 residents |
Net internal migration: -14
| Here: | |
| State: |
Total withdrawal of fresh water for public supply: 0.78 millions of gallons per day (all from ground)
| Here: | 6.4 |
| State: | 6.8 |
| Here: | 4.9 |
| State: | 4.6 |
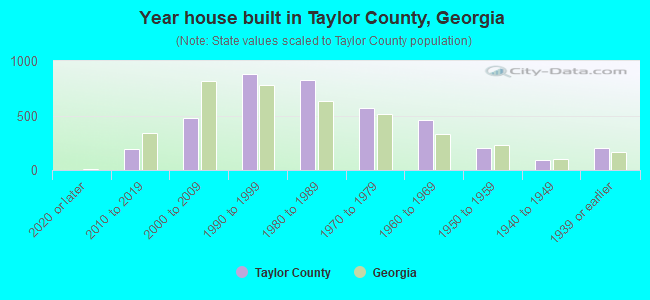
- Year house built in Taylor County, Georgia
- 82020 or later
- 1282010 to 2019
- 5362000 to 2009
- 9171990 to 1999
- 7341980 to 1989
- 5481970 to 1979
- 4951960 to 1969
- 1981950 to 1959
- 1161940 to 1949
- 1641939 or earlier
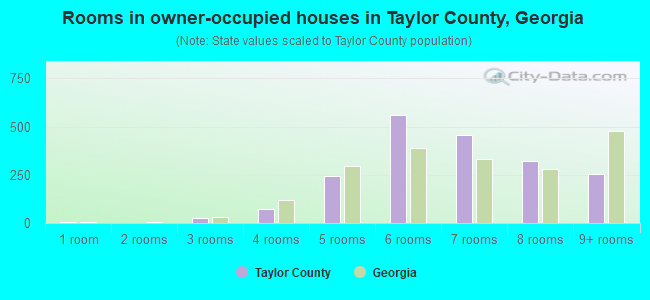
- Rooms in owner-occupied houses in Taylor County, Georgia
- 101 room
- 02 rooms
- 133 rooms
- 1614 rooms
- 3065 rooms
- 5856 rooms
- 3557 rooms
- 2998 rooms
- 2579+ rooms
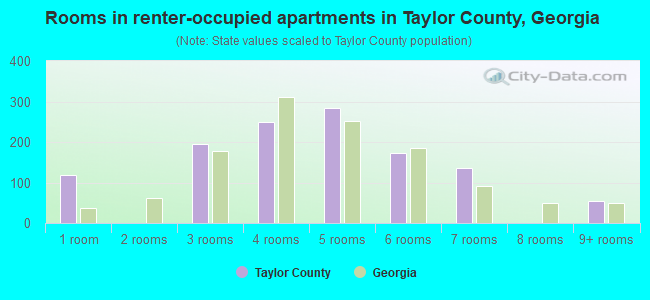
- Rooms in renter-occupied apartments in Taylor County, Georgia
- 1301 room
- 12 rooms
- 1063 rooms
- 2094 rooms
- 3025 rooms
- 1956 rooms
- 1257 rooms
- 68 rooms
- 619+ rooms
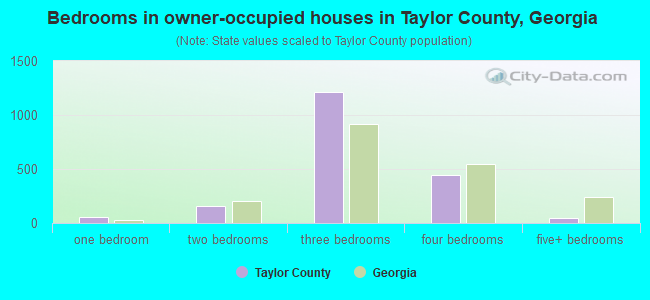
- Bedrooms in owner-occupied houses in Taylor County, Georgia
- 10no bedroom
- 701 bedroom
- 1582 bedrooms
- 1,2743 bedrooms
- 4384 bedrooms
- 295+ bedrooms
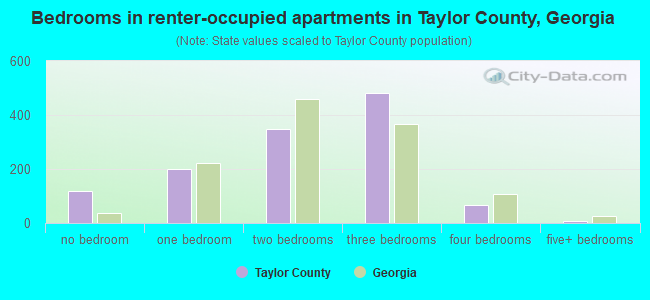
- Bedrooms in renter-occupied apartments in Taylor County, Georgia
- 133no bedroom
- 941 bedroom
- 3172 bedrooms
- 5283 bedrooms
- 814 bedrooms
- 55+ bedrooms
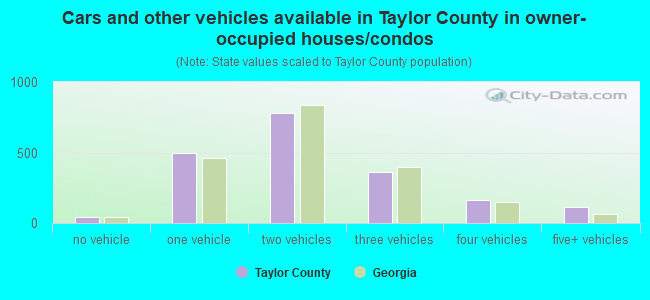
- Cars and other vehicles available in Taylor County in owner-occupied houses/condos
- 85no vehicle
- 4911 vehicle
- 7102 vehicles
- 3493 vehicles
- 2494 vehicles
- 1125+ vehicles
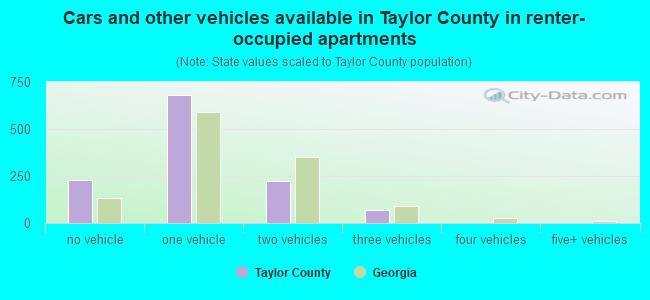
- Cars and other vehicles available in Taylor County in renter-occupied apartments
- 221no vehicle
- 6411 vehicle
- 1982 vehicles
- 943 vehicles
- 04 vehicles
- 05+ vehicles
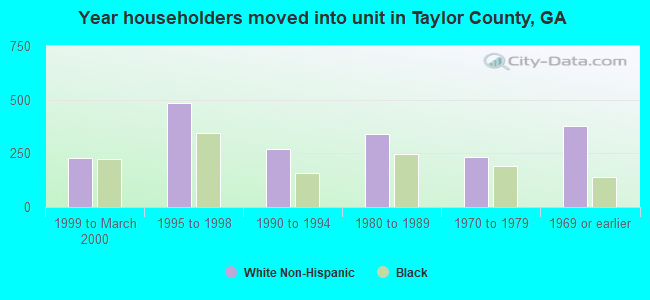
95.1% of Taylor County residents lived in the same house 1 years ago.
Out of people who lived in different houses, 18% lived in this county.
Out of people who lived in different counties, 47% lived in Georgia.
| Taylor County: | 95.1% |
| State average: | 86.6% |
Place of birth for U.S.-born residents:
- This state: 6,954
- Other state: 731
- Northeast: 67
- Midwest: 305
- South: 317
- West: 41
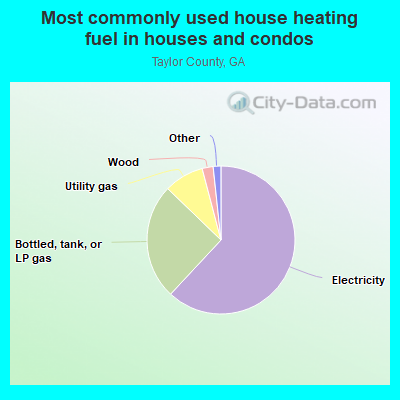
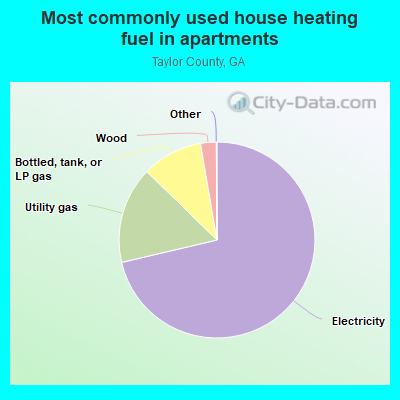
- 62.5%Electricity
- 27.2%Bottled, tank, or LP gas
- 6.1%Utility gas
- 2.1%Wood
- 1.6%Other fuel
- 0.5%No fuel used
- 81.8%Electricity
- 13.3%Bottled, tank, or LP gas
- 3.3%Utility gas
- 1.2%Wood
- 0.4%No fuel used
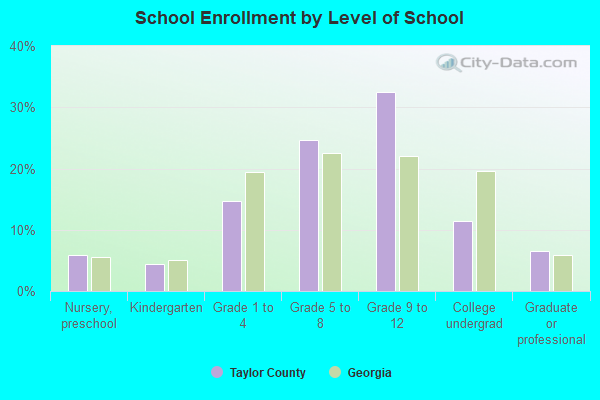
Private vs. public school enrollment:
| Here: | 3.6% |
| Georgia: | 12.1% |
| Here: | 5.4% |
| Georgia: | 10.8% |
| Here: | 2.0% |
| Georgia: | 17.1% |
Taylor County government finances - Expenditure in 2017:
- Charges - Other: $939,000
Parks and Recreation: $129,000
Air Transportation: $50,000
Sewerage: $6,000
- Construction - Regular Highways: $302,000
Air Transportation: $178,000
General Public Buildings: $9,000
- Current Operations - Regular Highways: $929,000
Police Protection: $786,000
Financial Administration: $686,000
Correctional Institutions: $650,000
Health - Other: $577,000
General - Other: $505,000
Judicial and Legal Services: $453,000
Solid Waste Management: $287,000
Local Fire Protection: $269,000
General Public Buildings: $266,000
Air Transportation: $169,000
Parks and Recreation: $153,000
Central Staff Services: $129,000
Natural Resources - Other: $83,000
Public Welfare - Other: $27,000
Libraries: $24,000
- General - Interest on Debt: $7,000
- Intergovernmental to Local - Other - General - Other: $249,000
- Local Intergovernmental - Other: $249,000
- Long Term Debt - Beginning Outstanding - Unspecified Public Purpose: $191,000
Retired Unspecified Public Purpose: $139,000
Outstanding Unspecified Public Purpose: $51,000
- Miscellaneous - General Revenue - Other: $214,000
Rents: $46,000
Sale of Property: $25,000
Interest Earnings: $3,000
- Other Capital Outlay - Regular Highways: $361,000
Solid Waste Management: $247,000
General - Other: $49,000
Parks and Recreation: $13,000
Health - Other: $7,000
- Other Funds - Cash and Securities: $6,695,000
- Revenue - Transit Utilities: $223,000
Water Utilities: $9,000
- State Intergovernmental - Other: $1,110,000
Housing and Community Development: $413,000
Health and Hospitals: $12,000
General Local Government Support: $4,000
- Tax - Property: $2,242,000
General Sales and Gross Receipts: $1,831,000
Insurance Premiums Sales: $326,000
Alcoholic Beverage Sales: $33,000
Other License: $17,000
Other: $11,000
Occupation and Business License - Other: $10,000
Public Utilities Sales: $3,000
Alcoholic Beverage License: $2,000
Taylor County government finances - Revenue in 2017:
- Charges - Other: $939,000
Parks and Recreation: $129,000
Air Transportation: $50,000
Sewerage: $6,000
- Construction - Regular Highways: $302,000
Air Transportation: $178,000
General Public Buildings: $9,000
- Current Operations - Regular Highways: $929,000
Police Protection: $786,000
Financial Administration: $686,000
Correctional Institutions: $650,000
Health - Other: $577,000
General - Other: $505,000
Judicial and Legal Services: $453,000
Solid Waste Management: $287,000
Local Fire Protection: $269,000
General Public Buildings: $266,000
Air Transportation: $169,000
Parks and Recreation: $153,000
Central Staff Services: $129,000
Natural Resources - Other: $83,000
Public Welfare - Other: $27,000
Libraries: $24,000
- General - Interest on Debt: $7,000
- Intergovernmental to Local - Other - General - Other: $249,000
- Local Intergovernmental - Other: $249,000
- Long Term Debt - Beginning Outstanding - Unspecified Public Purpose: $191,000
Retired Unspecified Public Purpose: $139,000
Outstanding Unspecified Public Purpose: $51,000
- Miscellaneous - General Revenue - Other: $214,000
Rents: $46,000
Sale of Property: $25,000
Interest Earnings: $3,000
- Other Capital Outlay - Regular Highways: $361,000
Solid Waste Management: $247,000
General - Other: $49,000
Parks and Recreation: $13,000
Health - Other: $7,000
- Other Funds - Cash and Securities: $6,695,000
- Revenue - Transit Utilities: $223,000
Water Utilities: $9,000
- State Intergovernmental - Other: $1,110,000
Housing and Community Development: $413,000
Health and Hospitals: $12,000
General Local Government Support: $4,000
- Tax - Property: $2,242,000
General Sales and Gross Receipts: $1,831,000
Insurance Premiums Sales: $326,000
Alcoholic Beverage Sales: $33,000
Other License: $17,000
Other: $11,000
Occupation and Business License - Other: $10,000
Public Utilities Sales: $3,000
Alcoholic Beverage License: $2,000
Taylor County government finances - Debt in 2017:
- Charges - Other: $939,000
Parks and Recreation: $129,000
Air Transportation: $50,000
Sewerage: $6,000
- Construction - Regular Highways: $302,000
Air Transportation: $178,000
General Public Buildings: $9,000
- Current Operations - Regular Highways: $929,000
Police Protection: $786,000
Financial Administration: $686,000
Correctional Institutions: $650,000
Health - Other: $577,000
General - Other: $505,000
Judicial and Legal Services: $453,000
Solid Waste Management: $287,000
Local Fire Protection: $269,000
General Public Buildings: $266,000
Air Transportation: $169,000
Parks and Recreation: $153,000
Central Staff Services: $129,000
Natural Resources - Other: $83,000
Public Welfare - Other: $27,000
Libraries: $24,000
- General - Interest on Debt: $7,000
- Intergovernmental to Local - Other - General - Other: $249,000
- Local Intergovernmental - Other: $249,000
- Long Term Debt - Beginning Outstanding - Unspecified Public Purpose: $191,000
Retired Unspecified Public Purpose: $139,000
Outstanding Unspecified Public Purpose: $51,000
- Miscellaneous - General Revenue - Other: $214,000
Rents: $46,000
Sale of Property: $25,000
Interest Earnings: $3,000
- Other Capital Outlay - Regular Highways: $361,000
Solid Waste Management: $247,000
General - Other: $49,000
Parks and Recreation: $13,000
Health - Other: $7,000
- Other Funds - Cash and Securities: $6,695,000
- Revenue - Transit Utilities: $223,000
Water Utilities: $9,000
- State Intergovernmental - Other: $1,110,000
Housing and Community Development: $413,000
Health and Hospitals: $12,000
General Local Government Support: $4,000
- Tax - Property: $2,242,000
General Sales and Gross Receipts: $1,831,000
Insurance Premiums Sales: $326,000
Alcoholic Beverage Sales: $33,000
Other License: $17,000
Other: $11,000
Occupation and Business License - Other: $10,000
Public Utilities Sales: $3,000
Alcoholic Beverage License: $2,000
Taylor County government finances - Cash and Securities in 2017:
- Charges - Other: $939,000
Parks and Recreation: $129,000
Air Transportation: $50,000
Sewerage: $6,000
- Construction - Regular Highways: $302,000
Air Transportation: $178,000
General Public Buildings: $9,000
- Current Operations - Regular Highways: $929,000
Police Protection: $786,000
Financial Administration: $686,000
Correctional Institutions: $650,000
Health - Other: $577,000
General - Other: $505,000
Judicial and Legal Services: $453,000
Solid Waste Management: $287,000
Local Fire Protection: $269,000
General Public Buildings: $266,000
Air Transportation: $169,000
Parks and Recreation: $153,000
Central Staff Services: $129,000
Natural Resources - Other: $83,000
Public Welfare - Other: $27,000
Libraries: $24,000
- General - Interest on Debt: $7,000
- Intergovernmental to Local - Other - General - Other: $249,000
- Local Intergovernmental - Other: $249,000
- Long Term Debt - Beginning Outstanding - Unspecified Public Purpose: $191,000
Retired Unspecified Public Purpose: $139,000
Outstanding Unspecified Public Purpose: $51,000
- Miscellaneous - General Revenue - Other: $214,000
Rents: $46,000
Sale of Property: $25,000
Interest Earnings: $3,000
- Other Capital Outlay - Regular Highways: $361,000
Solid Waste Management: $247,000
General - Other: $49,000
Parks and Recreation: $13,000
Health - Other: $7,000
- Other Funds - Cash and Securities: $6,695,000
- Revenue - Transit Utilities: $223,000
Water Utilities: $9,000
- State Intergovernmental - Other: $1,110,000
Housing and Community Development: $413,000
Health and Hospitals: $12,000
General Local Government Support: $4,000
- Tax - Property: $2,242,000
General Sales and Gross Receipts: $1,831,000
Insurance Premiums Sales: $326,000
Alcoholic Beverage Sales: $33,000
Other License: $17,000
Other: $11,000
Occupation and Business License - Other: $10,000
Public Utilities Sales: $3,000
Alcoholic Beverage License: $2,000
Supplemental Security Income (SSI) in 2006:
- Total number of recipients: 491
- Number of aged recipients: 69
- Number of blind and disabled recipients: 422
- Number of recipients under 18: 50
- Number of recipients between 18 and 64: 310
- Number of recipients older than 64: 131
- Number of recipients also receiving OASDI: 187
- Amount of payments (thousands of dollars): 243
| Most common first names in Taylor County, GA among deceased individuals | ||
| Name | Count | Lived (average) |
|---|---|---|
| James | 98 | 68.9 years |
| John | 66 | 70.0 years |
| Mary | 64 | 77.2 years |
| Robert | 59 | 70.6 years |
| William | 58 | 73.0 years |
| Willie | 56 | 69.1 years |
| Annie | 32 | 79.6 years |
| Charlie | 31 | 71.8 years |
| Mattie | 29 | 78.8 years |
| George | 26 | 74.3 years |
| Most common last names in Taylor County, GA among deceased individuals | ||
| Last name | Count | Lived (average) |
|---|---|---|
| Wainwright | 39 | 68.6 years |
| Gray | 32 | 76.6 years |
| Windham | 30 | 78.0 years |
| Mccrary | 29 | 73.5 years |
| Hicks | 27 | 74.1 years |
| Harris | 26 | 74.8 years |
| Jones | 26 | 71.8 years |
| Wilson | 25 | 73.5 years |
| Wilder | 24 | 75.0 years |
| Towns | 24 | 70.6 years |
| Businesses in Taylor County, GA | ||||
| Name | Count | Name | Count | |
|---|---|---|---|---|
| FedEx | 1 | U-Haul | 1 | |
| Nike | 1 | UPS | 1 | |
| Subway | 2 | |||