Talbot County, Georgia (GA)
County owner-occupied free and clear houses and condos in 2010: 1,041
County owner-occupied houses and condos in 2000: 2,100
Renter-occupied apartments: 581 (it was 438 in 2000)
| % of renters here: | 17% |
| State: | 34% |
Land area: 393 sq. mi.
Water area: 1.5 sq. mi.
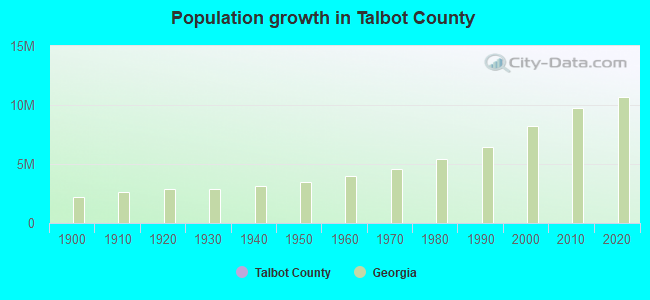
Population density: 15 people per square mile (low).
Industries providing employment: Educational, health and social services (30.8%), Manufacturing (15.4%).
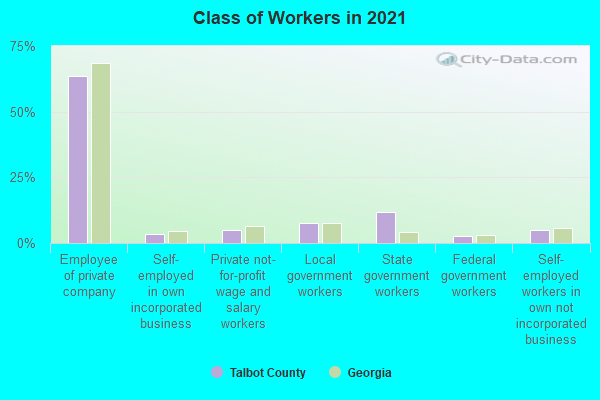
Type of workers:
- Private wage or salary: 72%
- Government: 23%
- Self-employed, not incorporated: 4%
- Unpaid family work: 0%
- OSM Map
- General Map
- Google Map
- MSN Map

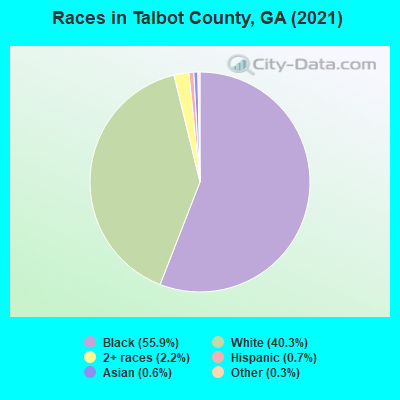
- 3,28956.4%Black Non-Hispanic Alone
- 2,33440.0%White Non-Hispanic Alone
- 1182.0%Two or more races
- 561.0%Hispanic or Latino
- 200.3%Some other race alone
- 90.2%Asian alone
- 30.05%American Indian and Alaska Native alone
| Median resident age: | 50.4 years |
| Georgia median age: | 37.6 years |
| Males: 2,844 | |
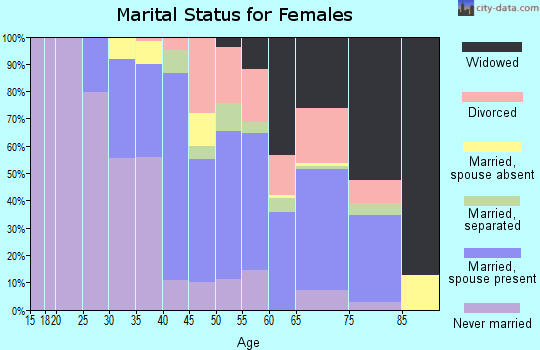
| Females: 3,051 |

 | As of 2021, what are your opinions on the 2nd and 3rd tier GA cities? (69 replies) |
| 2020 Census - Columbus 206,992 (17 replies) |
| Columbus area population grows. (32 replies) |
| Columbus metro see population growth. (0 replies) |
| Georgia tornado count by county (1950-2018) (1 reply) |
| Camping, Scouting, & Other Fun at Standing Boy State Park (2 replies) |
| Talbot County: | 2.0 people |
| Georgia: | 3 people |
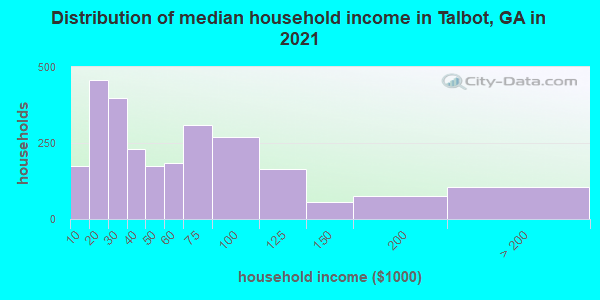
Estimated median household income in 2022: $49,063 ($26,611 in 1999)
| This county: | $49,063 |
| Georgia: | $72,837 |
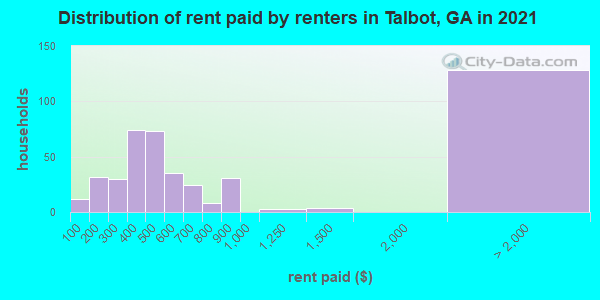
Median contract rent in 2022 for apartments: $477 (lower quartile is $346, upper quartile is $638)
| This county: | $477 |
| State: | $1065 |
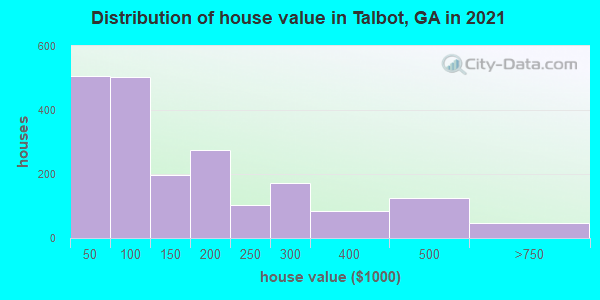
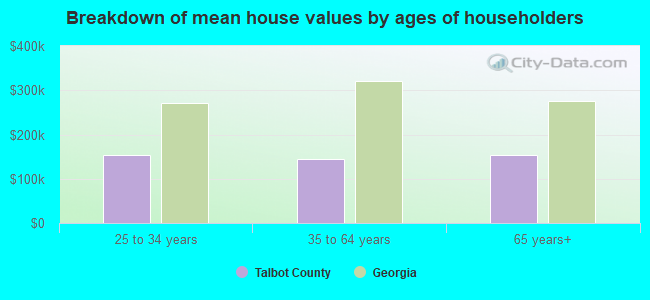
Estimated median house or condo value in 2022: $144,407 (it was $46,300 in 2000)
| Talbot: | $144,407 |
| Georgia: | $297,400 |
Mean price in 2022:
Median monthly housing costs for homes and condos with a mortgage: $1,240Detached houses: $241,130
Here: $241,130 State: $376,364 Townhouses or other attached units: $435,218
Here: $435,218 State: $341,709 Mobile homes: $106,119
Here: $106,119 State: $102,413
Median monthly housing costs for units without a mortgage: $463
Institutionalized population: 17
Crime in 2021 (reported by the sheriff's office or county police, not the county total):
- Murders: 0
- Rapes: 0
- Robberies: 0
- Assaults: 0
- Burglaries: 0
- Thefts: 3
- Auto thefts: 0
Crime in 2019 (reported by the sheriff's office or county police, not the county total):
- Murders: 0
- Rapes: 0
- Robberies: 0
- Assaults: 2
- Burglaries: 6
- Thefts: 9
- Auto thefts: 1
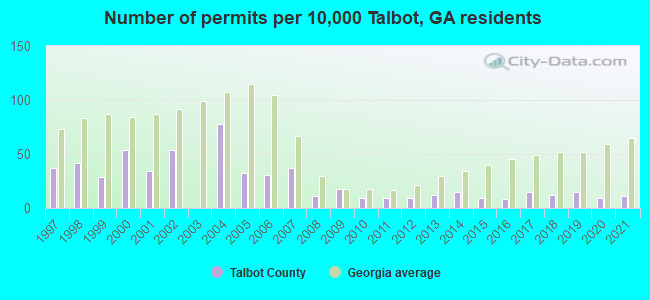
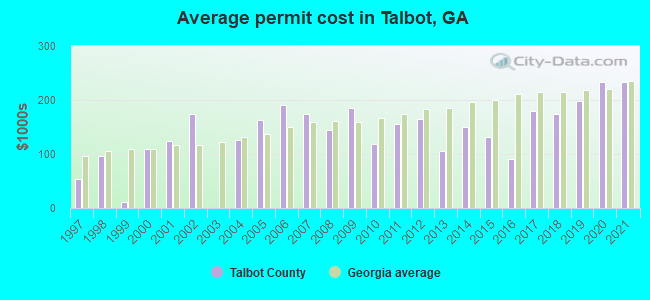
Single-family new house construction building permits:
- 2022: 3 buildings, average cost: $233,100
- 2021: 7 buildings, average cost: $233,100
- 2020: 6 buildings, average cost: $233,100
- 2019: 10 buildings, average cost: $198,000
- 2018: 8 buildings, average cost: $175,000
- 2017: 10 buildings, average cost: $178,500
- 2016: 5 buildings, average cost: $90,000
- 2015: 6 buildings, average cost: $132,000
- 2014: 10 buildings, average cost: $150,000
- 2013: 8 buildings, average cost: $105,000
- 2012: 6 buildings, average cost: $165,000
- 2011: 6 buildings, average cost: $155,000
- 2010: 6 buildings, average cost: $119,000
- 2009: 12 buildings, average cost: $186,000
- 2008: 7 buildings, average cost: $145,100
- 2007: 24 buildings, average cost: $175,000
- 2006: 20 buildings, average cost: $190,000
- 2005: 21 buildings, average cost: $163,000
- 2004: 51 buildings, average cost: $126,000
- 2003: 0 buildings
- 2002: 35 buildings, average cost: $175,200
- 2001: 22 buildings, average cost: $125,000
- 2000: 35 buildings, average cost: $109,000
- 1999: 19 buildings, average cost: $12,400
- 1998: 27 buildings, average cost: $95,700
- 1997: 24 buildings, average cost: $54,200
Median real estate property taxes paid for housing units with mortgages in 2022: $1,696 (0.9%)
Median real estate property taxes paid for housing units with no mortgage in 2022: $1,089 (1.2%)
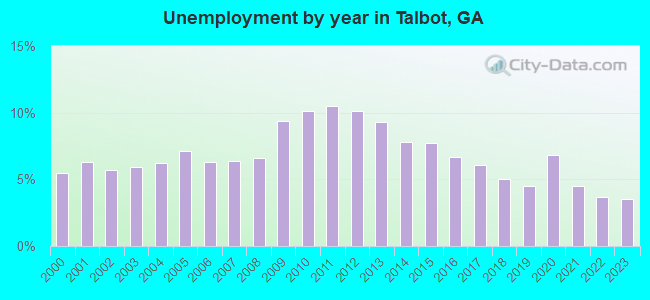
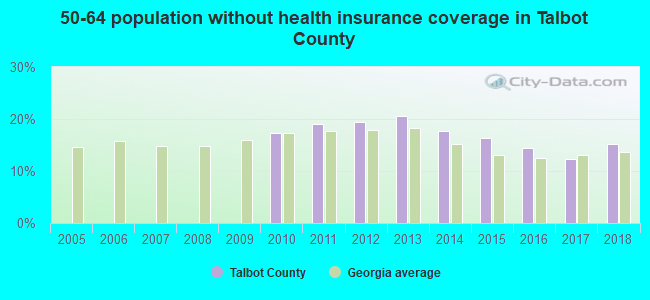
| Talbot County: | 17.2% |
| Georgia: | 12.7% |
Median age of residents in 2022: 50.4 years old
(Males: 48.4 years old, Females: 52.9 years old)
(Median age for: White residents: 56.0 years old, Black residents: 45.9 years old, Hispanic or Latino residents: 44.9 years old, Other race residents: 44.4 years old)
Fair market rent in 2006 for a 1-bedroom apartment in Talbot County is $439 a month.
Fair market rent for a 2-bedroom apartment is $529 a month.
Fair market rent for a 3-bedroom apartment is $652 a month.
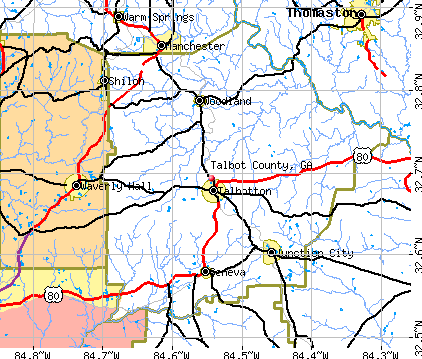
Cities in this county include: Talbotton, Woodland, Junction City, Geneva.
Neighboring counties: Bossier Parish, Louisiana  , Holmes County, Mississippi , Kemper County, Mississippi , Jefferson County
  , Johnson County .
| Here: | 2.8% |
| Georgia: | 2.9% |
Current college students: 178
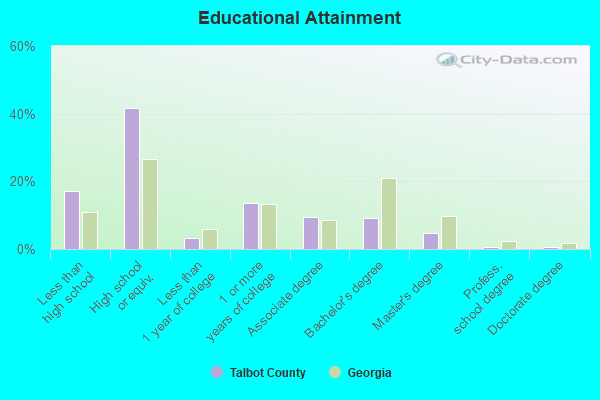
People 25 years of age or older with a high school degree or higher: 83.4%
People 25 years of age or older with a bachelor's degree or higher: 15.4%
Number of foreign born residents: 11 (105.0% naturalized citizens)
| Talbot County: | 0.2% |
| Whole state: | 10.7% |
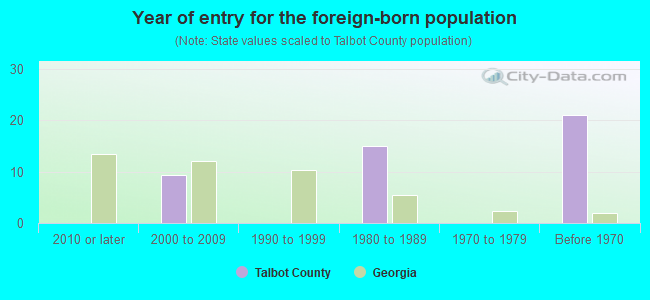
- Year of entry for the foreign-born population
- 02010 or later
- 02000 to 2009
- 01990 to 1999
- 151980 to 1989
- 01970 to 1979
- 21Before 1970
Mean travel time to work (commute): & minutes
Percentage of county residents living and working in this county: 98.5%

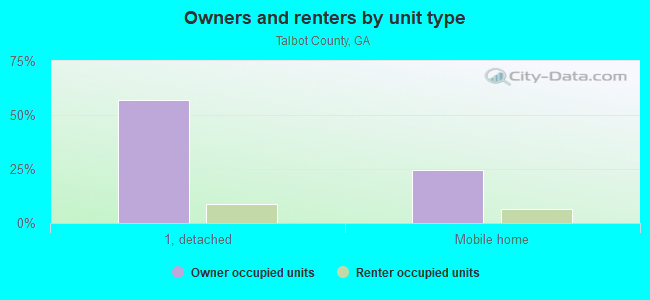
Housing units in structures:
- One, detached: 2,002
- One, attached: 21
- Two: 48
- 3 or 4: 6
- 5 to 9: 21
- 10 to 19: 20
- 20 or more: 10
- Mobile homes: 995
Housing units in Talbot County with a mortgage: 1,068 (54 second mortgage, 0 home equity loan, 36 both second mortgage and home equity loan)
Houses without a mortgage: 17
| Here: | 5.6% with mortgage |
| State: | 98.2% with mortgage |
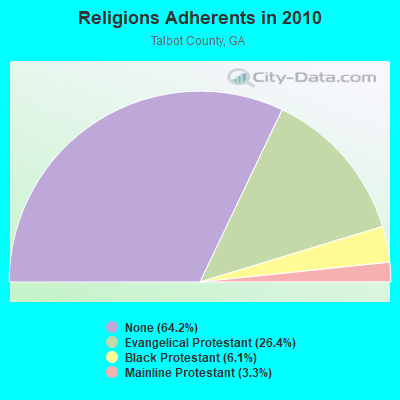
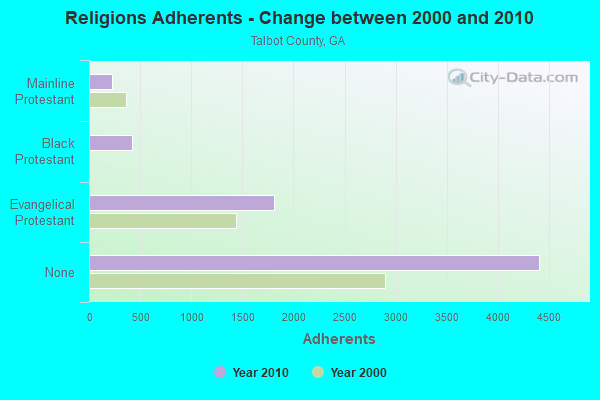
Religion statistics for Talbot County
| Religion | Adherents | Congregations |
|---|---|---|
| Evangelical Protestant | 1,813 | 11 |
| Black Protestant | 416 | 3 |
| Mainline Protestant | 226 | 7 |
| Other | 3 | - |
| None | 4,407 | - |
Source: Clifford Grammich, Kirk Hadaway, Richard Houseal, Dale E.Jones, Alexei Krindatch, Richie Stanley and Richard H.Taylor. 2012. 2010 U.S.Religion Census: Religious Congregations & Membership Study. Association of Statisticians of American Religious Bodies. Jones, Dale E., et al. 2002. Congregations and Membership in the United States 2000. Nashville, TN: Glenmary Research Center.
Food Environment Statistics:
| This county: | 3.03 / 10,000 pop. |
| Georgia: | 0.86 / 10,000 pop. |
| Talbot County: | 3.03 / 10,000 pop. |
| Georgia: | 5.12 / 10,000 pop. |
| Talbot County: | 14.4% |
| Georgia: | 10.4% |
| Talbot County: | 32.9% |
| State: | 27.8% |
| Here: | 19.0% |
| State: | 14.6% |
Agriculture in Talbot County:
Average size of farms: 283 acresAverage value of agricultural products sold per farm: $10,149
Average value of crops sold per acre for harvested cropland: $87.93
The value of nursery, greenhouse, floriculture, and sod as a percentage of the total market value of agricultural products sold: 0.00%
The value of livestock, poultry, and their products as a percentage of the total market value of agricultural products sold: 80.01%
Average total farm production expenses per farm: $13,886
Harvested cropland as a percentage of land in farms: 8.16%
Average market value of all machinery and equipment per farm: $26,395
The percentage of farms operated by a family or individual: 97.50%
Average age of principal farm operators: 56 years
Average number of cattle and calves per 100 acres of all land in farms: 8.03
Corn for grain: 49 harvested acres
Vegetables: 10 harvested acres
Land in orchards: 153 acres
Earthquake activity:
Talbot County-area historical earthquake activity is significantly above Georgia state average. It is 28% greater than the overall U.S. average.On 4/29/2003 at 08:59:39, a magnitude 4.9 (4.4 MB, 4.6 MW, 4.9 LG, Class: Light, Intensity: IV - V) earthquake occurred 139.4 miles away from Talbot County center
On 8/2/1974 at 08:52:09, a magnitude 4.9 (4.3 MB, 4.9 LG) earthquake occurred 144.2 miles away from the county center
On 1/18/1999 at 07:00:53, a magnitude 4.8 (4.8 MB, 4.0 LG, Depth: 0.6 mi) earthquake occurred 164.7 miles away from the county center
On 10/24/1997 at 08:35:17, a magnitude 4.9 (4.8 MB, 4.2 MS, 4.9 LG, Depth: 6.2 mi) earthquake occurred 193.4 miles away from the county center
On 4/29/2003 at 08:59:39, a magnitude 4.6 (4.6 MW, Depth: 12.3 mi) earthquake occurred 139.5 miles away from Talbot County center
On 11/30/1973 at 07:48:41, a magnitude 4.7 (4.7 MB, 4.6 ML) earthquake occurred 217.5 miles away from the county center
Magnitude types: regional Lg-wave magnitude (LG), body-wave magnitude (MB), local magnitude (ML), surface-wave magnitude (MS), moment magnitude (MW)
Most recent natural disasters:
- Georgia Covid-19 Pandemic, Incident Period: January 20, 2020, FEMA Id: 4501, Natural disaster type: Other
- Georgia Severe Storms and Flooding, Incident Period: December 22, 2015 to January 13, 2016, Major Disaster (Presidential) Declared DR-4259: February 26, 2016, FEMA Id: 4259, Natural disaster type: Storm, Flood
- Georgia Hurricane Katrina Evacuation, Incident Period: August 27, 2005 to October 01, 2005, Emergency Declared EM-3218: September 05, 2005, FEMA Id: 3218, Natural disaster type: Hurricane
- Georgia Tropical Storm Frances, Incident Period: September 03, 2004 to October 30, 2004, Major Disaster (Presidential) Declared DR-1560: September 24, 2004, FEMA Id: 1560, Natural disaster type: Tropical Storm
- Georgia Severe Storms, Tornadoes and Flooding, Incident Period: February 14, 1998 to May 11, 1998, Major Disaster (Presidential) Declared DR-1209: March 11, 1998, FEMA Id: 1209, Natural disaster type: Storm, Tornado, Flood
- Georgia Hurricane Opal, Incident Period: October 04, 1995 to October 05, 1995, Major Disaster (Presidential) Declared DR-1071: October 10, 1995, FEMA Id: 1071, Natural disaster type: Hurricane
- Georgia Tornadoes, Flooding, Heavy Rain, Tropical Storm Alberto, Incident Period: July 03, 1994 to July 25, 1994, Major Disaster (Presidential) Declared DR-1033: July 07, 1994, FEMA Id: 1033, Natural disaster type: Tropical Storm, Tornado, Flood, Heavy Rain
- Georgia Heavy Rain, High Winds, Tornadoes, Incident Period: November 22, 1992 to December 07, 1992, Major Disaster (Presidential) Declared DR-969: December 01, 1992, FEMA Id: 969, Natural disaster type: Tornado, Wind, Heavy Rain
- Georgia Flooding, Severe Storm, Tornado, Incident Period: February 10, 1990 to February 24, 1990, Major Disaster (Presidential) Declared DR-857: February 23, 1990, FEMA Id: 857, Natural disaster type: Storm, Tornado, Flood
- Georgia Drought, Incident Period: July 20, 1977, Emergency Declared EM-3044: July 20, 1977, FEMA Id: 3044, Natural disaster type: Drought
The number of natural disasters in Talbot County (10) is smaller than the US average (15).
Major Disasters (Presidential) Declared: 7
Emergencies Declared: 2
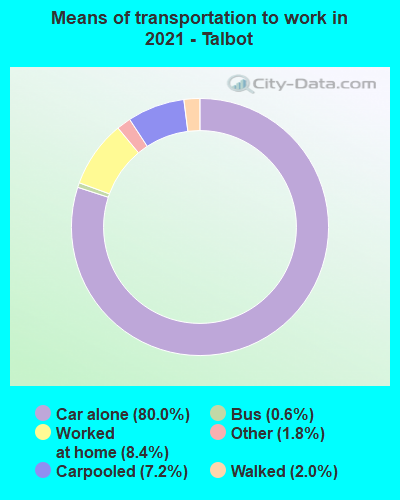
Means of transportation to work:
- Drove a car alone: 488 (67.8%)
- Carpooled: 38 (5.3%)
- Bus: 3 (0.4%)
- Taxicab, motorcycle, or other means: 21 (2.9%)
- Walked: 19 (2.6%)
- Worked at home: 163 (22.6%)
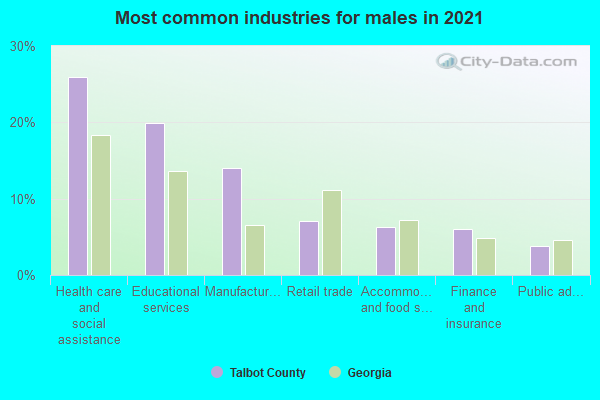
- Health care and social assistance (26%)
- Educational services (21%)
- Accommodation and food services (11%)
- Manufacturing (9%)
- Retail trade (7%)
- Finance and insurance (6%)
- Public administration (4%)
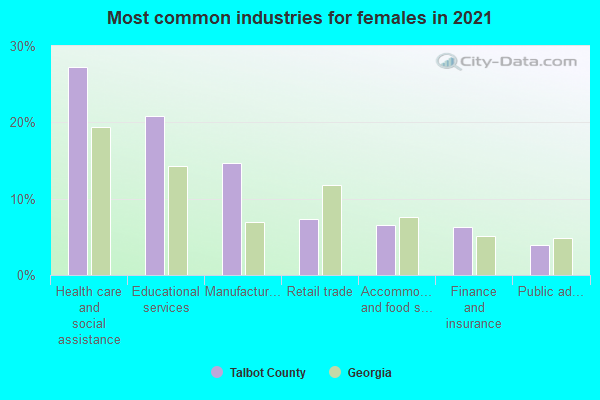
- Health care and social assistance (27%)
- Educational services (21%)
- Accommodation and food services (11%)
- Manufacturing (9%)
- Retail trade (7%)
- Finance and insurance (6%)
- Public administration (4%)
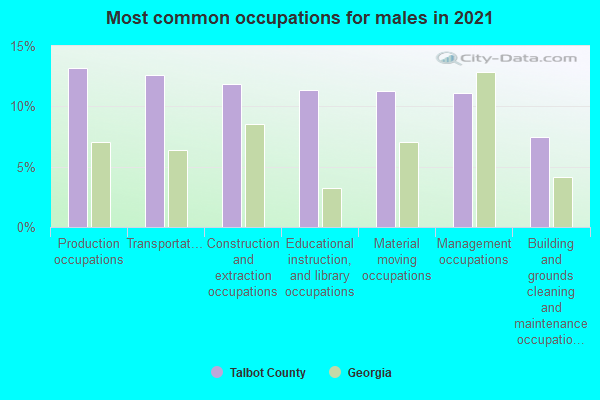
- Production occupations (15%)
- Construction and extraction occupations (12%)
- Transportation occupations (12%)
- Management occupations (11%)
- Educational instruction, and library occupations (10%)
- Material moving occupations (9%)
- Building and grounds cleaning and maintenance occupations (7%)
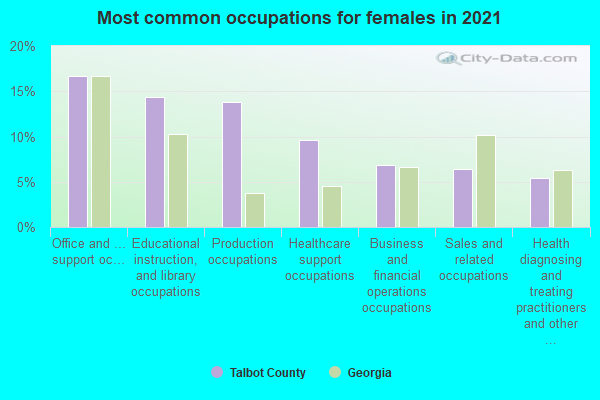
- Office and administrative support occupations (16%)
- Educational instruction, and library occupations (14%)
- Production occupations (10%)
- Healthcare support occupations (10%)
- Business and financial operations occupations (8%)
- Sales and related occupations (7%)
- Food preparation and serving related occupations (7%)
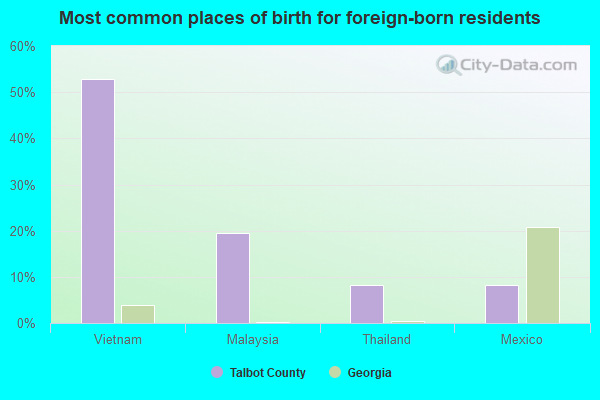
- Vietnam (82%)
- France (18%)
- Denmark (0%)
- Ireland (0%)
- Norway (0%)
- Sweden (0%)
- United Kingdom, excluding England and Scotland (0%)
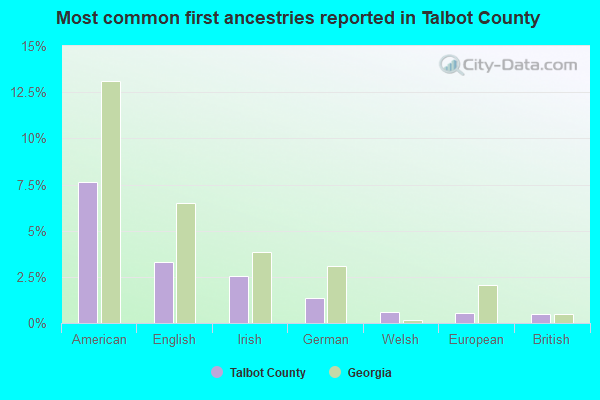
- American (10%)
- English (3%)
- Irish (3%)
- German (2%)
- Scotch-Irish (1%)
- British (1%)
- Welsh (0%)
17 people in local jails and other confinement facilities (including police lockups)
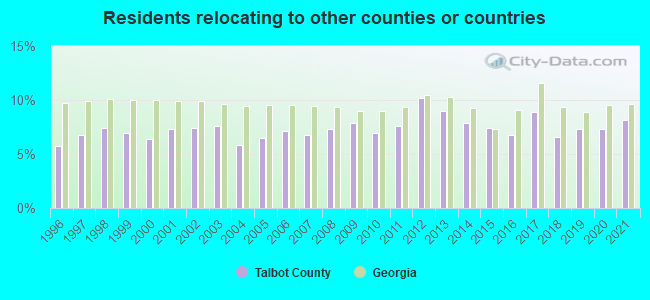
8.22% of this county's 2021 resident taxpayers lived in other counties in 2020 ($42,190 average adjusted gross income)
| Here: | 8.22% |
| Georgia average: | 10.21% |
10 or fewer of this county's residents moved from foreign countries.
7.05% relocated from other counties in Georgia ($37,310 average AGI)
1.17% relocated from other states ($4,881 average AGI)
Talbot County: 1.17% Georgia average: 3.80%

Top counties from which taxpayers relocated into this county between 2020 and 2021:
| from Muscogee County, GA | |
| from Meriwether County, GA |
8.13% of this county's 2020 resident taxpayers moved to other counties in 2021 ($35,771 average adjusted gross income)
| Here: | 8.13% |
| Georgia average: | 9.60% |
10 or fewer of this county's residents moved to foreign countries.
6.37% relocated to other counties in Georgia ($26,500 average AGI)
1.76% relocated to other states ($9,265 average AGI)
Talbot County: 1.76% Georgia average: 3.15%
Top counties to which taxpayers relocated from this county between 2020 and 2021:
| to Muscogee County, GA | |
| to Meriwether County, GA |
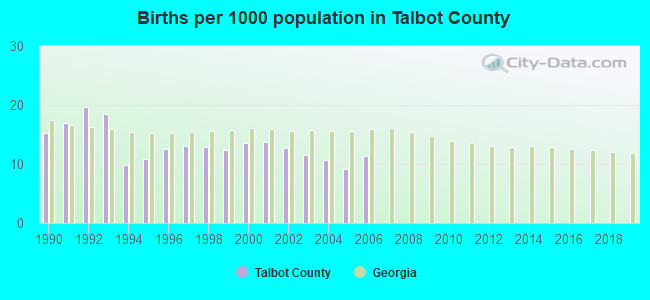
Births per 1000 population from 1990 to 1999: 14.2
Births per 1000 population from 2000 to 2006: 11.8
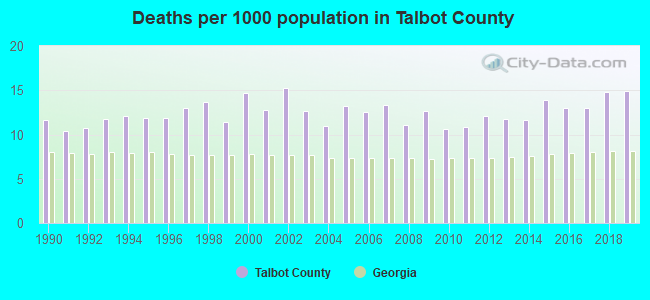
Deaths per 1000 population from 1990 to 1999: 11.8
Deaths per 1000 population from 2000 to 2009: 12.9
Deaths per 1000 population from 2010 to 2020: 12.9
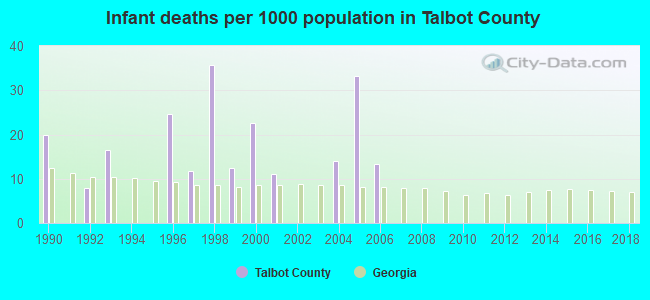
Infant deaths per 1000 live births from 1990 to 1999: 12.9
Infant deaths per 1000 live births from 2000 to 2006: 13.5
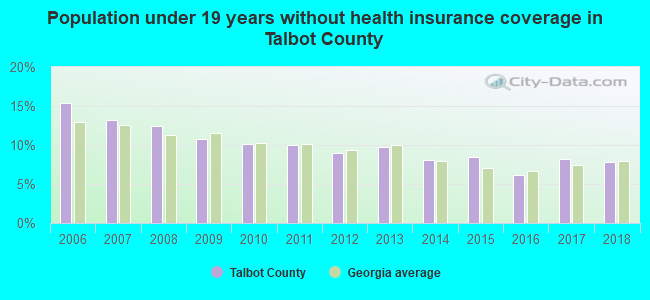
Persons under 19 years old without health insurance coverage in 2018: 7.8%
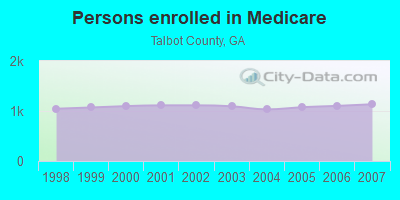
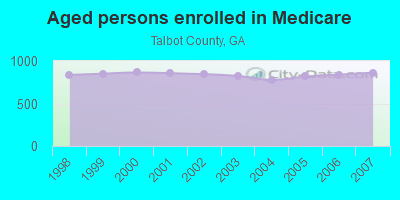
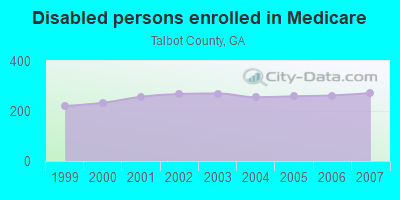
Persons enrolled in hospital insurance and/or supplemental medical insurance (Medicare) in July 1, 2007: 1,135 (863 aged, 272 disabled)
Children under 18 without health insurance coverage in 2007: 181 (12%)
Most common underlying causes of death in Talbot County, Georgia in 1999 - 2019:
- Respiratory arrest (22)
- Bronchus or lung, unspecified - Malignant neoplasms (10)
- Heart disease, unspecified (10)
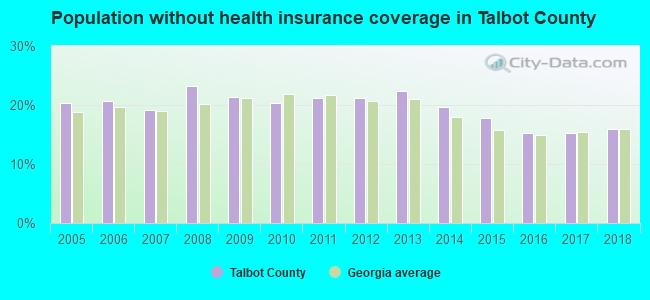
Population without health insurance coverage in 2000: 18%
Children under 18 without health insurance coverage in 2000: 14%
Medical specialist MDs per 100,000 population in 2005: 1,163
Dentists per 100,000 population in 1998: 15
EPA green book nonattainment status in 2004-2006: 1
Crimes per 100,000 population in 1996: 1
Household type by relationship:
Households: 5,895- Male householders: 1,160 (424 living alone), Female householders: 1,473 (359 living alone)
1,040 spouses (1,037 opposite-sex spouses), 223 unmarried partners, (220 opposite-sex unmarried partners), 1,337 children (1,284 natural, 28 adopted, 22 stepchildren), 398 grandchildren, 74 brothers or sisters, 65 parents, 0 foster children, 81 other relatives, 59 non-relatives
- In group quarters: 28
Size of family households: 846 2-persons, 519 3-persons, 224 4-persons, 25 5-persons, 51 6-persons, 21 7-or-more-persons.
Size of nonfamily households: 787 1-person, 155 2-persons, 2 3-persons.
229 married couples with children.
409 single-parent households (155 men, 254 women).
98.6% of residents of Talbot speak English at home.
1.0% of residents speak Spanish at home (46% speak English very well, 54% speak English well).
0.4% of residents speak Asian or Pacific Island language at home (100% speak English very well).
In fiscal year 2004:
Federal Government expenditure: $45,904,000 ($6,969 per capita)
Department of Defense expenditure: $6,417,000
Federal direct payments to individuals for retirement and disability: $23,488,000
Federal other direct payments to individuals: $7,784,000
Federal direct payments not to individuals: $202,000
Federal grants: $12,989,000
Federal procurement contracts: $298,000 ($0,000 Department of Defense)
Federal salaries and wages: $1,144,000 ($13,000 Department of Defense)
Federal Government direct loans: $0,000
Federal guaranteed/insured loans: $1,383,000
Federal Government insurance: $735,000
Population change from April 1, 2000 to July 1, 2005:
Births: 467| Here: | 70 per 1000 residents |
| State: | 79 per 1000 residents |
Deaths: 443
| Here: | 66 per 1000 residents |
| State: | 38 per 1000 residents |
Net international migration: +1
| Here: | +0 per 1000 residents |
| State: | +21 per 1000 residents |
Net internal migration: +200
| Here: | +30 per 1000 residents |
| State: | +26 per 1000 residents |
Total withdrawal of fresh water for public supply: 0.20 millions of gallons per day (all from ground)
| Here: | 6.3 |
| State: | 6.8 |
| Here: | 5.6 |
| State: | 4.6 |
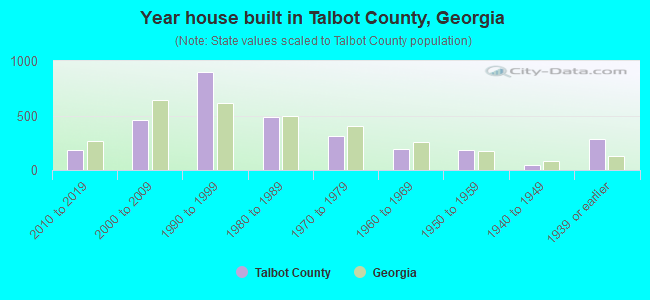
- Year house built in Talbot County, Georgia
- 02020 or later
- 2402010 to 2019
- 5162000 to 2009
- 7621990 to 1999
- 4931980 to 1989
- 3651970 to 1979
- 1611960 to 1969
- 2431950 to 1959
- 451940 to 1949
- 2021939 or earlier
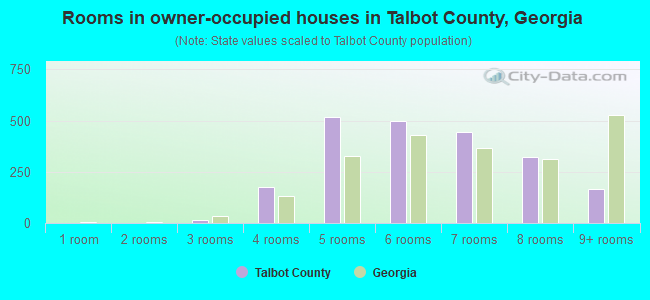
- Rooms in owner-occupied houses in Talbot County, Georgia
- 01 room
- 82 rooms
- 203 rooms
- 1584 rooms
- 4995 rooms
- 5356 rooms
- 4197 rooms
- 3218 rooms
- 2139+ rooms
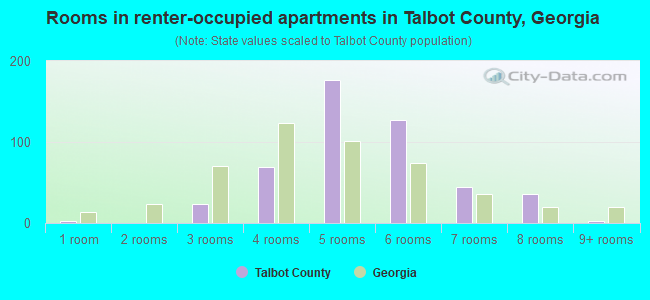
- Rooms in renter-occupied apartments in Talbot County, Georgia
- 31 room
- 02 rooms
- 343 rooms
- 724 rooms
- 1035 rooms
- 1346 rooms
- 607 rooms
- 478 rooms
- 59+ rooms
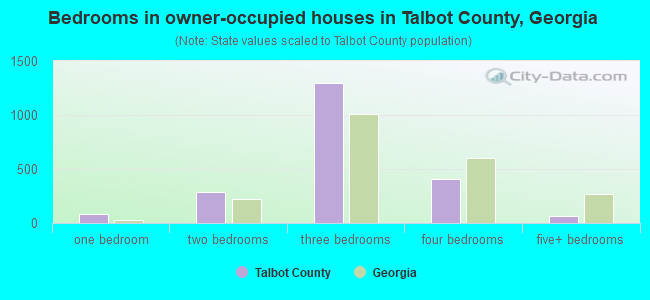
- Bedrooms in owner-occupied houses in Talbot County, Georgia
- 0no bedroom
- 731 bedroom
- 3162 bedrooms
- 1,2953 bedrooms
- 4264 bedrooms
- 605+ bedrooms
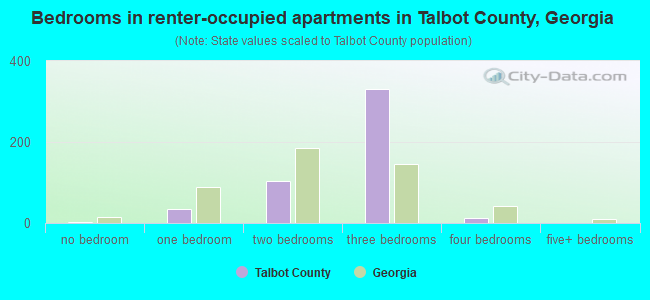
- Bedrooms in renter-occupied apartments in Talbot County, Georgia
- 3no bedroom
- 301 bedroom
- 1152 bedrooms
- 3093 bedrooms
- 84 bedrooms
- 05+ bedrooms
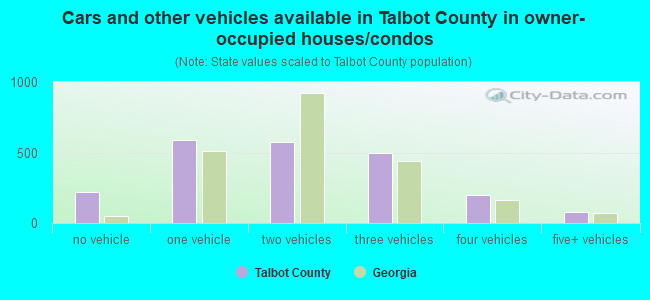
- Cars and other vehicles available in Talbot County in owner-occupied houses/condos
- 192no vehicle
- 6361 vehicle
- 6112 vehicles
- 4433 vehicles
- 2044 vehicles
- 985+ vehicles
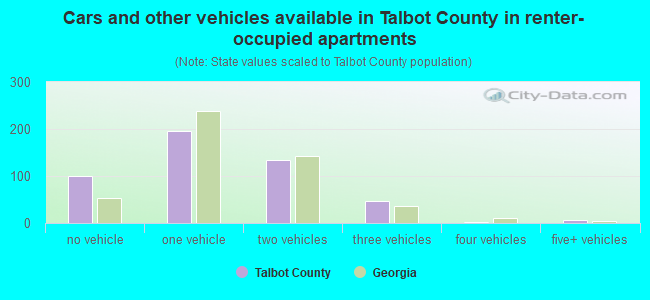
- Cars and other vehicles available in Talbot County in renter-occupied apartments
- 105no vehicle
- 1531 vehicle
- 1312 vehicles
- 563 vehicles
- 54 vehicles
- 105+ vehicles
92.4% of Talbot County residents lived in the same house 1 years ago.
Out of people who lived in different houses, 21% lived in this county.
Out of people who lived in different counties, 84% lived in Georgia.
| Talbot County: | 92.4% |
| State average: | 86.6% |
Place of birth for U.S.-born residents:
- This state: 4,608
- Other state: 1,153
- Northeast: 161
- Midwest: 269
- South: 533
- West: 193
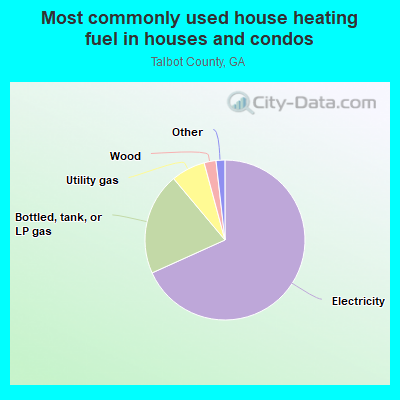
- 67.6%Electricity
- 19.3%Bottled, tank, or LP gas
- 7.8%Utility gas
- 3.8%Wood
- 0.7%Fuel oil, kerosene, etc.
- 0.5%Coal or coke
- 0.2%Other fuel
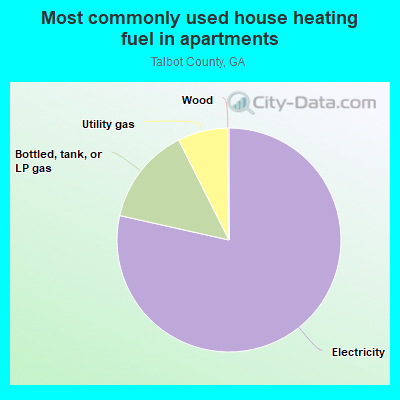
- 68.4%Electricity
- 19.6%Bottled, tank, or LP gas
- 8.4%Utility gas
- 3.3%Other fuel
- 0.4%Wood
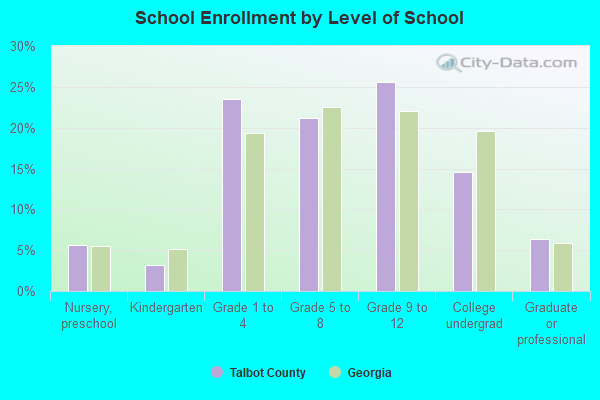
Private vs. public school enrollment:
| Here: | 10.3% |
| Georgia: | 12.1% |
| Here: | 8.7% |
| Georgia: | 10.8% |
| Here: | 12.8% |
| Georgia: | 17.1% |
Talbot County government finances - Expenditure in 2018:
- Charges - Other: $816,000
Sewerage: $383,000
Regular Highways: $322,000
- Construction - Correctional Institutions: $39,000
Police Protection: $7,000
- Current Operations - Regular Highways: $1,601,000
Police Protection: $938,000
General - Other: $856,000
Health - Other: $578,000
Financial Administration: $555,000
Judicial and Legal Services: $535,000
Central Staff Services: $467,000
Solid Waste Management: $342,000
General Public Buildings: $166,000
Correctional Institutions: $110,000
Local Fire Protection: $85,000
Natural Resources - Other: $62,000
Libraries: $32,000
Housing and Community Development: $32,000
Public Welfare - Other: $19,000
Parks and Recreation: $18,000
- Federal Intergovernmental - Other: $107,000
- General - Interest on Debt: $92,000
- Intergovernmental to Local - Other - General - Other: $54,000
- Local Intergovernmental - Other: $26,000
- Long Term Debt - Beginning Outstanding - Unspecified Public Purpose: $1,863,000
Outstanding Unspecified Public Purpose: $1,745,000
Retired Unspecified Public Purpose: $118,000
- Miscellaneous - General Revenue - Other: $81,000
Sale of Property: $35,000
Interest Earnings: $28,000
Fines and Forfeits: $17,000
Rents: $4,000
- Other Capital Outlay - Regular Highways: $223,000
Police Protection: $78,000
Local Fire Protection: $40,000
Financial Administration: $13,000
Health - Other: $9,000
Parks and Recreation: $2,000
- Other Funds - Cash and Securities: $9,337,000
- Revenue - Water Utilities: $575,000
- Sinking Funds - Cash and Securities: $167,000
- State Intergovernmental - Other: $1,467,000
Housing and Community Development: $32,000
General Local Government Support: $5,000
- Tax - Property: $3,341,000
General Sales and Gross Receipts: $1,318,000
Insurance Premiums Sales: $306,000
Alcoholic Beverage Sales: $34,000
Occupation and Business License - Other: $14,000
Alcoholic Beverage License: $11,000
Public Utilities Sales: $8,000
Other License: $7,000
Other: $6,000
Talbot County government finances - Revenue in 2018:
- Charges - Other: $816,000
Sewerage: $383,000
Regular Highways: $322,000
- Construction - Correctional Institutions: $39,000
Police Protection: $7,000
- Current Operations - Regular Highways: $1,601,000
Police Protection: $938,000
General - Other: $856,000
Health - Other: $578,000
Financial Administration: $555,000
Judicial and Legal Services: $535,000
Central Staff Services: $467,000
Solid Waste Management: $342,000
General Public Buildings: $166,000
Correctional Institutions: $110,000
Local Fire Protection: $85,000
Natural Resources - Other: $62,000
Libraries: $32,000
Housing and Community Development: $32,000
Public Welfare - Other: $19,000
Parks and Recreation: $18,000
- Federal Intergovernmental - Other: $107,000
- General - Interest on Debt: $92,000
- Intergovernmental to Local - Other - General - Other: $54,000
- Local Intergovernmental - Other: $26,000
- Long Term Debt - Beginning Outstanding - Unspecified Public Purpose: $1,863,000
Outstanding Unspecified Public Purpose: $1,745,000
Retired Unspecified Public Purpose: $118,000
- Miscellaneous - General Revenue - Other: $81,000
Sale of Property: $35,000
Interest Earnings: $28,000
Fines and Forfeits: $17,000
Rents: $4,000
- Other Capital Outlay - Regular Highways: $223,000
Police Protection: $78,000
Local Fire Protection: $40,000
Financial Administration: $13,000
Health - Other: $9,000
Parks and Recreation: $2,000
- Other Funds - Cash and Securities: $9,337,000
- Revenue - Water Utilities: $575,000
- Sinking Funds - Cash and Securities: $167,000
- State Intergovernmental - Other: $1,467,000
Housing and Community Development: $32,000
General Local Government Support: $5,000
- Tax - Property: $3,341,000
General Sales and Gross Receipts: $1,318,000
Insurance Premiums Sales: $306,000
Alcoholic Beverage Sales: $34,000
Occupation and Business License - Other: $14,000
Alcoholic Beverage License: $11,000
Public Utilities Sales: $8,000
Other License: $7,000
Other: $6,000
Talbot County government finances - Debt in 2018:
- Charges - Other: $816,000
Sewerage: $383,000
Regular Highways: $322,000
- Construction - Correctional Institutions: $39,000
Police Protection: $7,000
- Current Operations - Regular Highways: $1,601,000
Police Protection: $938,000
General - Other: $856,000
Health - Other: $578,000
Financial Administration: $555,000
Judicial and Legal Services: $535,000
Central Staff Services: $467,000
Solid Waste Management: $342,000
General Public Buildings: $166,000
Correctional Institutions: $110,000
Local Fire Protection: $85,000
Natural Resources - Other: $62,000
Libraries: $32,000
Housing and Community Development: $32,000
Public Welfare - Other: $19,000
Parks and Recreation: $18,000
- Federal Intergovernmental - Other: $107,000
- General - Interest on Debt: $92,000
- Intergovernmental to Local - Other - General - Other: $54,000
- Local Intergovernmental - Other: $26,000
- Long Term Debt - Beginning Outstanding - Unspecified Public Purpose: $1,863,000
Outstanding Unspecified Public Purpose: $1,745,000
Retired Unspecified Public Purpose: $118,000
- Miscellaneous - General Revenue - Other: $81,000
Sale of Property: $35,000
Interest Earnings: $28,000
Fines and Forfeits: $17,000
Rents: $4,000
- Other Capital Outlay - Regular Highways: $223,000
Police Protection: $78,000
Local Fire Protection: $40,000
Financial Administration: $13,000
Health - Other: $9,000
Parks and Recreation: $2,000
- Other Funds - Cash and Securities: $9,337,000
- Revenue - Water Utilities: $575,000
- Sinking Funds - Cash and Securities: $167,000
- State Intergovernmental - Other: $1,467,000
Housing and Community Development: $32,000
General Local Government Support: $5,000
- Tax - Property: $3,341,000
General Sales and Gross Receipts: $1,318,000
Insurance Premiums Sales: $306,000
Alcoholic Beverage Sales: $34,000
Occupation and Business License - Other: $14,000
Alcoholic Beverage License: $11,000
Public Utilities Sales: $8,000
Other License: $7,000
Other: $6,000
Talbot County government finances - Cash and Securities in 2018:
- Charges - Other: $816,000
Sewerage: $383,000
Regular Highways: $322,000
- Construction - Correctional Institutions: $39,000
Police Protection: $7,000
- Current Operations - Regular Highways: $1,601,000
Police Protection: $938,000
General - Other: $856,000
Health - Other: $578,000
Financial Administration: $555,000
Judicial and Legal Services: $535,000
Central Staff Services: $467,000
Solid Waste Management: $342,000
General Public Buildings: $166,000
Correctional Institutions: $110,000
Local Fire Protection: $85,000
Natural Resources - Other: $62,000
Libraries: $32,000
Housing and Community Development: $32,000
Public Welfare - Other: $19,000
Parks and Recreation: $18,000
- Federal Intergovernmental - Other: $107,000
- General - Interest on Debt: $92,000
- Intergovernmental to Local - Other - General - Other: $54,000
- Local Intergovernmental - Other: $26,000
- Long Term Debt - Beginning Outstanding - Unspecified Public Purpose: $1,863,000
Outstanding Unspecified Public Purpose: $1,745,000
Retired Unspecified Public Purpose: $118,000
- Miscellaneous - General Revenue - Other: $81,000
Sale of Property: $35,000
Interest Earnings: $28,000
Fines and Forfeits: $17,000
Rents: $4,000
- Other Capital Outlay - Regular Highways: $223,000
Police Protection: $78,000
Local Fire Protection: $40,000
Financial Administration: $13,000
Health - Other: $9,000
Parks and Recreation: $2,000
- Other Funds - Cash and Securities: $9,337,000
- Revenue - Water Utilities: $575,000
- Sinking Funds - Cash and Securities: $167,000
- State Intergovernmental - Other: $1,467,000
Housing and Community Development: $32,000
General Local Government Support: $5,000
- Tax - Property: $3,341,000
General Sales and Gross Receipts: $1,318,000
Insurance Premiums Sales: $306,000
Alcoholic Beverage Sales: $34,000
Occupation and Business License - Other: $14,000
Alcoholic Beverage License: $11,000
Public Utilities Sales: $8,000
Other License: $7,000
Other: $6,000
Supplemental Security Income (SSI) in 2006:
- Total number of recipients: 313
- Number of aged recipients: 56
- Number of blind and disabled recipients: 257
- Number of recipients under 18: 36
- Number of recipients between 18 and 64: 168
- Number of recipients older than 64: 109
- Number of recipients also receiving OASDI: 149
- Amount of payments (thousands of dollars): 115
| Most common first names in Talbot County, GA among deceased individuals | ||
| Name | Count | Lived (average) |
|---|---|---|
| John | 42 | 73.5 years |
| Willie | 39 | 71.2 years |
| Robert | 32 | 72.1 years |
| Mary | 29 | 79.2 years |
| James | 28 | 65.9 years |
| William | 27 | 75.3 years |
| Charlie | 27 | 71.0 years |
| Henry | 18 | 73.7 years |
| Annie | 18 | 75.1 years |
| Walter | 15 | 74.9 years |
| Most common last names in Talbot County, GA among deceased individuals | ||
| Last name | Count | Lived (average) |
|---|---|---|
| Leonard | 23 | 76.7 years |
| Smith | 20 | 75.8 years |
| Mitchell | 18 | 69.3 years |
| Willis | 18 | 69.3 years |
| Williams | 17 | 67.8 years |
| Walton | 16 | 66.7 years |
| Carter | 16 | 70.0 years |
| Couch | 14 | 74.5 years |
| Neal | 14 | 71.6 years |
| Howard | 14 | 72.9 years |