Stanly County, North Carolina (NC)
County owner-occupied free and clear houses and condos in 2010: 6,515
County owner-occupied houses and condos in 2000: 16,945
Renter-occupied apartments: 6,448 (it was 5,278 in 2000)
| % of renters here: | 24% |
| State: | 33% |
Land area: 395 sq. mi.
Water area: 9.2 sq. mi.
Population density: 162 people per square mile (high).
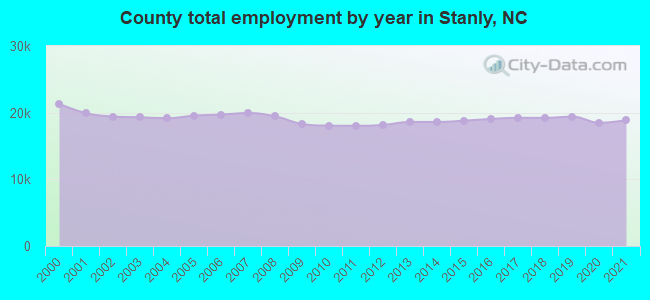
Industries providing employment: Educational, health and social services (22.0%), Manufacturing (15.8%), Retail trade (11.5%), Construction (10.9%).
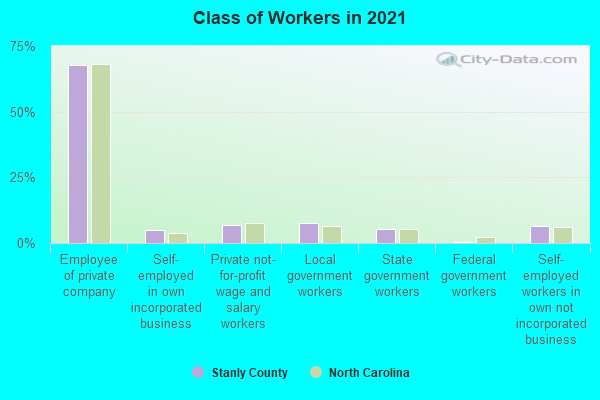
Type of workers:
- Private wage or salary: 82%
- Government: 12%
- Self-employed, not incorporated: 6%
- Unpaid family work: 0%
- OSM Map
- General Map
- Google Map
- MSN Map

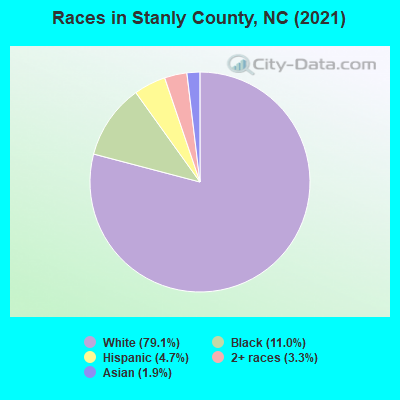
- 50,34279.1%White Non-Hispanic Alone
- 7,00911.0%Black Non-Hispanic Alone
- 3,1765.0%Hispanic or Latino
- 1,8793.0%Two or more races
- 1,2472.0%Asian alone
- 260.04%American Indian and Alaska Native alone
| Median resident age: | 41.5 years |
| North Carolina median age: | 39.2 years |
| Males: 32,241 | |
| Females: 31,852 |

 | Info on Area High Schools Needed (83 replies) |
| North Carolina development thread. (5147 replies) |
| Family Looking to Move From NH to NC (22 replies) |
| Retirement in semi-suburban/Rural area west of Charlotte? (9 replies) |
| Charlotte region vs Raleigh region - my situation (10 replies) |
| Updated Great Schools HS Rankings (48 replies) |
| Stanly County: | 2.0 people |
| North Carolina: | 2 people |
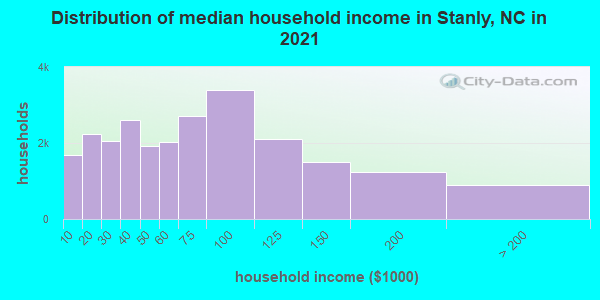
Estimated median household income in 2022: $61,820 ($36,898 in 1999)
| This county: | $61,820 |
| North Carolina: | $67,481 |
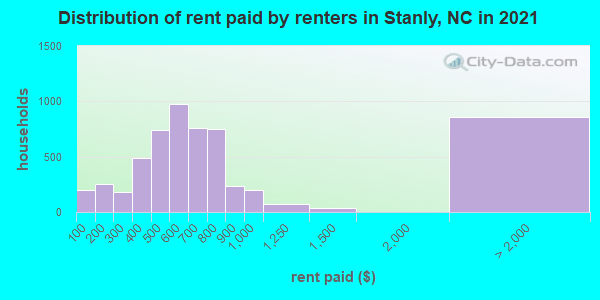
Median contract rent in 2022 for apartments: $618 (lower quartile is $469, upper quartile is $825)
| This county: | $618 |
| State: | $945 |
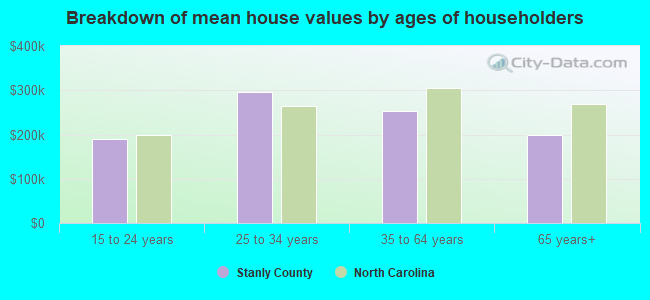
Estimated median house or condo value in 2022: $227,801 (it was $84,100 in 2000)
| Stanly: | $227,801 |
| North Carolina: | $280,600 |
Mean price in 2022:
Median monthly housing costs for homes and condos with a mortgage: $1,210Detached houses: $304,202
Here: $304,202 State: $375,326 Townhouses or other attached units: $173,663
Here: $173,663 State: $317,935 In 2-unit structures: $126,377
Here: $126,377 State: $250,488 In 3-to-4-unit structures: $117,717
Here: $117,717 State: $254,939 Mobile homes: $136,813
Here: $136,813 State: $124,933
Median monthly housing costs for units without a mortgage: $400
Institutionalized population: 1,344
Crime in 2021 (reported by the sheriff's office or county police, not the county total):
- Murders: 1
- Rapes: 1
- Robberies: 1
- Assaults: 15
- Burglaries: 75
- Thefts: 132
- Auto thefts: 29
Crime in 2020 (reported by the sheriff's office or county police, not the county total):
- Murders: 0
- Rapes: 7
- Robberies: 2
- Assaults: 38
- Burglaries: 142
- Thefts: 205
- Auto thefts: 42
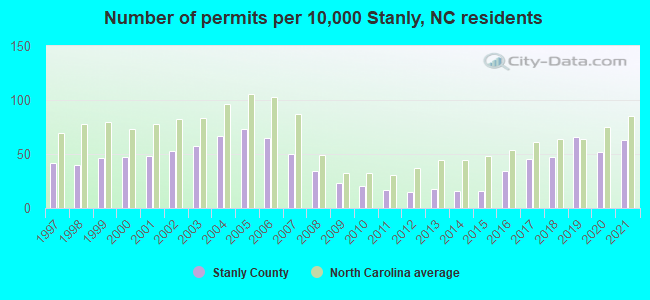
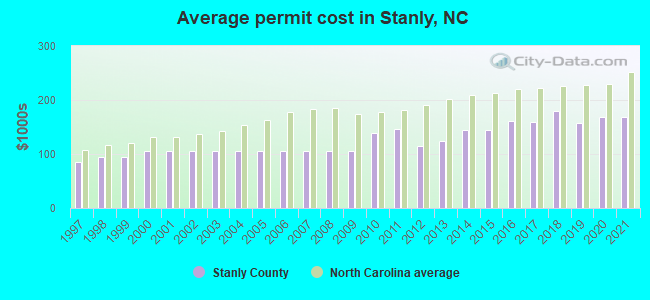
Single-family new house construction building permits:
- 2022: 373 buildings, average cost: $168,400
- 2021: 366 buildings, average cost: $168,400
- 2020: 300 buildings, average cost: $168,400
- 2019: 385 buildings, average cost: $157,300
- 2018: 272 buildings, average cost: $179,800
- 2017: 263 buildings, average cost: $159,200
- 2016: 199 buildings, average cost: $162,300
- 2015: 92 buildings, average cost: $145,000
- 2014: 92 buildings, average cost: $145,000
- 2013: 103 buildings, average cost: $124,300
- 2012: 88 buildings, average cost: $115,200
- 2011: 98 buildings, average cost: $146,900
- 2010: 118 buildings, average cost: $137,900
- 2009: 132 buildings, average cost: $104,800
- 2008: 196 buildings, average cost: $104,800
- 2007: 288 buildings, average cost: $104,800
- 2006: 376 buildings, average cost: $104,800
- 2005: 426 buildings, average cost: $104,800
- 2004: 390 buildings, average cost: $104,800
- 2003: 331 buildings, average cost: $104,800
- 2002: 308 buildings, average cost: $104,800
- 2001: 278 buildings, average cost: $104,900
- 2000: 275 buildings, average cost: $104,700
- 1999: 270 buildings, average cost: $95,100
- 1998: 235 buildings, average cost: $95,000
- 1997: 246 buildings, average cost: $85,600
Median real estate property taxes paid for housing units with mortgages in 2022: $1,494 (0.6%)
Median real estate property taxes paid for housing units with no mortgage in 2022: $1,186 (0.6%)

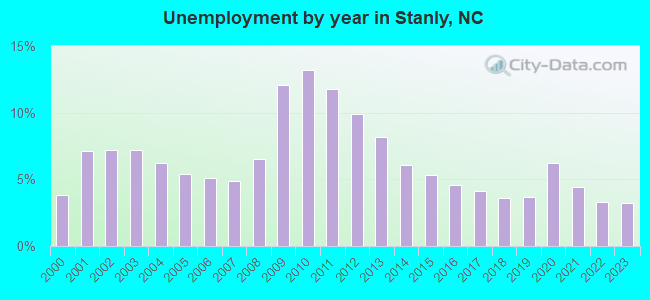
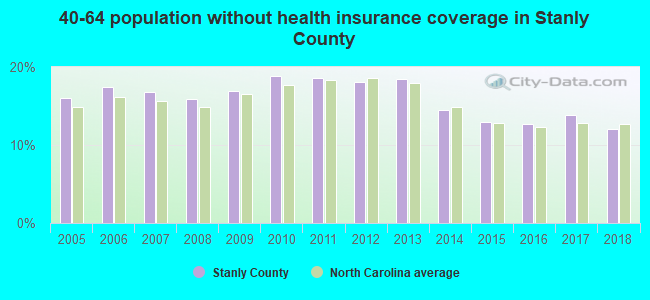
| Stanly County: | 13.2% |
| North Carolina: | 12.8% |
Median age of residents in 2022: 41.5 years old
(Males: 40.7 years old, Females: 42.5 years old)
(Median age for: White residents: 44.9 years old, Black residents: 37.5 years old, American Indian residents: 34.7 years old, Asian residents: 39.0 years old, Hispanic or Latino residents: 24.8 years old, Other race residents: 24.2 years old)
Fair market rent in 2006 for a 1-bedroom apartment in Stanly County is $421 a month.
Fair market rent for a 2-bedroom apartment is $515 a month.
Fair market rent for a 3-bedroom apartment is $701 a month.
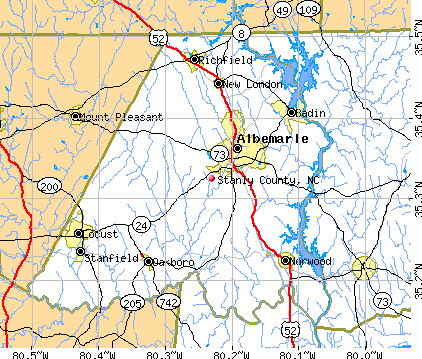
Cities in this county include: Albemarle, Locust, Norwood, Oakboro, Badin, Stanfield, Red Cross, Misenheimer, Millingport, Richfield.
Notable locations in this county outside city limits:
Notable locations in Stanly County: Camp Arrowhead (A), Camp Blue Star (B), Camp Green Cove (C), Camp Judaea (D), Camp Pinewood (E), Camp Pinnacle (F), Camp Tonawandah (G), Camp Windy Wood (H), Mud Creek Assembly Grounds (I), Pine Park Retirement Inn (J), Hendersonville Fireman Training Center (K), Camp Tekoa (L), Camp Osceola (M), Camp Kanuga (N), Turkeypen Checking Station (O), Holmes State Forest Nursery (P), Four Square Crusador Camp (Q), Sky Valley Pioneer Camp (R), North Mills River Recreation Area (S), Kings Mountain Camp (T). Display/hide their locations on the map
Churches in Stanly County include: Holly Springs Church (A), Naples Church (B), Liberty Church (C), Tracy Grove Church (D), Maple Hill Church (E), Barnwell Church (F), Locust Grove Church (G), Jones Gap Church (H), Berea Church (I). Display/hide their locations on the map
Cemeteries: McCarson Cemetery (1), Bane Cemetery (2), Jones Cemetery (3), Justus Cemetery (4), Double Springs Cemetery (5), Forest Lawn Cemetery (6), Hill Cemetery (7). Display/hide their locations on the map
Reservoirs: Jeffers Lake (A), Lake Louellen (B), Lake Hosea (C), Innisfree Lake (D), Lake Summit (E), Lake Rugby (F), Hosea Lake (G), R L Parker Lake (H). Display/hide their locations on the map
Streams, rivers, and creeks: Featherstone Creek (A), Falls Creek (B), Falling Creek (C), House Branch (D), Duncan Creek (E), Dismal Creek (F), Pea Branch (G), Devils Fork (H), Hammett Branch (I). Display/hide their locations on the map
Neighboring counties: Guadalupe County, New Mexico  , Hardin County, Tennessee , Henderson County, Tennessee , San Luis Obispo County, California , Loudon County, Tennessee , Shelby County, Tennessee .
| Here: | 2.9% |
| North Carolina: | 3.2% |
Current college students: 2,196
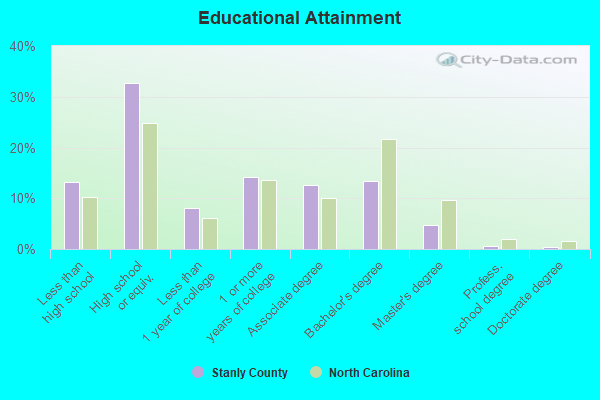
People 25 years of age or older with a high school degree or higher: 86.0%
People 25 years of age or older with a bachelor's degree or higher: 18.7%
Number of foreign born residents: 2,635 (55.6% naturalized citizens)
| Stanly County: | 4.1% |
| Whole state: | 8.6% |
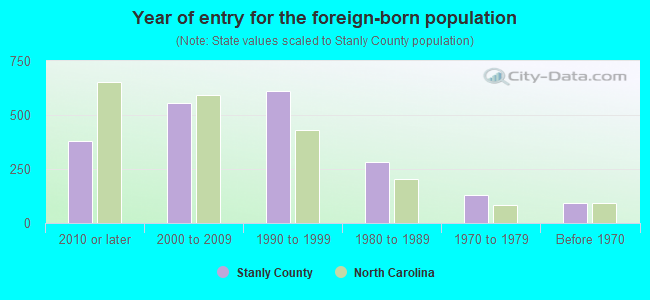
- Year of entry for the foreign-born population
- 8912010 or later
- 5922000 to 2009
- 4771990 to 1999
- 2841980 to 1989
- 1311970 to 1979
- 92Before 1970
Mean travel time to work (commute): minutes
Percentage of county residents living and working in this county: 99.0%
Housing units in structures:
- One, detached: 23,355
- One, attached: 109
- Two: 488
- 3 or 4: 909
- 5 to 9: 495
- 10 to 19: 46
- 20 to 49: 88
- 50 or more: 37
- Mobile homes: 2,993
Housing units in Stanly County with a mortgage: 10,642 (1,357 second mortgage, 0 home equity loan, 1,302 both second mortgage and home equity loan)
Houses without a mortgage: 675
| Here: | 1.5% with mortgage |
| State: | 97.0% with mortgage |
Religion statistics for Stanly County
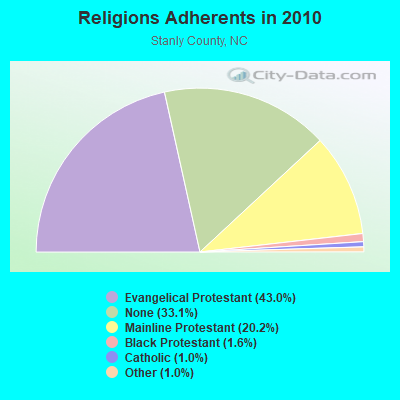
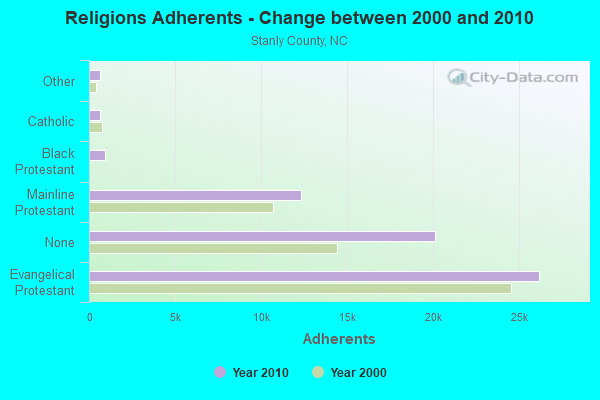
| Religion | Adherents | Congregations |
|---|---|---|
| Evangelical Protestant | 26,182 | 98 |
| Mainline Protestant | 12,307 | 42 |
| Black Protestant | 955 | 6 |
| Catholic | 636 | 1 |
| Other | 628 | 3 |
| None | 20,138 | - |
Source: Clifford Grammich, Kirk Hadaway, Richard Houseal, Dale E.Jones, Alexei Krindatch, Richie Stanley and Richard H.Taylor. 2012. 2010 U.S.Religion Census: Religious Congregations & Membership Study. Association of Statisticians of American Religious Bodies. Jones, Dale E., et al. 2002. Congregations and Membership in the United States 2000. Nashville, TN: Glenmary Research Center.
Food Environment Statistics:
| Stanly County: | 2.03 / 10,000 pop. |
| State: | 2.05 / 10,000 pop. |
| This county: | 0.34 / 10,000 pop. |
| North Carolina: | 0.92 / 10,000 pop. |
| Stanly County: | 4.23 / 10,000 pop. |
| North Carolina: | 4.75 / 10,000 pop. |
| This county: | 6.93 / 10,000 pop. |
| State: | 7.57 / 10,000 pop. |
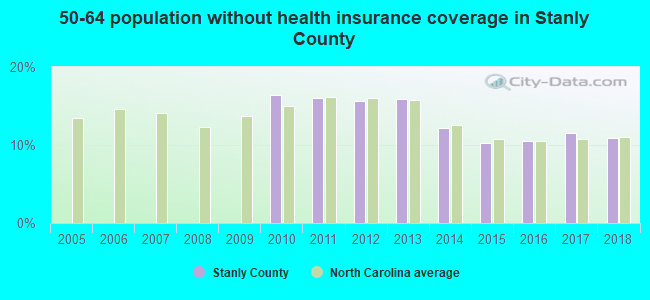
| Stanly County: | 9.9% |
| North Carolina: | 9.8% |
| Stanly County: | 27.1% |
| State: | 28.3% |
| Here: | 11.6% |
| State: | 15.6% |
Agriculture in Stanly County:
Average size of farms: 150 acresAverage value of agricultural products sold per farm: $78,778
Average value of crops sold per acre for harvested cropland: $152.47
The value of nursery, greenhouse, floriculture, and sod as a percentage of the total market value of agricultural products sold: 2.92%
The value of livestock, poultry, and their products as a percentage of the total market value of agricultural products sold: 85.49%
Average total farm production expenses per farm: $68,097
Harvested cropland as a percentage of land in farms: 50.12%
Average market value of all machinery and equipment per farm: $66,535
The percentage of farms operated by a family or individual: 93.60%
Average age of principal farm operators: 56 years
Average number of cattle and calves per 100 acres of all land in farms: 14.59
Milk cows as a percentage of all cattle and calves: 5.31%
Corn for grain: 11112 harvested acres
All wheat for grain: 8413 harvested acres
Upland cotton: 10151 harvested acres
Soybeans for beans: 18050 harvested acres
Vegetables: 11 harvested acres
Land in orchards: 43 acres
Tornado activity:
Stanly County historical area-adjusted tornado activity is significantly below North Carolina state average. It is 13345482.4 times below overall U.S. average.Earthquake activity:
Stanly County-area historical earthquake activity is significantly above North Carolina state average. It is 32% smaller than the overall U.S. average.On 8/23/2011 at 17:51:04, a magnitude 5.8 (5.8 MW, Depth: 3.7 mi, Class: Moderate, Intensity: VI - VII) earthquake occurred 219.6 miles away from Stanly County center
On 8/9/2020 at 12:07:37, a magnitude 5.1 (5.1 MW, Depth: 4.7 mi) earthquake occurred 93.1 miles away from the county center
On 8/2/1974 at 08:52:09, a magnitude 4.9 (4.3 MB, 4.9 LG, Class: Light, Intensity: IV - V) earthquake occurred 163.1 miles away from the county center
On 11/22/1974 at 05:25:55, a magnitude 4.7 (4.7 MB) earthquake occurred 167.8 miles away from the county center
On 7/27/1980 at 18:52:21, a magnitude 5.2 (5.1 MB, 4.7 MS, 5.0 UK, 5.2 UK) earthquake occurred 286.3 miles away from Stanly County center
On 4/13/1998 at 09:56:11, a magnitude 3.9 (3.5 MB, 3.9 LG, Depth: 3.1 mi, Class: Light, Intensity: II - III) earthquake occurred 51.2 miles away from the county center
Magnitude types: regional Lg-wave magnitude (LG), body-wave magnitude (MB), surface-wave magnitude (MS), moment magnitude (MW)
Most recent natural disasters:
- North Carolina Severe Storms, Tornadoes, And Flooding, Incident Period: February 6, 2020 - February 19, 2020, FEMA Id: 4543, Natural disaster type: Storm, Tornado, Flood
- North Carolina Covid-19 Pandemic, Incident Period: January 20, 2020, FEMA Id: 4487, Natural disaster type: Other
- North Carolina Hurricane Florence, Incident Period: September 7, 2018 - September 29, 2018, FEMA Id: 4393, Natural disaster type: Hurricane
- North Carolina Hurricane Katrina Evacuation, Incident Period: August 29, 2005 to October 01, 2005, Emergency Declared EM-3222: September 05, 2005, FEMA Id: 3222, Natural disaster type: Hurricane
- North Carolina Severe Ice Storm, Incident Period: December 04, 2002 to December 06, 2002, Major Disaster (Presidential) Declared DR-1448: December 12, 2002, FEMA Id: 1448, Natural disaster type: Ice Storm
- North Carolina Winter Storm, Incident Period: January 24, 2000 to February 01, 2000, Major Disaster (Presidential) Declared DR-1312: January 31, 2000, FEMA Id: 1312, Natural disaster type: Winter Storm
- North Carolina Hurricane Floyd & Irene, Incident Period: September 15, 1999 to November 02, 1999, Major Disaster (Presidential) Declared DR-1292: September 16, 1999, FEMA Id: 1292, Natural disaster type: Hurricane
- North Carolina Hurricane Floyd, Incident Period: September 15, 1999 to October 04, 1999, Emergency Declared EM-3146: September 15, 1999, FEMA Id: 3146, Natural disaster type: Hurricane
- North Carolina Hurricane Fran, Incident Period: September 05, 1996 to October 21, 1996, Major Disaster (Presidential) Declared DR-1134: September 06, 1996, FEMA Id: 1134, Natural disaster type: Hurricane
- North Carolina Blizzard, Incident Period: January 06, 1996 to January 12, 1996, Major Disaster (Presidential) Declared DR-1087: January 13, 1996, FEMA Id: 1087, Natural disaster type: Blizzard
- 2 other natural disasters have been reported since 1953.
The number of natural disasters in Stanly County (12) is smaller than the US average (15).
Major Disasters (Presidential) Declared: 6
Emergencies Declared: 3
Causes of natural disasters: Hurricanes: 6, Blizzard: 1, Drought: 1, Flood: 1, Ice Storm: 1, Storm: 1, Tornado: 1, Winter Storm: 1, Other: 1 (Note: some incidents may be assigned to more than one category).
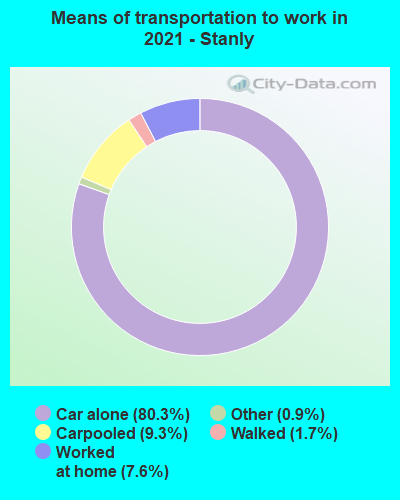
Means of transportation to work:
- Drove a car alone: 17,329 (74.8%)
- Carpooled: 2,420 (10.4%)
- Bus: 12 (0.1%)
- Taxicab, motorcycle, or other means: 140 (0.6%)
- Walked: 363 (1.6%)
- Worked at home: 2,560 (11.0%)
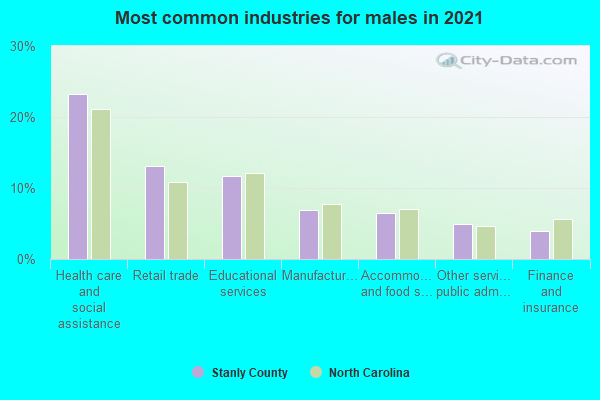
- Health care and social assistance (23%)
- Educational services (11%)
- Retail trade (11%)
- Manufacturing (7%)
- Accommodation and food services (6%)
- Other services, except public administration (6%)
- Finance and insurance (4%)

- Health care and social assistance (28%)
- Educational services (13%)
- Retail trade (13%)
- Manufacturing (8%)
- Accommodation and food services (7%)
- Other services, except public administration (7%)
- Finance and insurance (5%)
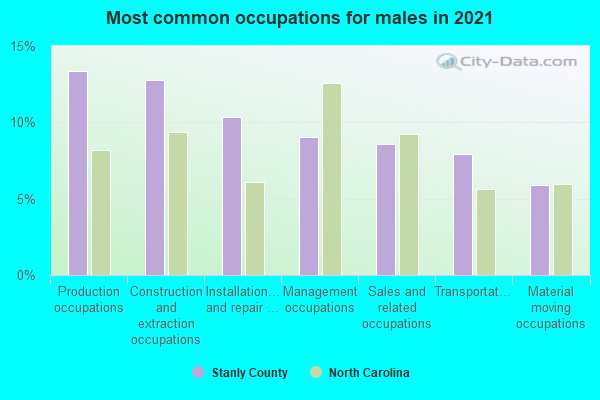
- Construction and extraction occupations (14%)
- Production occupations (13%)
- Installation, maintenance, and repair occupations (10%)
- Management occupations (10%)
- Transportation occupations (8%)
- Sales and related occupations (8%)
- Material moving occupations (7%)
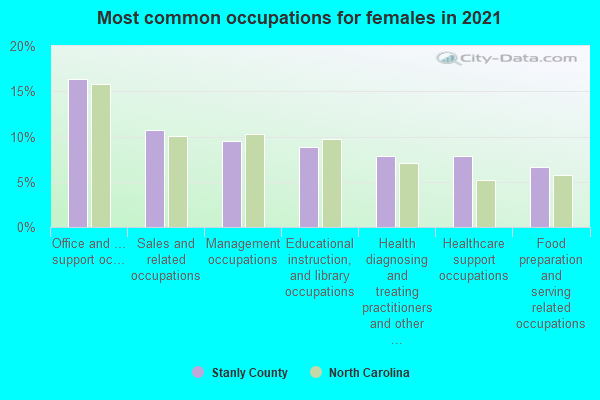
- Office and administrative support occupations (18%)
- Sales and related occupations (10%)
- Health diagnosing and treating practitioners and other technical occupations (9%)
- Educational instruction, and library occupations (9%)
- Management occupations (9%)
- Healthcare support occupations (7%)
- Food preparation and serving related occupations (7%)
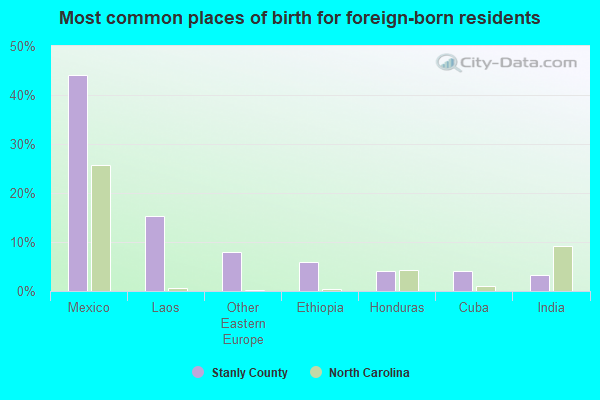
- Mexico (40%)
- Laos (9%)
- Other Eastern Europe (8%)
- Thailand (8%)
- Vietnam (6%)
- Ethiopia (5%)
- Cuba (4%)
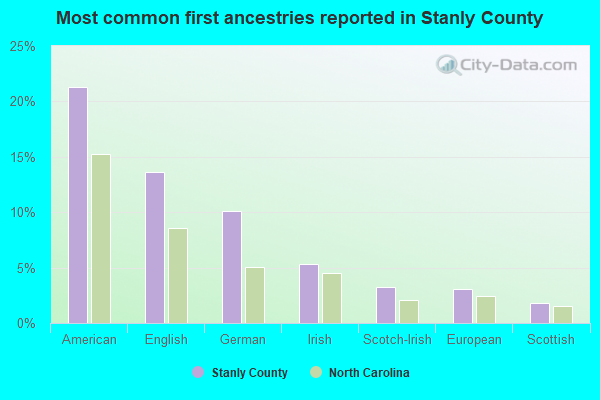
- American (20%)
- English (12%)
- German (10%)
- Irish (5%)
- Scotch-Irish (3%)
- European (3%)
- Scottish (2%)

People in group quarters in Stanly County, North Carolina in 2010:
- 676 people in nursing facilities/skilled-nursing facilities
- 575 people in state prisons
- 496 people in college/university student housing
- 125 people in group homes intended for adults
- 85 people in local jails and other municipal confinement facilities
- 53 people in other noninstitutional facilities
- 22 people in emergency and transitional shelters (with sleeping facilities) for people experiencing homelessness
- 10 people in residential treatment centers for adults
- 8 people in group homes for juveniles (non-correctional)
People in group quarters in Stanly County, North Carolina in 2000:
- 640 people in state prisons
- 516 people in nursing homes
- 386 people in college dormitories (includes college quarters off campus)
- 73 people in homes for the mentally retarded
- 63 people in local jails and other confinement facilities (including police lockups)
- 40 people in other noninstitutional group quarters
- 31 people in other nonhousehold living situations
- 11 people in mental (psychiatric) hospitals or wards
- 10 people in homes for the mentally ill
- 9 people in wards in general hospitals for patients who have no usual home elsewhere
- 6 people in homes or halfway houses for drug/alcohol abuse
- 3 people in training schools for juvenile delinquents
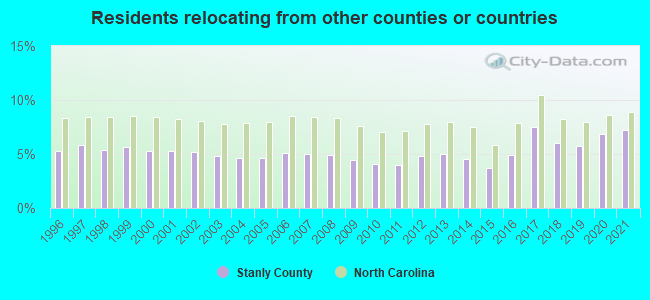
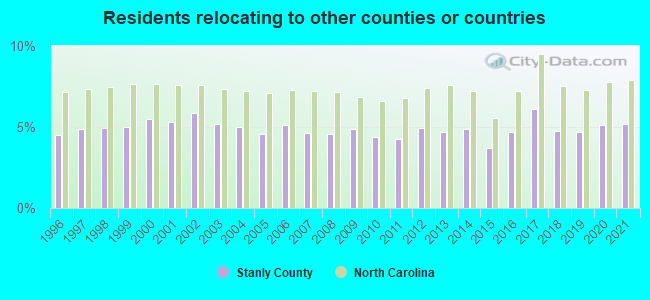
7.20% of this county's 2021 resident taxpayers lived in other counties in 2020 ($52,996 average adjusted gross income)
| Here: | 7.20% |
| North Carolina average: | 8.85% |
10 or fewer of this county's residents moved from foreign countries.
5.50% relocated from other counties in North Carolina ($41,217 average AGI)
1.70% relocated from other states ($11,779 average AGI)
Stanly County: 1.70% North Carolina average: 4.18%
Top counties from which taxpayers relocated into this county between 2020 and 2021:
| from Cabarrus County, NC | |
| from Mecklenburg County, NC | |
| from Union County, NC | |
| from Montgomery County, NC | |
| from Rowan County, NC | |
| from Anson County, NC | |
| from Davidson County, NC |
5.15% of this county's 2020 resident taxpayers moved to other counties in 2021 ($47,372 average adjusted gross income)
| Here: | 5.15% |
| North Carolina average: | 7.89% |
10 or fewer of this county's residents moved to foreign countries.
4.07% relocated to other counties in North Carolina ($37,072 average AGI)
1.08% relocated to other states ($10,299 average AGI)
Stanly County: 1.08% North Carolina average: 3.18%
Top counties to which taxpayers relocated from this county between 2020 and 2021:
| to Cabarrus County, NC | |
| to Mecklenburg County, NC | |
| to Union County, NC | |
| to Montgomery County, NC | |
| to Rowan County, NC | |
| to Anson County, NC | |
| to Davidson County, NC |
Births per 1000 population from 1990 to 1999: 13.1
Births per 1000 population from 2000 to 2006: 12.6

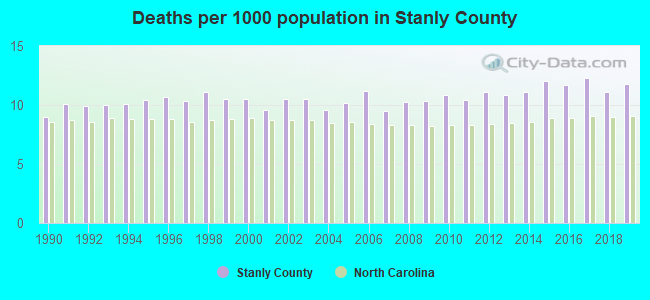
Deaths per 1000 population from 1990 to 1999: 10.2
Deaths per 1000 population from 2000 to 2009: 10.2
Deaths per 1000 population from 2010 to 2020: 11.5
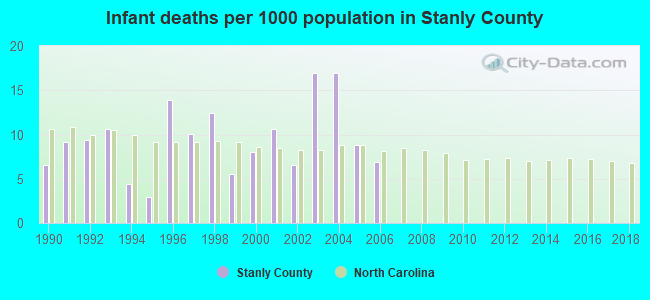
Infant deaths per 1000 live births from 1990 to 1999: 8.5
Infant deaths per 1000 live births from 2000 to 2006: 10.7
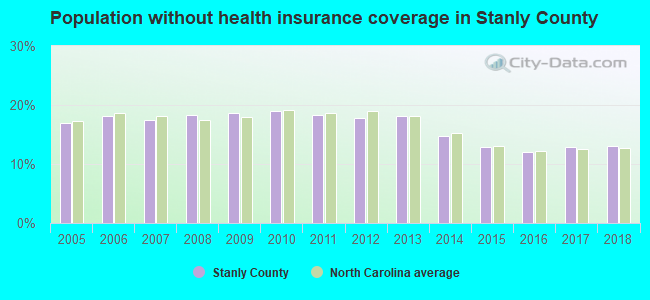
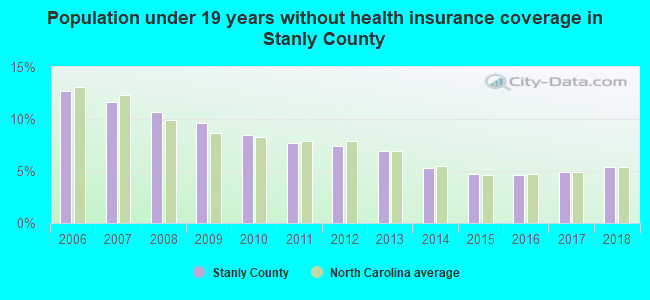
Persons under 19 years old without health insurance coverage in 2018: 5.4%

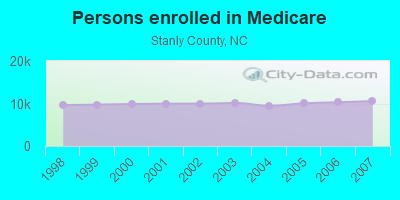
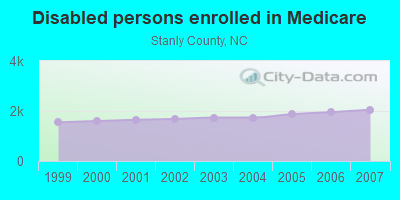
Persons enrolled in hospital insurance and/or supplemental medical insurance (Medicare) in July 1, 2007: 10,562 (8,510 aged, 2,052 disabled)
Children under 18 without health insurance coverage in 2007: 1,398 (10%)

Most common underlying causes of death in Stanly County, North Carolina in 1999 - 2019:
- Bronchus or lung, unspecified - Malignant neoplasms (861)
- Atherosclerotic heart disease (840)
- Acute myocardial infarction, unspecified (678)
- Atherosclerotic cardiovascular disease, so described (640)
- Alzheimer disease, unspecified (492)
- Chronic obstructive pulmonary disease, unspecified (460)
- Stroke, not specified as haemorrhage or infarction (410)
- Unspecified dementia (343)
- Pneumonia, unspecified (340)
- Chronic ischaemic heart disease, unspecified (219)
Population without health insurance coverage in 2000: 12%
Children under 18 without health insurance coverage in 2000: 10%
Short term general hospital admissions per 100,000 population in 2004: 10,418
Short term general hospital beds per 100,000 population in 2004: 202
Emergency room visits per 100,000 population in 2004: 49,217
General practice office based MDs per 100,000 population in 2005: 1,314
Medical specialist MDs per 100,000 population in 2005: 965
Dentists per 100,000 population in 1998: 5
Total births per 100,000 population, July 2005 - July 2006 : 29
Total deaths per 100,000 population, July 2005 - July 2006: 66
Limited-service eating places per 100,000 population in 2005 : 10
Homicides per 1,000,000 population from 2000 to 2006: 70.9. This is less than state average.
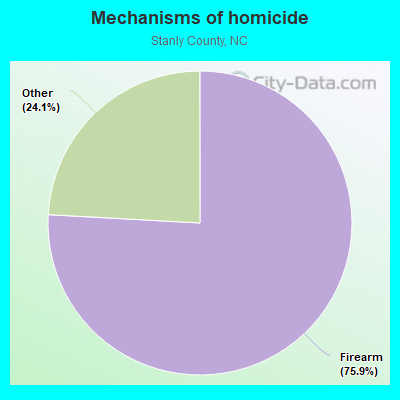
- Firearm - 53.8
- Other - 17.1
Suicides per 1,000,000 population from 2000 to 2006: 144.3. This is more than state average.
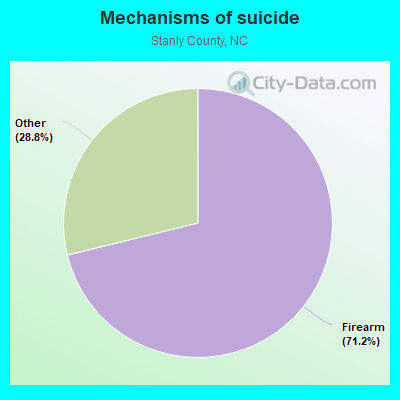
- Firearm - 102.7
- Other - 41.6
Household type by relationship:
Households: 64,093- Male householders: 11,729 (2,928 living alone), Female householders: 13,169 (3,821 living alone)
12,674 spouses (12,635 opposite-sex spouses), 1,706 unmarried partners, (1,640 opposite-sex unmarried partners), 17,387 children (16,043 natural, 443 adopted, 899 stepchildren), 1,745 grandchildren, 651 brothers or sisters, 1,040 parents, 32 foster children, 953 other relatives, 901 non-relatives
- In group quarters: 2,156
Size of family households: 8,031 2-persons, 3,862 3-persons, 2,847 4-persons, 1,238 5-persons, 638 6-persons, 342 7-or-more-persons.
Size of nonfamily households: 6,750 1-person, 1,089 2-persons, 48 3-persons, 56 4-persons, 8 5-persons.
8,098 married couples with children.
3,841 single-parent households (1,117 men, 2,724 women).
93.1% of residents of Stanly speak English at home.
4.2% of residents speak Spanish at home (53% speak English very well, 24% speak English well, 11% speak English not well, 11% don't speak English at all).
1.2% of residents speak other Indo-European language at home (78% speak English very well, 9% speak English well, 13% speak English not well).
1.2% of residents speak Asian or Pacific Island language at home (63% speak English very well, 6% speak English well, 25% speak English not well, 5% don't speak English at all).
0.1% of residents speak other language at home (24% speak English very well, 49% speak English well, 27% speak English not well).
In fiscal year 2004:
Federal Government expenditure: $278,352,000 ($4,724 per capita)
Department of Defense expenditure: $21,844,000
Federal direct payments to individuals for retirement and disability: $146,820,000
Federal other direct payments to individuals: $63,522,000
Federal direct payments not to individuals: $2,900,000
Federal grants: $39,732,000
Federal procurement contracts: $7,476,000 ($5,654,000 Department of Defense)
Federal salaries and wages: $17,902,000 ($9,977,000 Department of Defense)
Federal Government direct loans: $232,000
Federal guaranteed/insured loans: $9,652,000
Federal Government insurance: $19,006,000
Population change from April 1, 2000 to July 1, 2005:
Births: 3,821| Here: | 65 per 1000 residents |
| State: | 72 per 1000 residents |
Deaths: 3,170
| Here: | 54 per 1000 residents |
| State: | 44 per 1000 residents |
Net international migration: +509
| Here: | +9 per 1000 residents |
| State: | +18 per 1000 residents |
Net internal migration: -237
| Here: | |
| State: |
Total withdrawal of fresh water for public supply: 7.61 millions of gallons per day (1% from ground, 99% from surface)
| Here: | 6.0 |
| State: | 6.4 |
| Here: | 4.6 |
| State: | 4.4 |

- Year house built in Stanly County, North Carolina
- 1832020 or later
- 2,2722010 to 2019
- 2,6952000 to 2009
- 3,5831990 to 1999
- 3,0631980 to 1989
- 3,5181970 to 1979
- 3,1121960 to 1969
- 3,4991950 to 1959
- 1,8731940 to 1949
- 3,6191939 or earlier
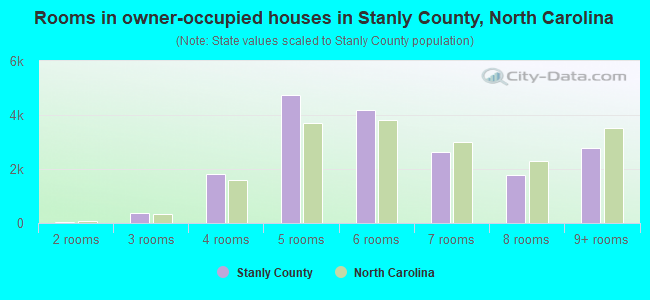
- Rooms in owner-occupied houses in Stanly County, North Carolina
- 311 room
- 62 rooms
- 3343 rooms
- 1,9494 rooms
- 4,5875 rooms
- 4,6356 rooms
- 2,8007 rooms
- 1,6458 rooms
- 2,7539+ rooms
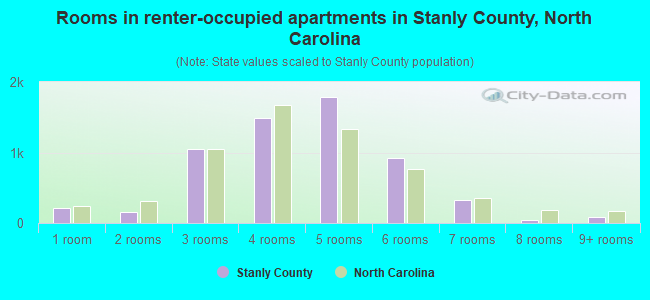
- Rooms in renter-occupied apartments in Stanly County, North Carolina
- 1281 room
- 952 rooms
- 1,1343 rooms
- 1,5434 rooms
- 1,7925 rooms
- 8536 rooms
- 3757 rooms
- 858 rooms
- 1029+ rooms
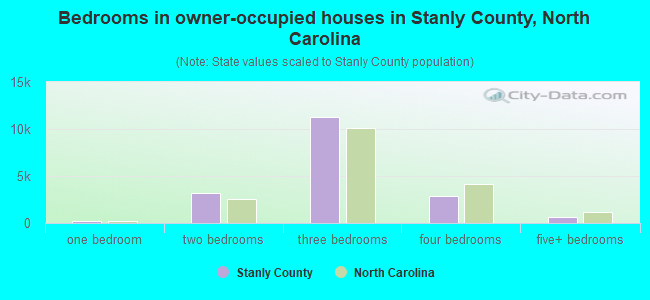
- Bedrooms in owner-occupied houses in Stanly County, North Carolina
- 32no bedroom
- 1781 bedroom
- 3,4272 bedrooms
- 11,5113 bedrooms
- 2,8434 bedrooms
- 6725+ bedrooms
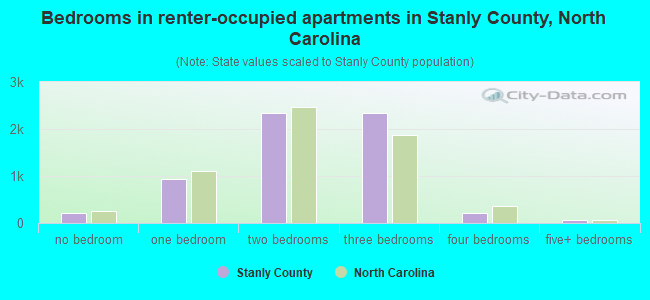
- Bedrooms in renter-occupied apartments in Stanly County, North Carolina
- 130no bedroom
- 9761 bedroom
- 2,3762 bedrooms
- 2,2983 bedrooms
- 2964 bedrooms
- 695+ bedrooms
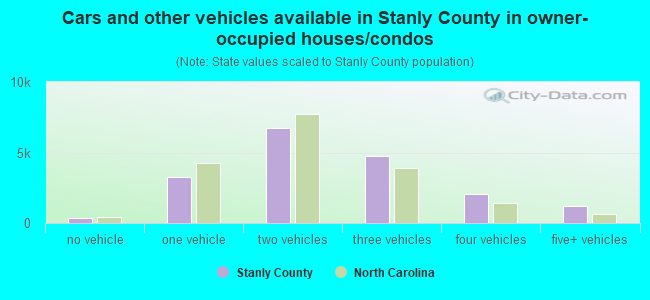
- Cars and other vehicles available in Stanly County in owner-occupied houses/condos
- 369no vehicle
- 3,6201 vehicle
- 6,5162 vehicles
- 5,0303 vehicles
- 1,9614 vehicles
- 1,2655+ vehicles
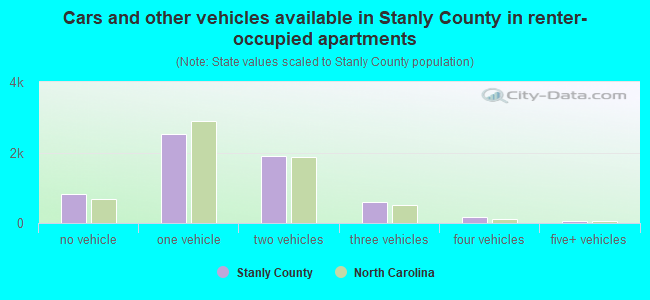
- Cars and other vehicles available in Stanly County in renter-occupied apartments
- 867no vehicle
- 2,4701 vehicle
- 1,8442 vehicles
- 6123 vehicles
- 2104 vehicles
- 1595+ vehicles
88.5% of Stanly County residents lived in the same house 1 years ago.
Out of people who lived in different houses, 33% lived in this county.
Out of people who lived in different counties, 82% lived in North Carolina.
| Stanly County: | 88.5% |
| State average: | 87.3% |
Place of birth for U.S.-born residents:
- This state: 47,737
- Other state: 12,602
- Northeast: 3,534
- Midwest: 1,986
- South: 5,793
- West: 1,284

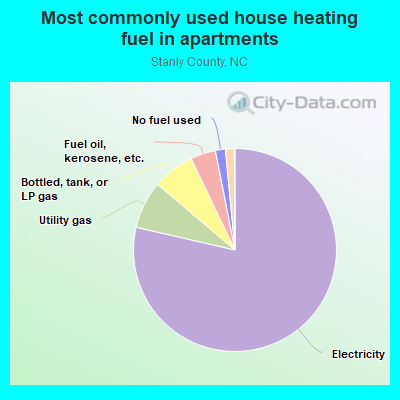
- 69.3%Electricity
- 10.6%Bottled, tank, or LP gas
- 9.9%Utility gas
- 7.9%Fuel oil, kerosene, etc.
- 2.0%Wood
- 0.2%No fuel used
- 75.9%Electricity
- 8.5%Utility gas
- 5.8%Bottled, tank, or LP gas
- 5.6%Fuel oil, kerosene, etc.
- 2.6%Wood
- 1.3%No fuel used
- 0.2%Other fuel
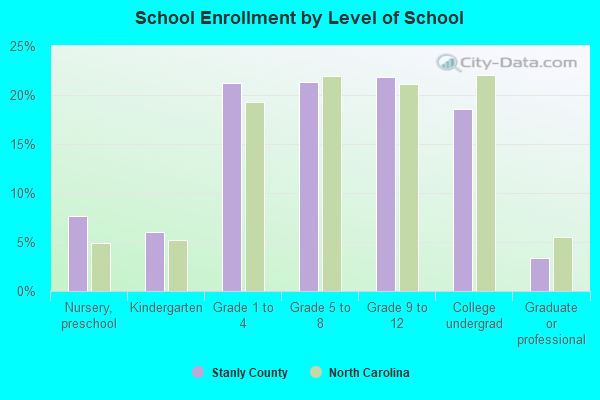
Private vs. public school enrollment:
| Here: | 17.2% |
| North Carolina: | 13.8% |
| Here: | 9.2% |
| North Carolina: | 11.9% |
| Here: | 29.6% |
| North Carolina: | 19.3% |

Stanly County government finances - Expenditure in 2020:
- Assistance and Subsidies - Public Welfare, Cash Assistance Programs - Other: $2,799,000
Public Welfare, Cash Assistance Programs - Other: $656,000
- Charges - Other: $3,474,000
Other: $3,295,000
Higher Education - Other: $2,865,000
Higher Education - Other: $2,462,000
Hospital Public: $2,417,000
Hospital Public: $2,263,000
Sewerage: $1,744,000
Sewerage: $1,314,000
Elementary and Secondary Education School Lunch: $1,028,000
Solid Waste Management: $1,020,000
Elementary and Secondary Education School Lunch: $998,000
Higher Education Auxiliary Enterprises: $902,000
Solid Waste Management: $883,000
Higher Education Auxiliary Enterprises: $756,000
Elementary and Secondary Education School Tuition and Transportation: $214,000
Elementary and Secondary Education - Other: $25,000
Elementary and Secondary Education - Other: $22,000
Parks and Recreation: $19,000
Elementary and Secondary Education School Tuition and Transportation: $14,000
- Construction - Other Higher Education: $4,081,000
Elementary and Secondary Education: $2,211,000
Police Protection: $1,773,000
Elementary and Secondary Education: $1,238,000
Housing and Community Development: $994,000
Police Protection: $685,000
Other Higher Education: $609,000
Health - Other: $203,000
General - Other: $189,000
Libraries: $179,000
Local Fire Protection: $36,000
General Public Buildings: $33,000
Protective Inspection and Regulation - Other: $25,000
Correctional Institutions: $21,000
Public Welfare - Other: $18,000
Solid Waste Management: $13,000
- Current Operations - Elementary and Secondary Education: $81,099,000
Elementary and Secondary Education: $73,325,000
Other Higher Education: $22,951,000
Other Higher Education: $21,752,000
Health - Other: $11,203,000
Police Protection: $9,161,000
Health - Other: $8,892,000
Public Welfare - Other: $8,521,000
Public Welfare - Other: $7,844,000
Police Protection: $6,707,000
Financial Administration: $5,109,000
Central Staff Services: $3,963,000
General - Other: $3,467,000
Correctional Institutions: $3,251,000
Correctional Institutions: $2,771,000
Water Utilities: $2,511,000
Housing and Community Development: $2,187,000
Air Transportation: $2,016,000
Water Utilities: $1,810,000
Central Staff Services: $1,702,000
Financial Administration: $1,641,000
Housing and Community Development: $1,420,000
Libraries: $1,264,000
Libraries: $1,227,000
General Public Buildings: $1,175,000
Solid Waste Management: $1,142,000
Solid Waste Management: $1,135,000
General Public Buildings: $1,135,000
Higher Education Auxiliary Enterprises: $992,000
Transit Utilities: $949,000
Transit Utilities: $917,000
General - Other: $871,000
Air Transportation: $797,000
Higher Education Auxiliary Enterprises: $791,000
Sewerage: $609,000
Local Fire Protection: $492,000
Protective Inspection and Regulation - Other: $474,000
Local Fire Protection: $443,000
Sewerage: $428,000
Parks and Recreation: $422,000
Protective Inspection and Regulation - Other: $404,000
Parks and Recreation: $284,000
Judicial and Legal Services: $220,000
Natural Resources - Other: $205,000
Judicial and Legal Services: $202,000
Natural Resources - Other: $171,000
- Federal Intergovernmental - Public Welfare: $6,659,000
Education: $5,661,000
Public Welfare: $4,960,000
Education: $970,000
Health and Hospitals: $937,000
Health and Hospitals: $711,000
Other: $623,000
Air Transportation: $612,000
Transit Utilities: $466,000
Transit Utilities: $204,000
Housing and Community Development: $139,000
Other: $120,000
- General - Interest on Debt: $1,739,000
Interest on Debt: $943,000
- Intergovernmental to Local - Other - Elementary and Secondary Education: $327,000
Other - Elementary and Secondary Education: $109,000
- Local Intergovernmental - Education: $1,919,000
Education: $1,508,000
Other: $134,000
Public Welfare: $129,000
Other: $124,000
Public Welfare: $119,000
- Long Term Debt - Beginning Outstanding - Unspecified Public Purpose: $30,985,000
Outstanding Unspecified Public Purpose: $27,500,000
Beginning Outstanding - Unspecified Public Purpose: $21,314,000
Outstanding Unspecified Public Purpose: $20,448,000
Beginning Outstanding - Public Debt for Private Purpose: $6,089,000
Outstanding Nonguaranteed - Industrial Revenue: $4,000,000
Beginning Outstanding - Public Debt for Private Purpose: $4,000,000
Retired Nonguaranteed - Public Debt for Private Purpose: $4,000,000
Retired Unspecified Public Purpose: $3,501,000
Retired Unspecified Public Purpose: $3,485,000
Issue, Unspecified Public Purpose: $2,635,000
Retired Nonguaranteed - Public Debt for Private Purpose: $2,089,000
- Miscellaneous - General Revenue - Other: $2,186,000
General Revenue - Other: $1,759,000
Interest Earnings: $732,000
Fines and Forfeits: $513,000
Fines and Forfeits: $461,000
Donations From Private Sources: $354,000
Rents: $309,000
Donations From Private Sources: $288,000
Rents: $260,000
Interest Earnings: $170,000
Sale of Property: $65,000
Sale of Property: $27,000
- Other Capital Outlay - Elementary and Secondary Education: $1,938,000
Other Higher Education: $938,000
Health - Other: $544,000
Police Protection: $460,000
Other Higher Education: $334,000
Transit Utilities: $302,000
Elementary and Secondary Education: $254,000
Water Utilities: $249,000
Water Utilities: $55,000
General - Other: $39,000
Solid Waste Management: $38,000
Central Staff Services: $17,000
- Other Funds - Cash and Securities: $8,495,000
Cash and Securities: $4,512,000
- Revenue - Water Utilities: $3,391,000
Water Utilities: $3,094,000
Transit Utilities: $434,000
Transit Utilities: $355,000
- Sinking Funds - Cash and Securities: $4,000,000
- State Intergovernmental - Education: $81,383,000
Education: $74,947,000
Public Welfare: $3,007,000
Public Welfare: $2,687,000
Other: $2,408,000
Other: $580,000
Housing and Community Development: $421,000
Housing and Community Development: $259,000
Transit Utilities: $208,000
Transit Utilities: $178,000
General Local Government Support: $114,000
General Local Government Support: $114,000
- Tax - Property: $37,147,000
Property: $33,775,000
General Sales and Gross Receipts: $13,943,000
General Sales and Gross Receipts: $9,265,000
Occupation and Business License - Other: $614,000
Other Selective Sales: $563,000
Occupation and Business License - Other: $445,000
Other License: $328,000
Other License: $321,000
Other Selective Sales: $289,000
Documentary and Stock Transfer: $223,000
Motor Vehicle License: $30,000
Motor Vehicle License: $26,000
- Total Salaries and Wages: $48,338,000
: $45,762,000
- Water Utilities - Interest on Debt: $57,000
Interest on Debt: $27,000
Stanly County government finances - Revenue in 2020:
- Assistance and Subsidies - Public Welfare, Cash Assistance Programs - Other: $2,799,000
Public Welfare, Cash Assistance Programs - Other: $656,000
- Charges - Other: $3,474,000
Other: $3,295,000
Higher Education - Other: $2,865,000
Higher Education - Other: $2,462,000
Hospital Public: $2,417,000
Hospital Public: $2,263,000
Sewerage: $1,744,000
Sewerage: $1,314,000
Elementary and Secondary Education School Lunch: $1,028,000
Solid Waste Management: $1,020,000
Elementary and Secondary Education School Lunch: $998,000
Higher Education Auxiliary Enterprises: $902,000
Solid Waste Management: $883,000
Higher Education Auxiliary Enterprises: $756,000
Elementary and Secondary Education School Tuition and Transportation: $214,000
Elementary and Secondary Education - Other: $25,000
Elementary and Secondary Education - Other: $22,000
Parks and Recreation: $19,000
Elementary and Secondary Education School Tuition and Transportation: $14,000
- Construction - Other Higher Education: $4,081,000
Elementary and Secondary Education: $2,211,000
Police Protection: $1,773,000
Elementary and Secondary Education: $1,238,000
Housing and Community Development: $994,000
Police Protection: $685,000
Other Higher Education: $609,000
Health - Other: $203,000
General - Other: $189,000
Libraries: $179,000
Local Fire Protection: $36,000
General Public Buildings: $33,000
Protective Inspection and Regulation - Other: $25,000
Correctional Institutions: $21,000
Public Welfare - Other: $18,000
Solid Waste Management: $13,000
- Current Operations - Elementary and Secondary Education: $81,099,000
Elementary and Secondary Education: $73,325,000
Other Higher Education: $22,951,000
Other Higher Education: $21,752,000
Health - Other: $11,203,000
Police Protection: $9,161,000
Health - Other: $8,892,000
Public Welfare - Other: $8,521,000
Public Welfare - Other: $7,844,000
Police Protection: $6,707,000
Financial Administration: $5,109,000
Central Staff Services: $3,963,000
General - Other: $3,467,000
Correctional Institutions: $3,251,000
Correctional Institutions: $2,771,000
Water Utilities: $2,511,000
Housing and Community Development: $2,187,000
Air Transportation: $2,016,000
Water Utilities: $1,810,000
Central Staff Services: $1,702,000
Financial Administration: $1,641,000
Housing and Community Development: $1,420,000
Libraries: $1,264,000
Libraries: $1,227,000
General Public Buildings: $1,175,000
Solid Waste Management: $1,142,000
Solid Waste Management: $1,135,000
General Public Buildings: $1,135,000
Higher Education Auxiliary Enterprises: $992,000
Transit Utilities: $949,000
Transit Utilities: $917,000
General - Other: $871,000
Air Transportation: $797,000
Higher Education Auxiliary Enterprises: $791,000
Sewerage: $609,000
Local Fire Protection: $492,000
Protective Inspection and Regulation - Other: $474,000
Local Fire Protection: $443,000
Sewerage: $428,000
Parks and Recreation: $422,000
Protective Inspection and Regulation - Other: $404,000
Parks and Recreation: $284,000
Judicial and Legal Services: $220,000
Natural Resources - Other: $205,000
Judicial and Legal Services: $202,000
Natural Resources - Other: $171,000
- Federal Intergovernmental - Public Welfare: $6,659,000
Education: $5,661,000
Public Welfare: $4,960,000
Education: $970,000
Health and Hospitals: $937,000
Health and Hospitals: $711,000
Other: $623,000
Air Transportation: $612,000
Transit Utilities: $466,000
Transit Utilities: $204,000
Housing and Community Development: $139,000
Other: $120,000
- General - Interest on Debt: $1,739,000
Interest on Debt: $943,000
- Intergovernmental to Local - Other - Elementary and Secondary Education: $327,000
Other - Elementary and Secondary Education: $109,000
- Local Intergovernmental - Education: $1,919,000
Education: $1,508,000
Other: $134,000
Public Welfare: $129,000
Other: $124,000
Public Welfare: $119,000
- Long Term Debt - Beginning Outstanding - Unspecified Public Purpose: $30,985,000
Outstanding Unspecified Public Purpose: $27,500,000
Beginning Outstanding - Unspecified Public Purpose: $21,314,000
Outstanding Unspecified Public Purpose: $20,448,000
Beginning Outstanding - Public Debt for Private Purpose: $6,089,000
Outstanding Nonguaranteed - Industrial Revenue: $4,000,000
Beginning Outstanding - Public Debt for Private Purpose: $4,000,000
Retired Nonguaranteed - Public Debt for Private Purpose: $4,000,000
Retired Unspecified Public Purpose: $3,501,000
Retired Unspecified Public Purpose: $3,485,000
Issue, Unspecified Public Purpose: $2,635,000
Retired Nonguaranteed - Public Debt for Private Purpose: $2,089,000
- Miscellaneous - General Revenue - Other: $2,186,000
General Revenue - Other: $1,759,000
Interest Earnings: $732,000
Fines and Forfeits: $513,000
Fines and Forfeits: $461,000
Donations From Private Sources: $354,000
Rents: $309,000
Donations From Private Sources: $288,000
Rents: $260,000
Interest Earnings: $170,000
Sale of Property: $65,000
Sale of Property: $27,000
- Other Capital Outlay - Elementary and Secondary Education: $1,938,000
Other Higher Education: $938,000
Health - Other: $544,000
Police Protection: $460,000
Other Higher Education: $334,000
Transit Utilities: $302,000
Elementary and Secondary Education: $254,000
Water Utilities: $249,000
Water Utilities: $55,000
General - Other: $39,000
Solid Waste Management: $38,000
Central Staff Services: $17,000
- Other Funds - Cash and Securities: $8,495,000
Cash and Securities: $4,512,000
- Revenue - Water Utilities: $3,391,000
Water Utilities: $3,094,000
Transit Utilities: $434,000
Transit Utilities: $355,000
- Sinking Funds - Cash and Securities: $4,000,000
- State Intergovernmental - Education: $81,383,000
Education: $74,947,000
Public Welfare: $3,007,000
Public Welfare: $2,687,000
Other: $2,408,000
Other: $580,000
Housing and Community Development: $421,000
Housing and Community Development: $259,000
Transit Utilities: $208,000
Transit Utilities: $178,000
General Local Government Support: $114,000
General Local Government Support: $114,000
- Tax - Property: $37,147,000
Property: $33,775,000
General Sales and Gross Receipts: $13,943,000
General Sales and Gross Receipts: $9,265,000
Occupation and Business License - Other: $614,000
Other Selective Sales: $563,000
Occupation and Business License - Other: $445,000
Other License: $328,000
Other License: $321,000
Other Selective Sales: $289,000
Documentary and Stock Transfer: $223,000
Motor Vehicle License: $30,000
Motor Vehicle License: $26,000
- Total Salaries and Wages: $48,338,000
: $45,762,000
- Water Utilities - Interest on Debt: $57,000
Interest on Debt: $27,000
Stanly County government finances - Debt in 2020:
- Assistance and Subsidies - Public Welfare, Cash Assistance Programs - Other: $2,799,000
Public Welfare, Cash Assistance Programs - Other: $656,000
- Charges - Other: $3,474,000
Other: $3,295,000
Higher Education - Other: $2,865,000
Higher Education - Other: $2,462,000
Hospital Public: $2,417,000
Hospital Public: $2,263,000
Sewerage: $1,744,000
Sewerage: $1,314,000
Elementary and Secondary Education School Lunch: $1,028,000
Solid Waste Management: $1,020,000
Elementary and Secondary Education School Lunch: $998,000
Higher Education Auxiliary Enterprises: $902,000
Solid Waste Management: $883,000
Higher Education Auxiliary Enterprises: $756,000
Elementary and Secondary Education School Tuition and Transportation: $214,000
Elementary and Secondary Education - Other: $25,000
Elementary and Secondary Education - Other: $22,000
Parks and Recreation: $19,000
Elementary and Secondary Education School Tuition and Transportation: $14,000
- Construction - Other Higher Education: $4,081,000
Elementary and Secondary Education: $2,211,000
Police Protection: $1,773,000
Elementary and Secondary Education: $1,238,000
Housing and Community Development: $994,000
Police Protection: $685,000
Other Higher Education: $609,000
Health - Other: $203,000
General - Other: $189,000
Libraries: $179,000
Local Fire Protection: $36,000
General Public Buildings: $33,000
Protective Inspection and Regulation - Other: $25,000
Correctional Institutions: $21,000
Public Welfare - Other: $18,000
Solid Waste Management: $13,000
- Current Operations - Elementary and Secondary Education: $81,099,000
Elementary and Secondary Education: $73,325,000
Other Higher Education: $22,951,000
Other Higher Education: $21,752,000
Health - Other: $11,203,000
Police Protection: $9,161,000
Health - Other: $8,892,000
Public Welfare - Other: $8,521,000
Public Welfare - Other: $7,844,000
Police Protection: $6,707,000
Financial Administration: $5,109,000
Central Staff Services: $3,963,000
General - Other: $3,467,000
Correctional Institutions: $3,251,000
Correctional Institutions: $2,771,000
Water Utilities: $2,511,000
Housing and Community Development: $2,187,000
Air Transportation: $2,016,000
Water Utilities: $1,810,000
Central Staff Services: $1,702,000
Financial Administration: $1,641,000
Housing and Community Development: $1,420,000
Libraries: $1,264,000
Libraries: $1,227,000
General Public Buildings: $1,175,000
Solid Waste Management: $1,142,000
Solid Waste Management: $1,135,000
General Public Buildings: $1,135,000
Higher Education Auxiliary Enterprises: $992,000
Transit Utilities: $949,000
Transit Utilities: $917,000
General - Other: $871,000
Air Transportation: $797,000
Higher Education Auxiliary Enterprises: $791,000
Sewerage: $609,000
Local Fire Protection: $492,000
Protective Inspection and Regulation - Other: $474,000
Local Fire Protection: $443,000
Sewerage: $428,000
Parks and Recreation: $422,000
Protective Inspection and Regulation - Other: $404,000
Parks and Recreation: $284,000
Judicial and Legal Services: $220,000
Natural Resources - Other: $205,000
Judicial and Legal Services: $202,000
Natural Resources - Other: $171,000
- Federal Intergovernmental - Public Welfare: $6,659,000
Education: $5,661,000
Public Welfare: $4,960,000
Education: $970,000
Health and Hospitals: $937,000
Health and Hospitals: $711,000
Other: $623,000
Air Transportation: $612,000
Transit Utilities: $466,000
Transit Utilities: $204,000
Housing and Community Development: $139,000
Other: $120,000
- General - Interest on Debt: $1,739,000
Interest on Debt: $943,000
- Intergovernmental to Local - Other - Elementary and Secondary Education: $327,000
Other - Elementary and Secondary Education: $109,000
- Local Intergovernmental - Education: $1,919,000
Education: $1,508,000
Other: $134,000
Public Welfare: $129,000
Other: $124,000
Public Welfare: $119,000
- Long Term Debt - Beginning Outstanding - Unspecified Public Purpose: $30,985,000
Outstanding Unspecified Public Purpose: $27,500,000
Beginning Outstanding - Unspecified Public Purpose: $21,314,000
Outstanding Unspecified Public Purpose: $20,448,000
Beginning Outstanding - Public Debt for Private Purpose: $6,089,000
Outstanding Nonguaranteed - Industrial Revenue: $4,000,000
Beginning Outstanding - Public Debt for Private Purpose: $4,000,000
Retired Nonguaranteed - Public Debt for Private Purpose: $4,000,000
Retired Unspecified Public Purpose: $3,501,000
Retired Unspecified Public Purpose: $3,485,000
Issue, Unspecified Public Purpose: $2,635,000
Retired Nonguaranteed - Public Debt for Private Purpose: $2,089,000
- Miscellaneous - General Revenue - Other: $2,186,000
General Revenue - Other: $1,759,000
Interest Earnings: $732,000
Fines and Forfeits: $513,000
Fines and Forfeits: $461,000
Donations From Private Sources: $354,000
Rents: $309,000
Donations From Private Sources: $288,000
Rents: $260,000
Interest Earnings: $170,000
Sale of Property: $65,000
Sale of Property: $27,000
- Other Capital Outlay - Elementary and Secondary Education: $1,938,000
Other Higher Education: $938,000
Health - Other: $544,000
Police Protection: $460,000
Other Higher Education: $334,000
Transit Utilities: $302,000
Elementary and Secondary Education: $254,000
Water Utilities: $249,000
Water Utilities: $55,000
General - Other: $39,000
Solid Waste Management: $38,000
Central Staff Services: $17,000
- Other Funds - Cash and Securities: $8,495,000
Cash and Securities: $4,512,000
- Revenue - Water Utilities: $3,391,000
Water Utilities: $3,094,000
Transit Utilities: $434,000
Transit Utilities: $355,000
- Sinking Funds - Cash and Securities: $4,000,000
- State Intergovernmental - Education: $81,383,000
Education: $74,947,000
Public Welfare: $3,007,000
Public Welfare: $2,687,000
Other: $2,408,000
Other: $580,000
Housing and Community Development: $421,000
Housing and Community Development: $259,000
Transit Utilities: $208,000
Transit Utilities: $178,000
General Local Government Support: $114,000
General Local Government Support: $114,000
- Tax - Property: $37,147,000
Property: $33,775,000
General Sales and Gross Receipts: $13,943,000
General Sales and Gross Receipts: $9,265,000
Occupation and Business License - Other: $614,000
Other Selective Sales: $563,000
Occupation and Business License - Other: $445,000
Other License: $328,000
Other License: $321,000
Other Selective Sales: $289,000
Documentary and Stock Transfer: $223,000
Motor Vehicle License: $30,000
Motor Vehicle License: $26,000
- Total Salaries and Wages: $48,338,000
: $45,762,000
- Water Utilities - Interest on Debt: $57,000
Interest on Debt: $27,000
Stanly County government finances - Cash and Securities in 2020:
- Assistance and Subsidies - Public Welfare, Cash Assistance Programs - Other: $2,799,000
Public Welfare, Cash Assistance Programs - Other: $656,000
- Charges - Other: $3,474,000
Other: $3,295,000
Higher Education - Other: $2,865,000
Higher Education - Other: $2,462,000
Hospital Public: $2,417,000
Hospital Public: $2,263,000
Sewerage: $1,744,000
Sewerage: $1,314,000
Elementary and Secondary Education School Lunch: $1,028,000
Solid Waste Management: $1,020,000
Elementary and Secondary Education School Lunch: $998,000
Higher Education Auxiliary Enterprises: $902,000
Solid Waste Management: $883,000
Higher Education Auxiliary Enterprises: $756,000
Elementary and Secondary Education School Tuition and Transportation: $214,000
Elementary and Secondary Education - Other: $25,000
Elementary and Secondary Education - Other: $22,000
Parks and Recreation: $19,000
Elementary and Secondary Education School Tuition and Transportation: $14,000
- Construction - Other Higher Education: $4,081,000
Elementary and Secondary Education: $2,211,000
Police Protection: $1,773,000
Elementary and Secondary Education: $1,238,000
Housing and Community Development: $994,000
Police Protection: $685,000
Other Higher Education: $609,000
Health - Other: $203,000
General - Other: $189,000
Libraries: $179,000
Local Fire Protection: $36,000
General Public Buildings: $33,000
Protective Inspection and Regulation - Other: $25,000
Correctional Institutions: $21,000
Public Welfare - Other: $18,000
Solid Waste Management: $13,000
- Current Operations - Elementary and Secondary Education: $81,099,000
Elementary and Secondary Education: $73,325,000
Other Higher Education: $22,951,000
Other Higher Education: $21,752,000
Health - Other: $11,203,000
Police Protection: $9,161,000
Health - Other: $8,892,000
Public Welfare - Other: $8,521,000
Public Welfare - Other: $7,844,000
Police Protection: $6,707,000
Financial Administration: $5,109,000
Central Staff Services: $3,963,000
General - Other: $3,467,000
Correctional Institutions: $3,251,000
Correctional Institutions: $2,771,000
Water Utilities: $2,511,000
Housing and Community Development: $2,187,000
Air Transportation: $2,016,000
Water Utilities: $1,810,000
Central Staff Services: $1,702,000
Financial Administration: $1,641,000
Housing and Community Development: $1,420,000
Libraries: $1,264,000
Libraries: $1,227,000
General Public Buildings: $1,175,000
Solid Waste Management: $1,142,000
Solid Waste Management: $1,135,000
General Public Buildings: $1,135,000
Higher Education Auxiliary Enterprises: $992,000
Transit Utilities: $949,000
Transit Utilities: $917,000
General - Other: $871,000
Air Transportation: $797,000
Higher Education Auxiliary Enterprises: $791,000
Sewerage: $609,000
Local Fire Protection: $492,000
Protective Inspection and Regulation - Other: $474,000
Local Fire Protection: $443,000
Sewerage: $428,000
Parks and Recreation: $422,000
Protective Inspection and Regulation - Other: $404,000
Parks and Recreation: $284,000
Judicial and Legal Services: $220,000
Natural Resources - Other: $205,000
Judicial and Legal Services: $202,000
Natural Resources - Other: $171,000
- Federal Intergovernmental - Public Welfare: $6,659,000
Education: $5,661,000
Public Welfare: $4,960,000
Education: $970,000
Health and Hospitals: $937,000
Health and Hospitals: $711,000
Other: $623,000
Air Transportation: $612,000
Transit Utilities: $466,000
Transit Utilities: $204,000
Housing and Community Development: $139,000
Other: $120,000
- General - Interest on Debt: $1,739,000
Interest on Debt: $943,000
- Intergovernmental to Local - Other - Elementary and Secondary Education: $327,000
Other - Elementary and Secondary Education: $109,000
- Local Intergovernmental - Education: $1,919,000
Education: $1,508,000
Other: $134,000
Public Welfare: $129,000
Other: $124,000
Public Welfare: $119,000
- Long Term Debt - Beginning Outstanding - Unspecified Public Purpose: $30,985,000
Outstanding Unspecified Public Purpose: $27,500,000
Beginning Outstanding - Unspecified Public Purpose: $21,314,000
Outstanding Unspecified Public Purpose: $20,448,000
Beginning Outstanding - Public Debt for Private Purpose: $6,089,000
Outstanding Nonguaranteed - Industrial Revenue: $4,000,000
Beginning Outstanding - Public Debt for Private Purpose: $4,000,000
Retired Nonguaranteed - Public Debt for Private Purpose: $4,000,000
Retired Unspecified Public Purpose: $3,501,000
Retired Unspecified Public Purpose: $3,485,000
Issue, Unspecified Public Purpose: $2,635,000
Retired Nonguaranteed - Public Debt for Private Purpose: $2,089,000
- Miscellaneous - General Revenue - Other: $2,186,000
General Revenue - Other: $1,759,000
Interest Earnings: $732,000
Fines and Forfeits: $513,000
Fines and Forfeits: $461,000
Donations From Private Sources: $354,000
Rents: $309,000
Donations From Private Sources: $288,000
Rents: $260,000
Interest Earnings: $170,000
Sale of Property: $65,000
Sale of Property: $27,000
- Other Capital Outlay - Elementary and Secondary Education: $1,938,000
Other Higher Education: $938,000
Health - Other: $544,000
Police Protection: $460,000
Other Higher Education: $334,000
Transit Utilities: $302,000
Elementary and Secondary Education: $254,000
Water Utilities: $249,000
Water Utilities: $55,000
General - Other: $39,000
Solid Waste Management: $38,000
Central Staff Services: $17,000
- Other Funds - Cash and Securities: $8,495,000
Cash and Securities: $4,512,000
- Revenue - Water Utilities: $3,391,000
Water Utilities: $3,094,000
Transit Utilities: $434,000
Transit Utilities: $355,000
- Sinking Funds - Cash and Securities: $4,000,000
- State Intergovernmental - Education: $81,383,000
Education: $74,947,000
Public Welfare: $3,007,000
Public Welfare: $2,687,000
Other: $2,408,000
Other: $580,000
Housing and Community Development: $421,000
Housing and Community Development: $259,000
Transit Utilities: $208,000
Transit Utilities: $178,000
General Local Government Support: $114,000
General Local Government Support: $114,000
- Tax - Property: $37,147,000
Property: $33,775,000
General Sales and Gross Receipts: $13,943,000
General Sales and Gross Receipts: $9,265,000
Occupation and Business License - Other: $614,000
Other Selective Sales: $563,000
Occupation and Business License - Other: $445,000
Other License: $328,000
Other License: $321,000
Other Selective Sales: $289,000
Documentary and Stock Transfer: $223,000
Motor Vehicle License: $30,000
Motor Vehicle License: $26,000
- Total Salaries and Wages: $48,338,000
: $45,762,000
- Water Utilities - Interest on Debt: $57,000
Interest on Debt: $27,000
Supplemental Security Income (SSI) in 2006:
- Total number of recipients: 1,068
- Number of aged recipients: 75
- Number of blind and disabled recipients: 993
- Number of recipients under 18: 230
- Number of recipients between 18 and 64: 692
- Number of recipients older than 64: 146
- Number of recipients also receiving OASDI: 378
- Amount of payments (thousands of dollars): 465
| Most common first names in Stanly County, NC among deceased individuals | ||
| Name | Count | Lived (average) |
|---|---|---|
| James | 543 | 72.6 years |
| John | 406 | 74.8 years |
| Mary | 404 | 78.1 years |
| William | 383 | 74.3 years |
| Robert | 307 | 71.8 years |
| George | 183 | 72.8 years |
| Charles | 149 | 70.3 years |
| Henry | 143 | 75.8 years |
| Thomas | 140 | 71.8 years |
| Ruby | 135 | 78.2 years |
| Most common last names in Stanly County, NC among deceased individuals | ||
| Last name | Count | Lived (average) |
|---|---|---|
| Smith | 432 | 76.3 years |
| Huneycutt | 262 | 76.3 years |
| Whitley | 262 | 75.9 years |
| Hatley | 261 | 77.7 years |
| Lowder | 252 | 75.5 years |
| Furr | 227 | 73.8 years |
| Burris | 223 | 77.6 years |
| Morton | 214 | 75.0 years |
| Thompson | 197 | 74.8 years |
| Almond | 191 | 76.3 years |
| Businesses in Stanly County, NC | ||||
| Name | Count | Name | Count | |
|---|---|---|---|---|
| ALDI | 1 | Lane Furniture | 1 | |
| AT&T | 1 | Lowe's | 1 | |
| Ace Hardware | 3 | Maurices | 1 | |
| Advance Auto Parts | 4 | McDonald's | 3 | |
| Applebee's | 1 | Nike | 1 | |
| Arby's | 1 | OfficeMax | 1 | |
| AutoZone | 1 | Papa John's Pizza | 1 | |
| Baskin-Robbins | 1 | Pizza Hut | 2 | |
| Blockbuster | 1 | Quality | 1 | |
| Burger King | 1 | Quiznos | 2 | |
| CVS | 3 | RadioShack | 1 | |
| Chevrolet | 1 | Rite Aid | 2 | |
| Dairy Queen | 1 | Rue21 | 1 | |
| Domino's Pizza | 2 | Ryan's Grill | 1 | |
| Dunkin Donuts | 3 | SONIC Drive-In | 1 | |
| FedEx | 5 | Sears | 1 | |
| Ford | 1 | Sleep Inn | 1 | |
| GNC | 2 | Subway | 7 | |
| GameStop | 1 | T-Mobile | 1 | |
| H&R Block | 2 | Taco Bell | 2 | |
| Hardee's | 1 | U-Haul | 4 | |
| Hilton | 1 | UPS | 2 | |
| Holiday Inn | 1 | Verizon Wireless | 1 | |
| Honda | 1 | Waffle House | 2 | |
| JCPenney | 1 | Walgreens | 1 | |
| KFC | 2 | Walmart | 2 | |
| Kincaid | 1 | Wendy's | 3 | |
| La-Z-Boy | 2 | YMCA | 1 | |
Stanly County on our top lists:
- #19 on the list of "Top 101 counties with the lowest ground withdrawal of fresh water for public supply (pop. 50,000+)"
- #77 on the list of "Top 101 counties with the lowest percentage of residents relocating to other counties in 2011 (pop. 50,000+)"
- #91 on the list of "Top 101 counties with the lowest percentage of residents relocating from other counties between 2010 and 2011 (pop. 50,000+)"