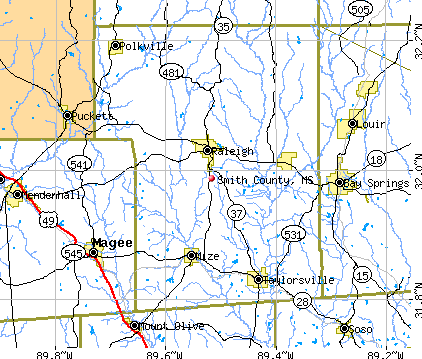
Smith County, Mississippi (MS)
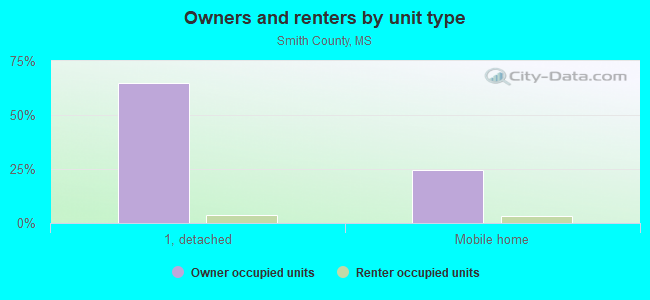
County owner-occupied free and clear houses and condos in 2010: 2,826
County owner-occupied houses and condos in 2000: 5,258
Renter-occupied apartments: 960 (it was 788 in 2000)
| % of renters here: | 13% |
| State: | 30% |
Land area: 636 sq. mi.
Water area: 1.4 sq. mi.
Population density: 22 people per square mile (low).
Industries providing employment: Educational, health and social services (23.9%), Manufacturing (20.7%), Transportation and warehousing,and utilities (12.9%).
Type of workers:
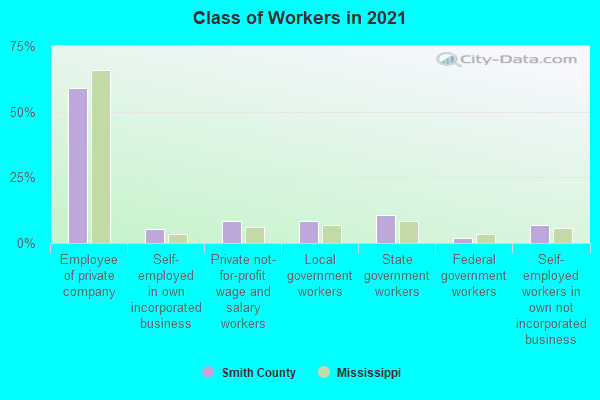
- Private wage or salary: 75%
- Government: 18%
- Self-employed, not incorporated: 7%
- Unpaid family work: 0%
- OSM Map
- General Map
- Google Map
- MSN Map

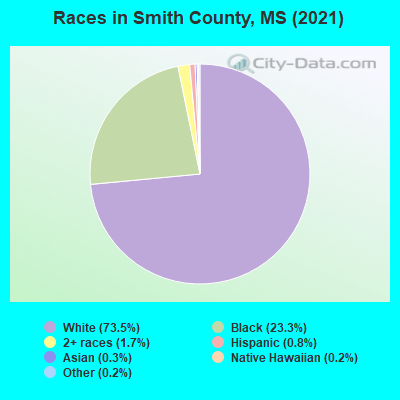
- 10,34473.4%White Non-Hispanic Alone
- 3,39724.1%Black Non-Hispanic Alone
- 1991.4%Two or more races
- 660.5%Hispanic or Latino
- 470.3%Asian alone
- 230.2%Native Hawaiian and Other
Pacific Islander alone - 150.1%Some other race alone
| Median resident age: | 43.7 years |
| Mississippi median age: | 38.9 years |
| Males: 6,693 | |
| Females: 7,526 |

 | simpson county (4 replies) |
| Move over Kansas. Smith County, MS is the "Tornado Capital of America." (5 replies) |
| Ole Miss for Graduate School. (74 replies) |
| Crank up the Banjo Music (They's burnin crosses AGIN!) (16 replies) |
| the Beer Ban in Mississippi has been lifted!!!! (68 replies) |
| Best City in MS? (17 replies) |
| Smith County: | 2.0 people |
| Mississippi: | 3 people |
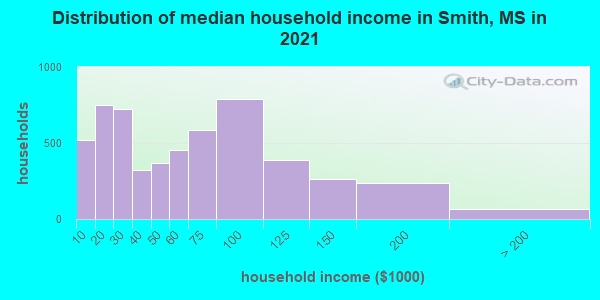
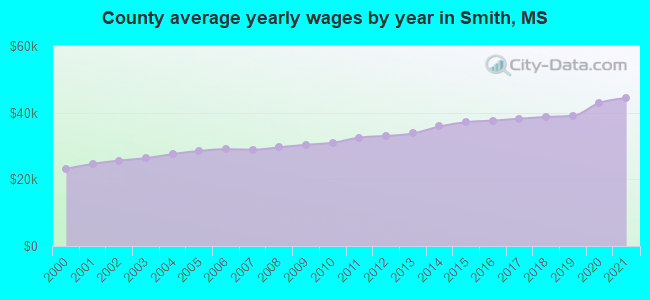
Estimated median household income in 2022: $51,722 ($30,840 in 1999)
| This county: | $51,722 |
| Mississippi: | $52,719 |
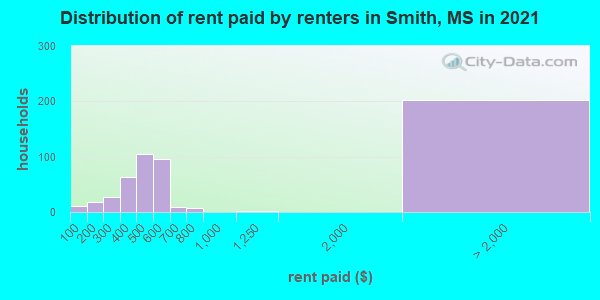
Median contract rent in 2022 for apartments: $451 (lower quartile is $337, upper quartile is $583)
| This county: | $451 |
| State: | $656 |
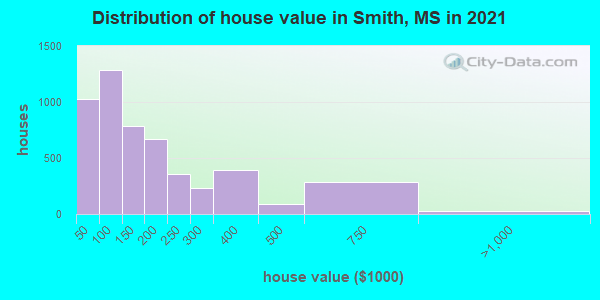
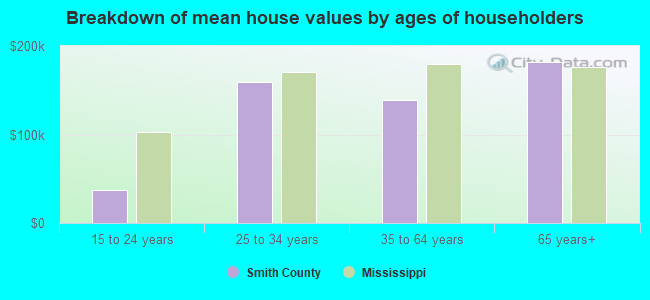
Estimated median house or condo value in 2022: $129,354 (it was $54,000 in 2000)
| Smith: | $129,354 |
| Mississippi: | $162,500 |
Median monthly housing costs for homes and condos with a mortgage: $1,046
Median monthly housing costs for units without a mortgage: $351
Institutionalized population: 88
Crime in 2021 (reported by the sheriff's office or county police, not the county total):
- Murders: 1
- Rapes: 0
- Robberies: 0
- Assaults: 5
- Burglaries: 17
- Thefts: 33
- Auto thefts: 17
Crime in 1987 (reported by the sheriff's office or county police, not the county total):
- Murders: 1
- Rapes: 0
- Robberies: 0
- Assaults: 0
- Burglaries: 2
- Thefts: 0
- Auto thefts: 0
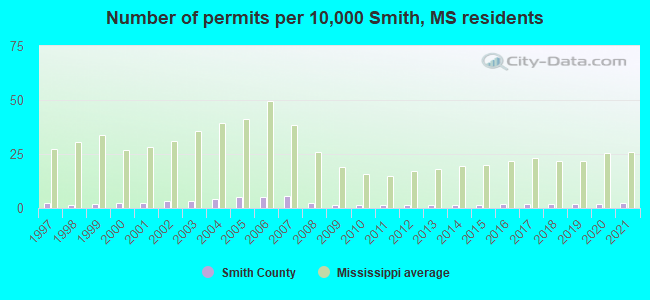
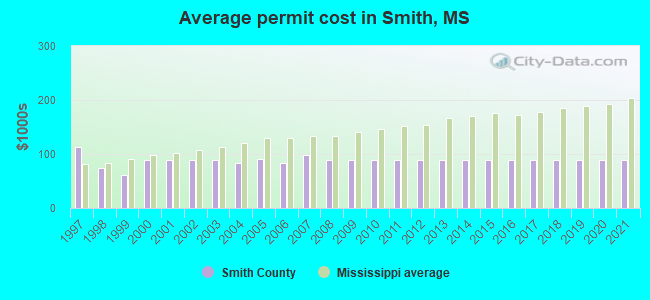
Single-family new house construction building permits:
- 2022: 4 buildings, average cost: $87,500
- 2021: 4 buildings, average cost: $87,500
- 2020: 3 buildings, average cost: $87,500
- 2019: 3 buildings, average cost: $87,500
- 2018: 3 buildings, average cost: $87,500
- 2017: 3 buildings, average cost: $87,500
- 2016: 3 buildings, average cost: $87,500
- 2015: 2 buildings, average cost: $87,500
- 2014: 2 buildings, average cost: $87,500
- 2013: 2 buildings, average cost: $87,500
- 2012: 2 buildings, average cost: $87,500
- 2011: 2 buildings, average cost: $87,500
- 2010: 2 buildings, average cost: $87,500
- 2009: 2 buildings, average cost: $87,500
- 2008: 4 buildings, average cost: $87,500
- 2007: 9 buildings, average cost: $98,600
- 2006: 8 buildings, average cost: $84,400
- 2005: 8 buildings, average cost: $90,000
- 2004: 7 buildings, average cost: $84,400
- 2003: 5 buildings, average cost: $87,500
- 2002: 5 buildings, average cost: $87,500
- 2001: 4 buildings, average cost: $87,500
- 2000: 4 buildings, average cost: $88,100
- 1999: 3 buildings, average cost: $62,400
- 1998: 2 buildings, average cost: $75,000
- 1997: 4 buildings, average cost: $112,500
Median real estate property taxes paid for housing units with mortgages in 2022: $860 (0.6%)
Median real estate property taxes paid for housing units with no mortgage in 2022: $473 (0.4%)
| Smith County: | 18.2% |
| Mississippi: | 19.1% |
Median age of residents in 2022: 43.7 years old
(Males: 44.2 years old, Females: 43.2 years old)
(Median age for: White residents: 44.8 years old, Black residents: 35.3 years old, Asian residents: 59.5 years old, Hispanic or Latino residents: 25.1 years old)
Fair market rent in 2006 for a 1-bedroom apartment in Smith County is $386 a month.
Fair market rent for a 2-bedroom apartment is $455 a month.
Fair market rent for a 3-bedroom apartment is $547 a month.
Cities in this county include: Taylorsville, Raleigh, Mize, Polkville, Sylvarena.
Neighboring counties: Pima County, Arizona  , Jefferson County , Crisp County, Georgia
  , Lincoln County
  , Wilcox County, Alabama , Hood County, Texas , Tattnall County, Georgia .
| Here: | 2.4% |
| Mississippi: | 2.6% |
Current college students: 444
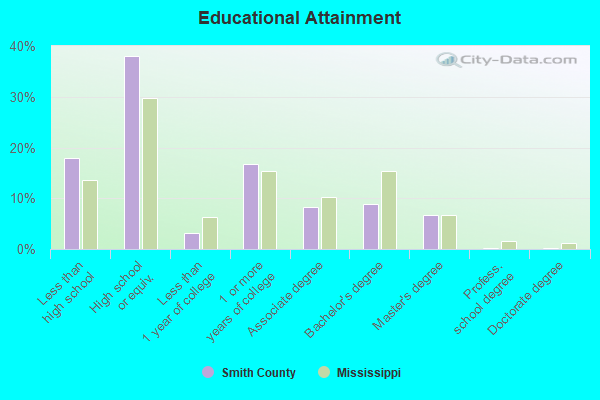
People 25 years of age or older with a high school degree or higher: 82.0%
People 25 years of age or older with a bachelor's degree or higher: 14.5%
Number of foreign born residents: 116 (56.6% naturalized citizens)
| Smith County: | 0.8% |
| Whole state: | 2.2% |
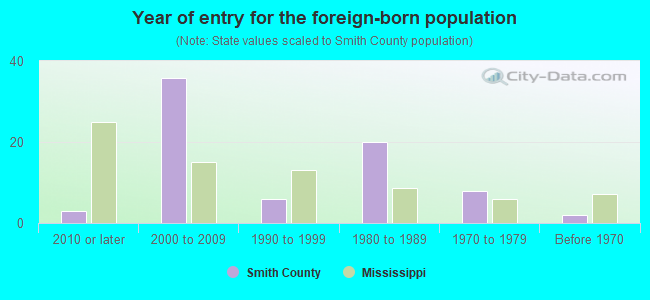
- Year of entry for the foreign-born population
- 82010 or later
- 362000 to 2009
- 71990 to 1999
- 201980 to 1989
- 81970 to 1979
- 2Before 1970
Mean travel time to work (commute): minutes
Percentage of county residents living and working in this county: 94.5%
Housing units in structures:
- One, detached: 4,586
- One, attached: 35
- Two: 57
- 3 or 4: 42
- 5 to 9: 46
- 10 to 19: 35
- 20 or more: 38
- Mobile homes: 1,956
- Boats, RVs, vans, etc.: 32
Housing units in Smith County with a mortgage: 1,722 (65 second mortgage, 0 home equity loan, 58 both second mortgage and home equity loan)
Houses without a mortgage: 54
| Here: | 1.8% with mortgage |
| State: | 97.5% with mortgage |
Religion statistics for Smith County
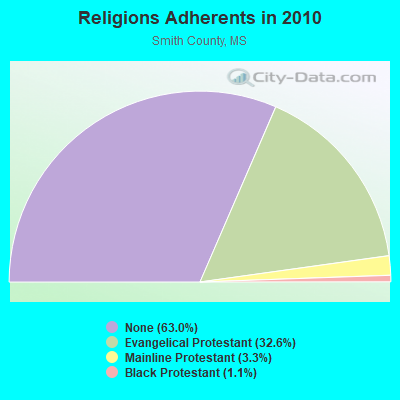
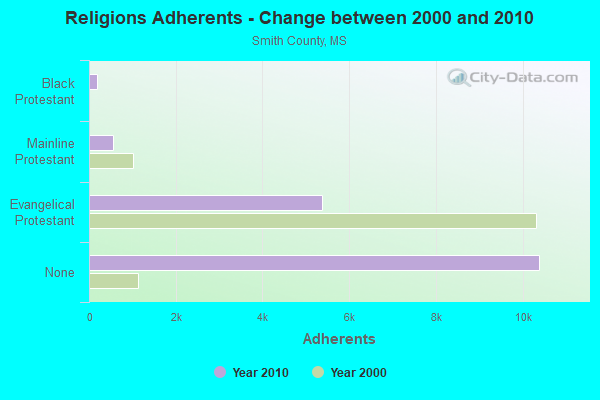
| Religion | Adherents | Congregations |
|---|---|---|
| Evangelical Protestant | 5,368 | 34 |
| Mainline Protestant | 544 | 10 |
| Black Protestant | 187 | 1 |
| Other | 1 | 1 |
| Catholic | - | - |
| None | 10,391 | - |
Source: Clifford Grammich, Kirk Hadaway, Richard Houseal, Dale E.Jones, Alexei Krindatch, Richie Stanley and Richard H.Taylor. 2012. 2010 U.S.Religion Census: Religious Congregations & Membership Study. Association of Statisticians of American Religious Bodies. Jones, Dale E., et al. 2002. Congregations and Membership in the United States 2000. Nashville, TN: Glenmary Research Center.
Food Environment Statistics:
| Smith County: | 3.76 / 10,000 pop. |
| State: | 2.08 / 10,000 pop. |
| This county: | 1.88 / 10,000 pop. |
| Mississippi: | 0.80 / 10,000 pop. |
| Smith County: | 1.88 / 10,000 pop. |
| Mississippi: | 6.36 / 10,000 pop. |
| This county: | 1.25 / 10,000 pop. |
| State: | 5.03 / 10,000 pop. |
| Smith County: | 12.0% |
| Mississippi: | 12.3% |
| Smith County: | 33.2% |
| State: | 33.1% |
| Here: | 15.6% |
| State: | 14.4% |
Agriculture in Smith County:
Average size of farms: 143 acresAverage value of agricultural products sold per farm: $212,280
Average value of crops sold per acre for harvested cropland: $263.49
The value of nursery, greenhouse, floriculture, and sod as a percentage of the total market value of agricultural products sold: 0.02%
The value of livestock, poultry, and their products as a percentage of the total market value of agricultural products sold: 97.82%
Average total farm production expenses per farm: $145,366
Harvested cropland as a percentage of land in farms: 12.27%
Average market value of all machinery and equipment per farm: $47,719
The percentage of farms operated by a family or individual: 97.39%
Average age of principal farm operators: 56 years
Average number of cattle and calves per 100 acres of all land in farms: 21.50
Milk cows as a percentage of all cattle and calves: 0.04%
Corn for grain: 41 harvested acres
Soybeans for beans: 3 harvested acres
Vegetables: 485 harvested acres
Land in orchards: 193 acres
Earthquake activity:
Smith County-area historical earthquake activity is significantly above Mississippi state average. It is 156% greater than the overall U.S. average.On 10/24/1997 at 08:35:17, a magnitude 4.9 (4.8 MB, 4.2 MS, 4.9 LG, Depth: 6.2 mi, Class: Light, Intensity: IV - V) earthquake occurred 145.2 miles away from Smith County center
On 1/18/1999 at 07:00:53, a magnitude 4.8 (4.8 MB, 4.0 LG, Depth: 0.6 mi) earthquake occurred 164.3 miles away from the county center
On 11/7/2004 at 11:20:21, a magnitude 4.3 (4.3 MW, Depth: 3.1 mi) earthquake occurred 103.4 miles away from the county center
On 6/24/1975 at 11:11:36, a magnitude 4.5 (4.5 MB) earthquake occurred 154.6 miles away from the county center
On 3/25/1976 at 00:41:20, a magnitude 5.0 (4.9 MB, 5.0 LG, Class: Moderate, Intensity: VI - VII) earthquake occurred 256.8 miles away from Smith County center
On 4/29/2003 at 08:59:39, a magnitude 4.9 (4.4 MB, 4.6 MW, 4.9 LG) earthquake occurred 284.1 miles away from the county center
Magnitude types: regional Lg-wave magnitude (LG), body-wave magnitude (MB), surface-wave magnitude (MS), moment magnitude (MW)
Most recent natural disasters:
- Mississippi Severe Storms, Tornadoes, Straight-line Winds, And Flooding, Incident Period: April 22, 2020 - April 23, 2020, Major Disaster (Presidential) Declared DR-4551-MS: July 9, 2020, FEMA Id: 4551, Natural disaster type: Storm, Tornado, Flood, Wind
- Mississippi Severe Storms, Tornadoes, Straight-line Winds, And Flooding, Incident Period: April 12, 2020, FEMA Id: 4536, Natural disaster type: Storm, Tornado, Flood, Wind
- Mississippi Covid-19 Pandemic, Incident Period: January 20, 2020, FEMA Id: 4528, Natural disaster type: Other
- Mississippi Severe Storm, Straight-line Winds, And Flooding, Incident Period: October 26, 2019, FEMA Id: 4470, Natural disaster type: Storm, Flood, Wind
- Mississippi Hurricane Isaac, Incident Period: August 26, 2012 to September 11, 2012, Major Disaster (Presidential) Declared DR-4081: August 29, 2012, FEMA Id: 4081, Natural disaster type: Hurricane
- Mississippi Severe Storms, Tornadoes, Straight-line Winds, and Associated Flooding, Incident Period: April 15, 2011 to April 28, 2011, Major Disaster (Presidential) Declared DR-1972: April 29, 2011, FEMA Id: 1972, Natural disaster type: Storm, Tornado, Flood, Wind
- Mississippi Hurricane Katrina, Incident Period: August 29, 2005 to October 14, 2005, Major Disaster (Presidential) Declared DR-1604: August 29, 2005, FEMA Id: 1604, Natural disaster type: Hurricane
- Mississippi Hurricane Dennis, Incident Period: July 10, 2005 to July 15, 2005, Major Disaster (Presidential) Declared DR-1594: July 10, 2005, FEMA Id: 1594, Natural disaster type: Hurricane
- Mississippi Severe Storms, Tornadoes and Flooding, Incident Period: April 06, 2003 to April 25, 2003, Major Disaster (Presidential) Declared DR-1459: April 24, 2003, FEMA Id: 1459, Natural disaster type: Storm, Tornado, Flood
- Mississippi High Winds, Severe Storm, Tornadoes, Incident Period: November 21, 1992 to November 22, 1992, Major Disaster (Presidential) Declared DR-968: November 25, 1992, FEMA Id: 968, Natural disaster type: Storm, Tornado, Wind
- 4 other natural disasters have been reported since 1953.
The number of natural disasters in Smith County (14) is near the US average (15).
Major Disasters (Presidential) Declared: 10
Emergencies Declared: 1
Causes of natural disasters: Floods: 7, Storms: 7, Tornadoes: 6, Winds: 5, Hurricanes: 4, Drought: 1, Freeze: 1, Heavy Rain: 1, Other: 1 (Note: some incidents may be assigned to more than one category).
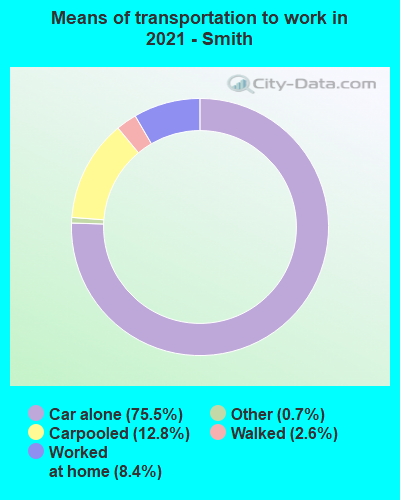
Means of transportation to work:
- Drove a car alone: 2,304 (72.4%)
- Carpooled: 467 (14.7%)
- Taxicab, motorcycle, or other means: 2 (0.1%)
- Walked: 101 (3.2%)
- Worked at home: 374 (11.8%)
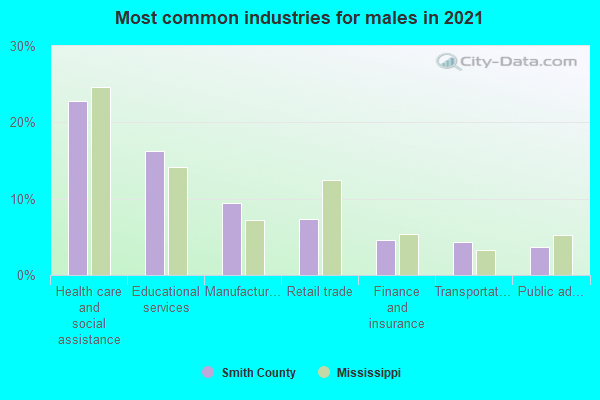
- Health care and social assistance (22%)
- Educational services (11%)
- Manufacturing (7%)
- Retail trade (7%)
- Finance and insurance (5%)
- Information (4%)
- Transportation and warehousing (3%)
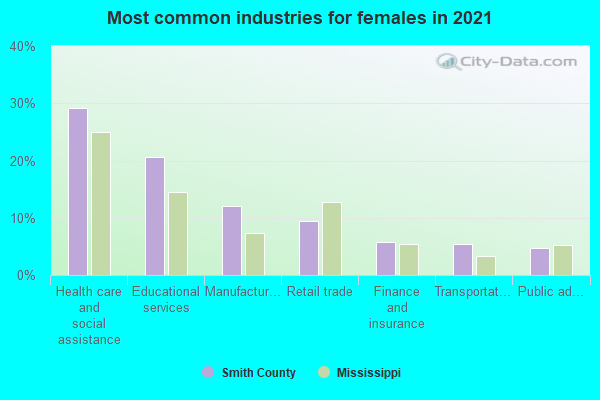
- Health care and social assistance (31%)
- Educational services (16%)
- Manufacturing (10%)
- Retail trade (9%)
- Finance and insurance (7%)
- Information (5%)
- Transportation and warehousing (5%)
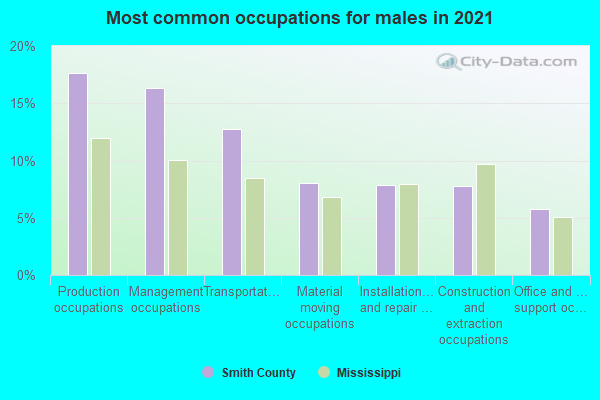
- Management occupations (17%)
- Production occupations (16%)
- Transportation occupations (15%)
- Installation, maintenance, and repair occupations (9%)
- Construction and extraction occupations (7%)
- Material moving occupations (7%)
- Sales and related occupations (6%)
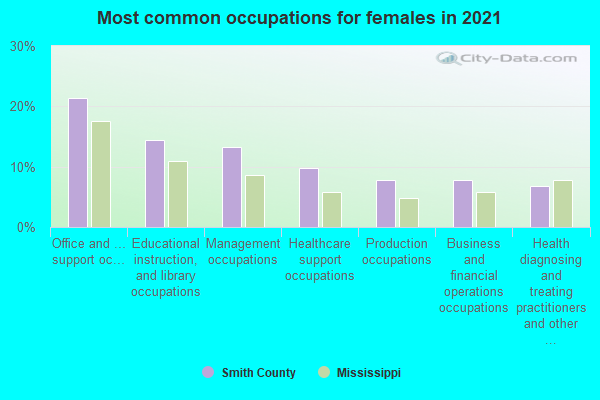
- Office and administrative support occupations (21%)
- Management occupations (14%)
- Educational instruction, and library occupations (11%)
- Healthcare support occupations (11%)
- Health diagnosing and treating practitioners and other technical occupations (8%)
- Business and financial operations occupations (8%)
- Health technologists and technicians (7%)
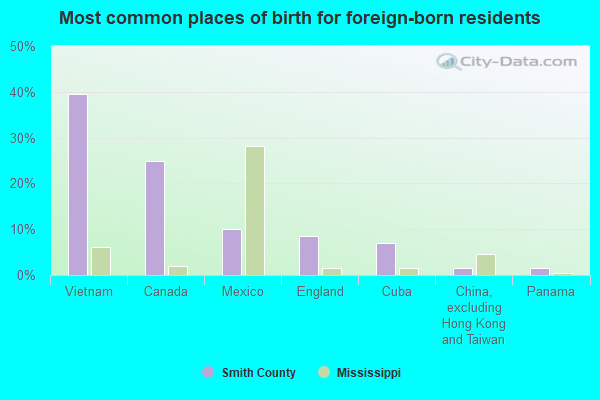
- Vietnam (37%)
- Canada (24%)
- England (11%)
- Mexico (9%)
- Cuba (6%)
- China, excluding Hong Kong and Taiwan (3%)
- Costa Rica (2%)
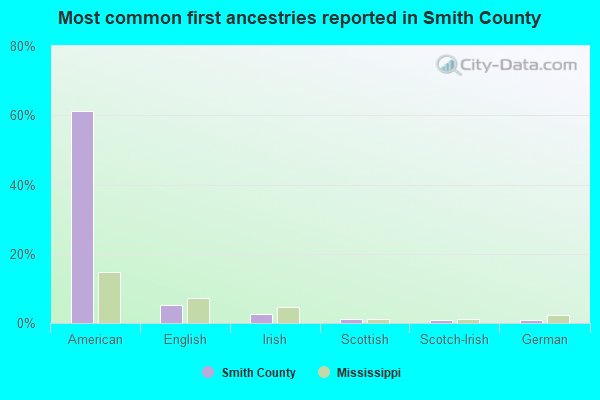
- American (67%)
- English (5%)
- Irish (2%)
- German (1%)
- Scottish (1%)
- Scotch-Irish (1%)
- Welsh (1%)
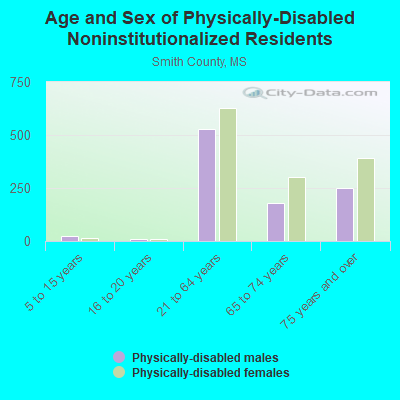
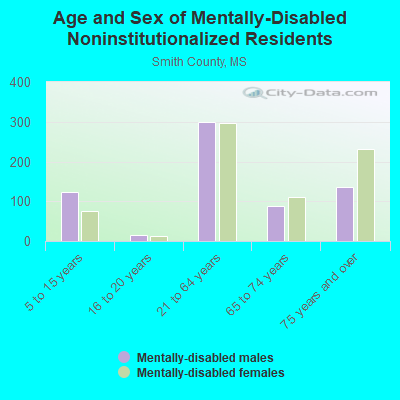
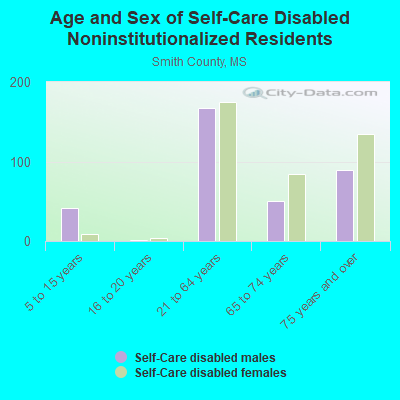
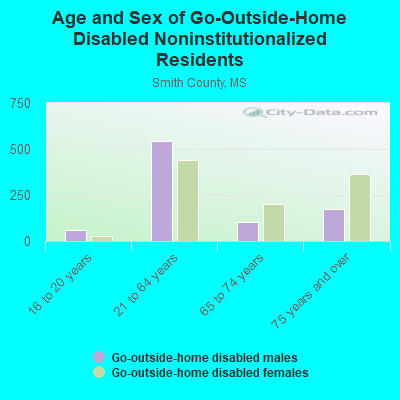
19 people in group homes intended for adults
People in group quarters in Smith County, Mississippi in 2000:
- 90 people in other noninstitutional group quarters
- 22 people in local jails and other confinement facilities (including police lockups)
- 19 people in homes for the mentally retarded
5.81% of this county's 2021 resident taxpayers lived in other counties in 2020 ($41,515 average adjusted gross income)
| Here: | 5.81% |
| Mississippi average: | 6.85% |
10 or fewer of this county's residents moved from foreign countries.
5.15% relocated from other counties in Mississippi ($36,744 average AGI)
0.67% relocated from other states ($4,771 average AGI)
Smith County: 0.67% Mississippi average: 2.80%
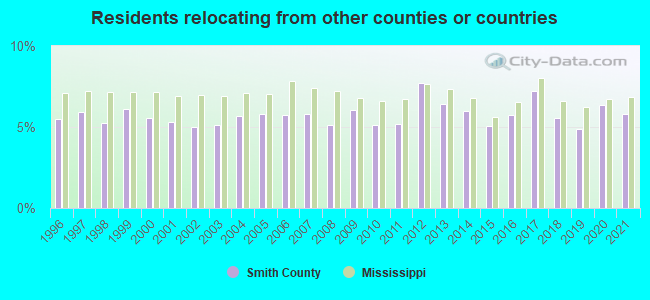
Top counties from which taxpayers relocated into this county between 2020 and 2021:
| from Jones County, MS | |
| from Simpson County, MS | |
| from Rankin County, MS | |
| from Jasper County, MS | |
| from Covington County, MS | |
| from Scott County, MS |
6.01% of this county's 2020 resident taxpayers moved to other counties in 2021 ($37,357 average adjusted gross income)
| Here: | 6.01% |
| Mississippi average: | 7.03% |
10 or fewer of this county's residents moved to foreign countries.
5.10% relocated to other counties in Mississippi ($31,789 average AGI)
0.92% relocated to other states ($5,565 average AGI)
Smith County: 0.92% Mississippi average: 2.99%
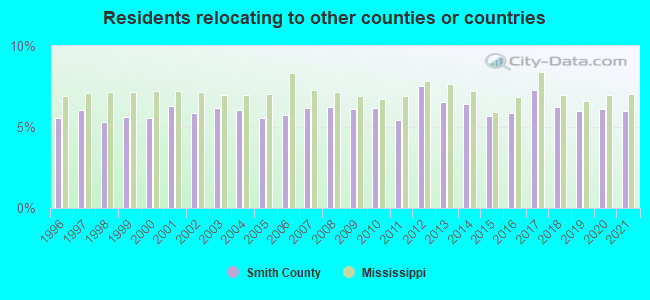
Top counties to which taxpayers relocated from this county between 2020 and 2021:
| to Simpson County, MS | |
| to Jones County, MS | |
| to Rankin County, MS | |
| to Jasper County, MS | |
| to Covington County, MS | |
| to Scott County, MS |
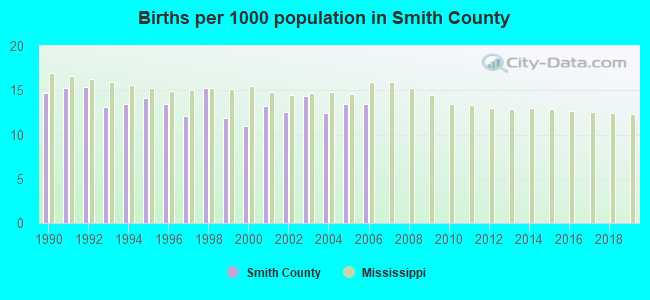
Births per 1000 population from 1990 to 1999: 13.9
Births per 1000 population from 2000 to 2006: 12.9
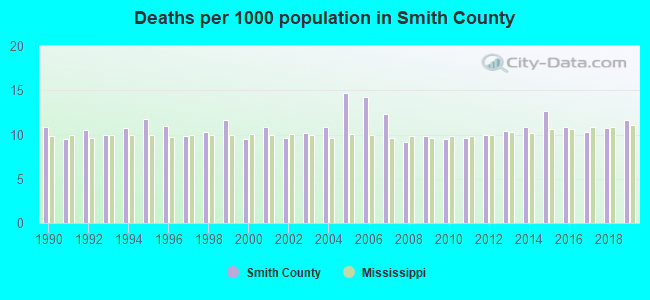
Deaths per 1000 population from 1990 to 1999: 10.6
Deaths per 1000 population from 2000 to 2009: 11.1
Deaths per 1000 population from 2010 to 2020: 10.8
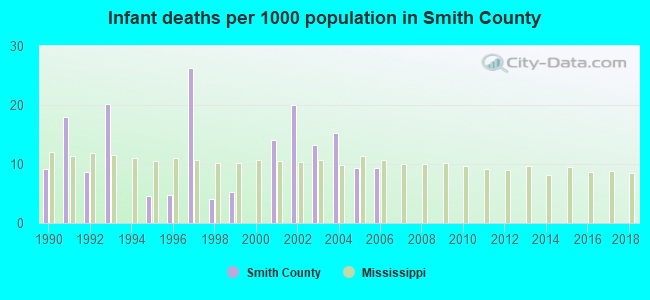
Infant deaths per 1000 live births from 1990 to 1999: 10.1
Infant deaths per 1000 live births from 2000 to 2006: 11.6
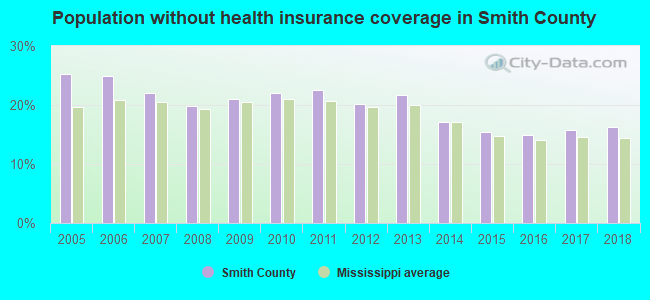
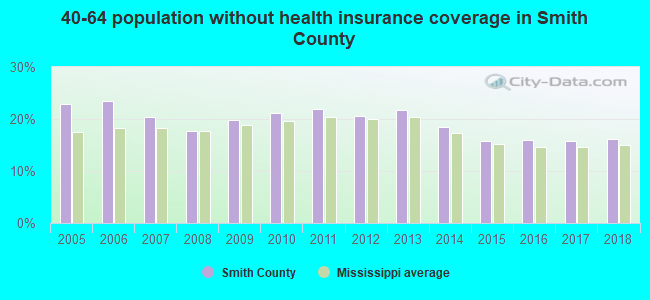
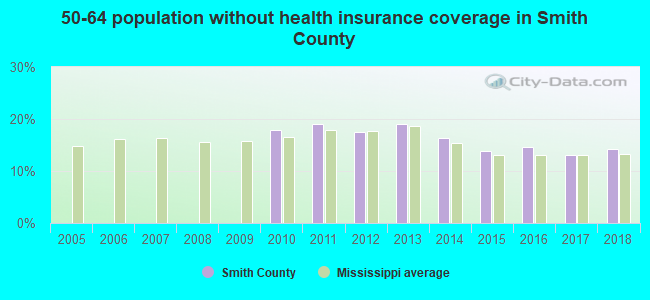
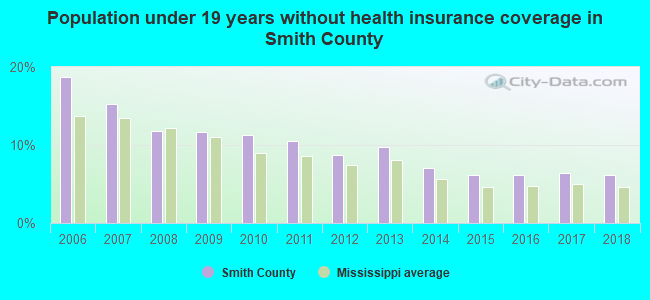
Persons under 19 years old without health insurance coverage in 2018: 6.1%

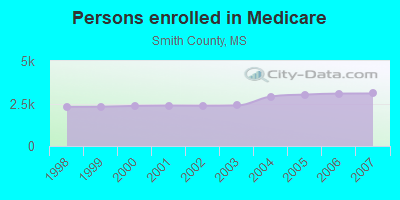
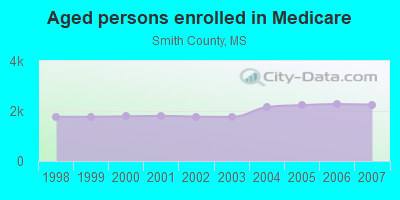
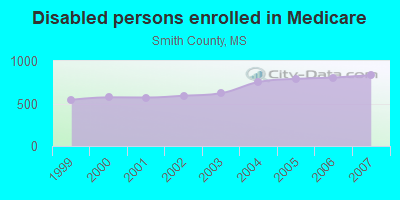
Persons enrolled in hospital insurance and/or supplemental medical insurance (Medicare) in July 1, 2007: 3,090 (2,257 aged, 833 disabled)
Children under 18 without health insurance coverage in 2007: 427 (10%)
Most common underlying causes of death in Smith County, Mississippi in 1999 - 2019:
- Acute myocardial infarction, unspecified (416)
- Bronchus or lung, unspecified - Malignant neoplasms (246)
- Congestive heart failure (148)
- Chronic obstructive pulmonary disease, unspecified (119)
- Atherosclerotic heart disease (79)
- Alzheimer disease, unspecified (22)
- Stroke, not specified as haemorrhage or infarction (11)
Population without health insurance coverage in 2000: 17%
Children under 18 without health insurance coverage in 2000: 13%
Medical specialist MDs per 100,000 population in 2005: 1,177
Total births per 100,000 population, July 2005 - July 2006 : 7
Total deaths per 100,000 population, July 2005 - July 2006: 31
Household type by relationship:
Households: 14,219- Male householders: 2,840 (967 living alone), Female householders: 2,735 (949 living alone)
2,640 spouses (2,640 opposite-sex spouses), 101 unmarried partners, (97 opposite-sex unmarried partners), 4,071 children (3,824 natural, 103 adopted, 146 stepchildren), 521 grandchildren, 201 brothers or sisters, 249 parents, 0 foster children, 419 other relatives, 259 non-relatives
- In group quarters: 146
Size of family households: 1,847 2-persons, 776 3-persons, 534 4-persons, 210 5-persons, 122 6-persons, 98 7-or-more-persons.
Size of nonfamily households: 1,919 1-person, 91 2-persons.
1,578 married couples with children.
991 single-parent households (171 men, 820 women).
97.6% of residents of Smith speak English at home.
1.2% of residents speak Spanish at home (13% speak English very well, 80% speak English well, 7% speak English not well).
0.4% of residents speak other Indo-European language at home (100% speak English very well).
0.8% of residents speak Asian or Pacific Island language at home (78% speak English very well, 12% speak English well, 10% speak English not well).
In fiscal year 2004:
Federal Government expenditure: $80,406,000 ($5,071 per capita)
Department of Defense expenditure: $2,231,000
Federal direct payments to individuals for retirement and disability: $35,742,000
Federal other direct payments to individuals: $17,120,000
Federal direct payments not to individuals: $203,000
Federal grants: $23,880,000
Federal procurement contracts: $419,000 ($25,000 Department of Defense)
Federal salaries and wages: $3,043,000 ($932,000 Department of Defense)
Federal Government direct loans: $1,357,000
Federal guaranteed/insured loans: $5,437,000
Federal Government insurance: $1,717,000
Population change from April 1, 2000 to July 1, 2005:
Births: 1,127| Here: | 70 per 1000 residents |
| State: | 78 per 1000 residents |
Deaths: 835
| Here: | 52 per 1000 residents |
| State: | 51 per 1000 residents |
Net international migration: +19
| Here: | +1 per 1000 residents |
| State: | +4 per 1000 residents |
Net internal migration: -410
| Here: | |
| State: |
Total withdrawal of fresh water for public supply: 3.65 millions of gallons per day (all from ground)
| Here: | 7.2 |
| State: | 6.3 |
| Here: | 6.3 |
| State: | 4.8 |
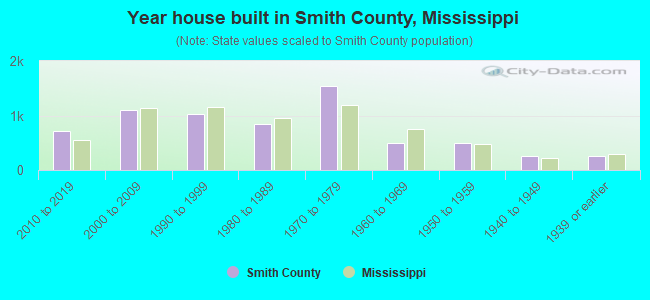
- Year house built in Smith County, Mississippi
- 322020 or later
- 7422010 to 2019
- 1,1202000 to 2009
- 8781990 to 1999
- 8461980 to 1989
- 1,5301970 to 1979
- 3881960 to 1969
- 6321950 to 1959
- 3111940 to 1949
- 2391939 or earlier
- Rooms in owner-occupied houses in Smith County, Mississippi
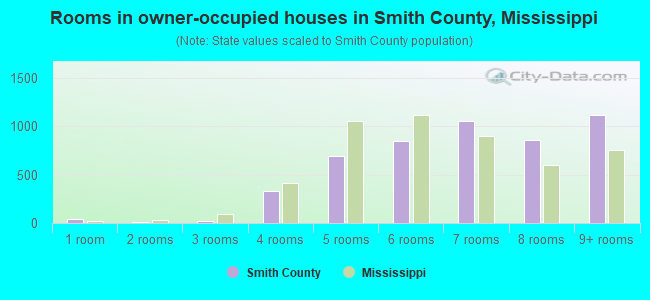
- 431 room
- 72 rooms
- 353 rooms
- 4174 rooms
- 4735 rooms
- 8766 rooms
- 8777 rooms
- 9478 rooms
- 1,2969+ rooms
- Rooms in renter-occupied apartments in Smith County, Mississippi
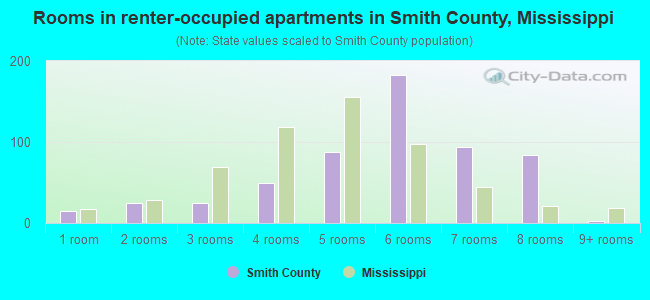
- 161 room
- 362 rooms
- 183 rooms
- 864 rooms
- 975 rooms
- 1416 rooms
- 2087 rooms
- 1298 rooms
- 19+ rooms
- Bedrooms in owner-occupied houses in Smith County, Mississippi
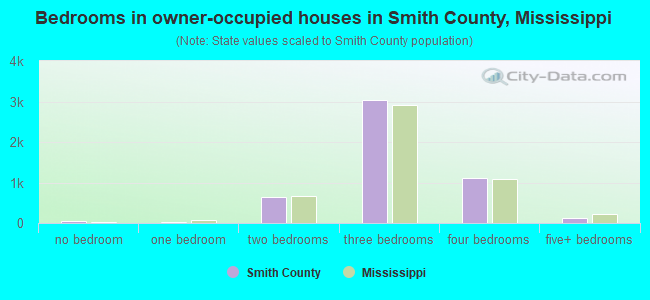
- 52no bedroom
- 231 bedroom
- 5262 bedrooms
- 2,8763 bedrooms
- 1,3384 bedrooms
- 1175+ bedrooms
- Bedrooms in renter-occupied apartments in Smith County, Mississippi
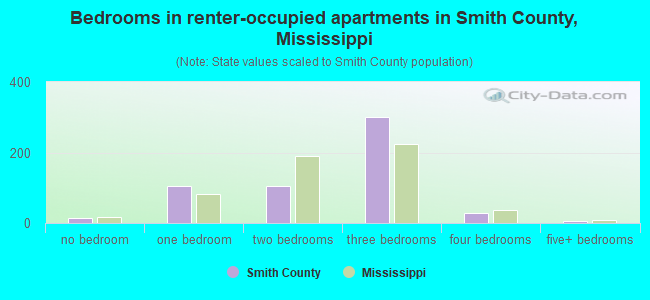
- 17no bedroom
- 1531 bedroom
- 1062 bedrooms
- 3713 bedrooms
- 674 bedrooms
- 25+ bedrooms
- Cars and other vehicles available in Smith County in owner-occupied houses/condos
- 335no vehicle
- 1,6161 vehicle
- 1,8122 vehicles
- 8613 vehicles
- 1954 vehicles
- 925+ vehicles
- Cars and other vehicles available in Smith County in renter-occupied apartments
- 64no vehicle
- 4761 vehicle
- 952 vehicles
- 743 vehicles
- 04 vehicles
- 05+ vehicles
96.8% of Smith County residents lived in the same house 1 years ago.
Out of people who lived in different houses, 33% lived in this county.
Out of people who lived in different counties, 91% lived in Mississippi.
| Smith County: | 96.8% |
| State average: | 88.9% |
Place of birth for U.S.-born residents:
- This state: 12,246
- Other state: 1,770
- Northeast: 129
- Midwest: 291
- South: 982
- West: 391
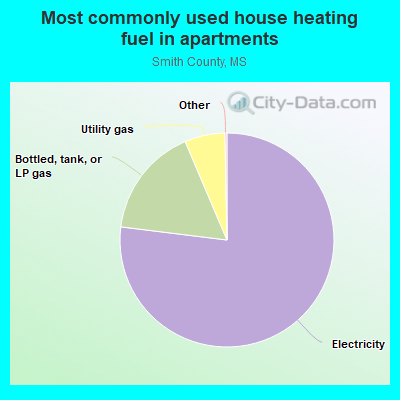
- 65.6%Electricity
- 24.2%Bottled, tank, or LP gas
- 8.7%Utility gas
- 1.4%Wood
- 86.1%Electricity
- 8.2%Bottled, tank, or LP gas
- 5.7%Utility gas
Private vs. public school enrollment:
| Here: | 6.5% |
| Mississippi: | 16.1% |
| Here: | 4.4% |
| Mississippi: | 14.6% |
| Here: | 29.3% |
| Mississippi: | 12.8% |
Smith County government finances - Expenditure in 2018:
- Charges - Solid Waste Management: $658,000
Other: $155,000
- Construction - Regular Highways: $700,000
- Current Operations - Regular Highways: $3,866,000
Central Staff Services: $1,181,000
Police Protection: $1,102,000
Financial Administration: $759,000
Health - Other: $590,000
Solid Waste Management: $422,000
Judicial and Legal Services: $414,000
Correctional Institutions: $394,000
General - Other: $370,000
Parks and Recreation: $249,000
Natural Resources - Other: $58,000
General Public Buildings: $29,000
- General - Interest on Debt: $197,000
- Intergovernmental to Local - Other - Other Higher Education: $428,000
Other - Natural Resources - Other: $82,000
Other - Health - Other: $35,000
Other - Central Staff Services: $7,000
- Local Intergovernmental - Health and Hospitals: $39,000
- Long Term Debt - Beginning Outstanding - Unspecified Public Purpose: $4,954,000
Outstanding Unspecified Public Purpose: $4,243,000
Retired Unspecified Public Purpose: $711,000
- Miscellaneous - General Revenue - Other: $537,000
Interest Earnings: $371,000
Fines and Forfeits: $196,000
Sale of Property: $135,000
- Other Capital Outlay - General - Other: $372,000
Regular Highways: $38,000
Libraries: $18,000
- Other Funds - Cash and Securities: $8,370,000
- State Intergovernmental - Other: $915,000
General Local Government Support: $395,000
Highways: $392,000
Health and Hospitals: $317,000
- Tax - Property: $6,450,000
Other License: $116,000
- Total Salaries and Wages: $16,462,000
Smith County government finances - Revenue in 2018:
- Charges - Solid Waste Management: $658,000
Other: $155,000
- Construction - Regular Highways: $700,000
- Current Operations - Regular Highways: $3,866,000
Central Staff Services: $1,181,000
Police Protection: $1,102,000
Financial Administration: $759,000
Health - Other: $590,000
Solid Waste Management: $422,000
Judicial and Legal Services: $414,000
Correctional Institutions: $394,000
General - Other: $370,000
Parks and Recreation: $249,000
Natural Resources - Other: $58,000
General Public Buildings: $29,000
- General - Interest on Debt: $197,000
- Intergovernmental to Local - Other - Other Higher Education: $428,000
Other - Natural Resources - Other: $82,000
Other - Health - Other: $35,000
Other - Central Staff Services: $7,000
- Local Intergovernmental - Health and Hospitals: $39,000
- Long Term Debt - Beginning Outstanding - Unspecified Public Purpose: $4,954,000
Outstanding Unspecified Public Purpose: $4,243,000
Retired Unspecified Public Purpose: $711,000
- Miscellaneous - General Revenue - Other: $537,000
Interest Earnings: $371,000
Fines and Forfeits: $196,000
Sale of Property: $135,000
- Other Capital Outlay - General - Other: $372,000
Regular Highways: $38,000
Libraries: $18,000
- Other Funds - Cash and Securities: $8,370,000
- State Intergovernmental - Other: $915,000
General Local Government Support: $395,000
Highways: $392,000
Health and Hospitals: $317,000
- Tax - Property: $6,450,000
Other License: $116,000
- Total Salaries and Wages: $16,462,000
Smith County government finances - Debt in 2018:
- Charges - Solid Waste Management: $658,000
Other: $155,000
- Construction - Regular Highways: $700,000
- Current Operations - Regular Highways: $3,866,000
Central Staff Services: $1,181,000
Police Protection: $1,102,000
Financial Administration: $759,000
Health - Other: $590,000
Solid Waste Management: $422,000
Judicial and Legal Services: $414,000
Correctional Institutions: $394,000
General - Other: $370,000
Parks and Recreation: $249,000
Natural Resources - Other: $58,000
General Public Buildings: $29,000
- General - Interest on Debt: $197,000
- Intergovernmental to Local - Other - Other Higher Education: $428,000
Other - Natural Resources - Other: $82,000
Other - Health - Other: $35,000
Other - Central Staff Services: $7,000
- Local Intergovernmental - Health and Hospitals: $39,000
- Long Term Debt - Beginning Outstanding - Unspecified Public Purpose: $4,954,000
Outstanding Unspecified Public Purpose: $4,243,000
Retired Unspecified Public Purpose: $711,000
- Miscellaneous - General Revenue - Other: $537,000
Interest Earnings: $371,000
Fines and Forfeits: $196,000
Sale of Property: $135,000
- Other Capital Outlay - General - Other: $372,000
Regular Highways: $38,000
Libraries: $18,000
- Other Funds - Cash and Securities: $8,370,000
- State Intergovernmental - Other: $915,000
General Local Government Support: $395,000
Highways: $392,000
Health and Hospitals: $317,000
- Tax - Property: $6,450,000
Other License: $116,000
- Total Salaries and Wages: $16,462,000
Smith County government finances - Cash and Securities in 2018:
- Charges - Solid Waste Management: $658,000
Other: $155,000
- Construction - Regular Highways: $700,000
- Current Operations - Regular Highways: $3,866,000
Central Staff Services: $1,181,000
Police Protection: $1,102,000
Financial Administration: $759,000
Health - Other: $590,000
Solid Waste Management: $422,000
Judicial and Legal Services: $414,000
Correctional Institutions: $394,000
General - Other: $370,000
Parks and Recreation: $249,000
Natural Resources - Other: $58,000
General Public Buildings: $29,000
- General - Interest on Debt: $197,000
- Intergovernmental to Local - Other - Other Higher Education: $428,000
Other - Natural Resources - Other: $82,000
Other - Health - Other: $35,000
Other - Central Staff Services: $7,000
- Local Intergovernmental - Health and Hospitals: $39,000
- Long Term Debt - Beginning Outstanding - Unspecified Public Purpose: $4,954,000
Outstanding Unspecified Public Purpose: $4,243,000
Retired Unspecified Public Purpose: $711,000
- Miscellaneous - General Revenue - Other: $537,000
Interest Earnings: $371,000
Fines and Forfeits: $196,000
Sale of Property: $135,000
- Other Capital Outlay - General - Other: $372,000
Regular Highways: $38,000
Libraries: $18,000
- Other Funds - Cash and Securities: $8,370,000
- State Intergovernmental - Other: $915,000
General Local Government Support: $395,000
Highways: $392,000
Health and Hospitals: $317,000
- Tax - Property: $6,450,000
Other License: $116,000
- Total Salaries and Wages: $16,462,000
Supplemental Security Income (SSI) in 2006:
- Total number of recipients: 784
- Number of aged recipients: 101
- Number of blind and disabled recipients: 683
- Number of recipients under 18: 160
- Number of recipients between 18 and 64: 410
- Number of recipients older than 64: 214
- Number of recipients also receiving OASDI: 352
- Amount of payments (thousands of dollars): 340
| Most common first names in Smith County, MS among deceased individuals | ||
| Name | Count | Lived (average) |
|---|---|---|
| James | 130 | 70.6 years |
| John | 108 | 75.3 years |
| William | 101 | 75.7 years |
| Robert | 76 | 72.8 years |
| Mary | 67 | 74.4 years |
| George | 47 | 72.6 years |
| Willie | 42 | 72.8 years |
| Annie | 39 | 77.2 years |
| Charles | 38 | 65.1 years |
| Joe | 32 | 70.2 years |
| Most common last names in Smith County, MS among deceased individuals | ||
| Last name | Count | Lived (average) |
|---|---|---|
| Sullivan | 102 | 72.6 years |
| Craft | 90 | 77.6 years |
| Thornton | 72 | 77.6 years |
| Blakeney | 70 | 73.0 years |
| Barnes | 69 | 72.6 years |
| Jones | 65 | 72.2 years |
| Blackwell | 57 | 71.9 years |
| Johnson | 46 | 72.9 years |
| Duckworth | 44 | 73.9 years |
| Smith | 44 | 79.1 years |
Businesses in Smith County, MS
- H&R Block: 1
- Subway: 1
- U-Haul: 2