Smith County, Kansas (KS)
County owner-occupied free and clear houses and condos in 2010: 929
County owner-occupied houses and condos in 2000: 1,557
Renter-occupied apartments: 368 (it was 396 in 2000)
| % of renters here: | 20% |
| State: | 32% |
Land area: 895 sq. mi.
Water area: 1.1 sq. mi.
Population density: 4 people per square mile (very low).
Industries providing employment: Educational, health and social services (25.1%), Retail trade (15.0%), Agriculture,forestry,fishing and hunting, and mining (12.9%), Manufacturing (10.9%).
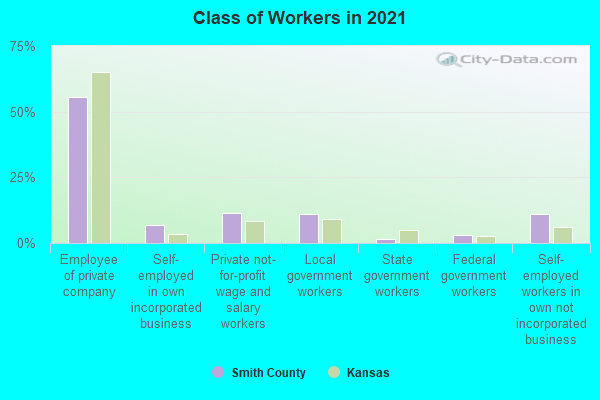
Type of workers:
- Private wage or salary: 75%
- Government: 17%
- Self-employed, not incorporated: 8%
- Unpaid family work: 0%
- OSM Map
- General Map
- Google Map
- MSN Map

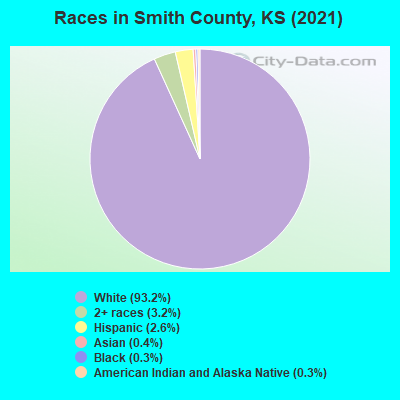
- 3,28793.0%White Non-Hispanic Alone
- 1083.1%Two or more races
- 982.8%Hispanic or Latino
- 190.5%Black Non-Hispanic Alone
- 110.3%Asian alone
- 60.2%American Indian and Alaska Native alone
- 40.1%Some other race alone
| Median resident age: | 50.7 years |
| Kansas median age: | 37.6 years |
| Males: 1,835 | |
| Females: 1,727 |

 | Gaylord, kansas (9 replies) |
| Lebanon, Smith Cty / Nicodemus KS (1 reply) |
| Urban vs Rural Population Trends On the Plains (21 replies) |
| moving to Kensington (6 replies) |
| Need information for Lebanon, Kansas (4 replies) |
| Retaired looking for a home in northcentral Ks (1 reply) |
| Smith County: | 2.0 people |
| Kansas: | 2 people |
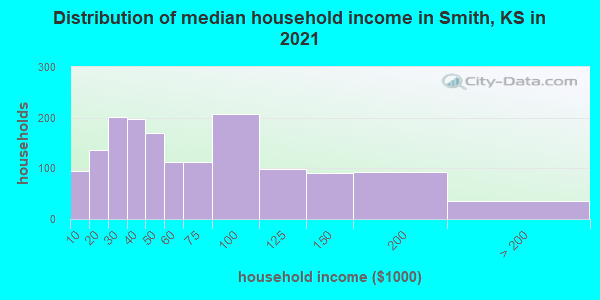
Estimated median household income in 2022: $50,342 ($28,486 in 1999)
| This county: | $50,342 |
| Kansas: | $68,925 |
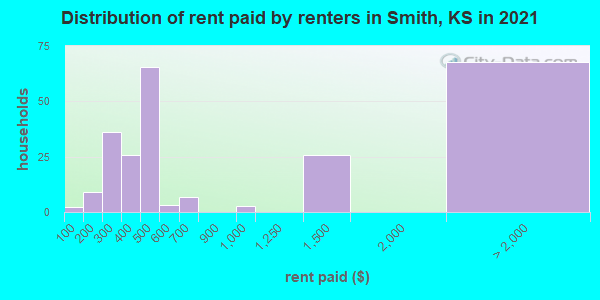
Median contract rent in 2022 for apartments: $434 (lower quartile is $283, upper quartile is $517)
| This county: | $434 |
| State: | $772 |
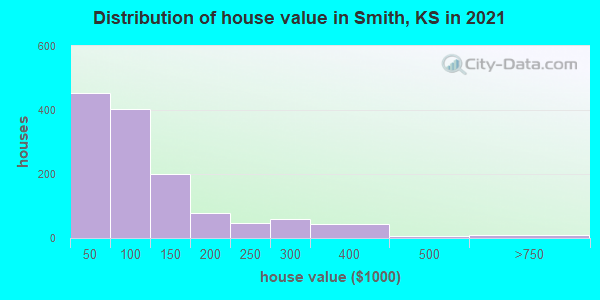
Estimated median house or condo value in 2022: $91,568 (it was $39,800 in 2000)
| Smith: | $91,568 |
| Kansas: | $206,600 |
Mean price in 2022:
Median monthly housing costs for homes and condos with a mortgage: $1,043Detached houses: $117,177
Here: $117,177 State: $264,181 Townhouses or other attached units: $89,262
Here: $89,262 State: $219,178 Mobile homes: $30,745
Here: $30,745 State: $74,712
Median monthly housing costs for units without a mortgage: $470
Institutionalized population: 56
Crime in 2021 (reported by the sheriff's office or county police, not the county total):
- Murders: 0
- Rapes: 0
- Robberies: 0
- Assaults: 6
- Burglaries: 21
- Thefts: 8
- Auto thefts: 2
Crime in 2020 (reported by the sheriff's office or county police, not the county total):
- Murders: 0
- Rapes: 0
- Robberies: 0
- Assaults: 1
- Burglaries: 3
- Thefts: 4
- Auto thefts: 1
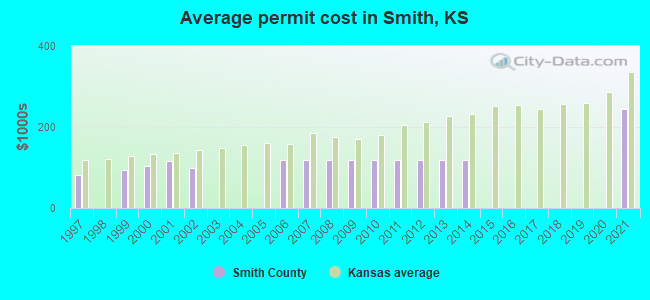
Single-family new house construction building permits:
- 2022: 2 buildings, average cost: $207,000
- 2021: 1 building, cost: $244,800
- 2020: 0 buildings
- 2019: 0 buildings
- 2018: 0 buildings
- 2017: 0 buildings
- 2016: 0 buildings
- 2015: 0 buildings
- 2014: 2 buildings, average cost: $119,300
- 2013: 3 buildings, average cost: $119,300
- 2012: 2 buildings, average cost: $119,300
- 2011: 3 buildings, average cost: $119,300
- 2010: 2 buildings, average cost: $119,300
- 2009: 3 buildings, average cost: $119,300
- 2008: 3 buildings, average cost: $119,300
- 2007: 3 buildings, average cost: $119,300
- 2006: 3 buildings, average cost: $119,300
- 2005: 0 buildings
- 2004: 0 buildings
- 2003: 0 buildings
- 2002: 2 buildings, average cost: $99,500
- 2001: 3 buildings, average cost: $116,700
- 2000: 5 buildings, average cost: $103,400
- 1999: 1 building, cost: $95,000
- 1998: 0 buildings
- 1997: 4 buildings, average cost: $81,400

Median real estate property taxes paid for housing units with mortgages in 2022: $1,673 (1.5%)
Median real estate property taxes paid for housing units with no mortgage in 2022: $1,297 (1.9%)
| Smith County: | 7.6% |
| Kansas: | 12.0% |
Median age of residents in 2022: 50.7 years old
(Males: 48.7 years old, Females: 52.5 years old)
(Median age for: White residents: 51.6 years old, Black residents: 26.4 years old, American Indian residents: 67.6 years old, Asian residents: 26.9 years old, Hispanic or Latino residents: 43.2 years old)
Fair market rent in 2006 for a 1-bedroom apartment in Smith County is $378 a month.
Fair market rent for a 2-bedroom apartment is $497 a month.
Fair market rent for a 3-bedroom apartment is $636 a month.
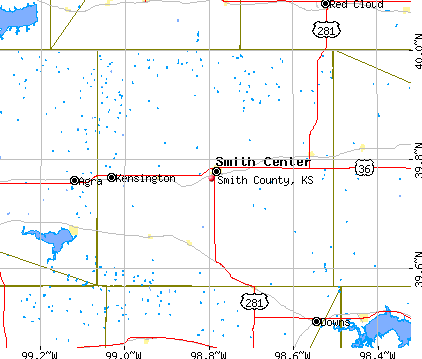
Cities in this county include: Smith Center, Kensington, Lebanon, Gaylord, Athol, Cedar.
Notable locations in this county outside city limits:
Notable locations in Smith County: Jennings Wastewater Plant (A), Price Ranch (B), Stapp Ranch (C), D and S Grain and Cattle Company Grain Elevator Number 1 (D). Display/hide their locations on the map
Churches in Smith County include: Prairie Chapel United Methodist Church (A), Sherman Chapel (B), Lund Covenant Church (C). Display/hide their locations on the map
Cemeteries: Allison Cemetery (1), Redman Cemetery (2), Saint Johns Cemetery (3), Traer Cemetery (4), Cedar Bluffs Cemetery (5), Vallonia Cemetery (6), White Cemetery (7). Display/hide their locations on the map
Reservoir: Morrison Lake (A). Display/hide its location on the map
Streams, rivers, and creeks: North Fork Prairie Dog Creek (A), Big Timber Creek (B), Cotton Creek (C), South Fork Sappa Creek (D), Johnson Draw (E), North Fork Sappa Creek (F), Spring Branch (G). Display/hide their locations on the map
Park in Smith County: Oberlin-Sappa State Park (1). Display/hide its location on the map
Neighboring counties: Cheyenne County  , Darke County, Ohio
  , Park County, Colorado , Red Willow County, Nebraska
  , Sherman County , Washington County .
| Here: | 1.4% |
| Kansas: | 2.0% |

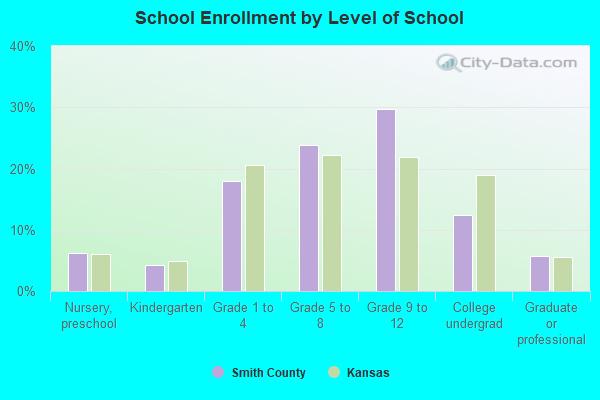
Current college students: 69
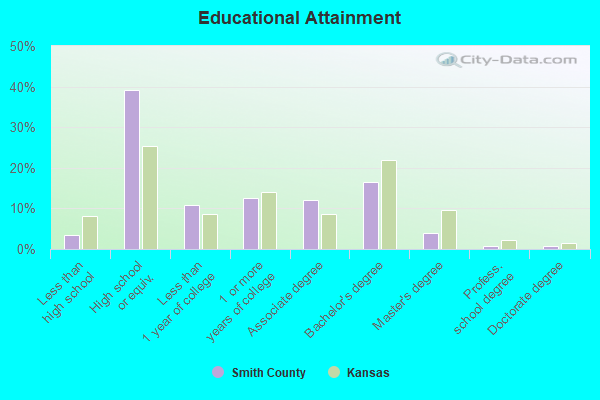
People 25 years of age or older with a high school degree or higher: 95.4%
People 25 years of age or older with a bachelor's degree or higher: 23.1%
Number of foreign born residents: 11 (0.0% naturalized citizens)
| Smith County: | 0.3% |
| Whole state: | 7.1% |
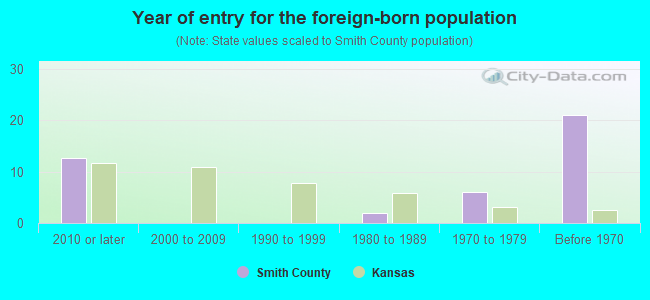
- Year of entry for the foreign-born population
- 112010 or later
- 02000 to 2009
- 01990 to 1999
- 21980 to 1989
- 61970 to 1979
- 21Before 1970
Mean travel time to work (commute): minutes
Percentage of county residents living and working in this county: 99.1%

Housing units in structures:
- One, detached: 1,867
- One, attached: 10
- Two: 18
- 3 or 4: 62
- 10 to 19: 50
- Mobile homes: 48
Housing units in Smith County with a mortgage: 476 (12 second mortgage, 0 home equity loan, 12 both second mortgage and home equity loan)
Houses without a mortgage: 0
| Here: | 100.0% with mortgage |
| State: | 97.8% with mortgage |
Religion statistics for Smith County
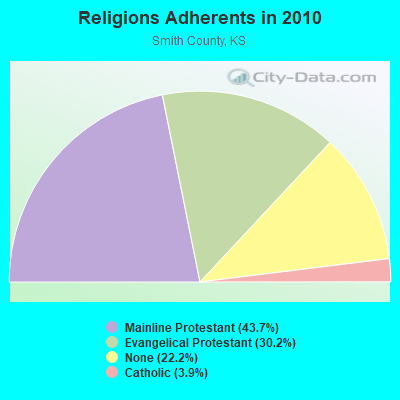
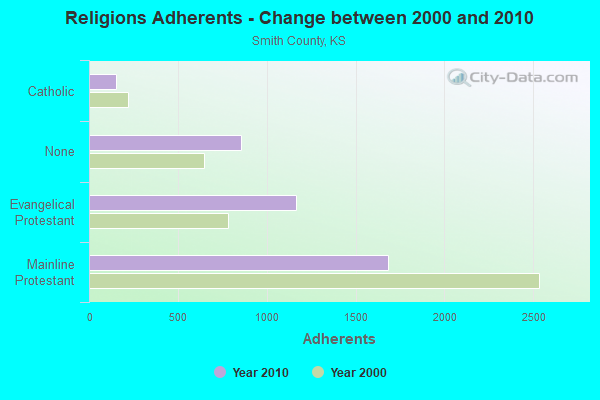
| Religion | Adherents | Congregations |
|---|---|---|
| Mainline Protestant | 1,682 | 11 |
| Evangelical Protestant | 1,165 | 10 |
| Catholic | 151 | 1 |
| None | 855 | - |
Source: Clifford Grammich, Kirk Hadaway, Richard Houseal, Dale E.Jones, Alexei Krindatch, Richie Stanley and Richard H.Taylor. 2012. 2010 U.S.Religion Census: Religious Congregations & Membership Study. Association of Statisticians of American Religious Bodies. Jones, Dale E., et al. 2002. Congregations and Membership in the United States 2000. Nashville, TN: Glenmary Research Center.
Food Environment Statistics:
| Smith County: | 7.60 / 10,000 pop. |
| State: | 1.96 / 10,000 pop. |
| This county: | 2.53 / 10,000 pop. |
| Kansas: | 0.51 / 10,000 pop. |
| Smith County: | 5.07 / 10,000 pop. |
| Kansas: | 3.84 / 10,000 pop. |
| This county: | 15.20 / 10,000 pop. |
| State: | 7.33 / 10,000 pop. |
| Smith County: | 10.4% |
| Kansas: | 8.1% |
| Smith County: | 27.9% |
| State: | 27.9% |
| Here: | 11.6% |
| State: | 13.4% |
Agriculture in Smith County:
Average size of farms: 949 acresAverage value of agricultural products sold per farm: $83,651
Average value of crops sold per acre for harvested cropland: $94.97
The value of nursery, greenhouse, floriculture, and sod as a percentage of the total market value of agricultural products sold: 0.00%
The value of livestock, poultry, and their products as a percentage of the total market value of agricultural products sold: 51.24%
Average total farm production expenses per farm: $82,859
Harvested cropland as a percentage of land in farms: 45.28%
Irrigated harvested cropland as a percentage of land in farms: 3.12%
Average market value of all machinery and equipment per farm: $110,501
The percentage of farms operated by a family or individual: 86.63%
Average age of principal farm operators: 55 years
Average number of cattle and calves per 100 acres of all land in farms: 7.95
Milk cows as a percentage of all cattle and calves: 1.16%
Corn for grain: 7164 harvested acres
All wheat for grain: 126537 harvested acres
Soybeans for beans: 10201 harvested acres
Tornado activity:
Smith County historical area-adjusted tornado activity is significantly below Kansas state average. It is 3171047.7 times below overall U.S. average.Tornadoes in this county have caused 5 injuries recorded between 1950 and 2004.
On 6/14/1970, a category 3 (max. wind speeds 158-206 mph) tornado injured 5 people and caused between $500,000 and $5,000,000 in damages.
Earthquake activity:
Smith County-area historical earthquake activity is significantly above Kansas state average. It is 540% greater than the overall U.S. average.On 9/3/2016 at 12:02:44, a magnitude 5.8 (5.8 MW, Depth: 3.5 mi, Class: Moderate, Intensity: VI - VII) earthquake occurred 252.2 miles away from Smith County center
On 6/22/2019 at 08:50:24, a magnitude 4.6 (4.6 MW, Depth: 1.9 mi, Class: Light, Intensity: IV - V) earthquake occurred 50.7 miles away from the county center
On 11/6/2011 at 03:53:10, a magnitude 5.7 (5.7 MW, Depth: 3.2 mi) earthquake occurred 313.1 miles away from the county center
On 11/12/2014 at 21:40:00, a magnitude 4.9 (4.9 MW, Depth: 2.5 mi) earthquake occurred 183.7 miles away from the county center
On 2/13/2016 at 17:07:06, a magnitude 5.1 (5.1 MW, Depth: 5.2 mi) earthquake occurred 226.5 miles away from Smith County center
On 1/19/2020 at 19:08:42, a magnitude 4.5 (4.5 MW, Depth: 3.1 mi) earthquake occurred 128.2 miles away from the county center
Magnitude types: moment magnitude (MW)
Most recent natural disasters:
- Kansas Covid-19 Pandemic, Incident Period: January 20, 2020, FEMA Id: 4504, Natural disaster type: Other
- Kansas Snowstorm, Incident Period: February 20, 2013 to February 23, 2013, Major Disaster (Presidential) Declared DR-4112: April 26, 2013, FEMA Id: 4112, Natural disaster type: Snowstorm
- Kansas Severe Storms, Straight-line Winds, Tornadoes, and Flooding, Incident Period: May 19, 2011 to June 04, 2011, Major Disaster (Presidential) Declared DR-4010: July 29, 2011, FEMA Id: 4010, Natural disaster type: Storm, Tornado, Flood, Wind
- Kansas Severe Storms, Flooding, and Tornadoes, Incident Period: June 07, 2010 to July 21, 2010, Major Disaster (Presidential) Declared DR-1932: August 10, 2010, FEMA Id: 1932, Natural disaster type: Storm, Tornado, Flood
- Kansas Severe Storms, Flooding, and Tornadoes, Incident Period: May 22, 2008 to June 16, 2008, Major Disaster (Presidential) Declared DR-1776: July 09, 2008, FEMA Id: 1776, Natural disaster type: Storm, Tornado, Flood
- Kansas Severe Winter Storms, Incident Period: December 06, 2007 to December 19, 2007, Major Disaster (Presidential) Declared DR-1741: February 01, 2008, FEMA Id: 1741, Natural disaster type: Winter Storm
- Kansas Severe Winter Storms, Incident Period: December 06, 2007 to December 19, 2007, Emergency Declared EM-3282: December 12, 2007, FEMA Id: 3282, Natural disaster type: Winter Storm
- Kansas Severe Storms, Tornadoes, and Flooding, Incident Period: May 04, 2007 to June 01, 2007, Major Disaster (Presidential) Declared DR-1699: May 06, 2007, FEMA Id: 1699, Natural disaster type: Storm, Tornado, Flood
- Kansas Severe Winter Storm, Incident Period: December 28, 2006 to December 31, 2006, Major Disaster (Presidential) Declared DR-1675: January 07, 2007, FEMA Id: 1675, Natural disaster type: Winter Storm
- Kansas Hurricane Katrina Evacuation, Incident Period: September 01, 2005 to October 01, 2005, Emergency Declared EM-3236: September 10, 2005, FEMA Id: 3236, Natural disaster type: Hurricane
- 2 other natural disasters have been reported since 1953.
The number of natural disasters in Smith County (12) is smaller than the US average (15).
Major Disasters (Presidential) Declared: 9
Emergencies Declared: 2
Causes of natural disasters: Floods: 6, Storms: 6, Tornadoes: 5, Winter Storms: 3, Hurricane: 1, Snowstorm: 1, Wind: 1, Other: 1 (Note: some incidents may be assigned to more than one category).
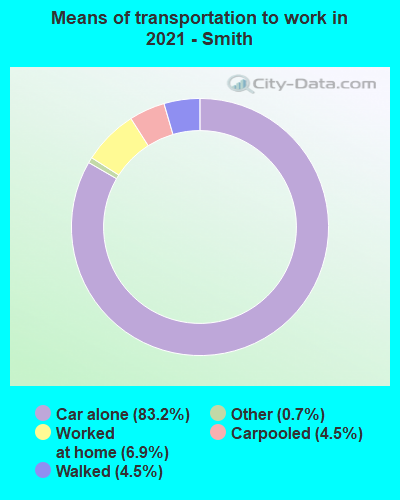
Means of transportation to work:
- Drove a car alone: 1,329 (81.1%)
- Carpooled: 88 (5.4%)
- Bus: 3 (0.2%)
- Taxicab, motorcycle, or other means: 30 (1.8%)
- Walked: 67 (4.1%)
- Worked at home: 98 (6.0%)
- Health care and social assistance (24%)
- Retail trade (10%)
- Educational services (10%)
- Agriculture, forestry, fishing and hunting (6%)
- Finance and insurance (6%)
- Public administration (5%)
- Manufacturing (4%)

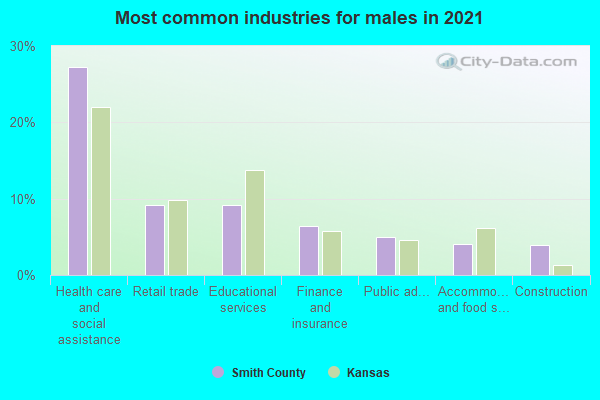
- Health care and social assistance (30%)
- Retail trade (12%)
- Educational services (12%)
- Agriculture, forestry, fishing and hunting (7%)
- Finance and insurance (7%)
- Public administration (6%)
- Manufacturing (5%)
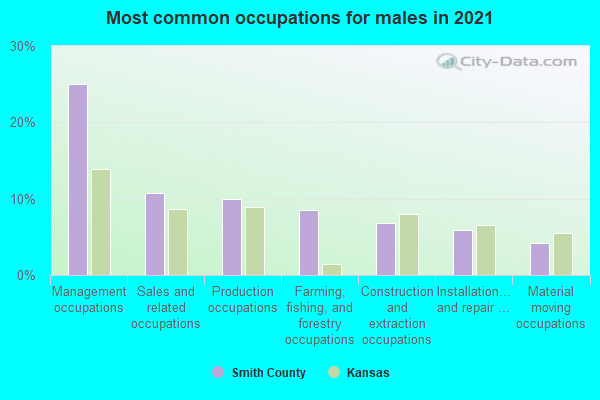
- Management occupations (22%)
- Sales and related occupations (14%)
- Production occupations (9%)
- Farming, fishing, and forestry occupations (7%)
- Construction and extraction occupations (7%)
- Transportation occupations (6%)
- Material moving occupations (5%)
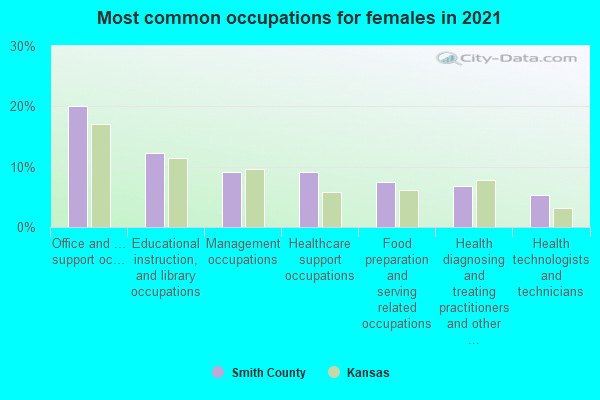
- Office and administrative support occupations (20%)
- Educational instruction, and library occupations (14%)
- Management occupations (10%)
- Health diagnosing and treating practitioners and other technical occupations (8%)
- Healthcare support occupations (7%)
- Business and financial operations occupations (6%)
- Food preparation and serving related occupations (6%)

- Denmark (36%)
- China, excluding Hong Kong and Taiwan (36%)
- Ireland (0%)
- Norway (0%)
- Sweden (0%)
- United Kingdom, excluding England and Scotland (0%)
- England (0%)

- German (47%)
- American (12%)
- English (10%)
- Irish (5%)
- Scottish (2%)
- Danish (2%)
- Scotch-Irish (2%)

People in group quarters in Smith County, Kansas in 2000:
- 94 people in nursing homes
- 9 people in wards in general hospitals for patients who have no usual home elsewhere
- 5 people in other noninstitutional group quarters
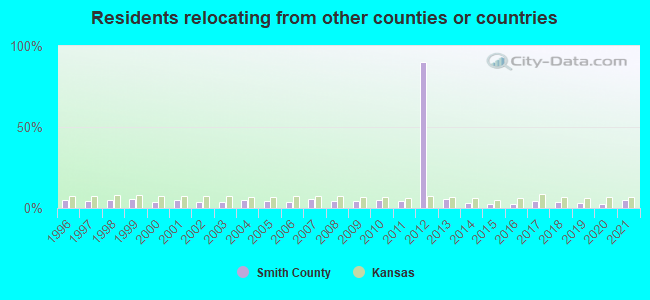
4.97% of this county's 2021 resident taxpayers lived in other counties in 2020 ($37,247 average adjusted gross income)
| Here: | 4.97% |
| Kansas average: | 6.64% |
10 or fewer of this county's residents moved from foreign countries.
3.49% relocated from other counties in Kansas ($19,234 average AGI)
1.48% relocated from other states ($18,000 average AGI)
Smith County: 1.48% Kansas average: 3.37%
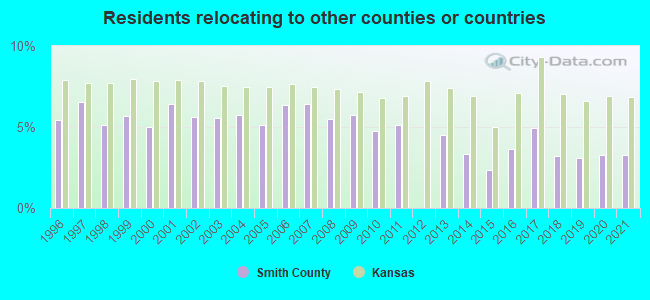
3.29% of this county's 2020 resident taxpayers moved to other counties in 2021 ($66,760 average adjusted gross income)
| Here: | 3.29% |
| Kansas average: | 6.88% |
10 or fewer of this county's residents moved to foreign countries.
3.29% relocated to other counties in Kansas ($66,760 average AGI)
10 or fewer of this county's residents relocated to other states.
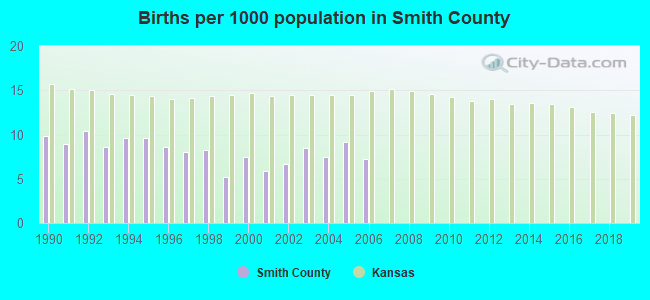
Births per 1000 population from 1990 to 1999: 8.7
Births per 1000 population from 2000 to 2006: 7.5
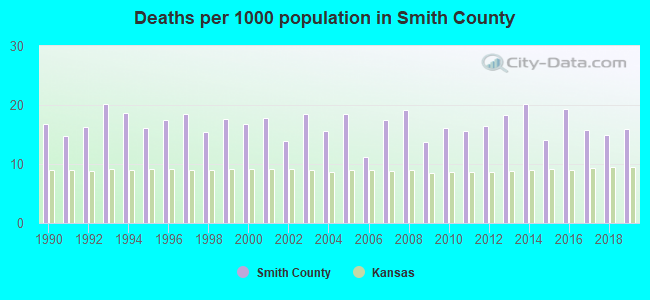
Deaths per 1000 population from 1990 to 1999: 17.2
Deaths per 1000 population from 2000 to 2009: 16.3
Deaths per 1000 population from 2010 to 2020: 16.5
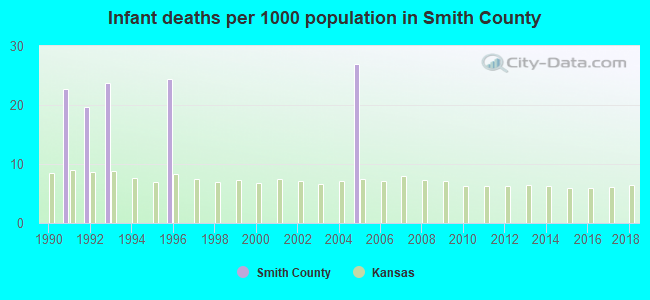
Infant deaths per 1000 live births from 1990 to 1999: 9.1
Infant deaths per 1000 live births from 2000 to 2006: 3.9
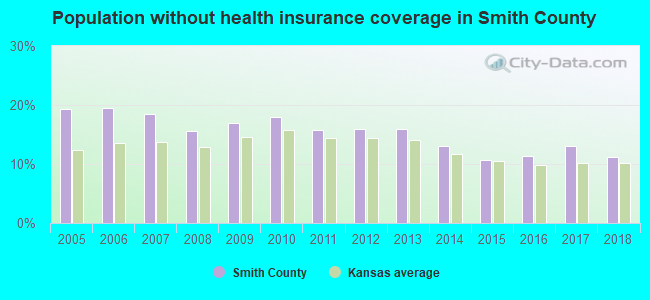
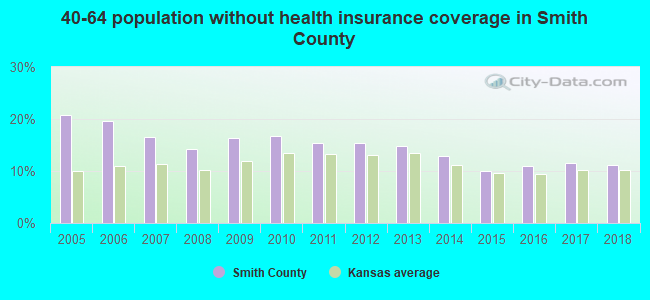
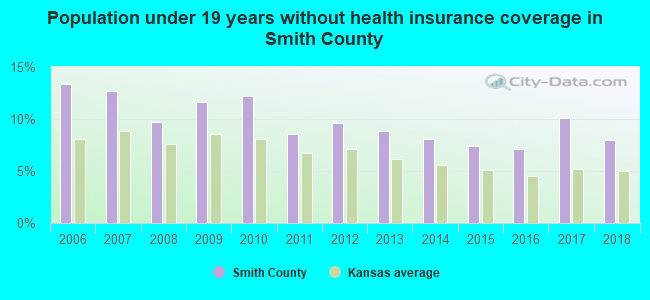
Persons under 19 years old without health insurance coverage in 2018: 8.0%

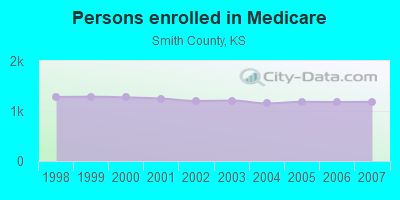
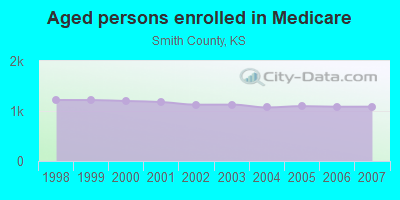
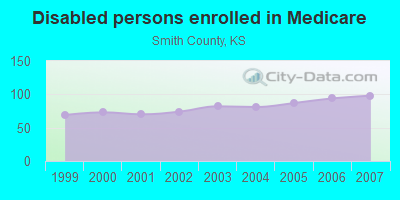
Persons enrolled in hospital insurance and/or supplemental medical insurance (Medicare) in July 1, 2007: 1,185 (1,087 aged, 98 disabled)
Children under 18 without health insurance coverage in 2007: 83 (12%)
Most common underlying causes of death in Smith County, Kansas in 1999 - 2019:
- Atherosclerotic heart disease (32)
Population without health insurance coverage in 2000: 11%
Children under 18 without health insurance coverage in 2000: 11%
Short term general hospital admissions per 100,000 population in 2004: 13,352
Short term general hospital beds per 100,000 population in 2004: 1,292
Emergency room visits per 100,000 population in 2004: 30,653
General practice office based MDs per 100,000 population in 2005: 631
Medical specialist MDs per 100,000 population in 2005: 1,529
Dentists per 100,000 population in 1998: 73
Total births per 100,000 population, July 2005 - July 2006 : 44
Total deaths per 100,000 population, July 2005 - July 2006: 49
Household type by relationship:
Households: 3,562- Male householders: 876 (242 living alone), Female householders: 717 (319 living alone)
834 spouses (834 opposite-sex spouses), 36 unmarried partners, (36 opposite-sex unmarried partners), 823 children (732 natural, 43 adopted, 45 stepchildren), 39 grandchildren, 61 brothers or sisters, 10 parents, 2 foster children, 37 other relatives, 63 non-relatives
- In group quarters: 60
Size of family households: 595 2-persons, 156 3-persons, 111 4-persons, 80 5-persons, 24 6-persons, 14 7-or-more-persons.
Size of nonfamily households: 563 1-person, 45 2-persons, 3 3-persons, 1 6-persons.
509 married couples with children.
127 single-parent households (80 men, 47 women).
99.1% of residents of Smith speak English at home.
0.8% of residents speak Spanish at home (96% speak English very well, 4% speak English not well).
0.8% of residents speak other Indo-European language at home (93% speak English very well, 7% speak English not well).
In fiscal year 2004:
Federal Government expenditure: $42,904,000 ($10,267 per capita)
Department of Defense expenditure: $647,000
Federal direct payments to individuals for retirement and disability: $14,752,000
Federal other direct payments to individuals: $7,912,000
Federal direct payments not to individuals: $11,644,000
Federal grants: $5,763,000
Federal procurement contracts: $460,000 ($13,000 Department of Defense)
Federal salaries and wages: $2,373,000 ($287,000 Department of Defense)
Federal Government direct loans: $628,000
Federal guaranteed/insured loans: $1,228,000
Federal Government insurance: $25,534,000
Population change from April 1, 2000 to July 1, 2005:
Births: 177| Here: | 43 per 1000 residents |
| State: | 75 per 1000 residents |
Deaths: 377
| Here: | 91 per 1000 residents |
| State: | 47 per 1000 residents |
Net international migration: -1
| Here: | |
| State: |
Net internal migration: -208
| Here: | |
| State: |
Total withdrawal of fresh water for public supply: 0.67 millions of gallons per day (all from ground)
| Here: | 6.7 |
| State: | 6.9 |
| Here: | 5.3 |
| State: | 4.4 |
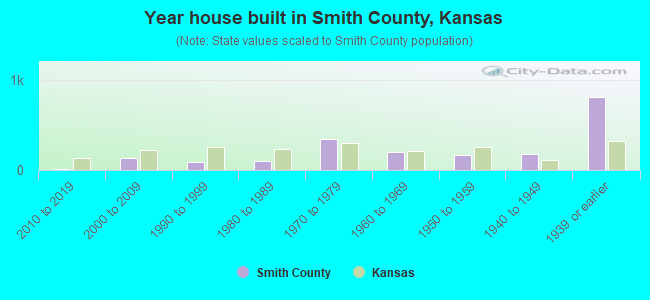
- Year house built in Smith County, Kansas
- 02020 or later
- 252010 to 2019
- 1192000 to 2009
- 801990 to 1999
- 771980 to 1989
- 3491970 to 1979
- 2121960 to 1969
- 1711950 to 1959
- 1501940 to 1949
- 8331939 or earlier
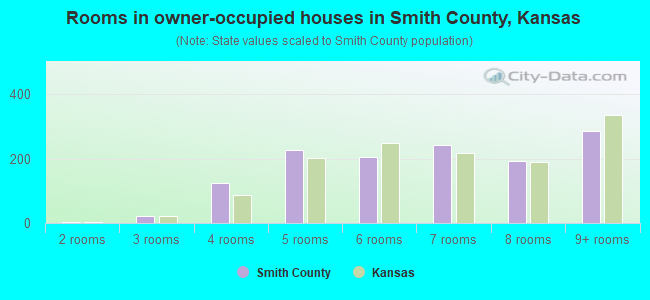
- Rooms in owner-occupied houses in Smith County, Kansas
- 01 room
- 32 rooms
- 273 rooms
- 1334 rooms
- 2575 rooms
- 2016 rooms
- 2597 rooms
- 1818 rooms
- 2969+ rooms
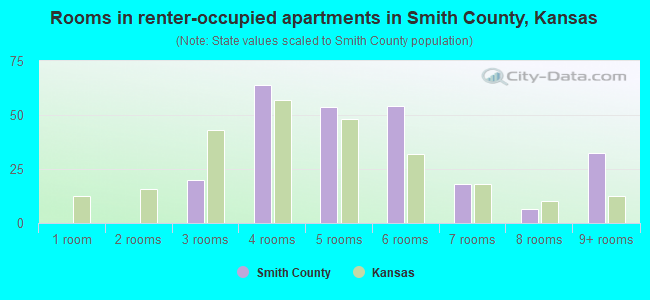
- Rooms in renter-occupied apartments in Smith County, Kansas
- 01 room
- 02 rooms
- 163 rooms
- 644 rooms
- 525 rooms
- 476 rooms
- 147 rooms
- 58 rooms
- 539+ rooms
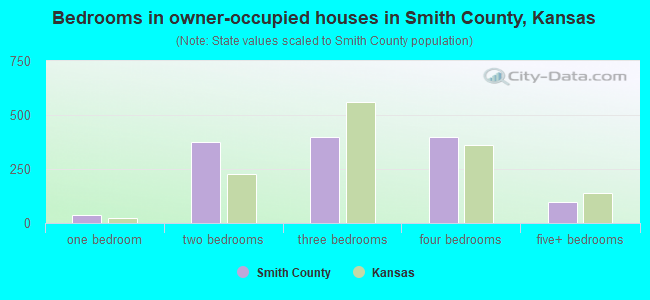
- Bedrooms in owner-occupied houses in Smith County, Kansas
- 3no bedroom
- 481 bedroom
- 3432 bedrooms
- 4763 bedrooms
- 3674 bedrooms
- 1205+ bedrooms
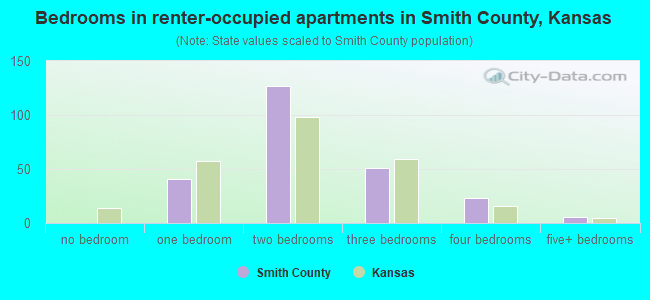
- Bedrooms in renter-occupied apartments in Smith County, Kansas
- 0no bedroom
- 401 bedroom
- 1162 bedrooms
- 513 bedrooms
- 214 bedrooms
- 195+ bedrooms
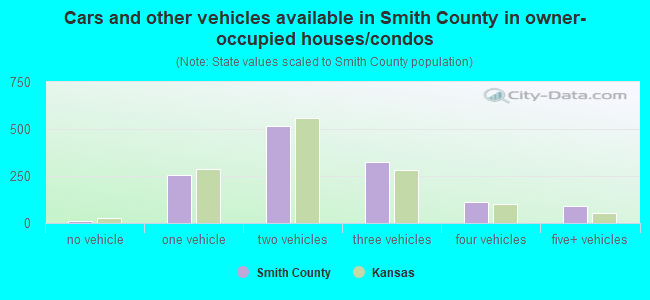
- Cars and other vehicles available in Smith County in owner-occupied houses/condos
- 21no vehicle
- 2571 vehicle
- 5692 vehicles
- 3353 vehicles
- 904 vehicles
- 855+ vehicles
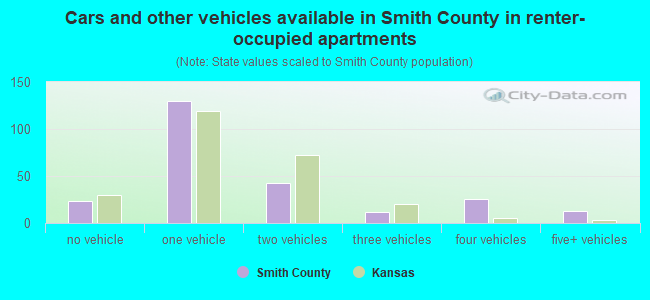
- Cars and other vehicles available in Smith County in renter-occupied apartments
- 25no vehicle
- 1081 vehicle
- 462 vehicles
- 213 vehicles
- 394 vehicles
- 85+ vehicles
91.5% of Smith County residents lived in the same house 1 years ago.
Out of people who lived in different houses, 31% lived in this county.
Out of people who lived in different counties, 75% lived in Kansas.
| Smith County: | 91.5% |
| State average: | 85.3% |
Place of birth for U.S.-born residents:
- This state: 2,434
- Other state: 1,107
- Northeast: 52
- Midwest: 478
- South: 120
- West: 466

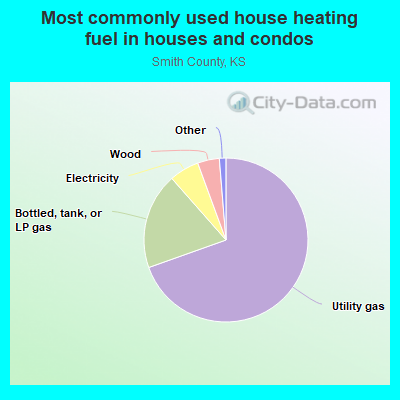
- 70.9%Utility gas
- 17.0%Bottled, tank, or LP gas
- 7.2%Electricity
- 3.5%Wood
- 1.1%Other fuel
- 0.3%Fuel oil, kerosene, etc.
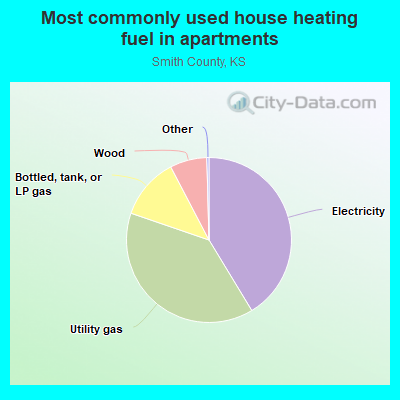
- 42.6%Electricity
- 33.5%Utility gas
- 15.5%Bottled, tank, or LP gas
- 8.4%Wood
Private vs. public school enrollment:
| Here: | 1.5% |
| Kansas: | 14.1% |
| Here: | 2.0% |
| Kansas: | 10.8% |
| Here: | 14.5% |
| Kansas: | 15.4% |

Smith County government finances - Expenditure in 2017:
- Charges - Solid Waste Management: $225,000
- Current Operations - Regular Highways: $2,768,000
General - Other: $2,259,000
Central Staff Services: $1,644,000
Local Fire Protection: $692,000
Health - Other: $574,000
Police Protection: $561,000
Solid Waste Management: $284,000
Judicial and Legal Services: $56,000
Air Transportation: $7,000
- Federal Intergovernmental - Health and Hospitals: $14,000
- Long Term Debt - Beginning Outstanding - Public Debt for Private Purpose: $2,000,000
Beginning Outstanding - Unspecified Public Purpose: $1,750,000
Outstanding Nonguaranteed - Industrial Revenue: $1,750,000
Outstanding Unspecified Public Purpose: $1,750,000
Retired Nonguaranteed - Public Debt for Private Purpose: $250,000
- Other Funds - Cash and Securities: $12,633,000
- Sinking Funds - Cash and Securities: $1,750,000
- State Intergovernmental - Highways: $352,000
Health and Hospitals: $7,000
- Tax - Property: $9,910,000
General Sales and Gross Receipts: $730,000
Other Selective Sales: $730,000
Motor Vehicle License: $100,000
- Total Salaries and Wages: $2,592,000
Smith County government finances - Revenue in 2017:
- Charges - Solid Waste Management: $225,000
- Current Operations - Regular Highways: $2,768,000
General - Other: $2,259,000
Central Staff Services: $1,644,000
Local Fire Protection: $692,000
Health - Other: $574,000
Police Protection: $561,000
Solid Waste Management: $284,000
Judicial and Legal Services: $56,000
Air Transportation: $7,000
- Federal Intergovernmental - Health and Hospitals: $14,000
- Long Term Debt - Beginning Outstanding - Public Debt for Private Purpose: $2,000,000
Beginning Outstanding - Unspecified Public Purpose: $1,750,000
Outstanding Nonguaranteed - Industrial Revenue: $1,750,000
Outstanding Unspecified Public Purpose: $1,750,000
Retired Nonguaranteed - Public Debt for Private Purpose: $250,000
- Other Funds - Cash and Securities: $12,633,000
- Sinking Funds - Cash and Securities: $1,750,000
- State Intergovernmental - Highways: $352,000
Health and Hospitals: $7,000
- Tax - Property: $9,910,000
General Sales and Gross Receipts: $730,000
Other Selective Sales: $730,000
Motor Vehicle License: $100,000
- Total Salaries and Wages: $2,592,000
Smith County government finances - Debt in 2017:
- Charges - Solid Waste Management: $225,000
- Current Operations - Regular Highways: $2,768,000
General - Other: $2,259,000
Central Staff Services: $1,644,000
Local Fire Protection: $692,000
Health - Other: $574,000
Police Protection: $561,000
Solid Waste Management: $284,000
Judicial and Legal Services: $56,000
Air Transportation: $7,000
- Federal Intergovernmental - Health and Hospitals: $14,000
- Long Term Debt - Beginning Outstanding - Public Debt for Private Purpose: $2,000,000
Beginning Outstanding - Unspecified Public Purpose: $1,750,000
Outstanding Nonguaranteed - Industrial Revenue: $1,750,000
Outstanding Unspecified Public Purpose: $1,750,000
Retired Nonguaranteed - Public Debt for Private Purpose: $250,000
- Other Funds - Cash and Securities: $12,633,000
- Sinking Funds - Cash and Securities: $1,750,000
- State Intergovernmental - Highways: $352,000
Health and Hospitals: $7,000
- Tax - Property: $9,910,000
General Sales and Gross Receipts: $730,000
Other Selective Sales: $730,000
Motor Vehicle License: $100,000
- Total Salaries and Wages: $2,592,000
Smith County government finances - Cash and Securities in 2017:
- Charges - Solid Waste Management: $225,000
- Current Operations - Regular Highways: $2,768,000
General - Other: $2,259,000
Central Staff Services: $1,644,000
Local Fire Protection: $692,000
Health - Other: $574,000
Police Protection: $561,000
Solid Waste Management: $284,000
Judicial and Legal Services: $56,000
Air Transportation: $7,000
- Federal Intergovernmental - Health and Hospitals: $14,000
- Long Term Debt - Beginning Outstanding - Public Debt for Private Purpose: $2,000,000
Beginning Outstanding - Unspecified Public Purpose: $1,750,000
Outstanding Nonguaranteed - Industrial Revenue: $1,750,000
Outstanding Unspecified Public Purpose: $1,750,000
Retired Nonguaranteed - Public Debt for Private Purpose: $250,000
- Other Funds - Cash and Securities: $12,633,000
- Sinking Funds - Cash and Securities: $1,750,000
- State Intergovernmental - Highways: $352,000
Health and Hospitals: $7,000
- Tax - Property: $9,910,000
General Sales and Gross Receipts: $730,000
Other Selective Sales: $730,000
Motor Vehicle License: $100,000
- Total Salaries and Wages: $2,592,000
Supplemental Security Income (SSI) in 2006:
- Total number of recipients: 45
- Number of aged recipients: 5
- Number of blind and disabled recipients: 40
- Number of recipients under 18: 3
- Number of recipients between 18 and 64: 33
- Number of recipients older than 64: 9
- Number of recipients also receiving OASDI: 22
- Amount of payments (thousands of dollars): 24
| Most common first names in Smith County, KS among deceased individuals | ||
| Name | Count | Lived (average) |
|---|---|---|
| John | 45 | 82.6 years |
| Mary | 42 | 86.9 years |
| Charles | 37 | 81.6 years |
| William | 34 | 82.6 years |
| George | 30 | 84.1 years |
| James | 27 | 74.8 years |
| Henry | 25 | 84.6 years |
| Roy | 23 | 80.7 years |
| Harry | 22 | 82.0 years |
| Ruth | 21 | 84.2 years |
| Most common last names in Smith County, KS among deceased individuals | ||
| Last name | Count | Lived (average) |
|---|---|---|
| Smith | 36 | 83.6 years |
| Dettmer | 21 | 87.1 years |
| Brown | 19 | 83.9 years |
| Jones | 19 | 69.8 years |
| Gibson | 18 | 79.1 years |
| Rice | 17 | 87.6 years |
| Davis | 16 | 76.6 years |
| Peterson | 15 | 78.4 years |
| Moore | 14 | 84.5 years |
| Grauerholz | 14 | 81.0 years |
| Businesses in Smith County, KS | ||||
| Name | Count | Name | Count | |
|---|---|---|---|---|
| Alco Stores | 1 | MasterBrand Cabinets | 2 | |
| H&R Block | 1 | Pizza Hut | 1 | |
| Lane Furniture | 1 | U-Haul | 1 | |
Smith County on our top lists:
- #15 on the list of "Top 101 counties with the highest number of deaths per 1000 residents 2007-2013"