Pierce County, North Dakota (ND)
County owner-occupied free and clear houses and condos in 2010: 795
County owner-occupied houses and condos in 2000: 1,436
Renter-occupied apartments: 454 (it was 528 in 2000)
| % of renters here: | 27% |
| State: | 35% |
Land area: 1018 sq. mi.
Water area: 64.3 sq. mi.
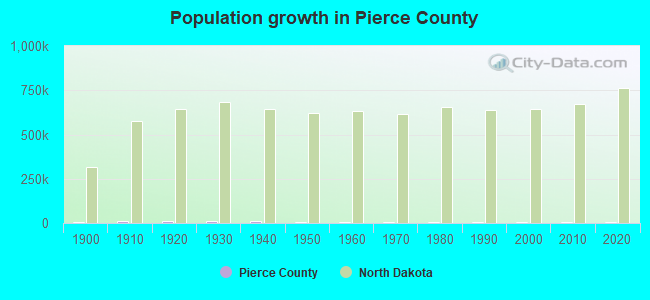
Population density: 4 people per square mile (very low).
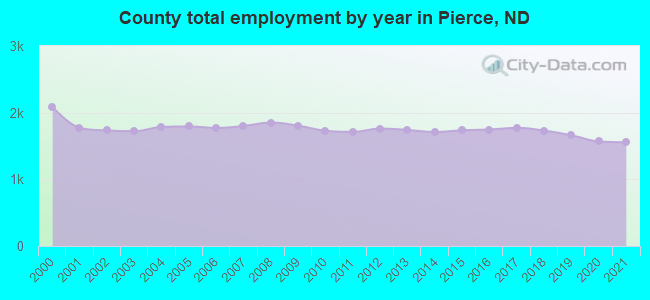
Industries providing employment: Educational, health and social services (27.9%), Agriculture,forestry,fishing and hunting, and mining (17.5%), Retail trade (12.6%).
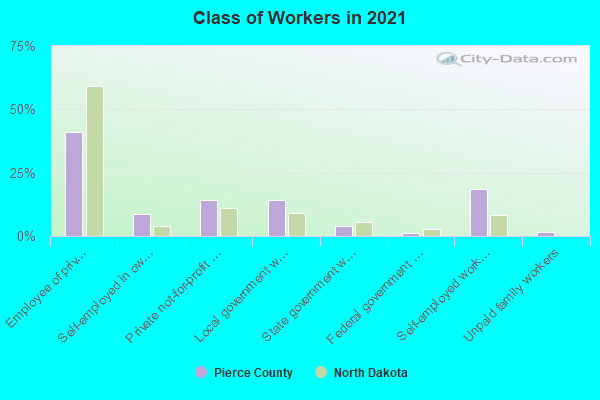
Type of workers:
- Private wage or salary: 63%
- Government: 20%
- Self-employed, not incorporated: 15%
- Unpaid family work: 2%
- OSM Map
- General Map
- Google Map
- MSN Map

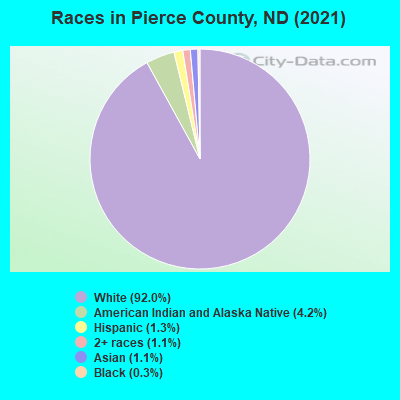
- 3,68392.7%White Non-Hispanic Alone
- 1072.7%American Indian and Alaska Native alone
- 621.6%Asian alone
- 621.6%Two or more races
- 501.3%Hispanic or Latino
- 100.3%Black Non-Hispanic Alone
| Median resident age: | 45.6 years |
| North Dakota median age: | 36.2 years |
| Males: 1,992 | |
| Females: 2,019 |

 | hi folks...... (14 replies) |
| Rugby (21 replies) |
| Pierce County: | 2.0 people |
| North Dakota: | 2 people |
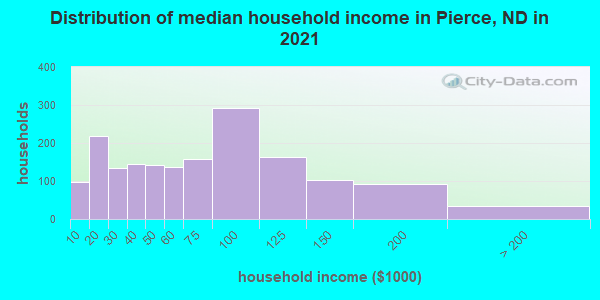
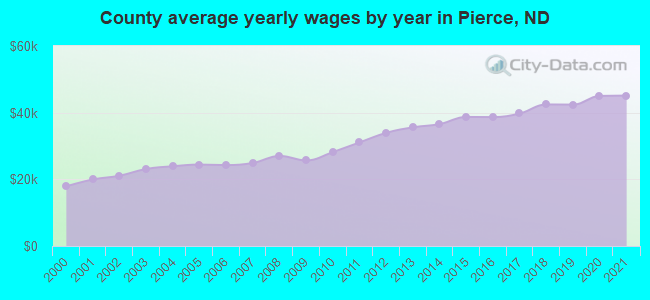
Estimated median household income in 2022: $57,980 ($26,524 in 1999)
| This county: | $57,980 |
| North Dakota: | $71,970 |
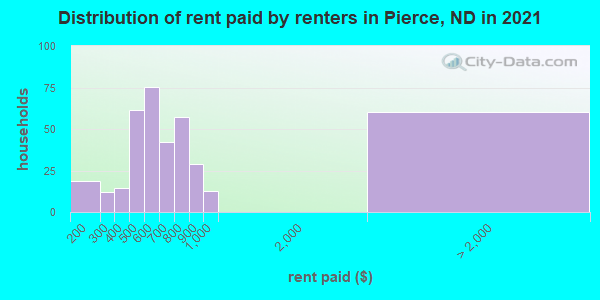
Median contract rent in 2022 for apartments: $525 (lower quartile is $465, upper quartile is $687)
| This county: | $525 |
| State: | $782 |
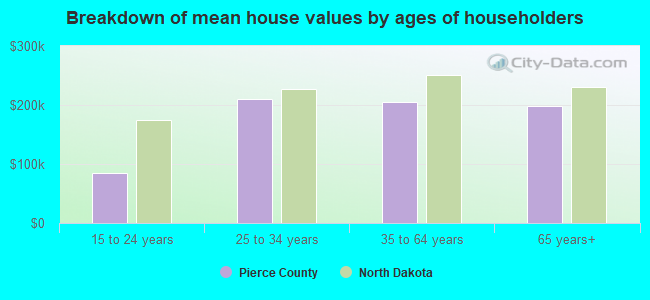
Estimated median house or condo value in 2022: $161,439 (it was $53,900 in 2000)
| Pierce: | $161,439 |
| North Dakota: | $243,100 |
Median monthly housing costs for homes and condos with a mortgage: $1,316
Median monthly housing costs for units without a mortgage: $581
Institutionalized population: 261
Crime in 2021 (reported by the sheriff's office or county police, not the county total):
- Murders: 0
- Rapes: 0
- Robberies: 0
- Assaults: 0
- Burglaries: 3
- Thefts: 10
- Auto thefts: 1
Crime in 2020 (reported by the sheriff's office or county police, not the county total):
- Murders: 0
- Rapes: 1
- Robberies: 0
- Assaults: 2
- Burglaries: 3
- Thefts: 12
- Auto thefts: 7
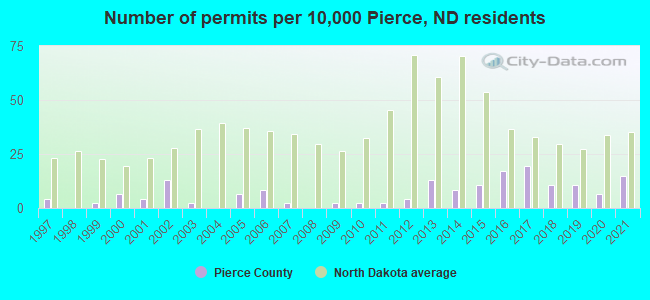
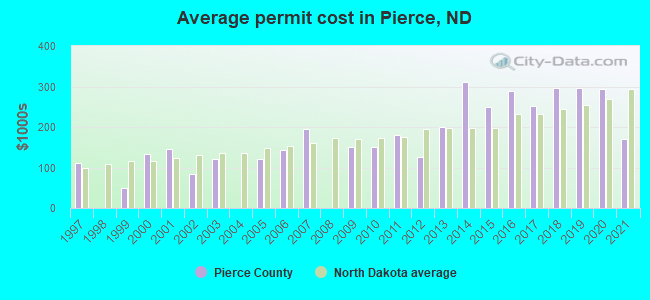
Single-family new house construction building permits:
- 2022: 7 buildings, average cost: $185,700
- 2021: 7 buildings, average cost: $171,400
- 2020: 3 buildings, average cost: $293,300
- 2019: 5 buildings, average cost: $296,300
- 2018: 5 buildings, average cost: $296,300
- 2017: 9 buildings, average cost: $252,200
- 2016: 8 buildings, average cost: $289,300
- 2015: 5 buildings, average cost: $249,600
- 2014: 4 buildings, average cost: $312,000
- 2013: 6 buildings, average cost: $199,200
- 2012: 2 buildings, average cost: $125,000
- 2011: 1 building, cost: $180,000
- 2010: 1 building, cost: $150,000
- 2009: 1 building, cost: $150,000
- 2008: 0 buildings
- 2007: 1 building, cost: $195,000
- 2006: 4 buildings, average cost: $143,800
- 2005: 3 buildings, average cost: $120,000
- 2004: 0 buildings
- 2003: 1 building, cost: $120,000
- 2002: 6 buildings, average cost: $85,100
- 2001: 2 buildings, average cost: $145,000
- 2000: 3 buildings, average cost: $133,300
- 1999: 1 building, cost: $50,000
- 1998: 0 buildings
- 1997: 2 buildings, average cost: $112,000
Median real estate property taxes paid for housing units with mortgages in 2022: $1,461 (0.9%)
Median real estate property taxes paid for housing units with no mortgage in 2022: $1,688 (1.1%)

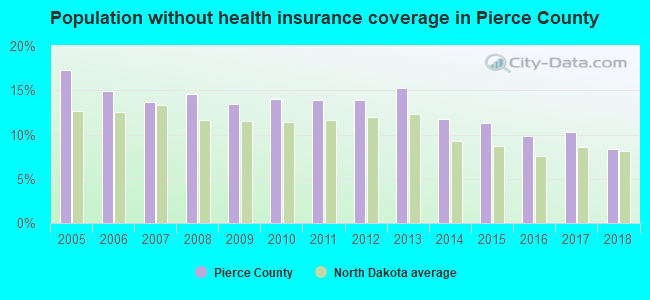
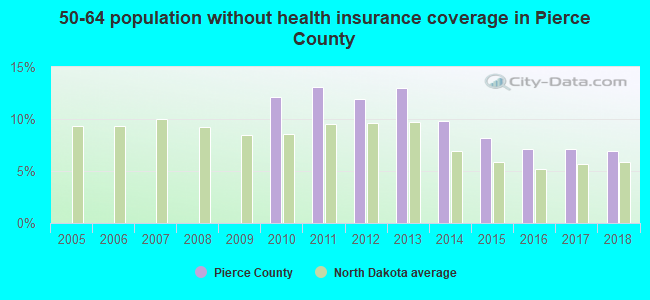
| Pierce County: | 11.9% |
| North Dakota: | 11.5% |
Median age of residents in 2022: 45.6 years old
(Males: 43.6 years old, Females: 46.2 years old)
(Median age for: White residents: 49.2 years old, Black residents: 33.3 years old, American Indian residents: 32.8 years old, Asian residents: 37.6 years old, Hispanic or Latino residents: 7.6 years old, Other race residents: 38.4 years old)
Fair market rent in 2006 for a 1-bedroom apartment in Pierce County is $399 a month.
Fair market rent for a 2-bedroom apartment is $496 a month.
Fair market rent for a 3-bedroom apartment is $698 a month.
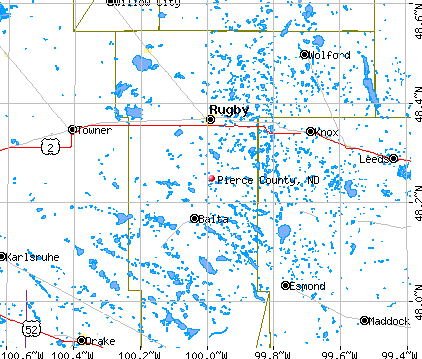
Cities in this county include: Rugby, Balta, Wolford, Selz, Orrin, Barton.
Notable locations in this county outside city limits:
River: Forest River (A). Display/hide its location on the map
Neighboring counties: Okanogan County, Washington  , Nelson County
  , Pembina County
  , Ramsey County , Keweenaw County, Michigan , Towner County , Walsh County , Pennington County, Minnesota .
| Here: | 2.4% |
| North Dakota: | 1.7% |
Current college students: 101
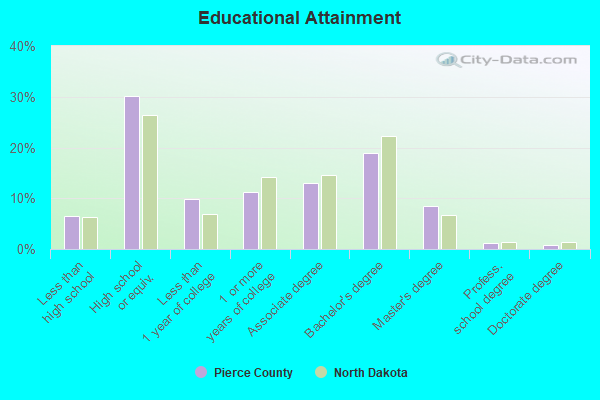
People 25 years of age or older with a high school degree or higher: 93.2%
People 25 years of age or older with a bachelor's degree or higher: 29.4%
Number of foreign born residents: 73 (37.1% naturalized citizens)
| Pierce County: | 1.8% |
| Whole state: | 4.9% |
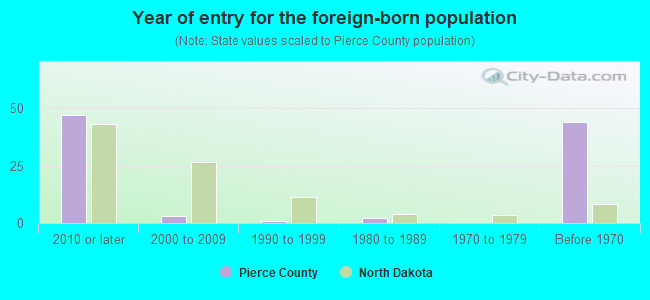
- Year of entry for the foreign-born population
- 512010 or later
- 02000 to 2009
- 21990 to 1999
- 21980 to 1989
- 01970 to 1979
- 44Before 1970
Mean travel time to work (commute): minutes
Percentage of county residents living and working in this county: 100.0%
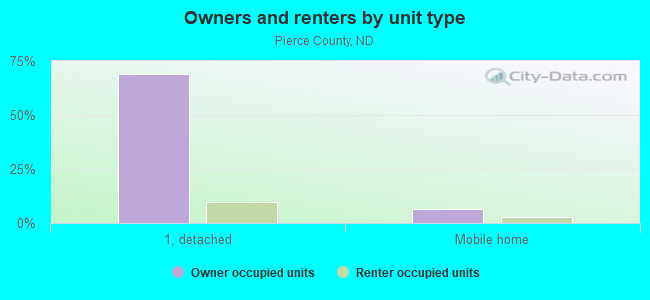
Housing units in structures:
- One, detached: 1,683
- One, attached: 58
- Two: 53
- 3 or 4: 65
- 5 to 9: 26
- 10 to 19: 16
- 20 or more: 25
- Mobile homes: 117
Housing units in Pierce County with a mortgage: 474 (14 second mortgage, 0 home equity loan, 11 both second mortgage and home equity loan)
Houses without a mortgage: 11
| Here: | 97.7% with mortgage |
| State: | 97.9% with mortgage |
Religion statistics for Pierce County
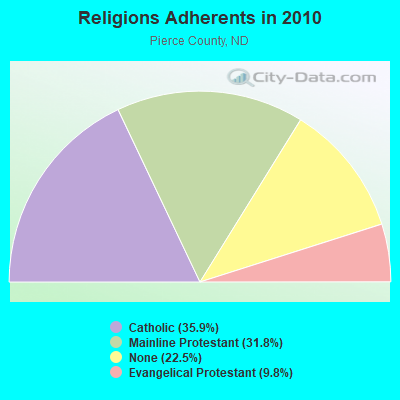
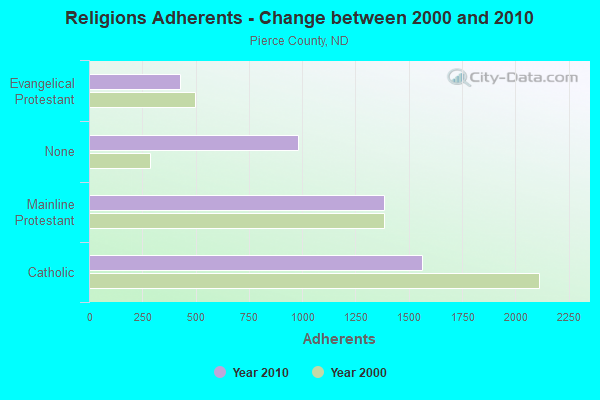
| Religion | Adherents | Congregations |
|---|---|---|
| Catholic | 1,562 | 3 |
| Mainline Protestant | 1,386 | 7 |
| Evangelical Protestant | 426 | 4 |
| Other | 1 | 1 |
| None | 982 | - |
Source: Clifford Grammich, Kirk Hadaway, Richard Houseal, Dale E.Jones, Alexei Krindatch, Richie Stanley and Richard H.Taylor. 2012. 2010 U.S.Religion Census: Religious Congregations & Membership Study. Association of Statisticians of American Religious Bodies. Jones, Dale E., et al. 2002. Congregations and Membership in the United States 2000. Nashville, TN: Glenmary Research Center.
Food Environment Statistics:
| Pierce County: | 2.44 / 10,000 pop. |
| State: | 3.23 / 10,000 pop. |
| Pierce County: | 7.31 / 10,000 pop. |
| North Dakota: | 4.89 / 10,000 pop. |
| This county: | 12.18 / 10,000 pop. |
| State: | 8.90 / 10,000 pop. |
| Pierce County: | 8.7% |
| North Dakota: | 7.6% |
| Pierce County: | 26.7% |
| State: | 27.6% |
Agriculture in Pierce County:
Average size of farms: 1090 acresAverage value of agricultural products sold per farm: $74,528
Average value of crops sold per acre for harvested cropland: $86.80
The value of livestock, poultry, and their products as a percentage of the total market value of agricultural products sold: 28.97%
Average total farm production expenses per farm: $65,688
Harvested cropland as a percentage of land in farms: 55.97%
Average market value of all machinery and equipment per farm: $86,204
The percentage of farms operated by a family or individual: 89.32%
Average age of principal farm operators: 54 years
Average number of cattle and calves per 100 acres of all land in farms: 4.76
Milk cows as a percentage of all cattle and calves: 2.42%
Corn for grain: 4915 harvested acres
All wheat for grain: 117405 harvested acres
Soybeans for beans: 9439 harvested acres
Earthquake activity:
Pierce County-area historical earthquake activity is significantly above North Dakota state average. It is 23% greater than the overall U.S. average.On 8/18/1959 at 06:37:13, a magnitude 7.7 (7.7 UK, Class: Major, Intensity: VIII - XII) earthquake occurred 568.2 miles away from Pierce County center, causing $26,000,000 total damage
On 7/9/1975 at 14:54:15, a magnitude 4.6 (4.6 MB, Class: Light, Intensity: IV - V) earthquake occurred 257.8 miles away from the county center
On 3/4/1983 at 06:32:18, a magnitude 4.6 (4.4 MB, 4.6 LG, 4.4 ML) earthquake occurred 280.3 miles away from the county center
On 9/8/1984 at 00:59:31, a magnitude 5.1 (5.1 MB, Class: Moderate, Intensity: VI - VII) earthquake occurred 397.1 miles away from the county center
On 5/29/1984 at 20:18:32, a magnitude 5.0 (5.0 MB) earthquake occurred 398.3 miles away from Pierce County center
On 6/5/1993 at 01:24:53, a magnitude 4.1 (4.1 LG, Depth: 6.2 mi) earthquake occurred 249.1 miles away from the county center
Magnitude types: regional Lg-wave magnitude (LG), body-wave magnitude (MB), local magnitude (ML)
Most recent natural disasters:
- North Dakota Covid-19 Pandemic, Incident Period: January 20, 2020, FEMA Id: 4509, Natural disaster type: Other
- North Dakota Flooding, Incident Period: March 23, 2017 - April 29, 2017, FEMA Id: 4323, Natural disaster type: Flood
- North Dakota Severe Storms and Flooding, Incident Period: June 25, 2014 to July 02, 2014, Major Disaster (Presidential) Declared DR-4190: August 19, 2014, FEMA Id: 4190, Natural disaster type: Storm, Flood
- North Dakota Severe Storms and Flooding, Incident Period: May 17, 2013 to June 17, 2013, Major Disaster (Presidential) Declared DR-4128: July 12, 2013, FEMA Id: 4128, Natural disaster type: Storm, Flood
- North Dakota Flooding, Incident Period: February 14, 2011 to July 20, 2011, Major Disaster (Presidential) Declared DR-1981: May 10, 2011, FEMA Id: 1981, Natural disaster type: Flood
- North Dakota Severe Storms and Flooding, Incident Period: March 13, 2009 to August 10, 2009, Major Disaster (Presidential) Declared DR-1829: March 24, 2009, FEMA Id: 1829, Natural disaster type: Storm, Flood
- North Dakota Severe Winter Storm and Record and/or Near Record Snow, Incident Period: October 04, 2005 to October 06, 2005, Major Disaster (Presidential) Declared DR-1616: November 21, 2005, FEMA Id: 1616, Natural disaster type: Winter Storm, Snow
- North Dakota Hurricane Katrina Evacuation, Incident Period: August 29, 2005 to October 01, 2005, Emergency Declared EM-3247: September 13, 2005, FEMA Id: 3247, Natural disaster type: Hurricane
- North Dakota Severe Storms, Flooding, and Ground Saturation, Incident Period: June 01, 2005 to July 07, 2005, Major Disaster (Presidential) Declared DR-1597: July 22, 2005, FEMA Id: 1597, Natural disaster type: Storm, Flood
- North Dakota Severe Storms, Flooding, and Ground Saturation, Incident Period: March 26, 2004 to June 14, 2004, Major Disaster (Presidential) Declared DR-1515: May 05, 2004, FEMA Id: 1515, Natural disaster type: Storm, Flood
- 12 other natural disasters have been reported since 1953.
The number of natural disasters in Pierce County (22) is greater than the US average (15).
Major Disasters (Presidential) Declared: 19
Emergencies Declared: 1
Causes of natural disasters: Floods: 18, Storms: 11, Snows: 4, Winter Storms: 2, Blizzard: 1, Heavy Rain: 1, Hurricane: 1, Landslide: 1, Mudslide: 1, Tornado: 1, Other: 1 (Note: some incidents may be assigned to more than one category).
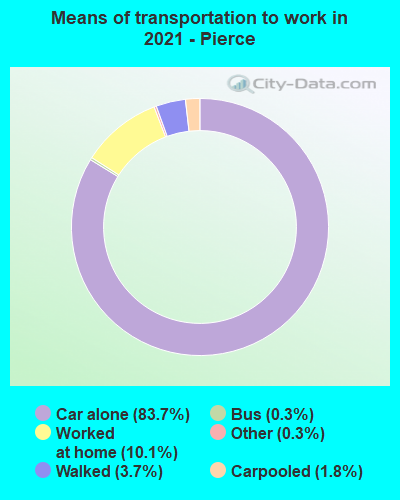
Means of transportation to work:
- Drove a car alone: 1,509 (81.0%)
- Carpooled: 43 (2.3%)
- Bus: 2 (0.1%)
- Taxicab, motorcycle, or other means: 2 (0.1%)
- Walked: 92 (4.9%)
- Worked at home: 232 (12.5%)

- Health care and social assistance (23%)
- Educational services (20%)
- Retail trade (11%)
- Accommodation and food services (6%)
- Finance and insurance (5%)
- Public administration (4%)
- Other services, except public administration (3%)
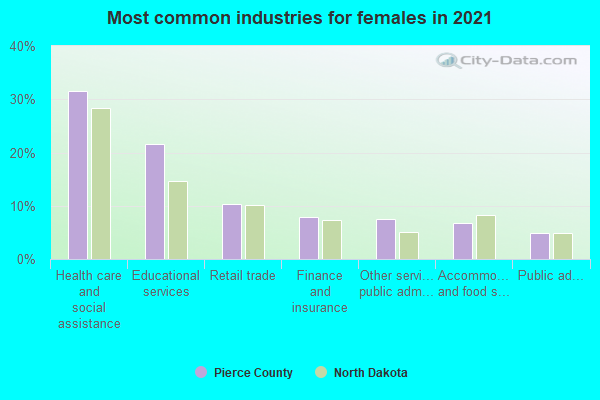
- Health care and social assistance (29%)
- Educational services (25%)
- Retail trade (14%)
- Accommodation and food services (7%)
- Finance and insurance (6%)
- Public administration (5%)
- Other services, except public administration (4%)
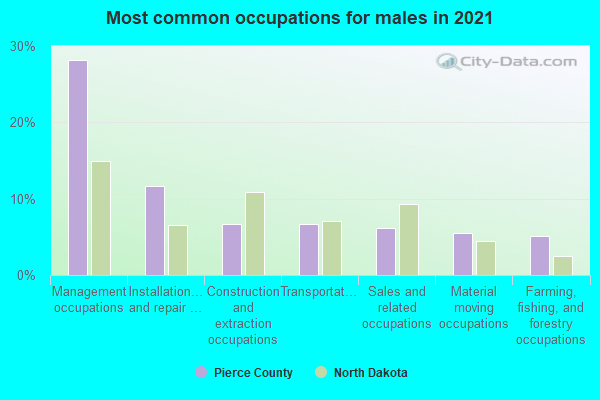
- Management occupations (31%)
- Installation, maintenance, and repair occupations (11%)
- Sales and related occupations (8%)
- Material moving occupations (8%)
- Construction and extraction occupations (7%)
- Transportation occupations (7%)
- Building and grounds cleaning and maintenance occupations (4%)
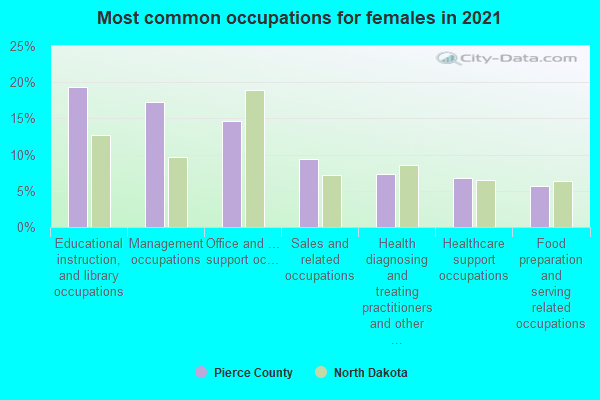
- Educational instruction, and library occupations (25%)
- Sales and related occupations (16%)
- Management occupations (13%)
- Office and administrative support occupations (10%)
- Food preparation and serving related occupations (8%)
- Healthcare support occupations (6%)
- Health diagnosing and treating practitioners and other technical occupations (6%)
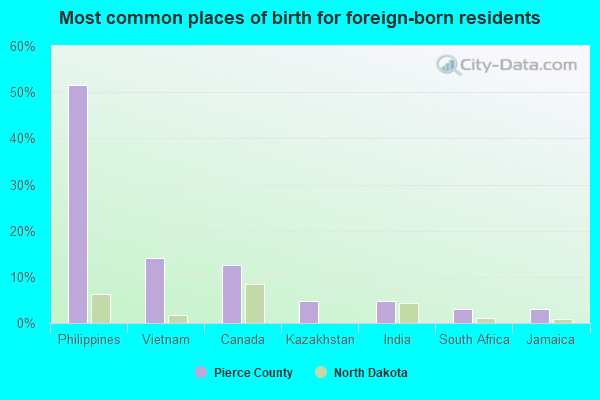
- Philippines (36%)
- Vietnam (23%)
- India (17%)
- Canada (11%)
- South Africa (4%)
- Jamaica (3%)
- Sweden (0%)
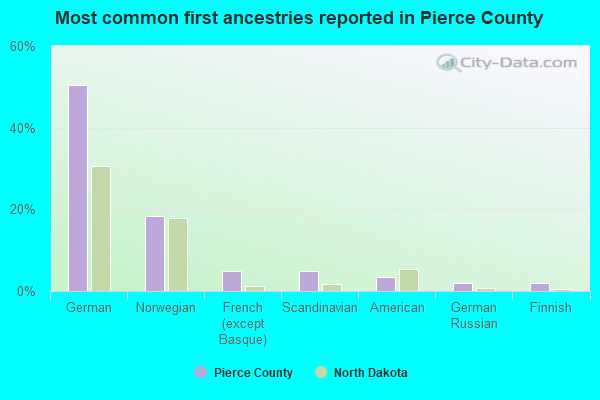
- German (49%)
- Norwegian (18%)
- American (6%)
- Scandinavian (3%)
- French (except Basque) (2%)
- German Russian (2%)
- Finnish (2%)
130 people in nursing facilities/skilled-nursing facilities
People in group quarters in Pierce County, North Dakota in 2000:
- 87 people in nursing homes
- 39 people in other noninstitutional group quarters
- 6 people in local jails and other confinement facilities (including police lockups)
- 2 people in religious group quarters
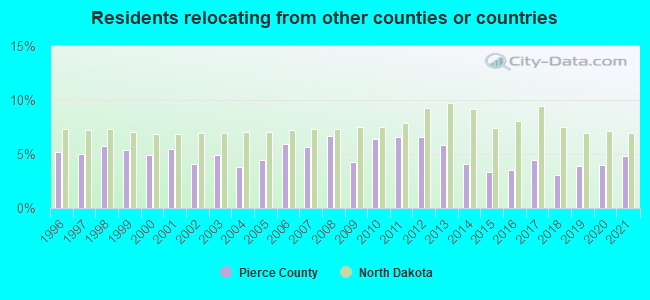
4.77% of this county's 2021 resident taxpayers lived in other counties in 2020 ($44,792 average adjusted gross income)
| Here: | 4.77% |
| North Dakota average: | 6.92% |
10 or fewer of this county's residents moved from foreign countries.
4.77% relocated from other counties in North Dakota ($44,792 average AGI)
10 or fewer of this county's residents relocated from other states.
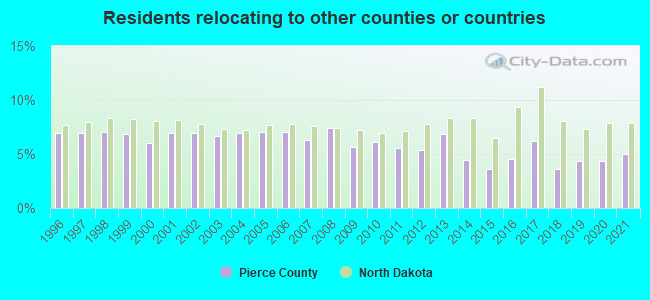
5.01% of this county's 2020 resident taxpayers moved to other counties in 2021 ($60,790 average adjusted gross income)
| Here: | 5.01% |
| North Dakota average: | 7.90% |
10 or fewer of this county's residents moved to foreign countries.
5.01% relocated to other counties in North Dakota ($60,790 average AGI)
10 or fewer of this county's residents relocated to other states.
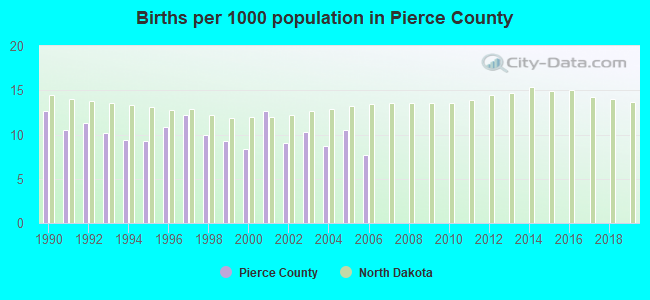
Births per 1000 population from 1990 to 1999: 10.6
Births per 1000 population from 2000 to 2006: 9.6
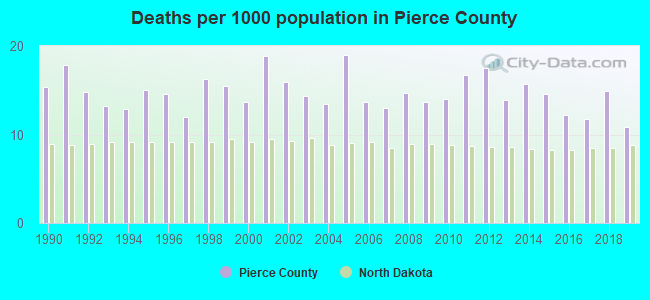
Deaths per 1000 population from 1990 to 1999: 14.8
Deaths per 1000 population from 2000 to 2009: 15.0
Deaths per 1000 population from 2010 to 2020: 14.4
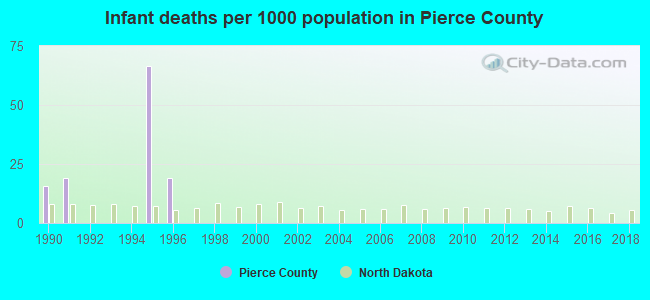
Infant deaths per 1000 live births from 1990 to 1999: 12.1
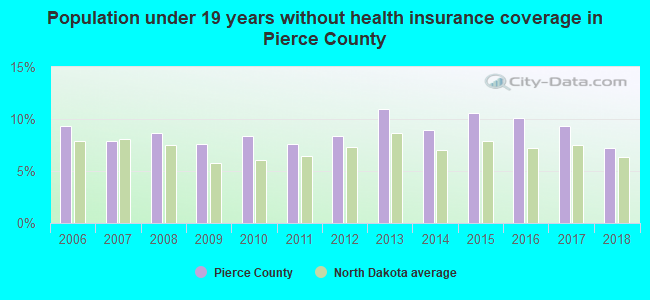
Persons under 19 years old without health insurance coverage in 2018: 7.2%
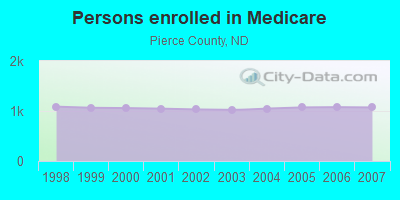
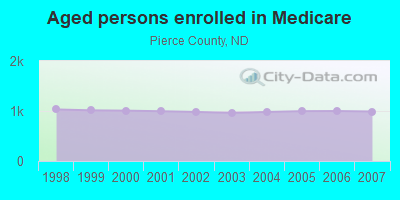
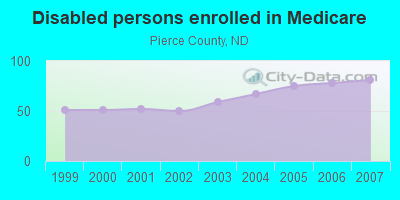
Persons enrolled in hospital insurance and/or supplemental medical insurance (Medicare) in July 1, 2007: 1,071 (990 aged, 81 disabled)
Children under 18 without health insurance coverage in 2007: 61 (7%)
Most common underlying causes of death in Pierce County, North Dakota in 1999 - 2019:
- Alzheimer disease, unspecified (10)
Population without health insurance coverage in 2000: 12%
Children under 18 without health insurance coverage in 2000: 12%
Short term general hospital admissions per 100,000 population in 2004: 24,788
Short term general hospital beds per 100,000 population in 2004: 4,131
Emergency room visits per 100,000 population in 2004: 47,785
General practice office based MDs per 100,000 population in 2005: 886
Medical specialist MDs per 100,000 population in 2005: 1,305
Dentists per 100,000 population in 1998: 23
Total births per 100,000 population, July 2005 - July 2006 : 43
Total deaths per 100,000 population, July 2005 - July 2006: 70
Household type by relationship:
Households: 4,011- Male householders: 817 (273 living alone), Female householders: 936 (334 living alone)
944 spouses (932 opposite-sex spouses), 56 unmarried partners, (56 opposite-sex unmarried partners), 994 children (972 natural, 16 adopted, 11 stepchildren), 5 grandchildren, 0 brothers or sisters, 0 parents, 0 foster children, 23 other relatives, 86 non-relatives
- In group quarters: 165
Size of family households: 551 2-persons, 259 3-persons, 149 4-persons, 27 5-persons, 48 6-persons, 6 7-or-more-persons.
Size of nonfamily households: 610 1-person, 91 2-persons.
688 married couples with children.
168 single-parent households (40 men, 128 women).
98.1% of residents of Pierce speak English at home.
0.5% of residents speak Spanish at home (89% speak English very well, 11% speak English well).
0.3% of residents speak other Indo-European language at home (92% speak English very well, 8% speak English not well).
1.1% of residents speak Asian or Pacific Island language at home (26% speak English very well, 58% speak English well, 16% speak English not well).
In fiscal year 2004:
Federal Government expenditure: $38,650,000 ($8,871 per capita)
Department of Defense expenditure: $662,000
Federal direct payments to individuals for retirement and disability: $12,135,000
Federal other direct payments to individuals: $7,155,000
Federal direct payments not to individuals: $11,025,000
Federal grants: $6,369,000
Federal procurement contracts: $232,000 ($0,000 Department of Defense)
Federal salaries and wages: $1,734,000 ($494,000 Department of Defense)
Federal Government direct loans: $974,000
Federal guaranteed/insured loans: $1,394,000
Federal Government insurance: $26,393,000
Population change from April 1, 2000 to July 1, 2005:
Births: 248| Here: | 58 per 1000 residents |
| State: | 64 per 1000 residents |
Deaths: 347
| Here: | 81 per 1000 residents |
| State: | 48 per 1000 residents |
Net international migration: +5
| Here: | +1 per 1000 residents |
| State: | +6 per 1000 residents |
Net internal migration: -283
| Here: | |
| State: |
Total withdrawal of fresh water for public supply: 0.58 millions of gallons per day (all from ground)
| Here: | 7.5 |
| State: | 7.0 |
| Here: | 4.5 |
| State: | 4.0 |
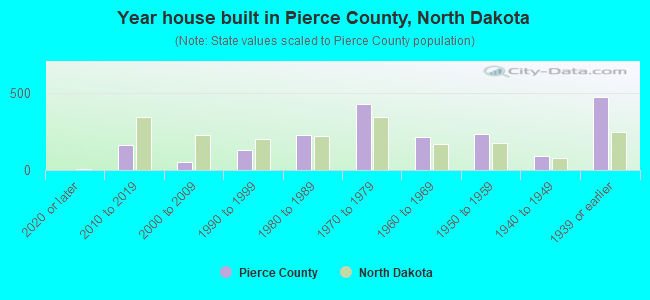
- Year house built in Pierce County, North Dakota
- 02020 or later
- 1342010 to 2019
- 902000 to 2009
- 1591990 to 1999
- 1401980 to 1989
- 5151970 to 1979
- 1421960 to 1969
- 2121950 to 1959
- 1141940 to 1949
- 4791939 or earlier
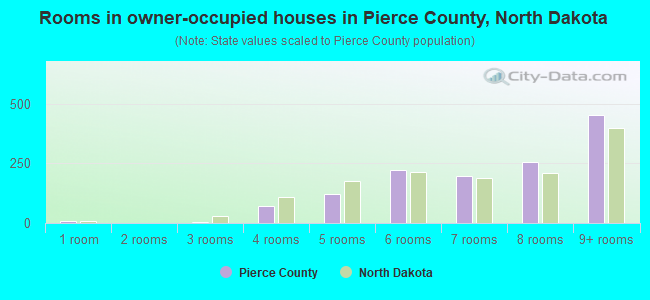
- Rooms in owner-occupied houses in Pierce County, North Dakota
- 31 room
- 02 rooms
- 03 rooms
- 674 rooms
- 1635 rooms
- 2736 rooms
- 2207 rooms
- 2568 rooms
- 4569+ rooms
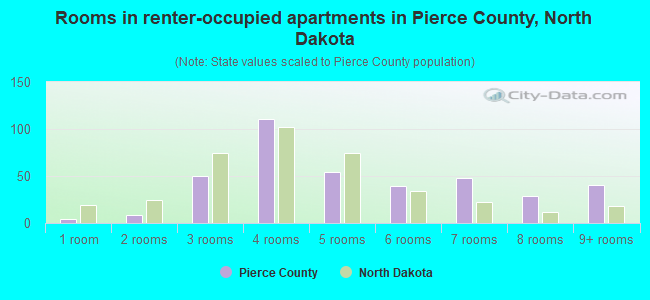
- Rooms in renter-occupied apartments in Pierce County, North Dakota
- 51 room
- 142 rooms
- 443 rooms
- 964 rooms
- 485 rooms
- 216 rooms
- 337 rooms
- 268 rooms
- 329+ rooms
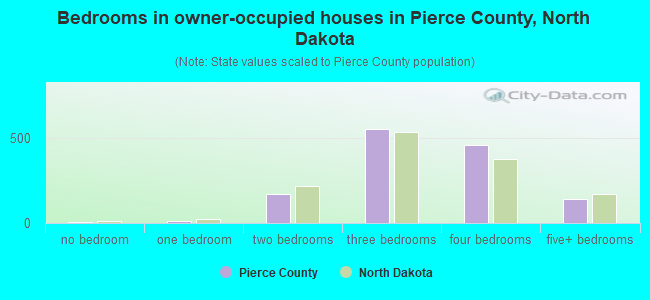
- Bedrooms in owner-occupied houses in Pierce County, North Dakota
- 5no bedroom
- 131 bedroom
- 1882 bedrooms
- 5803 bedrooms
- 5684 bedrooms
- 955+ bedrooms
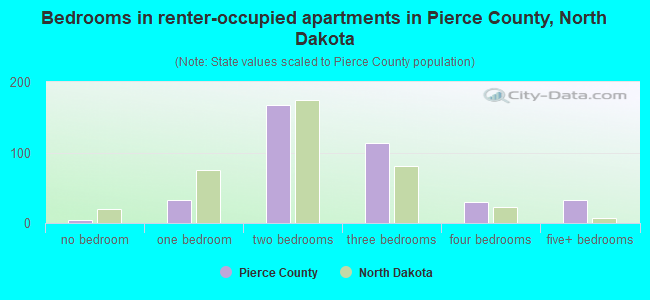
- Bedrooms in renter-occupied apartments in Pierce County, North Dakota
- 6no bedroom
- 311 bedroom
- 1512 bedrooms
- 863 bedrooms
- 164 bedrooms
- 355+ bedrooms
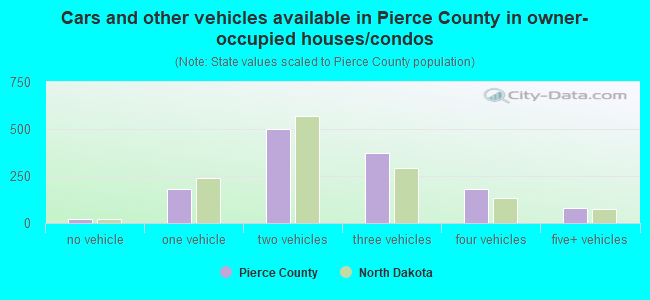
- Cars and other vehicles available in Pierce County in owner-occupied houses/condos
- 15no vehicle
- 2541 vehicle
- 5012 vehicles
- 3733 vehicles
- 1684 vehicles
- 1235+ vehicles
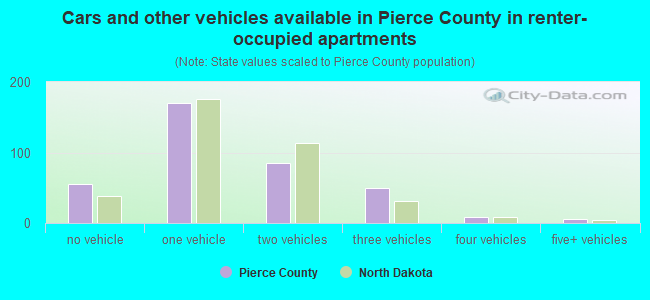
- Cars and other vehicles available in Pierce County in renter-occupied apartments
- 42no vehicle
- 1961 vehicle
- 412 vehicles
- 423 vehicles
- 94 vehicles
- 85+ vehicles
91.0% of Pierce County residents lived in the same house 1 years ago.
Out of people who lived in different houses, 38% lived in this county.
Out of people who lived in different counties, 59% lived in North Dakota.
| Pierce County: | 91.0% |
| State average: | 84.2% |
Place of birth for U.S.-born residents:
- This state: 3,062
- Other state: 848
- Northeast: 139
- Midwest: 394
- South: 70
- West: 251
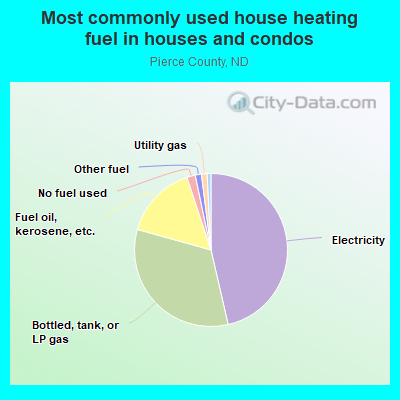
- 48.9%Electricity
- 33.5%Bottled, tank, or LP gas
- 10.3%Fuel oil, kerosene, etc.
- 4.3%Utility gas
- 1.3%Other fuel
- 1.0%Coal or coke
- 0.7%No fuel used
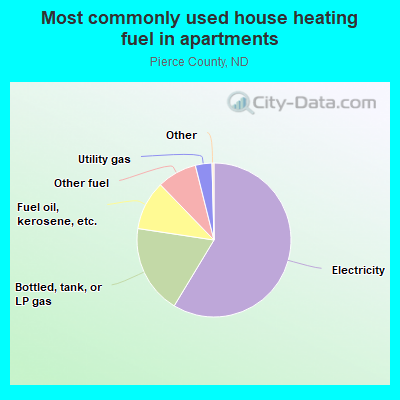
- 63.9%Electricity
- 11.6%Other fuel
- 10.4%Fuel oil, kerosene, etc.
- 9.9%Bottled, tank, or LP gas
- 4.2%Utility gas
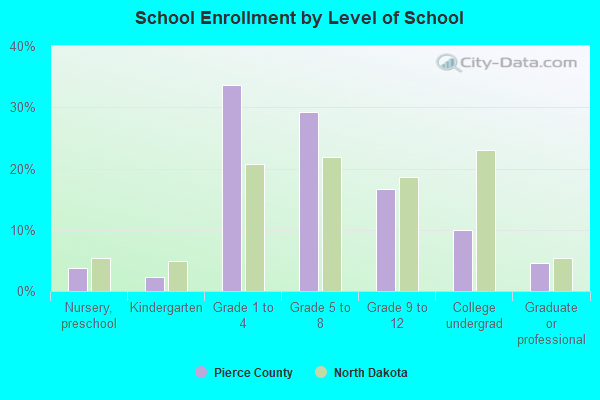
Private vs. public school enrollment:
| Here: | 11.9% |
| North Dakota: | 8.4% |
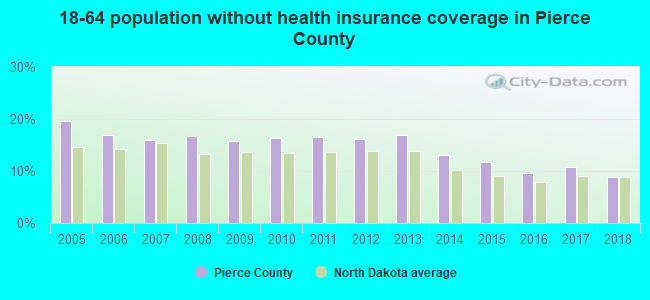
| Here: | 12.1% |
| North Dakota: | 8.2% |
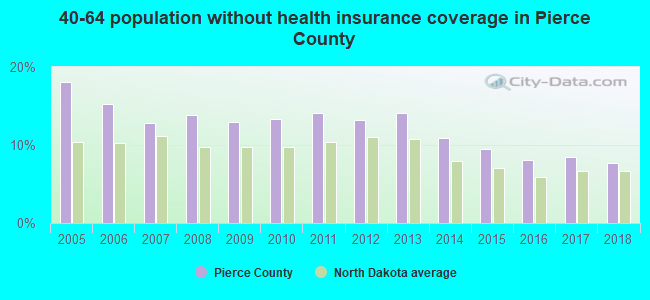
| Here: | 20.6% |
| North Dakota: | 14.3% |
Pierce County government finances - Expenditure in 2018:
- Assistance and Subsidies - Public Welfare, Cash Assistance Programs - Other: $3,000
- Charges - Other: $3,049,000
- Construction - Natural Resources - Other: $5,968,000
General Public Buildings: $359,000
- Current Operations - Correctional Institutions: $2,753,000
Regular Highways: $1,433,000
Public Welfare - Other: $618,000
Police Protection: $546,000
Central Staff Services: $435,000
Financial Administration: $279,000
General - Other: $211,000
Protective Inspection and Regulation - Other: $195,000
Judicial and Legal Services: $144,000
General Public Buildings: $106,000
Natural Resources - Other: $65,000
Parks and Recreation: $9,000
- General - Interest on Debt: $4,000
- Local Intergovernmental - Highways: $202,000
- Long Term Debt - Beginning Outstanding - Unspecified Public Purpose: $102,000
Outstanding Unspecified Public Purpose: $79,000
Retired Unspecified Public Purpose: $23,000
- Miscellaneous - Donations From Private Sources: $100,000
General Revenue - Other: $42,000
Interest Earnings: $21,000
Rents: $16,000
- Other Capital Outlay - Regular Highways: $330,000
General - Other: $19,000
Public Welfare - Other: $14,000
- Other Funds - Cash and Securities: $6,067,000
- State Intergovernmental - Highways: $510,000
General Local Government Support: $510,000
Public Welfare: $110,000
Other: $97,000
- Tax - Property: $2,166,000
Alcoholic Beverage License: $3,000
- Total Salaries and Wages: $2,910,000
Pierce County government finances - Revenue in 2018:
- Assistance and Subsidies - Public Welfare, Cash Assistance Programs - Other: $3,000
- Charges - Other: $3,049,000
- Construction - Natural Resources - Other: $5,968,000
General Public Buildings: $359,000
- Current Operations - Correctional Institutions: $2,753,000
Regular Highways: $1,433,000
Public Welfare - Other: $618,000
Police Protection: $546,000
Central Staff Services: $435,000
Financial Administration: $279,000
General - Other: $211,000
Protective Inspection and Regulation - Other: $195,000
Judicial and Legal Services: $144,000
General Public Buildings: $106,000
Natural Resources - Other: $65,000
Parks and Recreation: $9,000
- General - Interest on Debt: $4,000
- Local Intergovernmental - Highways: $202,000
- Long Term Debt - Beginning Outstanding - Unspecified Public Purpose: $102,000
Outstanding Unspecified Public Purpose: $79,000
Retired Unspecified Public Purpose: $23,000
- Miscellaneous - Donations From Private Sources: $100,000
General Revenue - Other: $42,000
Interest Earnings: $21,000
Rents: $16,000
- Other Capital Outlay - Regular Highways: $330,000
General - Other: $19,000
Public Welfare - Other: $14,000
- Other Funds - Cash and Securities: $6,067,000
- State Intergovernmental - Highways: $510,000
General Local Government Support: $510,000
Public Welfare: $110,000
Other: $97,000
- Tax - Property: $2,166,000
Alcoholic Beverage License: $3,000
- Total Salaries and Wages: $2,910,000
Pierce County government finances - Debt in 2018:
- Assistance and Subsidies - Public Welfare, Cash Assistance Programs - Other: $3,000
- Charges - Other: $3,049,000
- Construction - Natural Resources - Other: $5,968,000
General Public Buildings: $359,000
- Current Operations - Correctional Institutions: $2,753,000
Regular Highways: $1,433,000
Public Welfare - Other: $618,000
Police Protection: $546,000
Central Staff Services: $435,000
Financial Administration: $279,000
General - Other: $211,000
Protective Inspection and Regulation - Other: $195,000
Judicial and Legal Services: $144,000
General Public Buildings: $106,000
Natural Resources - Other: $65,000
Parks and Recreation: $9,000
- General - Interest on Debt: $4,000
- Local Intergovernmental - Highways: $202,000
- Long Term Debt - Beginning Outstanding - Unspecified Public Purpose: $102,000
Outstanding Unspecified Public Purpose: $79,000
Retired Unspecified Public Purpose: $23,000
- Miscellaneous - Donations From Private Sources: $100,000
General Revenue - Other: $42,000
Interest Earnings: $21,000
Rents: $16,000
- Other Capital Outlay - Regular Highways: $330,000
General - Other: $19,000
Public Welfare - Other: $14,000
- Other Funds - Cash and Securities: $6,067,000
- State Intergovernmental - Highways: $510,000
General Local Government Support: $510,000
Public Welfare: $110,000
Other: $97,000
- Tax - Property: $2,166,000
Alcoholic Beverage License: $3,000
- Total Salaries and Wages: $2,910,000
Pierce County government finances - Cash and Securities in 2018:
- Assistance and Subsidies - Public Welfare, Cash Assistance Programs - Other: $3,000
- Charges - Other: $3,049,000
- Construction - Natural Resources - Other: $5,968,000
General Public Buildings: $359,000
- Current Operations - Correctional Institutions: $2,753,000
Regular Highways: $1,433,000
Public Welfare - Other: $618,000
Police Protection: $546,000
Central Staff Services: $435,000
Financial Administration: $279,000
General - Other: $211,000
Protective Inspection and Regulation - Other: $195,000
Judicial and Legal Services: $144,000
General Public Buildings: $106,000
Natural Resources - Other: $65,000
Parks and Recreation: $9,000
- General - Interest on Debt: $4,000
- Local Intergovernmental - Highways: $202,000
- Long Term Debt - Beginning Outstanding - Unspecified Public Purpose: $102,000
Outstanding Unspecified Public Purpose: $79,000
Retired Unspecified Public Purpose: $23,000
- Miscellaneous - Donations From Private Sources: $100,000
General Revenue - Other: $42,000
Interest Earnings: $21,000
Rents: $16,000
- Other Capital Outlay - Regular Highways: $330,000
General - Other: $19,000
Public Welfare - Other: $14,000
- Other Funds - Cash and Securities: $6,067,000
- State Intergovernmental - Highways: $510,000
General Local Government Support: $510,000
Public Welfare: $110,000
Other: $97,000
- Tax - Property: $2,166,000
Alcoholic Beverage License: $3,000
- Total Salaries and Wages: $2,910,000
Supplemental Security Income (SSI) in 2006:
- Total number of recipients: 53
- Number of aged recipients: 14
- Number of blind and disabled recipients: 39
- Number of recipients under 18: 5
- Number of recipients between 18 and 64: 29
- Number of recipients older than 64: 19
- Number of recipients also receiving OASDI: 29
- Amount of payments (thousands of dollars): 16
| Most common first names in Pierce County, ND among deceased individuals | ||
| Name | Count | Lived (average) |
|---|---|---|
| John | 51 | 79.3 years |
| Mary | 40 | 82.7 years |
| Elizabeth | 26 | 85.6 years |
| Anna | 22 | 87.5 years |
| Anton | 18 | 80.3 years |
| Margaret | 18 | 81.6 years |
| Frank | 17 | 78.9 years |
| Joseph | 17 | 76.9 years |
| Joe | 17 | 78.0 years |
| Carl | 17 | 83.9 years |
| Most common last names in Pierce County, ND among deceased individuals | ||
| Last name | Count | Lived (average) |
|---|---|---|
| Volk | 28 | 78.2 years |
| Johnson | 25 | 79.9 years |
| Voeller | 22 | 76.5 years |
| Axtman | 20 | 82.2 years |
| Nelson | 18 | 77.6 years |
| Halvorson | 18 | 83.5 years |
| Brossart | 17 | 74.0 years |
| Anderson | 16 | 86.4 years |
| Olson | 16 | 82.4 years |
| Jelsing | 15 | 78.1 years |
| Businesses in Pierce County, ND | ||||
| Name | Count | Name | Count | |
|---|---|---|---|---|
| Chevrolet | 1 | H&R Block | 1 | |
| Dairy Queen | 1 | Lane Furniture | 1 | |
| Ford | 1 | |||
Pierce County on our top lists:
- #61 on the list of "Top 101 counties with the largest number of people without health insurance coverage in 2000"
- #79 on the list of "Top 101 counties with the highest number of deaths per 1000 residents 2007-2013"