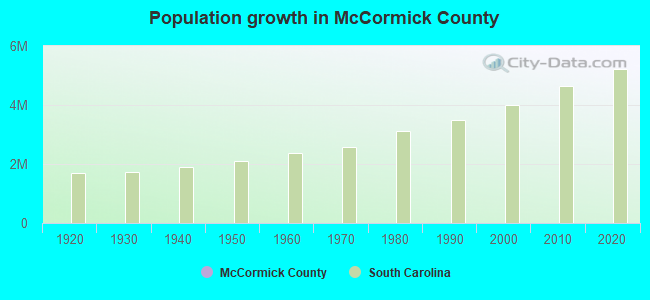
McCormick County, South Carolina (SC)
County owner-occupied free and clear houses and condos in 2010: 1,563
County owner-occupied houses and condos in 2000: 2,884
Renter-occupied apartments: 810 (it was 674 in 2000)
| % of renters here: | 19% |
| State: | 31% |
Land area: 360 sq. mi.
Water area: 34.3 sq. mi.
Population density: 27 people per square mile (low).
Industries providing employment: Educational, health and social services (26.6%), Manufacturing (18.1%).
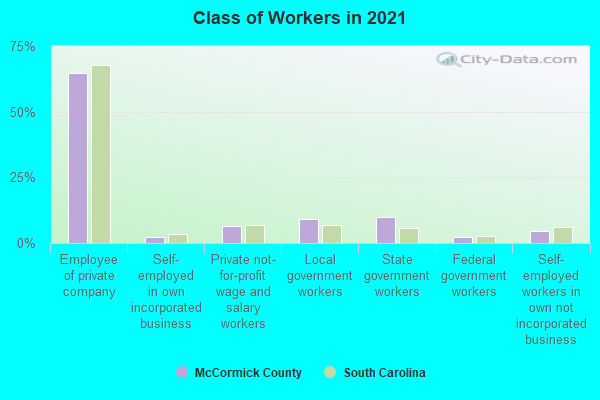
Type of workers:
- Private wage or salary: 71%
- Government: 24%
- Self-employed, not incorporated: 5%
- Unpaid family work: 0%
- OSM Map
- General Map
- Google Map
- MSN Map

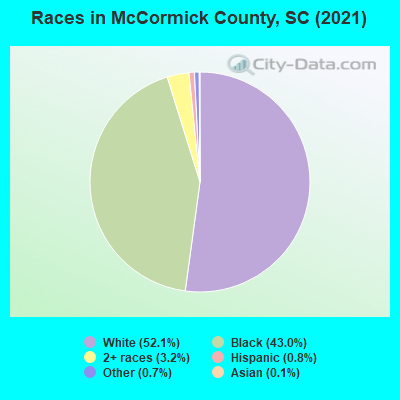
- 5,15552.6%White Non-Hispanic Alone
- 4,16842.6%Black Non-Hispanic Alone
- 2702.8%Two or more races
- 1041.1%Some other race alone
- 640.7%Hispanic or Latino
- 230.2%Asian alone
- 80.08%Native Hawaiian and Other
Pacific Islander alone
| Median resident age: | 58.6 years |
| South Carolina median age: | 40.5 years |
| Males: 5,310 | |
| Females: 4,563 |

 | Greenville infrastructure n growth (182 replies) |
| McCormick Details / Info / Thoughts & more (44 replies) |
| Most Rural Locations? (19 replies) |
| Does this cover Anderson, Abbevile, Greenwood Counties? (14 replies) |
| Columbia vs. Greensboro, NC (125 replies) |
| Looking at Aiken (13 replies) |
| McCormick County: | 2.0 people |
| South Carolina: | 2 people |
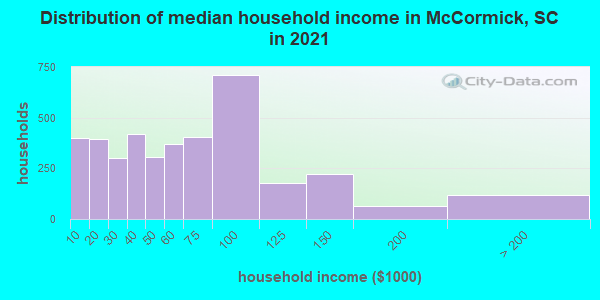
Estimated median household income in 2022: $55,998 ($31,577 in 1999)
| This county: | $55,998 |
| South Carolina: | $64,115 |
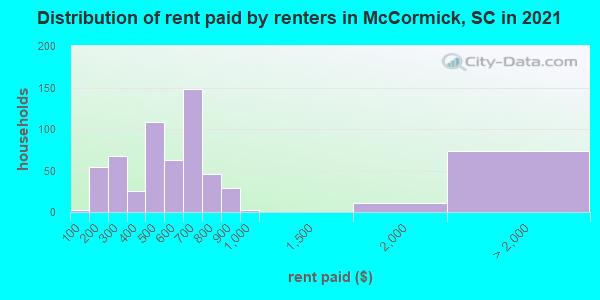
Median contract rent in 2022 for apartments: $532 (lower quartile is $329, upper quartile is $743)
| This county: | $532 |
| State: | $893 |
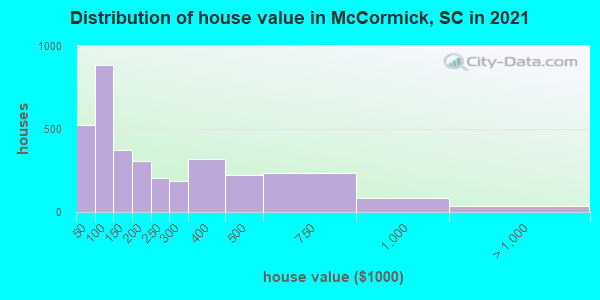
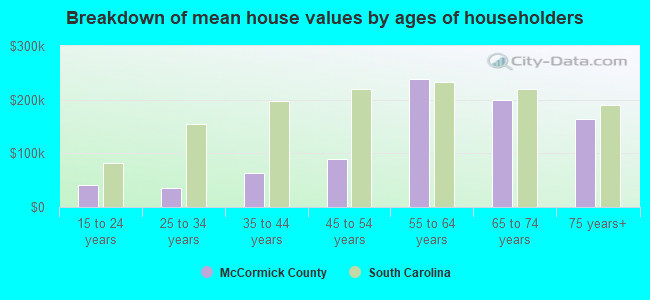
Estimated median house or condo value in 2022: $140,725 (it was $56,200 in 2000)
| McCormick: | $140,725 |
| South Carolina: | $254,600 |
Median monthly housing costs for homes and condos with a mortgage: $1,132
Median monthly housing costs for units without a mortgage: $449
Institutionalized population: 1,293
Crime in 2021 (reported by the sheriff's office or county police, not the county total):
- Murders: 1
- Rapes: 0
- Robberies: 0
- Assaults: 6
- Burglaries: 1
- Thefts: 14
- Auto thefts: 3
Crime in 2020 (reported by the sheriff's office or county police, not the county total):
- Murders: 0
- Rapes: 0
- Robberies: 0
- Assaults: 5
- Burglaries: 11
- Thefts: 54
- Auto thefts: 6
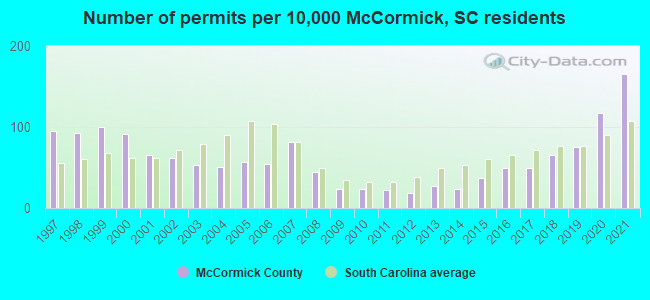
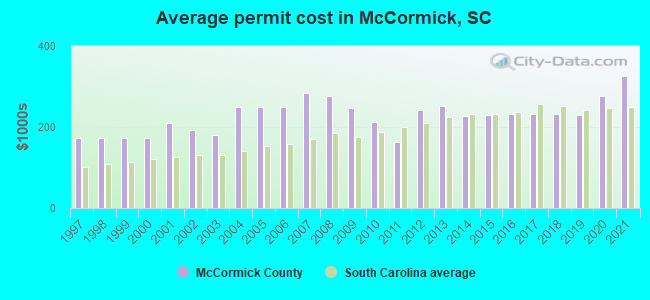
Single-family new house construction building permits:
- 2022: 151 buildings, average cost: $410,600
- 2021: 165 buildings, average cost: $327,000
- 2020: 117 buildings, average cost: $275,700
- 2019: 75 buildings, average cost: $228,500
- 2018: 65 buildings, average cost: $231,100
- 2017: 49 buildings, average cost: $233,200
- 2016: 50 buildings, average cost: $231,200
- 2015: 37 buildings, average cost: $228,700
- 2014: 24 buildings, average cost: $225,700
- 2013: 27 buildings, average cost: $252,600
- 2012: 19 buildings, average cost: $243,200
- 2011: 22 buildings, average cost: $163,900
- 2010: 24 buildings, average cost: $212,000
- 2009: 24 buildings, average cost: $248,300
- 2008: 45 buildings, average cost: $277,200
- 2007: 82 buildings, average cost: $283,600
- 2006: 54 buildings, average cost: $248,900
- 2005: 57 buildings, average cost: $248,900
- 2004: 51 buildings, average cost: $248,900
- 2003: 53 buildings, average cost: $179,900
- 2002: 62 buildings, average cost: $193,000
- 2001: 66 buildings, average cost: $209,900
- 2000: 91 buildings, average cost: $171,900
- 1999: 100 buildings, average cost: $171,900
- 1998: 93 buildings, average cost: $171,900
- 1997: 95 buildings, average cost: $171,900
Median real estate property taxes paid for housing units with mortgages in 2022: $1,100 (0.7%)
Median real estate property taxes paid for housing units with no mortgage in 2022: $839 (0.6%)
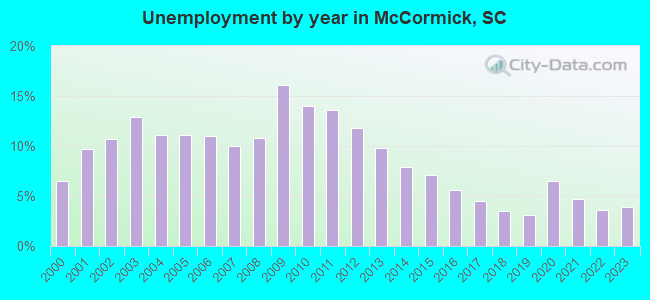
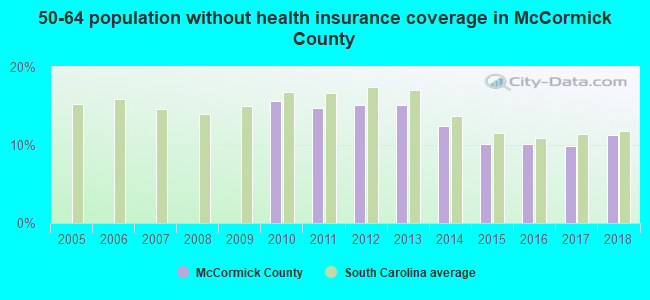
| McCormick County: | 16.2% |
| South Carolina: | 14.0% |
Median age of residents in 2022: 58.6 years old
(Males: 55.1 years old, Females: 61.2 years old)
(Median age for: White residents: 65.3 years old, Black residents: 45.5 years old, Hispanic or Latino residents: 63.6 years old, Other race residents: 61.4 years old)
Fair market rent in 2006 for a 1-bedroom apartment in McCormick County is $423 a month.
Fair market rent for a 2-bedroom apartment is $486 a month.
Fair market rent for a 3-bedroom apartment is $672 a month.
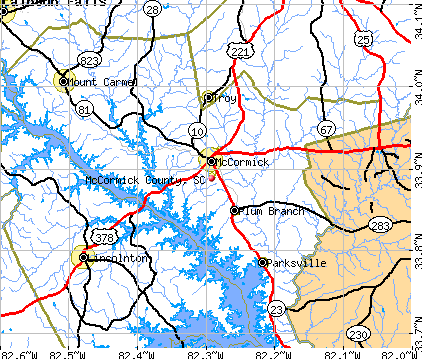
Cities in this county include: McCormick, Clarks Hill, Modoc, Mount Carmel, Willington, Parksville, Plum Branch.
Neighboring counties: Berkeley County  , Custer County, Oklahoma
  , Marion County, Alabama , Cooke County, Texas , Wise County, Texas .
| Here: | 3.5% |
| South Carolina: | 3.1% |
Current college students: 255
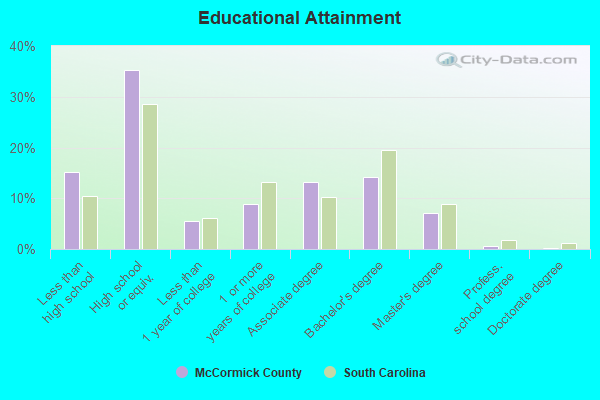
People 25 years of age or older with a high school degree or higher: 85.2%
People 25 years of age or older with a bachelor's degree or higher: 21.3%
Number of foreign born residents: 131 (76.6% naturalized citizens)
| McCormick County: | 1.3% |
| Whole state: | 5.2% |
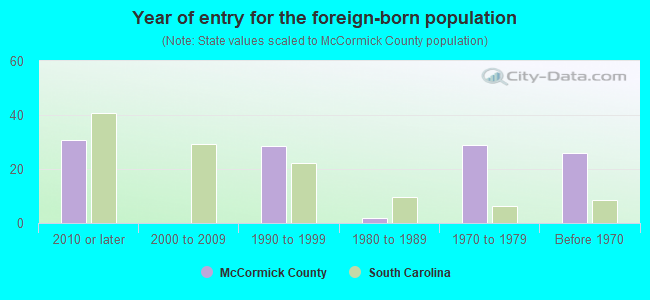
- Year of entry for the foreign-born population
- 192010 or later
- 02000 to 2009
- 221990 to 1999
- 21980 to 1989
- 291970 to 1979
- 26Before 1970
Mean travel time to work (commute): " minutes
Percentage of county residents living and working in this county: 79.9%


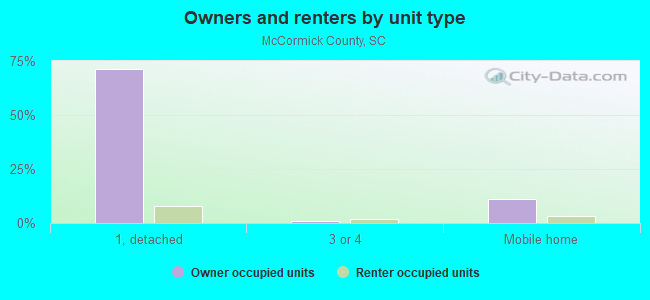
Housing units in structures:
- One, detached: 4,084
- One, attached: 39
- Two: 48
- 3 or 4: 130
- 5 to 9: 84
- 10 to 19: 37
- 20 or more: 4
- Mobile homes: 1,185
Housing units in McCormick County with a mortgage: 1,333 (140 second mortgage, 0 home equity loan, 129 both second mortgage and home equity loan)
Houses without a mortgage: 57
| Here: | 1.7% with mortgage |
| State: | 97.3% with mortgage |
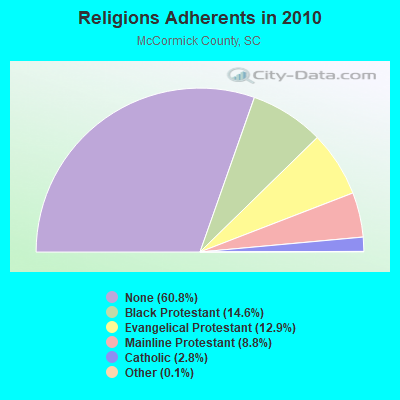
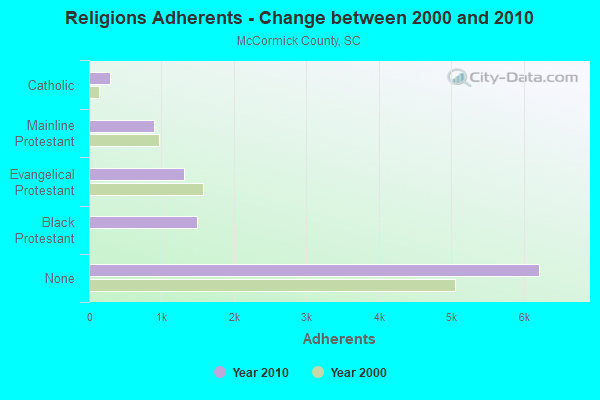
Religion statistics for McCormick County
| Religion | Adherents | Congregations |
|---|---|---|
| Black Protestant | 1,494 | 11 |
| Evangelical Protestant | 1,317 | 11 |
| Mainline Protestant | 900 | 6 |
| Catholic | 290 | 1 |
| Other | 13 | - |
| None | 6,219 | - |
Source: Clifford Grammich, Kirk Hadaway, Richard Houseal, Dale E.Jones, Alexei Krindatch, Richie Stanley and Richard H.Taylor. 2012. 2010 U.S.Religion Census: Religious Congregations & Membership Study. Association of Statisticians of American Religious Bodies. Jones, Dale E., et al. 2002. Congregations and Membership in the United States 2000. Nashville, TN: Glenmary Research Center.
Food Environment Statistics:
| McCormick County: | 3.97 / 10,000 pop. |
| State: | 1.99 / 10,000 pop. |
| This county: | 3.97 / 10,000 pop. |
| South Carolina: | 0.85 / 10,000 pop. |
| McCormick County: | 6.95 / 10,000 pop. |
| South Carolina: | 5.38 / 10,000 pop. |
| This county: | 2.98 / 10,000 pop. |
| State: | 7.75 / 10,000 pop. |
| McCormick County: | 13.2% |
| South Carolina: | 10.6% |
| McCormick County: | 31.3% |
| State: | 29.4% |
| Here: | 11.0% |
| State: | 13.4% |
Agriculture in McCormick County:
Average size of farms: 240 acresAverage value of agricultural products sold per farm: $15,770
Average value of crops sold per acre for harvested cropland: $69.61
The value of livestock, poultry, and their products as a percentage of the total market value of agricultural products sold: 91.35%
Average total farm production expenses per farm: $20,661
Harvested cropland as a percentage of land in farms: 8.16%
Irrigated harvested cropland as a percentage of land in farms: 0.79%
Average market value of all machinery and equipment per farm: $24,460
The percentage of farms operated by a family or individual: 96.91%
Average age of principal farm operators: 59 years
Average number of cattle and calves per 100 acres of all land in farms: 15.15
Milk cows as a percentage of all cattle and calves: 0.45%
Land in orchards: 25 acres
Earthquake activity:
McCormick County-area historical earthquake activity is significantly above South Carolina state average. It is 1% smaller than the overall U.S. average.On 8/2/1974 at 08:52:09, a magnitude 4.9 (4.3 MB, 4.9 LG, Class: Light, Intensity: IV - V) earthquake occurred 11.3 miles away from McCormick County center
On 8/9/2020 at 12:07:37, a magnitude 5.1 (5.1 MW, Depth: 4.7 mi, Class: Moderate, Intensity: VI - VII) earthquake occurred 191.4 miles away from the county center
On 2/15/2014 at 03:23:38, a magnitude 4.1 (4.1 MW, Depth: 3.2 mi) earthquake occurred 12.5 miles away from the county center
On 11/22/1974 at 05:25:55, a magnitude 4.7 (4.7 MB) earthquake occurred 141.6 miles away from the county center
On 4/29/2003 at 08:59:39, a magnitude 4.9 (4.4 MB, 4.6 MW, 4.9 LG) earthquake occurred 195.4 miles away from McCormick County center
On 11/30/1973 at 07:48:41, a magnitude 4.7 (4.7 MB, 4.6 ML) earthquake occurred 162.7 miles away from the county center
Magnitude types: regional Lg-wave magnitude (LG), body-wave magnitude (MB), local magnitude (ML), moment magnitude (MW)
Most recent natural disasters:
- South Carolina Covid-19 Pandemic, Incident Period: January 20, 2020, FEMA Id: 4492, Natural disaster type: Other
- South Carolina Hurricane Irma, Incident Period: September 6, 2017 - September 13, 2017, FEMA Id: 4346, Natural disaster type: Hurricane
- South Carolina Hurricane Matthew, Incident Period: October 04, 2016 to October 30, 2016, Emergency Declared EM-3378: October 06, 2016, FEMA Id: 3378, Natural disaster type: Hurricane
- South Carolina Severe Storms and Flooding, Incident Period: October 01, 2015 to October 23, 2015, Emergency Declared EM-3373: October 03, 2015, FEMA Id: 3373, Natural disaster type: Storm, Flood
- South Carolina Severe Storms and Flooding, Incident Period: October 01, 2015 to October 23, 2015, Major Disaster (Presidential) Declared DR-4241: October 05, 2015, FEMA Id: 4241, Natural disaster type: Storm, Flood
- South Carolina Severe Winter Storm, Incident Period: February 10, 2014 to February 19, 2014, Emergency Declared EM-3369: February 12, 2014, FEMA Id: 3369, Natural disaster type: Winter Storm
- South Carolina Hurricane Katrina Evacuation, Incident Period: August 29, 2005 to October 01, 2005, Emergency Declared EM-3233: September 10, 2005, FEMA Id: 3233, Natural disaster type: Hurricane
- South Carolina Severe Ice Storm, Incident Period: January 26, 2004 to January 30, 2004, Major Disaster (Presidential) Declared DR-1509: February 13, 2004, FEMA Id: 1509, Natural disaster type: Ice Storm
- South Carolina Winter Storms, Incident Period: January 22, 2000 to February 01, 2000, Major Disaster (Presidential) Declared DR-1313: January 31, 2000, FEMA Id: 1313, Natural disaster type: Winter Storm
- South Carolina Drought, Incident Period: August 04, 1977, Emergency Declared EM-3047: August 04, 1977, FEMA Id: 3047, Natural disaster type: Drought
The number of natural disasters in McCormick County (10) is smaller than the US average (15).
Major Disasters (Presidential) Declared: 3
Emergencies Declared: 5
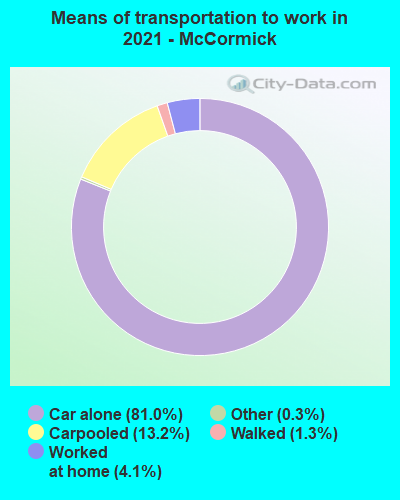
Means of transportation to work:
- Drove a car alone: 1,649 (75.6%)
- Carpooled: 232 (10.6%)
- Bus: 2 (0.1%)
- Taxicab, motorcycle, or other means: 4 (0.2%)
- Walked: 32 (1.5%)
- Worked at home: 261 (12.0%)
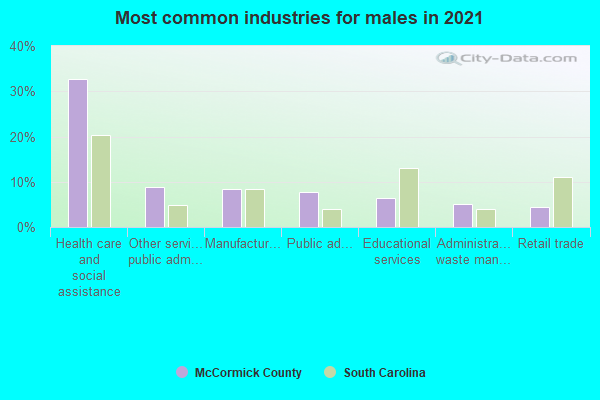
- Health care and social assistance (28%)
- Educational services (12%)
- Public administration (10%)
- Other services, except public administration (8%)
- Manufacturing (7%)
- Retail trade (5%)
- Administrative and support and waste management services (4%)
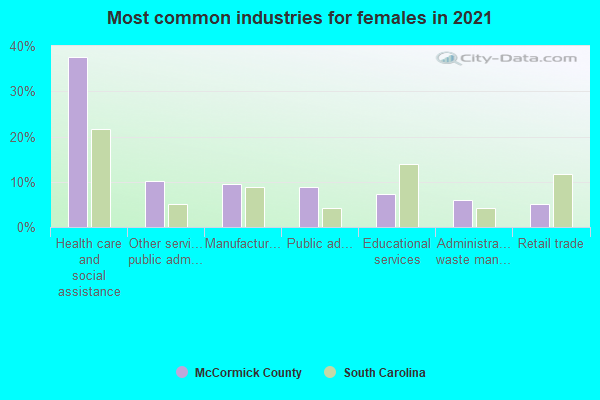
- Health care and social assistance (31%)
- Educational services (13%)
- Public administration (11%)
- Other services, except public administration (9%)
- Manufacturing (8%)
- Retail trade (6%)
- Administrative and support and waste management services (5%)
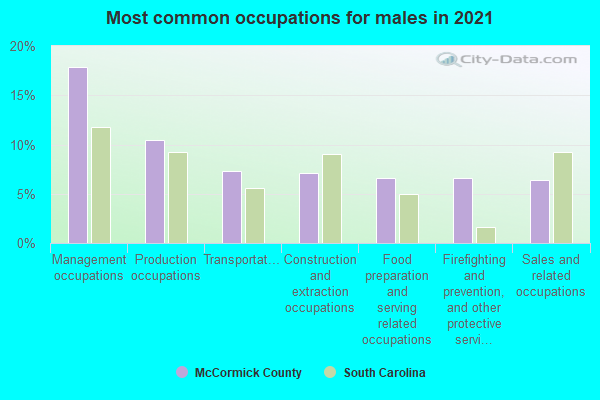
- Management occupations (15%)
- Production occupations (12%)
- Sales and related occupations (8%)
- Firefighting and prevention, and other protective service workers including supervisors (7%)
- Food preparation and serving related occupations (7%)
- Installation, maintenance, and repair occupations (7%)
- Transportation occupations (6%)
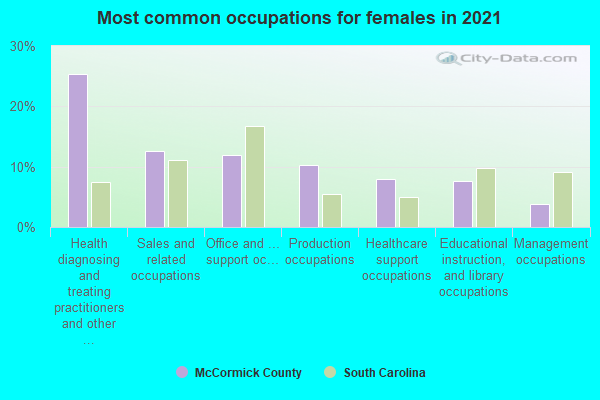
- Health diagnosing and treating practitioners and other technical occupations (21%)
- Office and administrative support occupations (12%)
- Educational instruction, and library occupations (12%)
- Sales and related occupations (11%)
- Production occupations (9%)
- Healthcare support occupations (7%)
- Management occupations (7%)
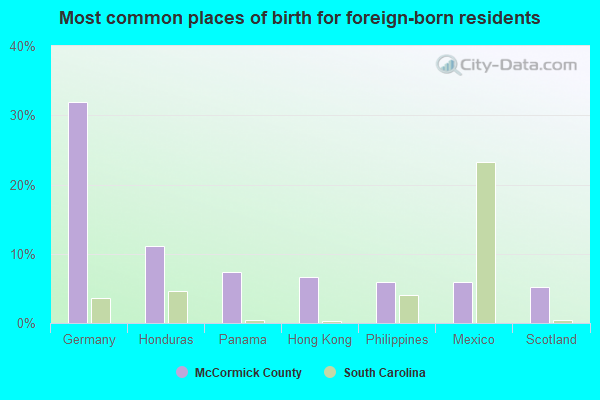
- Germany (38%)
- Philippines (16%)
- Hong Kong (9%)
- Honduras (8%)
- Ireland (6%)
- United Kingdom, excluding England and Scotland (6%)
- Other Northern Africa (4%)
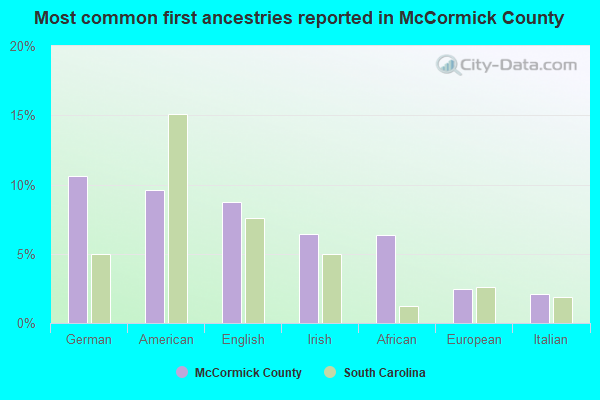
- American (14%)
- English (12%)
- African (9%)
- German (9%)
- Irish (8%)
- Italian (3%)
- Scottish (2%)
People in group quarters in McCormick County, South Carolina in 2010:
- 1,244 people in state prisons
- 38 people in residential treatment centers for juveniles (non-correctional)
- 11 people in group homes for juveniles (non-correctional)
- 7 people in residential treatment centers for adults
- 6 people in emergency and transitional shelters (with sleeping facilities) for people experiencing homelessness
People in group quarters in McCormick County, South Carolina in 2000:
- 1,170 people in state prisons
- 136 people in other noninstitutional group quarters
- 111 people in nursing homes
- 12 people in local jails and other confinement facilities (including police lockups)
- 10 people in homes for abused, dependent, and neglected children
- 7 people in homes for the mentally retarded
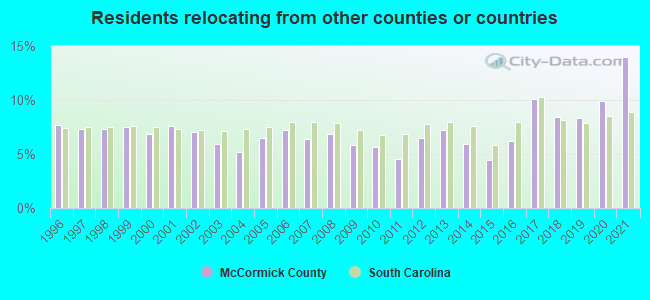
13.96% of this county's 2021 resident taxpayers lived in other counties in 2020 ($81,651 average adjusted gross income)
| Here: | 13.96% |
| South Carolina average: | 8.89% |
10 or fewer of this county's residents moved from foreign countries.
5.52% relocated from other counties in South Carolina ($16,603 average AGI)
8.44% relocated from other states ($65,047 average AGI)
McCormick County: 8.44% South Carolina average: 4.96%
Top counties from which taxpayers relocated into this county between 2020 and 2021:
| from Aiken County, SC | |
| from Columbia County, GA | |
| from Greenwood County, SC |
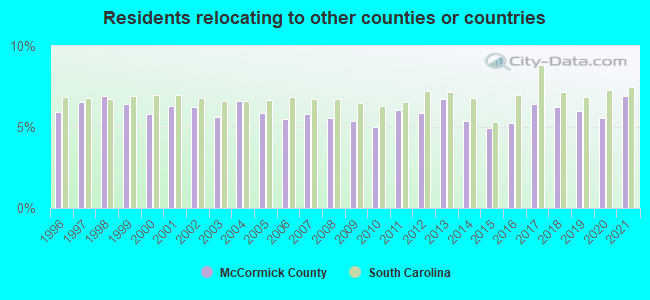
6.91% of this county's 2020 resident taxpayers moved to other counties in 2021 ($50,302 average adjusted gross income)
| Here: | 6.91% |
| South Carolina average: | 7.46% |
10 or fewer of this county's residents moved to foreign countries.
3.86% relocated to other counties in South Carolina ($23,078 average AGI)
3.04% relocated to other states ($27,224 average AGI)
McCormick County: 3.04% South Carolina average: 3.47%
Top counties to which taxpayers relocated from this county between 2020 and 2021:
| to Greenwood County, SC | |
| to Aiken County, SC |
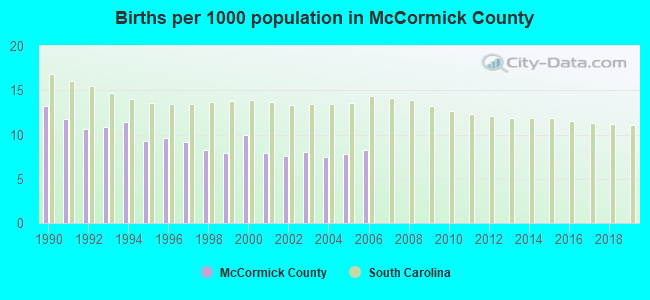
Births per 1000 population from 1990 to 1999: 10.2
Births per 1000 population from 2000 to 2006: 8.1
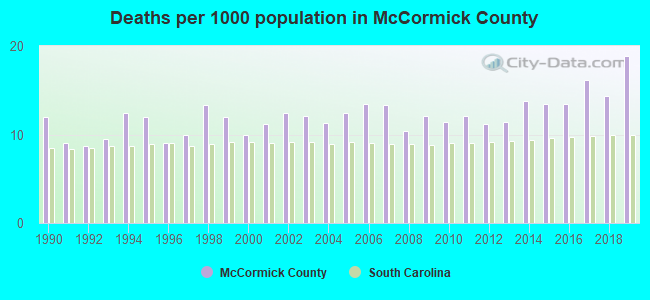
Deaths per 1000 population from 1990 to 1999: 10.8
Deaths per 1000 population from 2000 to 2009: 11.9
Deaths per 1000 population from 2010 to 2020: 13.9
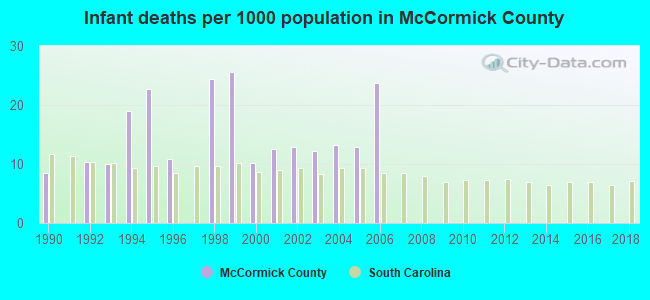
Infant deaths per 1000 live births from 1990 to 1999: 13.1
Infant deaths per 1000 live births from 2000 to 2006: 13.9
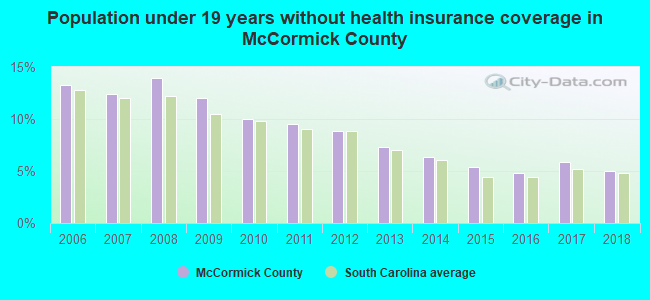
Persons under 19 years old without health insurance coverage in 2018: 5.0%
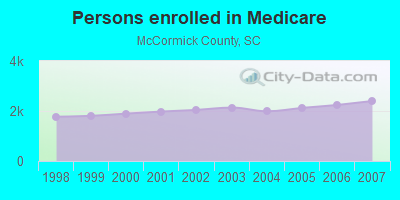
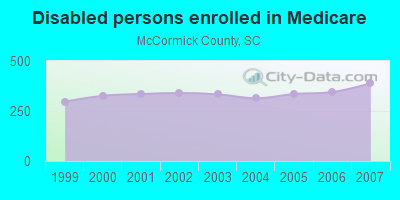
Persons enrolled in hospital insurance and/or supplemental medical insurance (Medicare) in July 1, 2007: 2,399 (2,010 aged, 389 disabled)
Children under 18 without health insurance coverage in 2007: 194 (12%)

Most common underlying causes of death in McCormick County, South Carolina in 1999 - 2019:
- Acute myocardial infarction, unspecified (175)
- Unspecified dementia (117)
- Bronchus or lung, unspecified - Malignant neoplasms (81)
- Alzheimer disease, unspecified (56)
- Atherosclerotic heart disease (10)
- Unspecified diabetes mellitus, without complications (10)
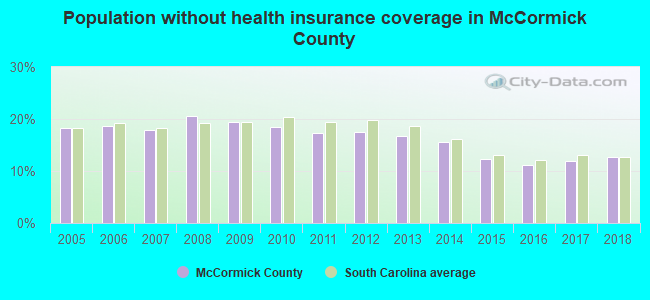
Population without health insurance coverage in 2000: 12%
Children under 18 without health insurance coverage in 2000: 8%
Medical specialist MDs per 100,000 population in 2005: 1,217
Dentists per 100,000 population in 1998: 10
Total births per 100,000 population, July 2005 - July 2006 : 31
Total deaths per 100,000 population, July 2005 - July 2006: 40
Crimes per 100,000 population in 1996: 1
Household type by relationship:
Households: 9,873- Male householders: 2,129 (513 living alone), Female householders: 2,033 (753 living alone)
2,100 spouses (2,100 opposite-sex spouses), 57 unmarried partners, (57 opposite-sex unmarried partners), 1,536 children (1,458 natural, 17 adopted, 57 stepchildren), 306 grandchildren, 51 brothers or sisters, 105 parents, 178 foster children, 203 other relatives, 267 non-relatives
- In group quarters: 976
Size of family households: 2,161 2-persons, 359 3-persons, 109 4-persons, 84 5-persons, 44 6-persons, 24 7-or-more-persons.
Size of nonfamily households: 1,267 1-person, 130 2-persons, 16 5-persons, 25 6-persons.
134 married couples with children.
415 single-parent households (41 men, 374 women).
99.3% of residents of McCormick speak English at home.
0.7% of residents speak Spanish at home (78% speak English very well, 22% speak English well).
0.6% of residents speak other Indo-European language at home (97% speak English very well, 3% speak English well).
0.1% of residents speak Asian or Pacific Island language at home (100% speak English very well).
In fiscal year 2004:
Federal Government expenditure: $77,446,000 ($7,643 per capita)
Department of Defense expenditure: $15,196,000
Federal direct payments to individuals for retirement and disability: $36,329,000
Federal other direct payments to individuals: $10,058,000
Federal direct payments not to individuals: $48,000
Federal grants: $17,517,000
Federal procurement contracts: $6,860,000 ($6,413,000 Department of Defense)
Federal salaries and wages: $6,634,000 ($4,937,000 Department of Defense)
Federal Government direct loans: $0,000
Federal guaranteed/insured loans: $521,000
Federal Government insurance: $4,996,000
Population change from April 1, 2000 to July 1, 2005:
Births: 469| Here: | 46 per 1000 residents |
| State: | 69 per 1000 residents |
Deaths: 630
| Here: | 62 per 1000 residents |
| State: | 46 per 1000 residents |
Net international migration: 0
| Here: | 0 per 1000 residents |
| State: | +9 per 1000 residents |
Net internal migration: +331
| Here: | +33 per 1000 residents |
| State: | +27 per 1000 residents |
Total withdrawal of fresh water for public supply: 1.90 millions of gallons per day (all from surface)
| Here: | 6.0 |
| State: | 6.4 |
| Here: | 4.6 |
| State: | 4.5 |
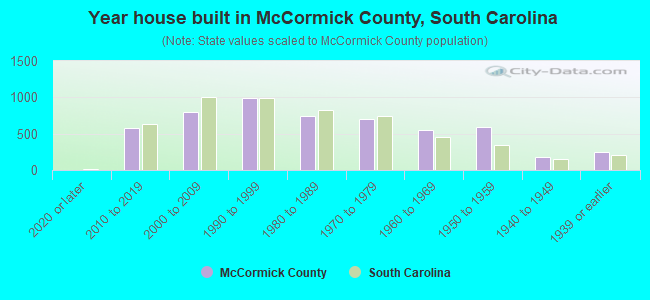
- Year house built in McCormick County, South Carolina
- 272020 or later
- 5212010 to 2019
- 7382000 to 2009
- 9711990 to 1999
- 7301980 to 1989
- 7881970 to 1979
- 5631960 to 1969
- 6641950 to 1959
- 1861940 to 1949
- 2201939 or earlier
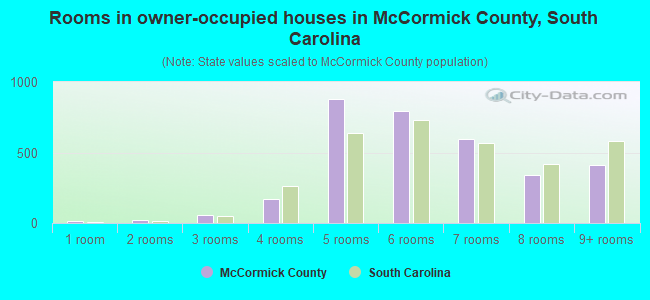
- Rooms in owner-occupied houses in McCormick County, South Carolina
- 71 room
- 222 rooms
- 603 rooms
- 2284 rooms
- 1,0635 rooms
- 8006 rooms
- 5467 rooms
- 4138 rooms
- 3989+ rooms

- Rooms in renter-occupied apartments in McCormick County, South Carolina
- 81 room
- 42 rooms
- 723 rooms
- 2154 rooms
- 2405 rooms
- 376 rooms
- 287 rooms
- 88 rooms
- 399+ rooms
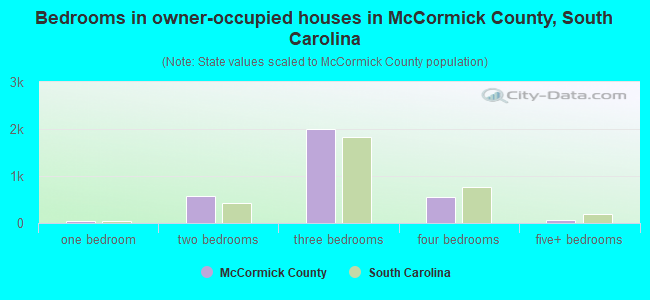
- Bedrooms in owner-occupied houses in McCormick County, South Carolina
- 6no bedroom
- 511 bedroom
- 7022 bedrooms
- 2,0733 bedrooms
- 6314 bedrooms
- 605+ bedrooms

- Bedrooms in renter-occupied apartments in McCormick County, South Carolina
- 8no bedroom
- 1341 bedroom
- 2412 bedrooms
- 2513 bedrooms
- 144 bedrooms
- 05+ bedrooms
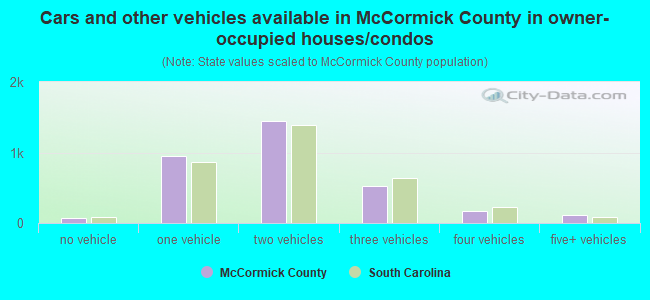
- Cars and other vehicles available in McCormick County in owner-occupied houses/condos
- 72no vehicle
- 1,0141 vehicle
- 1,5492 vehicles
- 6203 vehicles
- 1664 vehicles
- 1315+ vehicles
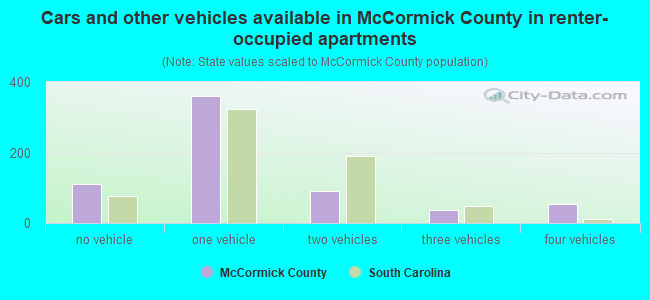
- Cars and other vehicles available in McCormick County in renter-occupied apartments
- 127no vehicle
- 3951 vehicle
- 592 vehicles
- 163 vehicles
- 444 vehicles
- 05+ vehicles
90.5% of McCormick County residents lived in the same house 1 years ago.
Out of people who lived in different houses, 9% lived in this county.
Out of people who lived in different counties, 71% lived in South Carolina.
| McCormick County: | 90.5% |
| State average: | 86.5% |
Place of birth for U.S.-born residents:
- This state: 5,465
- Other state: 4,197
- Northeast: 970
- Midwest: 890
- South: 2,050
- West: 280
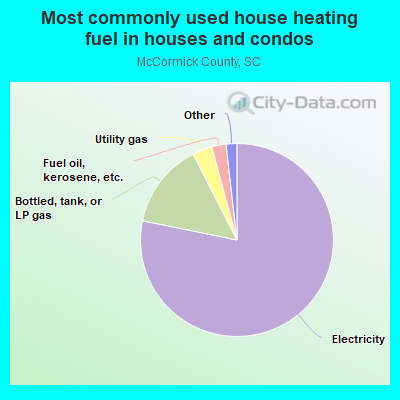
- 77.6%Electricity
- 12.8%Bottled, tank, or LP gas
- 4.2%Utility gas
- 3.1%Fuel oil, kerosene, etc.
- 0.9%Other fuel
- 0.6%Wood
- 0.5%Solar energy
- 0.3%No fuel used

- 80.4%Electricity
- 14.9%Utility gas
- 4.7%Bottled, tank, or LP gas
Private vs. public school enrollment:
| Here: | 12.3% |
| South Carolina: | 14.4% |
| Here: | 17.0% |
| South Carolina: | 11.1% |
| Here: | 42.9% |
| South Carolina: | 21.9% |

McCormick County government finances - Expenditure in 2018:
- Bond Funds - Cash and Securities: $3,133,000
- Charges - Hospital Public: $23,791,000
Other: $799,000
Regular Highways: $272,000
Sewerage: $44,000
- Construction - Regular Highways: $496,000
Correctional Institutions: $275,000
Hospitals: $269,000
General - Other: $149,000
Central Staff Services: $104,000
General Public Buildings: $103,000
Judicial and Legal Services: $89,000
Housing and Community Development: $89,000
Police Protection: $30,000
Sewerage: $1,000
Parks and Recreation: $1,000
- Current Operations - Hospitals: $22,951,000
Police Protection: $1,029,000
Central Staff Services: $856,000
General - Other: $758,000
Correctional Institutions: $581,000
Solid Waste Management: $502,000
Judicial and Legal Services: $486,000
Health - Other: $443,000
Financial Administration: $293,000
Regular Highways: $267,000
Local Fire Protection: $209,000
General Public Buildings: $203,000
Libraries: $167,000
Transit Utilities: $80,000
Parks and Recreation: $67,000
Water Utilities: $62,000
Sewerage: $50,000
Natural Resources - Other: $25,000
- Federal Intergovernmental - Other: $95,000
Housing and Community Development: $90,000
- General - Interest on Debt: $455,000
- Intergovernmental to Local - Other - Central Staff Services: $184,000
- Local Intergovernmental - Other: $123,000
Health and Hospitals: $4,000
- Long Term Debt - Beginning Outstanding - Unspecified Public Purpose: $17,262,000
Outstanding Unspecified Public Purpose: $11,689,000
Retired Unspecified Public Purpose: $5,573,000
Beginning Outstanding - Public Debt for Private Purpose: $329,000
Retired Nonguaranteed - Public Debt for Private Purpose: $205,000
Outstanding Nonguaranteed - Industrial Revenue: $124,000
- Miscellaneous - General Revenue - Other: $558,000
Interest Earnings: $152,000
Fines and Forfeits: $120,000
Sale of Property: $37,000
Rents: $16,000
- Other Capital Outlay - Hospitals: $989,000
General - Other: $689,000
Police Protection: $279,000
Local Fire Protection: $211,000
General Public Building: $42,000
Financial Administration: $31,000
Judicial and Legal Services: $23,000
Solid Waste Management: $15,000
Correctional Institutions: $13,000
Transit Utilities: $9,000
Central Staff Services: $4,000
Health - Other: $3,000
Sewerage: $1,000
- Other Funds - Cash and Securities: $12,100,000
- Revenue - Water Utilities: $20,000
- Short Term Debt Outstanding - Beginning: $764,000
- Sinking Funds - Cash and Securities: $367,000
- State Intergovernmental - General Local Government Support: $491,000
Other: $283,000
Highways: $154,000
Transit Utilities: $17,000
- Tax - Property: $3,669,000
Other Selective Sales: $1,015,000
Other License: $145,000
Other: $82,000
Public Utilities Sales: $75,000
Occupation and Business License - Other: $41,000
- Total Salaries and Wages: $13,240,000
McCormick County government finances - Revenue in 2018:
- Bond Funds - Cash and Securities: $3,133,000
- Charges - Hospital Public: $23,791,000
Other: $799,000
Regular Highways: $272,000
Sewerage: $44,000
- Construction - Regular Highways: $496,000
Correctional Institutions: $275,000
Hospitals: $269,000
General - Other: $149,000
Central Staff Services: $104,000
General Public Buildings: $103,000
Judicial and Legal Services: $89,000
Housing and Community Development: $89,000
Police Protection: $30,000
Sewerage: $1,000
Parks and Recreation: $1,000
- Current Operations - Hospitals: $22,951,000
Police Protection: $1,029,000
Central Staff Services: $856,000
General - Other: $758,000
Correctional Institutions: $581,000
Solid Waste Management: $502,000
Judicial and Legal Services: $486,000
Health - Other: $443,000
Financial Administration: $293,000
Regular Highways: $267,000
Local Fire Protection: $209,000
General Public Buildings: $203,000
Libraries: $167,000
Transit Utilities: $80,000
Parks and Recreation: $67,000
Water Utilities: $62,000
Sewerage: $50,000
Natural Resources - Other: $25,000
- Federal Intergovernmental - Other: $95,000
Housing and Community Development: $90,000
- General - Interest on Debt: $455,000
- Intergovernmental to Local - Other - Central Staff Services: $184,000
- Local Intergovernmental - Other: $123,000
Health and Hospitals: $4,000
- Long Term Debt - Beginning Outstanding - Unspecified Public Purpose: $17,262,000
Outstanding Unspecified Public Purpose: $11,689,000
Retired Unspecified Public Purpose: $5,573,000
Beginning Outstanding - Public Debt for Private Purpose: $329,000
Retired Nonguaranteed - Public Debt for Private Purpose: $205,000
Outstanding Nonguaranteed - Industrial Revenue: $124,000
- Miscellaneous - General Revenue - Other: $558,000
Interest Earnings: $152,000
Fines and Forfeits: $120,000
Sale of Property: $37,000
Rents: $16,000
- Other Capital Outlay - Hospitals: $989,000
General - Other: $689,000
Police Protection: $279,000
Local Fire Protection: $211,000
General Public Building: $42,000
Financial Administration: $31,000
Judicial and Legal Services: $23,000
Solid Waste Management: $15,000
Correctional Institutions: $13,000
Transit Utilities: $9,000
Central Staff Services: $4,000
Health - Other: $3,000
Sewerage: $1,000
- Other Funds - Cash and Securities: $12,100,000
- Revenue - Water Utilities: $20,000
- Short Term Debt Outstanding - Beginning: $764,000
- Sinking Funds - Cash and Securities: $367,000
- State Intergovernmental - General Local Government Support: $491,000
Other: $283,000
Highways: $154,000
Transit Utilities: $17,000
- Tax - Property: $3,669,000
Other Selective Sales: $1,015,000
Other License: $145,000
Other: $82,000
Public Utilities Sales: $75,000
Occupation and Business License - Other: $41,000
- Total Salaries and Wages: $13,240,000
McCormick County government finances - Debt in 2018:
- Bond Funds - Cash and Securities: $3,133,000
- Charges - Hospital Public: $23,791,000
Other: $799,000
Regular Highways: $272,000
Sewerage: $44,000
- Construction - Regular Highways: $496,000
Correctional Institutions: $275,000
Hospitals: $269,000
General - Other: $149,000
Central Staff Services: $104,000
General Public Buildings: $103,000
Judicial and Legal Services: $89,000
Housing and Community Development: $89,000
Police Protection: $30,000
Sewerage: $1,000
Parks and Recreation: $1,000
- Current Operations - Hospitals: $22,951,000
Police Protection: $1,029,000
Central Staff Services: $856,000
General - Other: $758,000
Correctional Institutions: $581,000
Solid Waste Management: $502,000
Judicial and Legal Services: $486,000
Health - Other: $443,000
Financial Administration: $293,000
Regular Highways: $267,000
Local Fire Protection: $209,000
General Public Buildings: $203,000
Libraries: $167,000
Transit Utilities: $80,000
Parks and Recreation: $67,000
Water Utilities: $62,000
Sewerage: $50,000
Natural Resources - Other: $25,000
- Federal Intergovernmental - Other: $95,000
Housing and Community Development: $90,000
- General - Interest on Debt: $455,000
- Intergovernmental to Local - Other - Central Staff Services: $184,000
- Local Intergovernmental - Other: $123,000
Health and Hospitals: $4,000
- Long Term Debt - Beginning Outstanding - Unspecified Public Purpose: $17,262,000
Outstanding Unspecified Public Purpose: $11,689,000
Retired Unspecified Public Purpose: $5,573,000
Beginning Outstanding - Public Debt for Private Purpose: $329,000
Retired Nonguaranteed - Public Debt for Private Purpose: $205,000
Outstanding Nonguaranteed - Industrial Revenue: $124,000
- Miscellaneous - General Revenue - Other: $558,000
Interest Earnings: $152,000
Fines and Forfeits: $120,000
Sale of Property: $37,000
Rents: $16,000
- Other Capital Outlay - Hospitals: $989,000
General - Other: $689,000
Police Protection: $279,000
Local Fire Protection: $211,000
General Public Building: $42,000
Financial Administration: $31,000
Judicial and Legal Services: $23,000
Solid Waste Management: $15,000
Correctional Institutions: $13,000
Transit Utilities: $9,000
Central Staff Services: $4,000
Health - Other: $3,000
Sewerage: $1,000
- Other Funds - Cash and Securities: $12,100,000
- Revenue - Water Utilities: $20,000
- Short Term Debt Outstanding - Beginning: $764,000
- Sinking Funds - Cash and Securities: $367,000
- State Intergovernmental - General Local Government Support: $491,000
Other: $283,000
Highways: $154,000
Transit Utilities: $17,000
- Tax - Property: $3,669,000
Other Selective Sales: $1,015,000
Other License: $145,000
Other: $82,000
Public Utilities Sales: $75,000
Occupation and Business License - Other: $41,000
- Total Salaries and Wages: $13,240,000
McCormick County government finances - Cash and Securities in 2018:
- Bond Funds - Cash and Securities: $3,133,000
- Charges - Hospital Public: $23,791,000
Other: $799,000
Regular Highways: $272,000
Sewerage: $44,000
- Construction - Regular Highways: $496,000
Correctional Institutions: $275,000
Hospitals: $269,000
General - Other: $149,000
Central Staff Services: $104,000
General Public Buildings: $103,000
Judicial and Legal Services: $89,000
Housing and Community Development: $89,000
Police Protection: $30,000
Sewerage: $1,000
Parks and Recreation: $1,000
- Current Operations - Hospitals: $22,951,000
Police Protection: $1,029,000
Central Staff Services: $856,000
General - Other: $758,000
Correctional Institutions: $581,000
Solid Waste Management: $502,000
Judicial and Legal Services: $486,000
Health - Other: $443,000
Financial Administration: $293,000
Regular Highways: $267,000
Local Fire Protection: $209,000
General Public Buildings: $203,000
Libraries: $167,000
Transit Utilities: $80,000
Parks and Recreation: $67,000
Water Utilities: $62,000
Sewerage: $50,000
Natural Resources - Other: $25,000
- Federal Intergovernmental - Other: $95,000
Housing and Community Development: $90,000
- General - Interest on Debt: $455,000
- Intergovernmental to Local - Other - Central Staff Services: $184,000
- Local Intergovernmental - Other: $123,000
Health and Hospitals: $4,000
- Long Term Debt - Beginning Outstanding - Unspecified Public Purpose: $17,262,000
Outstanding Unspecified Public Purpose: $11,689,000
Retired Unspecified Public Purpose: $5,573,000
Beginning Outstanding - Public Debt for Private Purpose: $329,000
Retired Nonguaranteed - Public Debt for Private Purpose: $205,000
Outstanding Nonguaranteed - Industrial Revenue: $124,000
- Miscellaneous - General Revenue - Other: $558,000
Interest Earnings: $152,000
Fines and Forfeits: $120,000
Sale of Property: $37,000
Rents: $16,000
- Other Capital Outlay - Hospitals: $989,000
General - Other: $689,000
Police Protection: $279,000
Local Fire Protection: $211,000
General Public Building: $42,000
Financial Administration: $31,000
Judicial and Legal Services: $23,000
Solid Waste Management: $15,000
Correctional Institutions: $13,000
Transit Utilities: $9,000
Central Staff Services: $4,000
Health - Other: $3,000
Sewerage: $1,000
- Other Funds - Cash and Securities: $12,100,000
- Revenue - Water Utilities: $20,000
- Short Term Debt Outstanding - Beginning: $764,000
- Sinking Funds - Cash and Securities: $367,000
- State Intergovernmental - General Local Government Support: $491,000
Other: $283,000
Highways: $154,000
Transit Utilities: $17,000
- Tax - Property: $3,669,000
Other Selective Sales: $1,015,000
Other License: $145,000
Other: $82,000
Public Utilities Sales: $75,000
Occupation and Business License - Other: $41,000
- Total Salaries and Wages: $13,240,000
Supplemental Security Income (SSI) in 2006:
- Total number of recipients: 294
- Number of aged recipients: 44
- Number of blind and disabled recipients: 250
- Number of recipients under 18: 30
- Number of recipients between 18 and 64: 172
- Number of recipients older than 64: 92
- Number of recipients also receiving OASDI: 126
- Amount of payments (thousands of dollars): 113
| Most common first names in McCormick County, SC among deceased individuals | ||
| Name | Count | Lived (average) |
|---|---|---|
| James | 122 | 68.7 years |
| John | 82 | 69.6 years |
| William | 74 | 70.6 years |
| Mary | 67 | 80.2 years |
| Robert | 55 | 72.7 years |
| Willie | 48 | 71.1 years |
| George | 42 | 74.2 years |
| Thomas | 41 | 70.2 years |
| Henry | 24 | 75.5 years |
| Paul | 22 | 71.0 years |
| Most common last names in McCormick County, SC among deceased individuals | ||
| Last name | Count | Lived (average) |
|---|---|---|
| Brown | 43 | 74.5 years |
| Talbert | 34 | 74.2 years |
| Freeman | 32 | 70.6 years |
| Williams | 31 | 69.5 years |
| White | 30 | 73.3 years |
| Jennings | 29 | 74.0 years |
| Wideman | 28 | 73.9 years |
| Searles | 26 | 77.3 years |
| Patterson | 25 | 75.1 years |
| Smith | 25 | 80.4 years |
| Businesses in McCormick County, SC | ||||
| Name | Count | Name | Count | |
|---|---|---|---|---|
| FedEx | 1 | Subway | 1 | |
| H&R Block | 1 | UPS | 1 | |
| Hardee's | 1 | |||