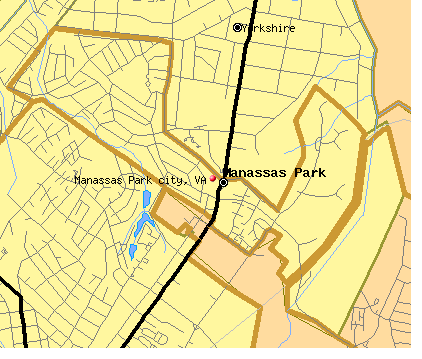
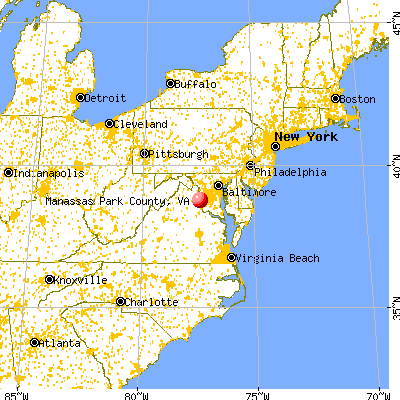
Manassas Park city, Virginia (VA)
County owner-occupied free and clear houses and condos in 2010: 277
County owner-occupied houses and condos in 2000: 2,561
Renter-occupied apartments: 1,558 (it was 693 in 2000)
| % of renters here: | 21% |
| State: | 33% |
Land area: 2 sq. mi.
Water area: 0.0 sq. mi.
Population density: 6918 people per square mile (very high).
Industries providing employment: Professional, scientific, management, administrative, and waste management services (20.2%), Construction (14.8%), Educational, health and social services (14.7%), Public administration (10.9%), Retail trade (10.9%).
Type of workers:
- Private wage or salary: 79%
- Government: 17%
- Self-employed, not incorporated: 4%
- Unpaid family work: 0%
- OSM Map
- General Map
- Google Map
- MSN Map

- 7,51242.7%Hispanic or Latino
- 5,07128.8%White Non-Hispanic Alone
- 2,11112.0%Black Non-Hispanic Alone
- 1,94211.0%Asian alone
- 9215.2%Two or more races
- 220.1%Some other race alone

| Median resident age: | 36.1 years |
| Virginia median age: | 39.0 years |
| Males: 8,746 | |
| Females: 8,494 |

 | Cookout expanding to NOVA (27 replies) |
| Is This An Accurate Map of Virginia's Regions? (53 replies) |
| Where is Northern Virginia? (25 replies) |
| Net Migration Between Loudoun and Fairfax Counties (95 replies) |
| 2012 SAT Scores Updated w/Loudoun Information (36 replies) |
| Manassas Park 20111 (22 replies) |
| Manassas Park city: | 3.0 people |
| Virginia: | 3 people |
Estimated median household income in 2022: $90,227 ($60,794 in 1999)
| This county: | $90,227 |
| Virginia: | $85,873 |
Median contract rent in 2022 for apartments: $1,835 (lower quartile is $1,587, upper quartile is $2,051)
| This county: | $1835 |
| State: | $1270 |
Estimated median house or condo value in 2022: $398,955 (it was $115,700 in 2000)
| Manassas Park city: | $398,955 |
| Virginia: | $365,700 |
Mean price in 2022:
Median monthly housing costs for homes and condos with a mortgage: $2,133Detached houses: $476,346
Here: $476,346 State: $472,865 Townhouses or other attached units: $345,986
Here: $345,986 State: $457,437 In 5-or-more-unit structures: $243,025
Here: $243,025 State: $382,551
Median monthly housing costs for units without a mortgage: $687
Institutionalized population: 0
Median real estate property taxes paid for housing units with mortgages in 2022: $4,665 (1.2%)
Median real estate property taxes paid for housing units with no mortgage in 2022: $2,990 (0.9%)


| Manassas Park city: | 5.3% |
| Virginia: | 10.6% |
Median age of residents in 2022: 36.1 years old
(Males: 37.4 years old, Females: 33.0 years old)
(Median age for: White residents: 39.8 years old, Black residents: 36.6 years old, American Indian residents: 21.0 years old, Asian residents: 46.8 years old, Hispanic or Latino residents: 30.1 years old, Other race residents: 31.5 years old)
Area name: Washington-Arlington-Alexandria, DC-VA-MD HUD Metro FMR Area
Fair market rent in 2006 for a 1-bedroom apartment in Manassas Park city is $1080 a month.
Fair market rent for a 2-bedroom apartment is $1225 a month.
Fair market rent for a 3-bedroom apartment is $1580 a month.
Neighboring counties: Mineral County, Nevada  , Crawford County, Indiana , Wayne County, West Virginia , Miller County, Missouri , Morgan County, Missouri , Wayne County, Illinois , Warren County, Missouri , Alexandria city
  .
.
| Here: | 2.4% |
| Virginia: | 2.7% |

Current college students: 477
People 25 years of age or older with a high school degree or higher: 80.1%
People 25 years of age or older with a bachelor's degree or higher: 25.0%
Number of foreign born residents: 6,346 (57.7% naturalized citizens)
| Manassas Park city: | 36.8% |
| Whole state: | 12.7% |

- Year of entry for the foreign-born population
- 1,9422010 or later
- 1,6012000 to 2009
- 1,6311990 to 1999
- 3651980 to 1989
- 1391970 to 1979
- 84Before 1970
Mean travel time to work (commute): ( minutes
Percentage of county residents living and working in this county: 90.8%

Housing units in structures:
- One, detached: 2,402
- One, attached: 1,608
- Two: 268
- 3 or 4: 78
- 5 to 9: 32
- 10 to 19: 362
- 20 to 49: 307
- 50 or more: 553
Housing units in Manassas Park city with a mortgage: 2,793 (223 second mortgage, 0 home equity loan, 143 both second mortgage and home equity loan)
Houses without a mortgage: 17
| Here: | 10.5% with mortgage |
| State: | 97.2% with mortgage |
Food Environment Statistics:
| This county: | 2.63 / 10,000 pop. |
| Virginia: | 1.43 / 10,000 pop. |
| Manassas Park city: | 4.38 / 10,000 pop. |
| Virginia: | 4.03 / 10,000 pop. |
| This county: | 5.25 / 10,000 pop. |
| State: | 7.65 / 10,000 pop. |
| Manassas Park city: | 8.1% |
| Virginia: | 9.3% |
| Manassas Park city: | 27.8% |
| State: | 26.7% |
Earthquake activity:
Manassas Park city-area historical earthquake activity is significantly above Virginia state average. It is 54% smaller than the overall U.S. average.On 8/23/2011 at 17:51:04, a magnitude 5.8 (5.8 MW, Depth: 3.7 mi, Class: Moderate, Intensity: VI - VII) earthquake occurred 65.2 miles away from Manassas Park city center
On 8/25/2011 at 05:07:52, a magnitude 4.5 (4.5 ML, Depth: 4.2 mi, Class: Light, Intensity: IV - V) earthquake occurred 63.6 miles away from the county center
On 12/9/2003 at 20:59:18, a magnitude 4.5 (4.5 ML, Depth: 6.2 mi) earthquake occurred 77.5 miles away from the county center
On 12/9/2003 at 20:59:14, a magnitude 4.5 (4.5 MB, 4.5 LG) earthquake occurred 85.6 miles away from the county center
On 9/25/1998 at 19:52:52, a magnitude 5.2 (4.8 MB, 4.3 MS, 5.2 LG, 4.5 MW, Depth: 3.1 mi) earthquake occurred 244.0 miles away from Manassas Park city center
On 1/16/1994 at 01:49:16, a magnitude 4.6 (4.6 MB, 4.6 LG, Depth: 3.1 mi) earthquake occurred 131.5 miles away from the county center
Magnitude types: regional Lg-wave magnitude (LG), body-wave magnitude (MB), local magnitude (ML), surface-wave magnitude (MS), moment magnitude (MW)

Means of transportation to work:
- Drove a car alone: 3,004 (69.3%)
- Carpooled: 267 (6.2%)
- Taxicab, motorcycle, or other means: 27 (0.6%)
- Bicycle: 7 (0.2%)
- Walked: 83 (1.9%)
- Worked at home: 1,022 (23.6%)


- Health care and social assistance (14%)
- Public administration (9%)
- Accommodation and food services (8%)
- Professional, scientific, and technical services (8%)
- Retail trade (8%)
- Other services, except public administration (6%)
- Educational services (6%)

- Health care and social assistance (18%)
- Public administration (12%)
- Accommodation and food services (10%)
- Professional, scientific, and technical services (10%)
- Retail trade (10%)
- Other services, except public administration (7%)
- Educational services (7%)

- Construction and extraction occupations (17%)
- Management occupations (12%)
- Computer and mathematical occupations (10%)
- Sales and related occupations (9%)
- Installation, maintenance, and repair occupations (6%)
- Business and financial operations occupations (5%)
- Transportation occupations (5%)

- Office and administrative support occupations (19%)
- Sales and related occupations (16%)
- Computer and mathematical occupations (9%)
- Building and grounds cleaning and maintenance occupations (8%)
- Healthcare support occupations (7%)
- Educational instruction, and library occupations (7%)
- Business and financial operations occupations (7%)

- El Salvador (18%)
- Guatemala (14%)
- Vietnam (8%)
- Mexico (7%)
- Honduras (7%)
- Iraq (6%)
- Cameroon (5%)

- American (4%)
- English (4%)
- African (2%)
- European (1%)
- Portuguese (1%)
- Afghan (1%)
- Italian (1%)


2 people in other noninstitutional group quarters
14.70% of this county's 2021 resident taxpayers lived in other counties in 2020 ($50,883 average adjusted gross income)
| Here: | 14.70% |
| Virginia average: | 10.16% |
10 or fewer of this county's residents moved from foreign countries.
12.20% relocated from other counties in Virginia ($42,060 average AGI)
2.49% relocated from other states ($8,823 average AGI)
Manassas Park city: 2.49% Virginia average: 3.91%

Top counties from which taxpayers relocated into this county between 2020 and 2021:
| from Prince William County, VA | |
| from Fairfax County, VA | |
| from Manassas city, VA | |
| from Loudoun County, VA |
15.53% of this county's 2020 resident taxpayers moved to other counties in 2021 ($61,118 average adjusted gross income)
| Here: | 15.53% |
| Virginia average: | 10.20% |
10 or fewer of this county's residents moved to foreign countries.
12.12% relocated to other counties in Virginia ($47,479 average AGI)
3.41% relocated to other states ($13,639 average AGI)
Manassas Park city: 3.41% Virginia average: 3.98%

Top counties to which taxpayers relocated from this county between 2020 and 2021:
| to Prince William County, VA | |
| to Fairfax County, VA | |
| to Manassas city, VA | |
| to Fauquier County, VA | |
| to Loudoun County, VA | |
| to Stafford County, VA | |
| to Spotsylvania County, VA |
Births per 1000 population from 1990 to 1999: 20.0
Births per 1000 population from 2000 to 2006: 22.7

Deaths per 1000 population from 1990 to 1999: 3.8
Deaths per 1000 population from 2000 to 2009: 3.2
Deaths per 1000 population from 2010 to 2020: 2.5

Infant deaths per 1000 live births from 1990 to 1999: 6.3
Infant deaths per 1000 live births from 2000 to 2006: 1.0

Persons under 19 years old without health insurance coverage in 2018: 6.9%


Persons enrolled in hospital insurance and/or supplemental medical insurance (Medicare) in July 1, 2007: 706 (596 aged, 110 disabled)
Children under 18 without health insurance coverage in 2007: 511 (14%)


Population without health insurance coverage in 2000: 14%
Children under 18 without health insurance coverage in 2000: 13%
Medical specialist MDs per 100,000 population in 2005: 310
Total births per 100,000 population, July 2005 - July 2006 : 23
Total deaths per 100,000 population, July 2005 - July 2006: 43
Beer, wine & liquor stores per 100,000 population in 2005: 1
Household type by relationship:
Households: 17,240- Male householders: 3,126 (854 living alone), Female householders: 2,231 (653 living alone)
2,485 spouses (2,469 opposite-sex spouses), 424 unmarried partners, (424 opposite-sex unmarried partners), 5,537 children (5,347 natural, 17 adopted, 185 stepchildren), 689 grandchildren, 352 brothers or sisters, 955 parents, 25 foster children, 490 other relatives, 805 non-relatives
Size of family households: 1,192 2-persons, 689 3-persons, 544 4-persons, 677 5-persons, 268 6-persons, 329 7-or-more-persons.
Size of nonfamily households: 1,506 1-person, 95 2-persons, 71 3-persons.
2,305 married couples with children.
948 single-parent households (119 men, 829 women).
47.7% of residents of Manassas Park city speak English at home.
35.3% of residents speak Spanish at home (56% speak English very well, 24% speak English well, 13% speak English not well, 7% don't speak English at all).
10.3% of residents speak other Indo-European language at home (54% speak English very well, 30% speak English well, 14% speak English not well, 2% don't speak English at all).
5.4% of residents speak Asian or Pacific Island language at home (52% speak English very well, 21% speak English well, 27% speak English not well).
1.3% of residents speak other language at home (66% speak English very well, 34% speak English well).
In fiscal year 2004:
Federal Government expenditure: $21,166,000 ($1,837 per capita)
Department of Defense expenditure: $5,657,000
Federal direct payments to individuals for retirement and disability: $3,460,000
Federal other direct payments to individuals: $521,000
Federal direct payments not to individuals: $0,000
Federal grants: $10,354,000
Federal procurement contracts: $2,168,000 ($2,076,000 Department of Defense)
Federal salaries and wages: $4,663,000 ($3,572,000 Department of Defense)
Federal Government direct loans: $0,000
Federal guaranteed/insured loans: $34,642,000
Federal Government insurance: $1,392,000
Population change from April 1, 2000 to July 1, 2005:
Births: 1,147| Here: | 99 per 1000 residents |
| State: | 70 per 1000 residents |
Deaths: 169
| Here: | 15 per 1000 residents |
| State: | 40 per 1000 residents |
Net international migration: +388
| Here: | +33 per 1000 residents |
| State: | +18 per 1000 residents |
Net internal migration: -20
| Here: | |
| State: |

Total withdrawal of fresh water for public supply: 0.45 millions of gallons per day (all from ground)
| Here: | 6.2 |
| State: | 7.0 |
| Here: | 3.9 |
| State: | 4.3 |

- Year house built in Manassas Park city, Virginia
- 02020 or later
- 6042010 to 2019
- 2,0472000 to 2009
- 1,0221990 to 1999
- 4471980 to 1989
- 2521970 to 1979
- 3761960 to 1969
- 7841950 to 1959
- 471940 to 1949
- 351939 or earlier

- Rooms in owner-occupied houses in Manassas Park city, Virginia
- 01 room
- 112 rooms
- 373 rooms
- 1714 rooms
- 9265 rooms
- 8276 rooms
- 4437 rooms
- 2778 rooms
- 7169+ rooms
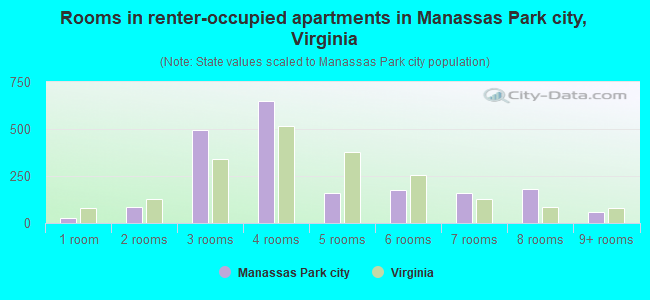
- Rooms in renter-occupied apartments in Manassas Park city, Virginia
- 361 room
- 542 rooms
- 5363 rooms
- 6804 rooms
- 955 rooms
- 1896 rooms
- 1407 rooms
- 1188 rooms
- 869+ rooms

- Bedrooms in owner-occupied houses in Manassas Park city, Virginia
- 0no bedroom
- 111 bedroom
- 4612 bedrooms
- 1,7223 bedrooms
- 6504 bedrooms
- 5955+ bedrooms

- Bedrooms in renter-occupied apartments in Manassas Park city, Virginia
- 36no bedroom
- 5121 bedroom
- 5892 bedrooms
- 5593 bedrooms
- 2324 bedrooms
- 05+ bedrooms

- Cars and other vehicles available in Manassas Park city in owner-occupied houses/condos
- 112no vehicle
- 7881 vehicle
- 1,3772 vehicles
- 6673 vehicles
- 3454 vehicles
- 1395+ vehicles
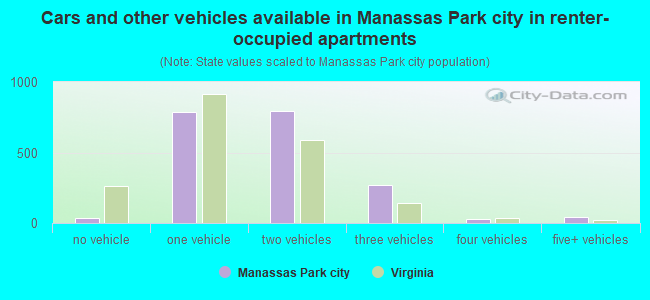
- Cars and other vehicles available in Manassas Park city in renter-occupied apartments
- 147no vehicle
- 7671 vehicle
- 7032 vehicles
- 2273 vehicles
- 474 vehicles
- 235+ vehicles
88.7% of Manassas Park city residents lived in the same house 1 years ago.
Out of people who lived in different houses, 4% lived in this county.
Out of people who lived in different counties, 77% lived in Virginia.
| Manassas Park city: | 88.7% |
| State average: | 86.6% |
Place of birth for U.S.-born residents:
- This state: 6,308
- Other state: 4,047
- Northeast: 861
- Midwest: 628
- South: 1,732
- West: 841


- 77.2%Utility gas
- 19.7%Electricity
- 1.3%Bottled, tank, or LP gas
- 0.8%Fuel oil, kerosene, etc.
- 0.7%No fuel used
- 0.3%Other fuel

- 59.0%Utility gas
- 39.8%Electricity
- 0.6%Bottled, tank, or LP gas
- 0.6%Wood
Private vs. public school enrollment:
| Here: | 6.7% |
| Virginia: | 13.2% |
| Here: | 2.2% |
| Virginia: | 10.2% |
| Here: | 20.0% |
| Virginia: | 18.7% |


Supplemental Security Income (SSI) in 2004:
- Total number of recipients: 2
- Number of aged recipients: 0
- Number of blind and disabled recipients: 0
- Number of recipients under 18: 0
- Number of recipients between 18 and 64: 0
- Number of recipients older than 64: 0
- Number of recipients also receiving OASDI: 0
- Amount of payments (thousands of dollars): 1
| Most common first names in Manassas Park city, VA among deceased individuals | ||
| Name | Count | Lived (average) |
|---|---|---|
| James | 27 | 72.7 years |
| Mary | 22 | 80.8 years |
| William | 20 | 73.1 years |
| Robert | 19 | 65.1 years |
| John | 18 | 77.1 years |
| Charles | 17 | 72.7 years |
| Margaret | 13 | 77.6 years |
| Joseph | 13 | 69.1 years |
| Helen | 12 | 81.2 years |
| Dorothy | 11 | 78.8 years |
| Most common last names in Manassas Park city, VA among deceased individuals | ||
| Last name | Count | Lived (average) |
|---|---|---|
| Smith | 14 | 64.9 years |
| Johnson | 11 | 68.7 years |
| Harris | 6 | 63.7 years |
| Marshall | 5 | 76.1 years |
| Cooper | 5 | 77.4 years |
| Moore | 5 | 77.0 years |
| Burke | 4 | 67.7 years |
| Jordan | 4 | 76.5 years |
| Carter | 4 | 74.0 years |
| Blevins | 4 | 66.2 years |
Manassas Park city on our top lists:
- #1 on the list of "Top 101 counties with the largest number of people without health insurance coverage in 2000"
- #4 on the list of "Top 101 counties with the largest number of children under 18 without health insurance coverage in 2000"
- #6 on the list of "Top 101 counties with the highest percentage of residents relocating from other counties between 2010 and 2011"
- #22 on the list of "Top 101 counties with the lowest number of deaths per 1000 residents 2007-2013"
- #25 on the list of "Top 101 counties with the highest percentage of residents relocating to other counties in 2011"