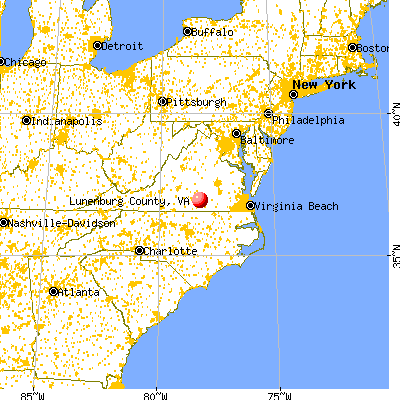
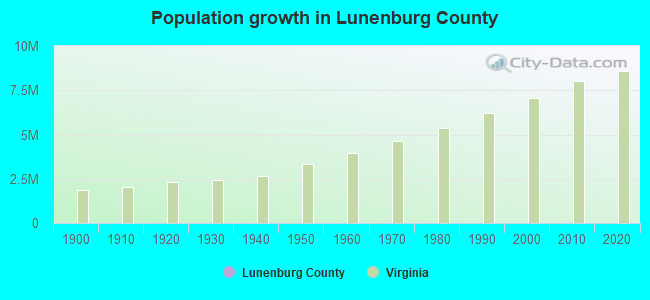
Lunenburg County, Virginia (VA)
County owner-occupied free and clear houses and condos in 2010: 1,714
County owner-occupied houses and condos in 2000: 3,887
Renter-occupied apartments: 1,295 (it was 1,111 in 2000)
| % of renters here: | 22% |
| State: | 33% |
Land area: 432 sq. mi.
Water area: 0.7 sq. mi.
Population density: 28 people per square mile (low).
Industries providing employment: Educational, health and social services (16.7%), Construction (15.3%), Retail trade (12.8%), Public administration (12.6%), Manufacturing (11.0%), Transportation and warehousing,and utilities (10.4%).
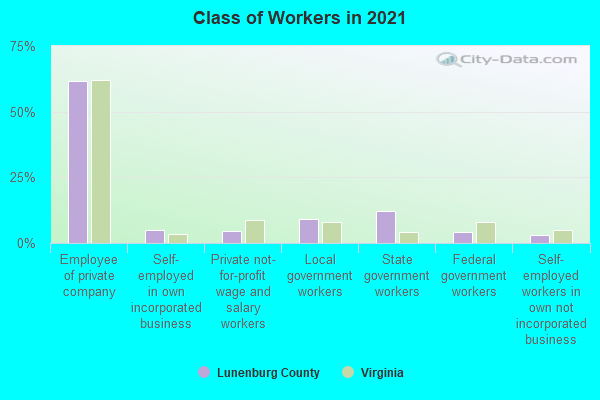
Type of workers:
- Private wage or salary: 71%
- Government: 26%
- Self-employed, not incorporated: 3%
- Unpaid family work: 0%
- OSM Map
- General Map
- Google Map
- MSN Map


- 6,89857.7%White Non-Hispanic Alone
- 3,90532.7%Black Non-Hispanic Alone
- 7646.4%Hispanic or Latino
- 3462.9%Two or more races
- 410.3%Asian alone
- 20.02%American Indian and Alaska Native alone

| Median resident age: | 44.3 years |
| Virginia median age: | 39.0 years |
| Males: 6,329 | |
| Females: 5,741 |

 | Worst county in Virginia *drum roll* (51 replies) |
| finding county tax maps (1 reply) |
| Lunenburg County: | 2.0 people |
| Virginia: | 3 people |
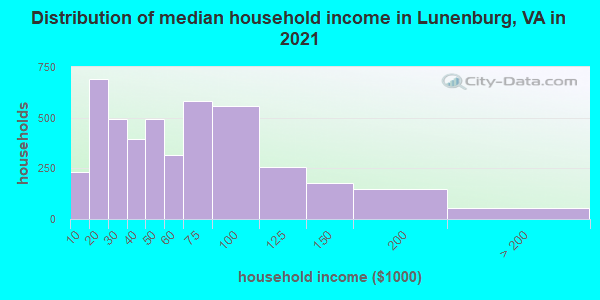
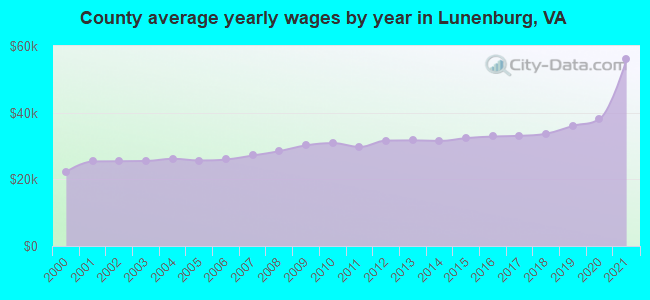
Estimated median household income in 2022: $53,579 ($27,899 in 1999)
| This county: | $53,579 |
| Virginia: | $85,873 |
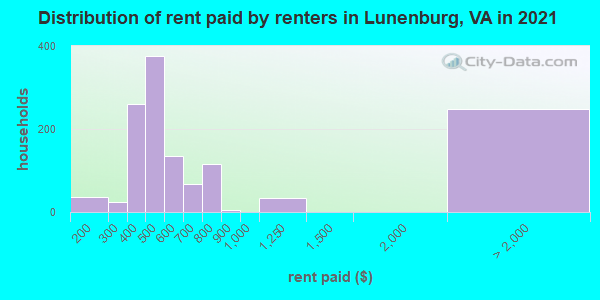
Median contract rent in 2022 for apartments: $463 (lower quartile is $373, upper quartile is $610)
| This county: | $463 |
| State: | $1270 |
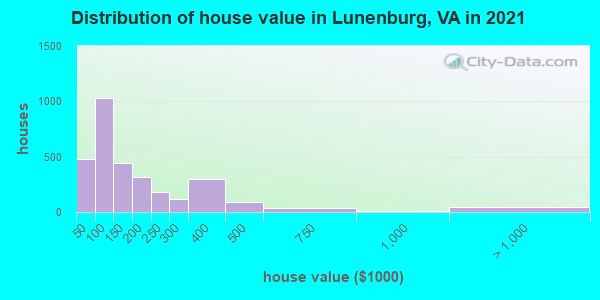
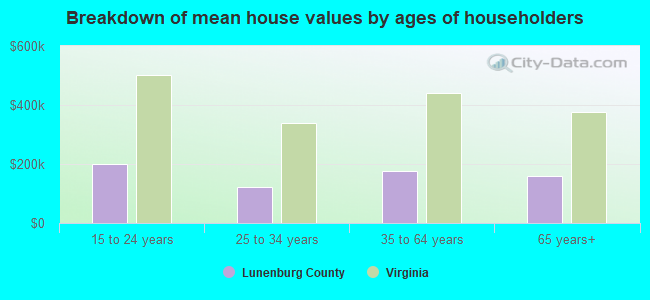
Estimated median house or condo value in 2022: $150,348 (it was $62,500 in 2000)
| Lunenburg: | $150,348 |
| Virginia: | $365,700 |
Mean price in 2022:
Median monthly housing costs for homes and condos with a mortgage: $1,180Detached houses: $211,924
Here: $211,924 State: $472,865 Townhouses or other attached units: $208,129
Here: $208,129 State: $457,437 Mobile homes: $109,035
Here: $109,035 State: $100,736
Median monthly housing costs for units without a mortgage: $370
Institutionalized population: 1,194
Crime in 2021 (reported by the sheriff's office or county police, not the county total):
- Murders: 0
- Rapes: 3
- Robberies: 1
- Assaults: 21
- Burglaries: 10
- Thefts: 21
- Auto thefts: 6
Crime in 2020 (reported by the sheriff's office or county police, not the county total):
- Murders: 0
- Rapes: 2
- Robberies: 0
- Assaults: 11
- Burglaries: 17
- Thefts: 16
- Auto thefts: 0
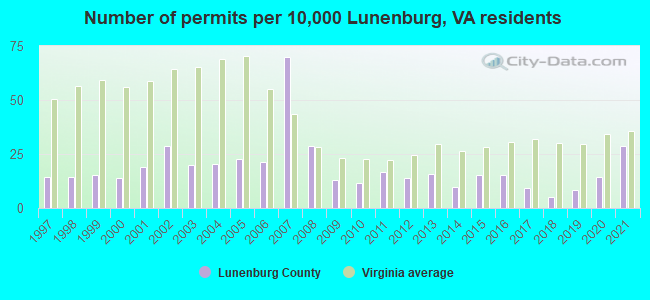
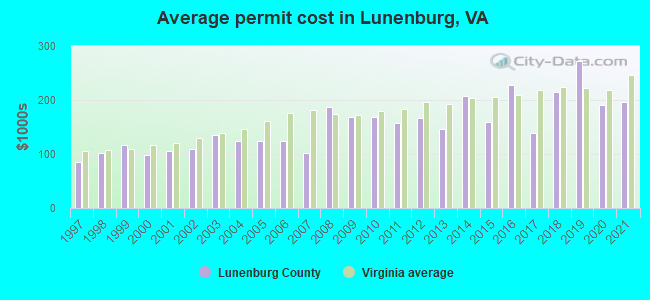
Single-family new house construction building permits:
- 2022: 23 buildings, average cost: $245,600
- 2021: 38 buildings, average cost: $197,200
- 2020: 19 buildings, average cost: $190,800
- 2019: 11 buildings, average cost: $272,700
- 2018: 7 buildings, average cost: $213,900
- 2017: 12 buildings, average cost: $139,100
- 2016: 20 buildings, average cost: $226,500
- 2015: 20 buildings, average cost: $159,900
- 2014: 13 buildings, average cost: $207,500
- 2013: 21 buildings, average cost: $146,200
- 2012: 18 buildings, average cost: $166,200
- 2011: 22 buildings, average cost: $158,300
- 2010: 15 buildings, average cost: $168,900
- 2009: 17 buildings, average cost: $168,900
- 2008: 38 buildings, average cost: $187,000
- 2007: 92 buildings, average cost: $100,800
- 2006: 28 buildings, average cost: $125,300
- 2005: 30 buildings, average cost: $125,300
- 2004: 27 buildings, average cost: $125,300
- 2003: 26 buildings, average cost: $136,200
- 2002: 38 buildings, average cost: $109,000
- 2001: 25 buildings, average cost: $105,200
- 2000: 18 buildings, average cost: $98,000
- 1999: 20 buildings, average cost: $116,200
- 1998: 19 buildings, average cost: $101,200
- 1997: 19 buildings, average cost: $84,900
Median real estate property taxes paid for housing units with mortgages in 2022: $682 (0.4%)
Median real estate property taxes paid for housing units with no mortgage in 2022: $569 (0.4%)
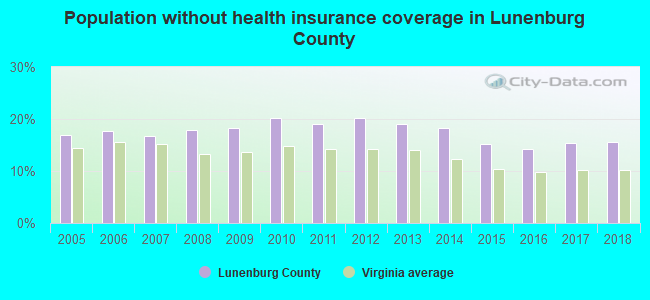
| Lunenburg County: | 13.8% |
| Virginia: | 10.6% |
Median age of residents in 2022: 44.3 years old
(Males: 43.3 years old, Females: 48.8 years old)
(Median age for: White residents: 48.6 years old, Black residents: 45.0 years old, Asian residents: 3.0 years old, Hispanic or Latino residents: 30.1 years old, Other race residents: 28.6 years old)
Fair market rent in 2006 for a 1-bedroom apartment in Lunenburg County is $428 a month.
Fair market rent for a 2-bedroom apartment is $499 a month.
Fair market rent for a 3-bedroom apartment is $622 a month.
Cities in this county include: Victoria, Kenbridge, Lunenburg.
Neighboring counties: Comanche County, Kansas  , Lyon County, Kentucky , McCracken County, Kentucky .
| Here: | 3.3% |
| Virginia: | 2.7% |
Current college students: 281
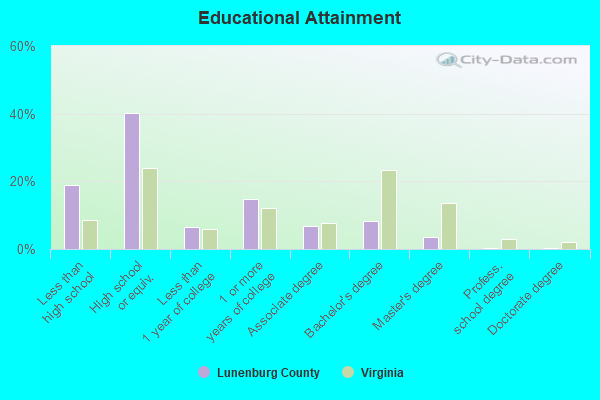
People 25 years of age or older with a high school degree or higher: 78.7%
People 25 years of age or older with a bachelor's degree or higher: 11.1%
Number of foreign born residents: 568 (19.4% naturalized citizens)
| Lunenburg County: | 4.7% |
| Whole state: | 12.7% |
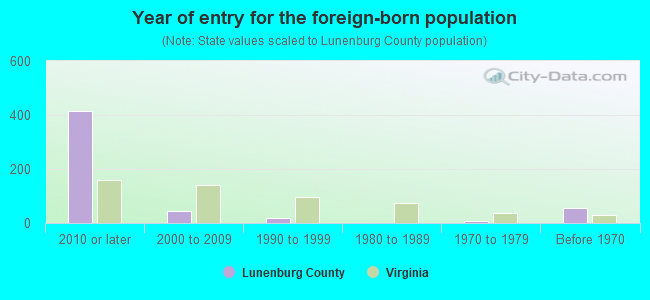
- Year of entry for the foreign-born population
- 3872010 or later
- 1352000 to 2009
- 131990 to 1999
- 01980 to 1989
- 61970 to 1979
- 55Before 1970
Mean travel time to work (commute): minutes
Percentage of county residents living and working in this county: 100.8%
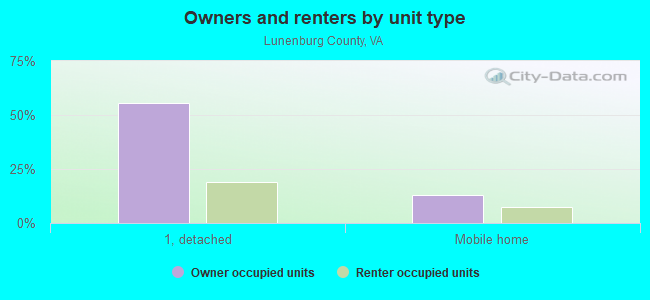
Housing units in structures:
- One, detached: 4,494
- One, attached: 60
- Two: 15
- 3 or 4: 76
- 5 to 9: 13
- 10 to 19: 9
- 20 or more: 30
- Mobile homes: 1,233
Housing units in Lunenburg County with a mortgage: 1,445 (233 second mortgage, 0 home equity loan, 151 both second mortgage and home equity loan)
Houses without a mortgage: 22
| Here: | 4.3% with mortgage |
| State: | 97.2% with mortgage |
Religion statistics for Lunenburg County
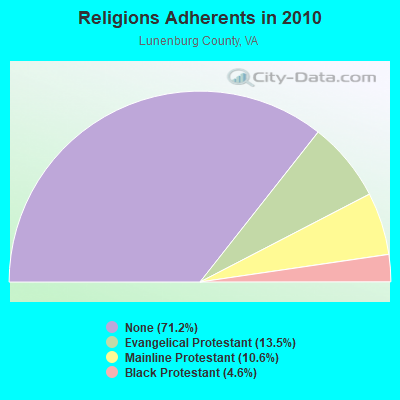
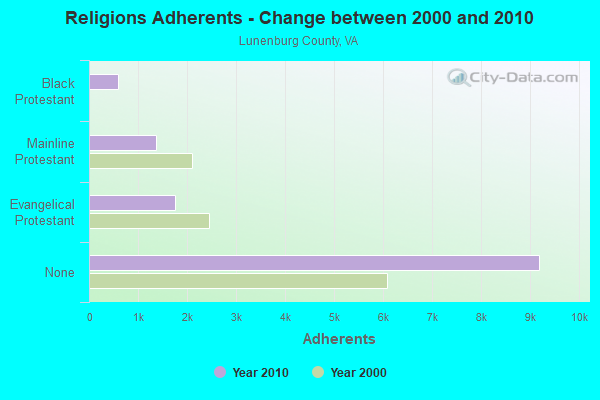
| Religion | Adherents | Congregations |
|---|---|---|
| Evangelical Protestant | 1,746 | 11 |
| Mainline Protestant | 1,372 | 12 |
| Black Protestant | 594 | 5 |
| Other | 4 | - |
| Catholic | - | - |
| None | 9,198 | - |
Source: Clifford Grammich, Kirk Hadaway, Richard Houseal, Dale E.Jones, Alexei Krindatch, Richie Stanley and Richard H.Taylor. 2012. 2010 U.S.Religion Census: Religious Congregations & Membership Study. Association of Statisticians of American Religious Bodies. Jones, Dale E., et al. 2002. Congregations and Membership in the United States 2000. Nashville, TN: Glenmary Research Center.
Food Environment Statistics:
| Lunenburg County: | 3.86 / 10,000 pop. |
| State: | 2.03 / 10,000 pop. |
| Lunenburg County: | 4.63 / 10,000 pop. |
| Virginia: | 4.03 / 10,000 pop. |
| This county: | 3.08 / 10,000 pop. |
| State: | 7.65 / 10,000 pop. |
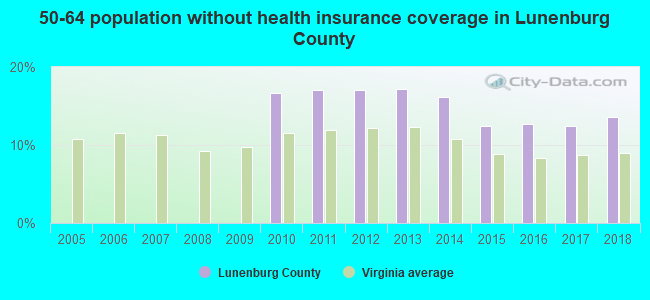
| Lunenburg County: | 12.1% |
| Virginia: | 9.3% |
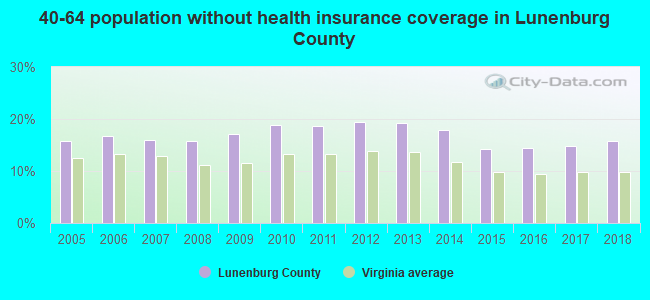
| Lunenburg County: | 30.4% |
| State: | 26.7% |
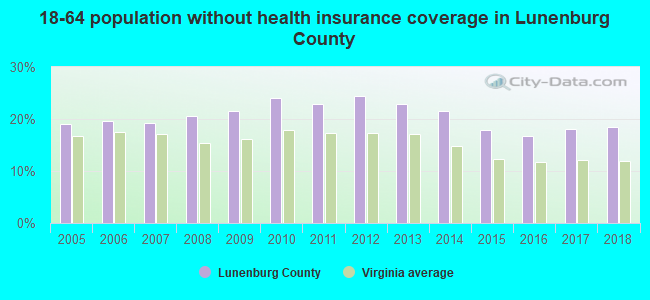
| Here: | 21.4% |
| State: | 18.6% |
Agriculture in Lunenburg County:
Average size of farms: 244 acresAverage value of agricultural products sold per farm: $37,132
Average value of crops sold per acre for harvested cropland: $393.39
The value of livestock, poultry, and their products as a percentage of the total market value of agricultural products sold: 43.21%
Average total farm production expenses per farm: $32,960
Harvested cropland as a percentage of land in farms: 21.96%
Average market value of all machinery and equipment per farm: $39,150
The percentage of farms operated by a family or individual: 94.13%
Average age of principal farm operators: 58 years
Average number of cattle and calves per 100 acres of all land in farms: 15.25
Milk cows as a percentage of all cattle and calves: 0.07%
Corn for grain: 414 harvested acres
All wheat for grain: 602 harvested acres
Soybeans for beans: 2206 harvested acres
Vegetables: 25 harvested acres
Land in orchards: 26 acres
Tornado activity:
Lunenburg County historical area-adjusted tornado activity is significantly below Virginia state average. It is 8564287.7 times below overall U.S. average.Tornadoes in this county have caused 25 injuries recorded between 1950 and 2004.
On 8/6/1993, a category 1 (max. wind speeds 73-112 mph) tornado injured 10 people and caused between $500,000 and $5,000,000 in damages.
Earthquake activity:
Lunenburg County-area historical earthquake activity is significantly above Virginia state average. It is 49% smaller than the overall U.S. average.On 8/23/2011 at 17:51:04, a magnitude 5.8 (5.8 MW, Depth: 3.7 mi, Class: Moderate, Intensity: VI - VII) earthquake occurred 68.5 miles away from Lunenburg County center
On 8/9/2020 at 12:07:37, a magnitude 5.1 (5.1 MW, Depth: 4.7 mi) earthquake occurred 162.5 miles away from the county center
On 12/9/2003 at 20:59:14, a magnitude 4.5 (4.5 MB, 4.5 LG, Class: Light, Intensity: IV - V) earthquake occurred 47.7 miles away from the county center
On 12/9/2003 at 20:59:18, a magnitude 4.5 (4.5 ML, Depth: 6.2 mi) earthquake occurred 57.7 miles away from the county center
On 8/25/2011 at 05:07:52, a magnitude 4.5 (4.5 ML, Depth: 4.2 mi) earthquake occurred 70.6 miles away from Lunenburg County center
On 8/24/2011 at 00:04:36, a magnitude 4.2 (4.2 ML) earthquake occurred 68.6 miles away from the county center
Magnitude types: regional Lg-wave magnitude (LG), body-wave magnitude (MB), local magnitude (ML), moment magnitude (MW)
Most recent natural disasters:
- Virginia Covid-19 Pandemic, Incident Period: January 20, 2020, Major Disaster (Presidential) Declared DR-4512-VA: April 2, 2020, FEMA Id: 4512, Natural disaster type: Other
- Virginia Tropical Storm Michael, Incident Period: October 9, 2018 - October 16, 2018, FEMA Id: 4411, Natural disaster type: Tropical Storm
- Virginia Hurricane Florence, Incident Period: September 8, 2018 - September 21, 2018, FEMA Id: 4401, Natural disaster type: Hurricane
- Virginia Hurricane Sandy, Incident Period: October 26, 2012 to November 01, 2012, Emergency Declared EM-3359: October 29, 2012, FEMA Id: 3359, Natural disaster type: Hurricane
- Virginia Severe Storms and Straight-line Winds, Incident Period: June 29, 2012 to July 01, 2012, Major Disaster (Presidential) Declared DR-4072: July 27, 2012, FEMA Id: 4072, Natural disaster type: Storm, Wind
- Virginia Hurricane Irene, Incident Period: August 26, 2011 to August 28, 2011, Major Disaster (Presidential) Declared DR-4024: September 03, 2011, FEMA Id: 4024, Natural disaster type: Hurricane
- Virginia Severe Storms and Flooding, Including Severe Storms and Flooding Associated with Tropical Depression Ernesto, Incident Period: August 29, 2006 to September 07, 2006, Major Disaster (Presidential) Declared DR-1661: September 22, 2006, FEMA Id: 1661, Natural disaster type: Storm, Flood, Tropical Depression
- Virginia Hurricane Katrina Evacuation, Incident Period: August 29, 2005 to October 01, 2005, Emergency Declared EM-3240: September 12, 2005, FEMA Id: 3240, Natural disaster type: Hurricane
- Virginia Hurricane Isabel, Incident Period: September 18, 2003 to October 01, 2003, Major Disaster (Presidential) Declared DR-1491: September 18, 2003, FEMA Id: 1491, Natural disaster type: Hurricane
- Virginia Winter Storm, Incident Period: January 25, 2000 to January 30, 2000, Major Disaster (Presidential) Declared DR-1318: February 28, 2000, FEMA Id: 1318, Natural disaster type: Winter Storm
- 8 other natural disasters have been reported since 1953.
The number of natural disasters in Lunenburg County (18) is near the US average (15).
Major Disasters (Presidential) Declared: 11
Emergencies Declared: 5
Causes of natural disasters: Hurricanes: 7, Storms: 4, Floods: 3, Droughts: 2, Winter Storms: 2, Blizzard: 1, Ice Storm: 1, Tropical Depression: 1, Tropical Storm: 1, Wind: 1, Other: 1 (Note: some incidents may be assigned to more than one category).
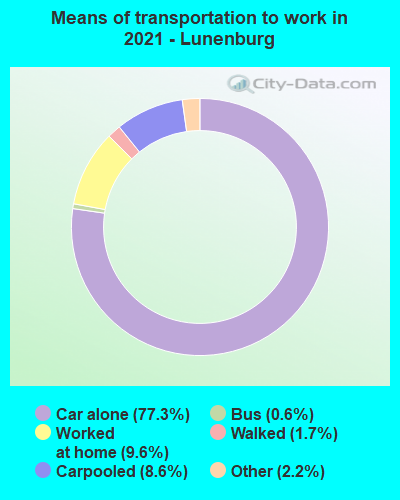
Means of transportation to work:
- Drove a car alone: 2,311 (76.4%)
- Carpooled: 191 (6.3%)
- Bus: 33 (1.1%)
- Taxicab, motorcycle, or other means: 61 (2.0%)
- Walked: 65 (2.1%)
- Worked at home: 304 (10.0%)
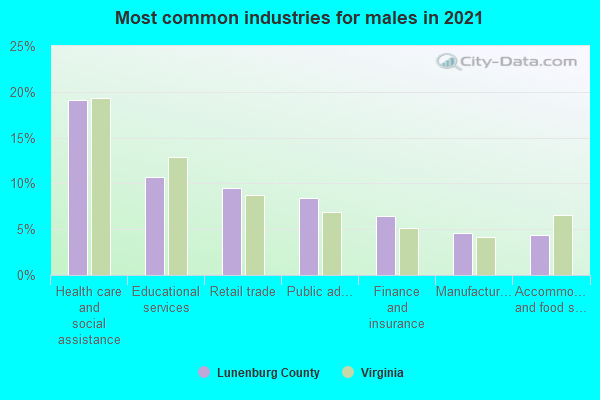
- Health care and social assistance (19%)
- Retail trade (11%)
- Public administration (10%)
- Educational services (8%)
- Manufacturing (8%)
- Transportation and warehousing (6%)
- Finance and insurance (5%)

- Health care and social assistance (24%)
- Retail trade (14%)
- Public administration (13%)
- Educational services (10%)
- Manufacturing (10%)
- Transportation and warehousing (7%)
- Finance and insurance (6%)
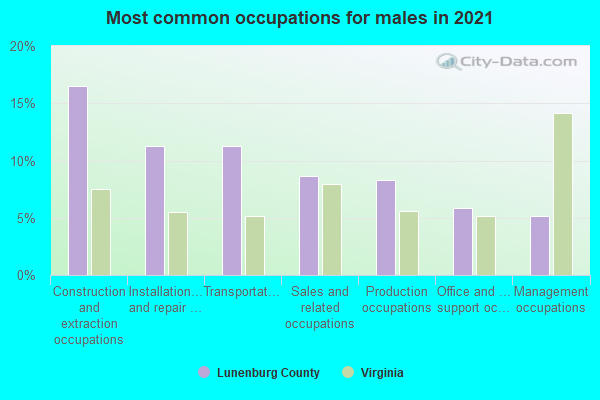
- Construction and extraction occupations (16%)
- Transportation occupations (12%)
- Installation, maintenance, and repair occupations (11%)
- Sales and related occupations (9%)
- Production occupations (8%)
- Architecture and engineering occupations (7%)
- Management occupations (7%)
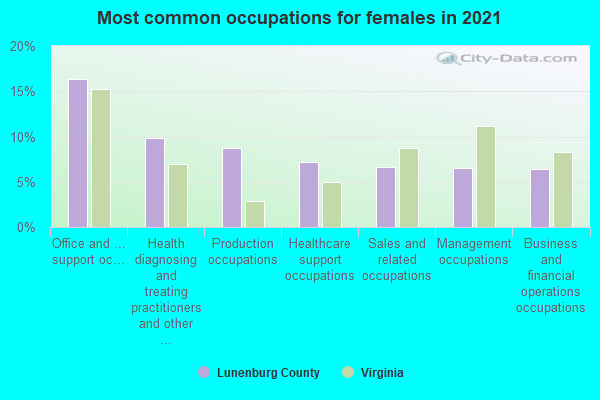
- Office and administrative support occupations (13%)
- Management occupations (13%)
- Material moving occupations (9%)
- Sales and related occupations (7%)
- Health diagnosing and treating practitioners and other technical occupations (7%)
- Health technologists and technicians (7%)
- Production occupations (7%)
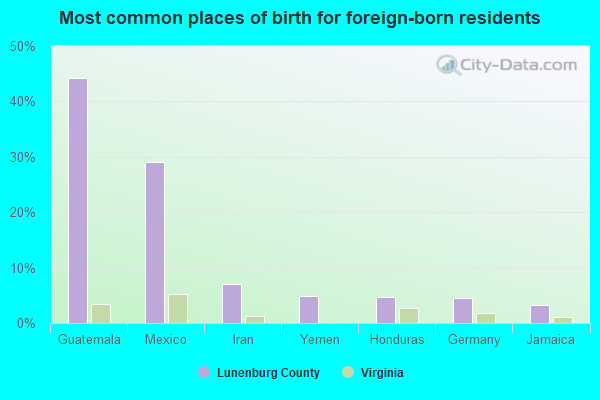
- Guatemala (54%)
- Yemen (8%)
- Iran (6%)
- Jamaica (5%)
- Honduras (4%)
- Philippines (3%)
- Germany (2%)
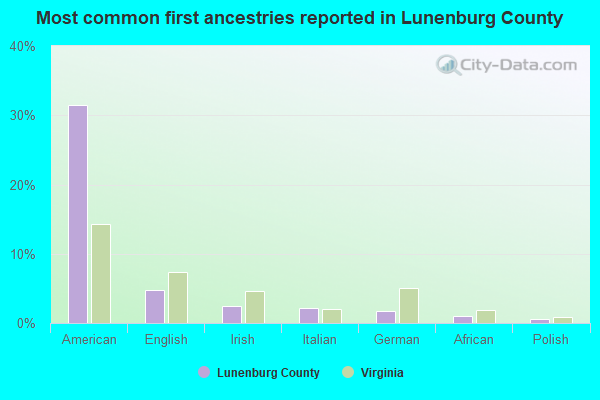
- American (30%)
- English (5%)
- German (2%)
- Irish (1%)
- African (1%)
- Italian (1%)
- European (1%)
People in group quarters in Lunenburg County, Virginia in 2010:
- 1,173 people in state prisons
- 21 people in nursing facilities/skilled-nursing facilities
- 9 people in group homes intended for adults
People in group quarters in Lunenburg County, Virginia in 2000:
- 1,119 people in federal prisons and detention centers
- 50 people in unknown juvenile institutions
- 18 people in homes for the physically handicapped
- 4 people in nursing homes
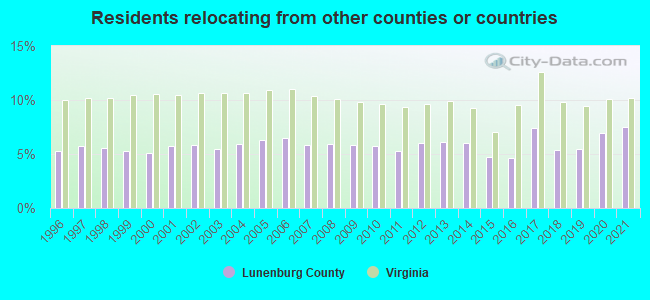
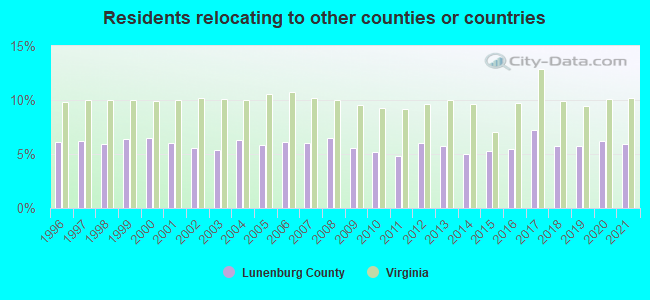
7.50% of this county's 2021 resident taxpayers lived in other counties in 2020 ($36,181 average adjusted gross income)
| Here: | 7.50% |
| Virginia average: | 10.16% |
10 or fewer of this county's residents moved from foreign countries.
6.47% relocated from other counties in Virginia ($31,295 average AGI)
1.03% relocated from other states ($4,886 average AGI)
Lunenburg County: 1.03% Virginia average: 3.91%
Top counties from which taxpayers relocated into this county between 2020 and 2021:
| from Nottoway County, VA | |
| from Mecklenburg County, VA | |
| from Prince Edward County, VA |
5.91% of this county's 2020 resident taxpayers moved to other counties in 2021 ($39,489 average adjusted gross income)
| Here: | 5.91% |
| Virginia average: | 10.20% |
10 or fewer of this county's residents moved to foreign countries.
4.76% relocated to other counties in Virginia ($29,139 average AGI)
1.15% relocated to other states ($10,355 average AGI)
Lunenburg County: 1.15% Virginia average: 3.98%
Top counties to which taxpayers relocated from this county between 2020 and 2021:
| to Mecklenburg County, VA | |
| to Nottoway County, VA |
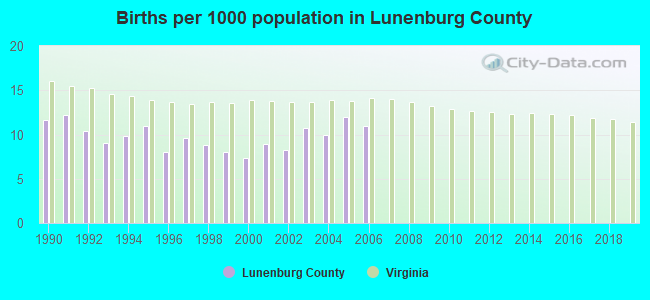
Births per 1000 population from 1990 to 1999: 9.8
Births per 1000 population from 2000 to 2006: 9.7
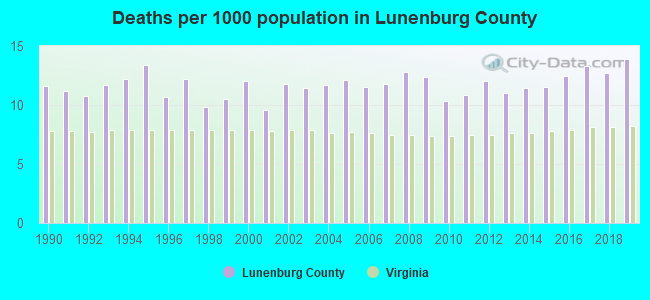
Deaths per 1000 population from 1990 to 1999: 11.4
Deaths per 1000 population from 2000 to 2009: 11.7
Deaths per 1000 population from 2010 to 2020: 12.1
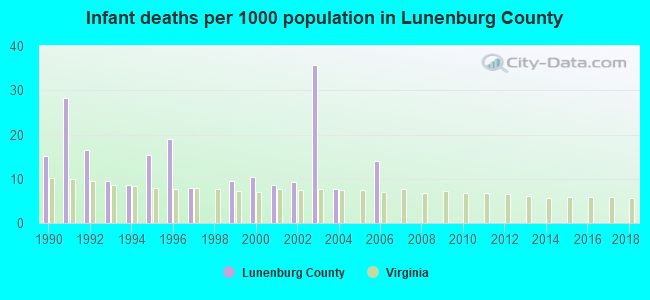
Infant deaths per 1000 live births from 1990 to 1999: 13.0
Infant deaths per 1000 live births from 2000 to 2006: 12.2
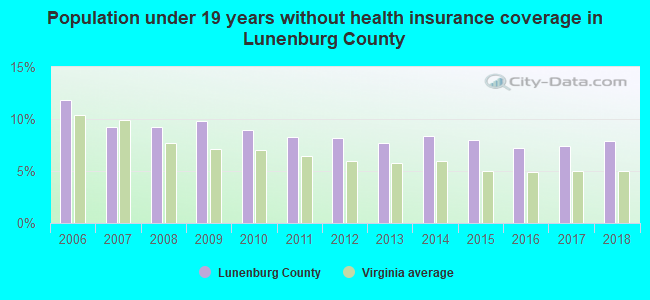
Persons under 19 years old without health insurance coverage in 2018: 7.9%
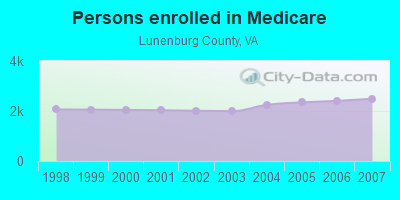
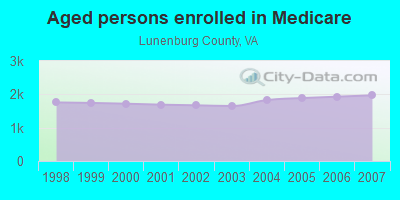
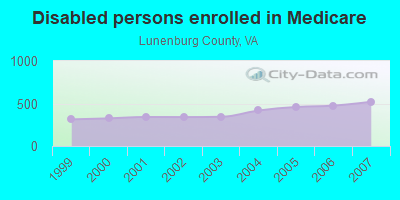
Persons enrolled in hospital insurance and/or supplemental medical insurance (Medicare) in July 1, 2007: 2,490 (1,970 aged, 520 disabled)
Children under 18 without health insurance coverage in 2007: 201 (8%)
Most common underlying causes of death in Lunenburg County, Virginia in 1999 - 2019:
- Acute myocardial infarction, unspecified (165)
- Bronchus or lung, unspecified - Malignant neoplasms (110)
- Atherosclerotic heart disease (99)
- Stroke, not specified as haemorrhage or infarction (10)
Population without health insurance coverage in 2000: 15%
Children under 18 without health insurance coverage in 2000: 13%
Medical specialist MDs per 100,000 population in 2005: 970
Dentists per 100,000 population in 1998: 15
Total births per 100,000 population, July 2005 - July 2006 : 17
Total deaths per 100,000 population, July 2005 - July 2006: 45
Limited-service eating places per 100,000 population in 2005 : 8
Crimes per 100,000 population in 1996: 1
Household type by relationship:
Households: 12,070- Male householders: 2,236 (571 living alone), Female householders: 2,457 (888 living alone)
2,210 spouses (2,210 opposite-sex spouses), 56 unmarried partners, (56 opposite-sex unmarried partners), 2,784 children (2,528 natural, 114 adopted, 134 stepchildren), 577 grandchildren, 149 brothers or sisters, 129 parents, 31 foster children, 299 other relatives, 184 non-relatives
- In group quarters: 896
Size of family households: 1,573 2-persons, 780 3-persons, 367 4-persons, 181 5-persons, 60 6-persons, 106 7-or-more-persons.
Size of nonfamily households: 1,460 1-person, 168 2-persons, 2 3-persons.
1,021 married couples with children.
655 single-parent households (249 men, 406 women).
94.2% of residents of Lunenburg speak English at home.
4.4% of residents speak Spanish at home (24% speak English very well, 38% speak English well, 37% speak English not well, 1% don't speak English at all).
0.5% of residents speak other Indo-European language at home (96% speak English very well, 4% don't speak English at all).
0.1% of residents speak Asian or Pacific Island language at home (100% speak English very well).
0.5% of residents speak other language at home (73% speak English very well, 27% don't speak English at all).
In fiscal year 2004:
Federal Government expenditure: $62,677,000 ($4,790 per capita)
Department of Defense expenditure: $2,168,000
Federal direct payments to individuals for retirement and disability: $32,075,000
Federal other direct payments to individuals: $14,396,000
Federal direct payments not to individuals: $861,000
Federal grants: $13,339,000
Federal procurement contracts: $381,000 ($0,000 Department of Defense)
Federal salaries and wages: $1,625,000 ($0,000 Department of Defense)
Federal Government direct loans: $385,000
Federal guaranteed/insured loans: $1,673,000
Federal Government insurance: $3,571,000
Population change from April 1, 2000 to July 1, 2005:
Births: 669| Here: | 51 per 1000 residents |
| State: | 70 per 1000 residents |
Deaths: 778
| Here: | 59 per 1000 residents |
| State: | 40 per 1000 residents |
Net international migration: +78
| Here: | +6 per 1000 residents |
| State: | +18 per 1000 residents |
Net internal migration: +110
| Here: | +8 per 1000 residents |
| State: | +14 per 1000 residents |
Total withdrawal of fresh water for public supply: 0.23 millions of gallons per day (all from surface)
| Here: | 6.3 |
| State: | 7.0 |
| Here: | 5.2 |
| State: | 4.3 |
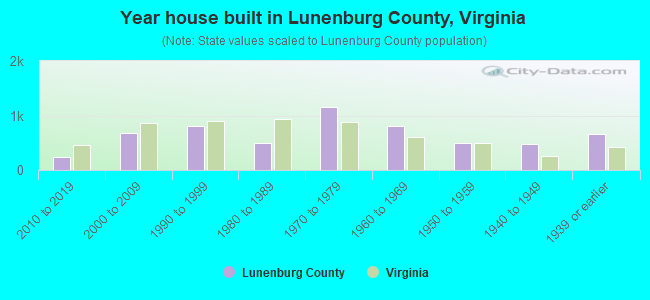
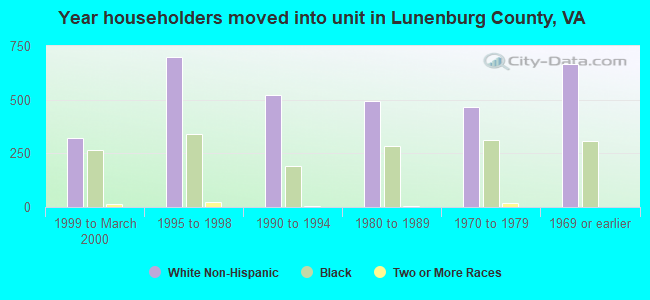
- Year house built in Lunenburg County, Virginia
- 02020 or later
- 2172010 to 2019
- 7582000 to 2009
- 7361990 to 1999
- 6401980 to 1989
- 1,0531970 to 1979
- 6861960 to 1969
- 4241950 to 1959
- 4411940 to 1949
- 8871939 or earlier
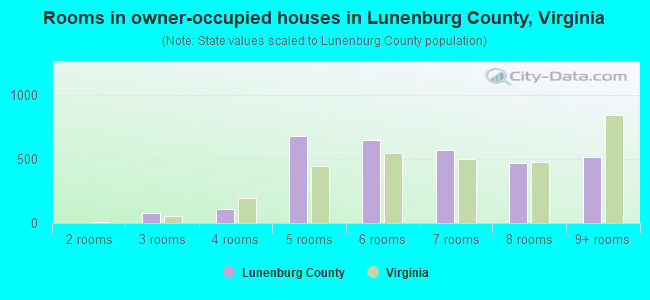
- Rooms in owner-occupied houses in Lunenburg County, Virginia
- 01 room
- 02 rooms
- 363 rooms
- 2144 rooms
- 7245 rooms
- 8276 rooms
- 5217 rooms
- 4468 rooms
- 5199+ rooms
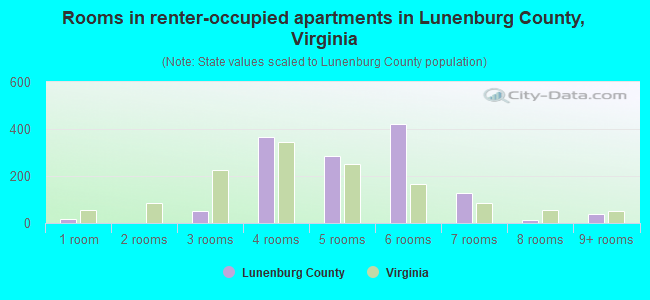
- Rooms in renter-occupied apartments in Lunenburg County, Virginia
- 111 room
- 22 rooms
- 413 rooms
- 4444 rooms
- 2395 rooms
- 4026 rooms
- 1567 rooms
- 298 rooms
- 449+ rooms
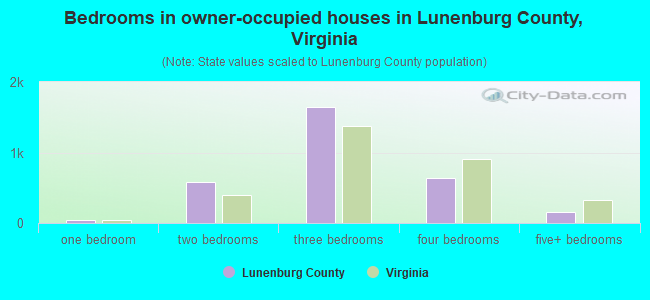
- Bedrooms in owner-occupied houses in Lunenburg County, Virginia
- 0no bedroom
- 321 bedroom
- 5502 bedrooms
- 1,8703 bedrooms
- 6544 bedrooms
- 1865+ bedrooms
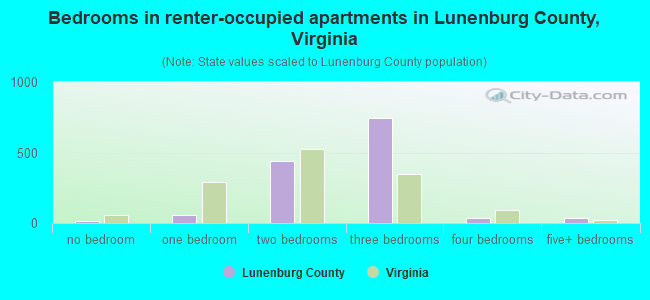
- Bedrooms in renter-occupied apartments in Lunenburg County, Virginia
- 11no bedroom
- 601 bedroom
- 5152 bedrooms
- 6383 bedrooms
- 1074 bedrooms
- 455+ bedrooms
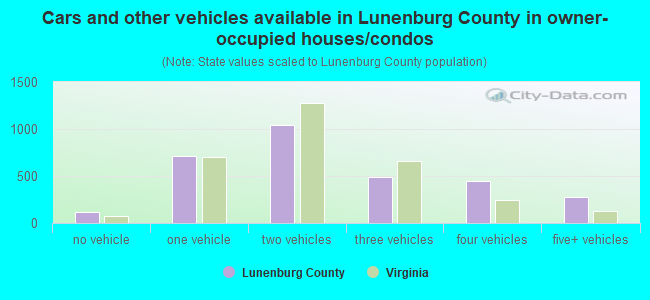
- Cars and other vehicles available in Lunenburg County in owner-occupied houses/condos
- 156no vehicle
- 7511 vehicle
- 1,1012 vehicles
- 6223 vehicles
- 4334 vehicles
- 2355+ vehicles
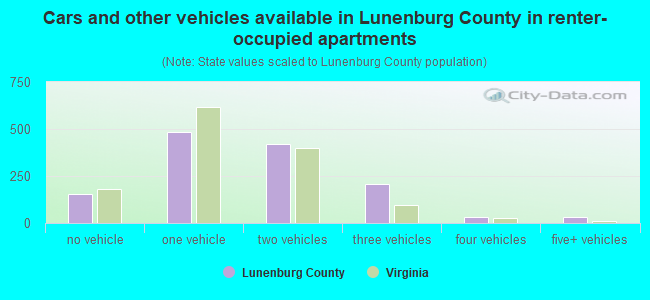
- Cars and other vehicles available in Lunenburg County in renter-occupied apartments
- 212no vehicle
- 5611 vehicle
- 3362 vehicles
- 1953 vehicles
- 524 vehicles
- 335+ vehicles
96.0% of Lunenburg County residents lived in the same house 1 years ago.
Out of people who lived in different houses, 22% lived in this county.
Out of people who lived in different counties, 76% lived in Virginia.
| Lunenburg County: | 96.0% |
| State average: | 86.6% |
Place of birth for U.S.-born residents:
- This state: 8,530
- Other state: 2,850
- Northeast: 936
- Midwest: 319
- South: 1,415
- West: 172
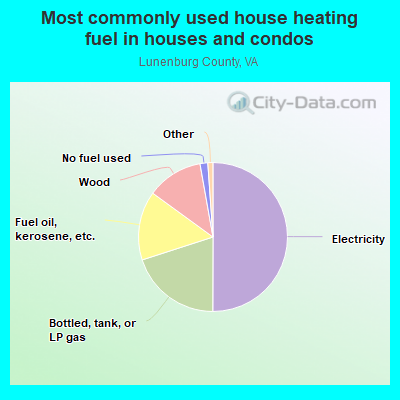
- 51.8%Electricity
- 20.1%Bottled, tank, or LP gas
- 14.5%Fuel oil, kerosene, etc.
- 9.9%Wood
- 2.4%No fuel used
- 1.3%Utility gas
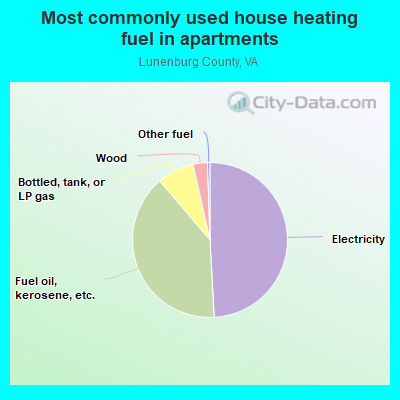
- 49.8%Electricity
- 32.6%Fuel oil, kerosene, etc.
- 15.0%Bottled, tank, or LP gas
- 2.5%Wood
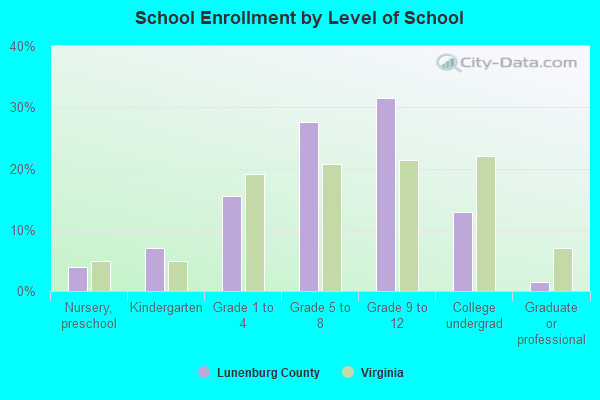
Private vs. public school enrollment:
| Here: | 2.6% |
| Virginia: | 13.2% |
| Here: | 6.5% |
| Virginia: | 10.2% |
| Here: | 12.7% |
| Virginia: | 18.7% |
Lunenburg County government finances - Expenditure in 2017:
- Bond Funds - Cash and Securities: $2,182,000
- Charges - Elementary and Secondary Education School Lunch: $251,000
Solid Waste Management: $102,000
Air Transportation: $29,000
Other: $28,000
- Construction - Elementary and Secondary Education: $1,173,000
- Current Operations - Elementary and Secondary Education: $23,777,000
Public Welfare - Other: $2,752,000
Housing and Community Development: $1,923,000
Financial Administration: $1,377,000
Police Protection: $1,309,000
Solid Waste Management: $895,000
Judicial and Legal Services: $703,000
Health - Other: $447,000
General - Other: $377,000
Local Fire Protection: $348,000
General Public Buildings: $285,000
Protective Inspection and Regulation - Other: $92,000
Central Staff Services: $53,000
Air Transportation: $42,000
Correctional Institutions: $22,000
- Federal Intergovernmental - Public Welfare: $448,000
Education: $325,000
Other: $185,000
- General - Interest on Debt: $872,000
- Intergovernmental to Local - Other - Elementary and Secondary Education: $165,000
- Local Intergovernmental - Education: $310,000
- Long Term Debt - Beginning Outstanding - Unspecified Public Purpose: $16,626,000
Outstanding Unspecified Public Purpose: $10,211,000
Retired Unspecified Public Purpose: $6,415,000
- Miscellaneous - Interest Earnings: $342,000
General Revenue - Other: $306,000
Donations From Private Sources: $302,000
Rents: $44,000
Fines and Forfeits: $38,000
- Other Capital Outlay - Elementary and Secondary Education: $198,000
Solid Waste Management: $83,000
General - Other: $27,000
- Other Funds - Cash and Securities: $6,764,000
- Sinking Funds - Cash and Securities: $300,000
- State Intergovernmental - Education: $14,797,000
Other: $3,952,000
General Local Government Support: $1,394,000
Public Welfare: $374,000
Health and Hospitals: $13,000
- Tax - Property: $9,985,000
Other License: $395,000
Motor Vehicle License: $309,000
Public Utilities Sales: $232,000
Documentary and Stock Transfer: $45,000
- Total Salaries and Wages: $12,283,000
Lunenburg County government finances - Revenue in 2017:
- Bond Funds - Cash and Securities: $2,182,000
- Charges - Elementary and Secondary Education School Lunch: $251,000
Solid Waste Management: $102,000
Air Transportation: $29,000
Other: $28,000
- Construction - Elementary and Secondary Education: $1,173,000
- Current Operations - Elementary and Secondary Education: $23,777,000
Public Welfare - Other: $2,752,000
Housing and Community Development: $1,923,000
Financial Administration: $1,377,000
Police Protection: $1,309,000
Solid Waste Management: $895,000
Judicial and Legal Services: $703,000
Health - Other: $447,000
General - Other: $377,000
Local Fire Protection: $348,000
General Public Buildings: $285,000
Protective Inspection and Regulation - Other: $92,000
Central Staff Services: $53,000
Air Transportation: $42,000
Correctional Institutions: $22,000
- Federal Intergovernmental - Public Welfare: $448,000
Education: $325,000
Other: $185,000
- General - Interest on Debt: $872,000
- Intergovernmental to Local - Other - Elementary and Secondary Education: $165,000
- Local Intergovernmental - Education: $310,000
- Long Term Debt - Beginning Outstanding - Unspecified Public Purpose: $16,626,000
Outstanding Unspecified Public Purpose: $10,211,000
Retired Unspecified Public Purpose: $6,415,000
- Miscellaneous - Interest Earnings: $342,000
General Revenue - Other: $306,000
Donations From Private Sources: $302,000
Rents: $44,000
Fines and Forfeits: $38,000
- Other Capital Outlay - Elementary and Secondary Education: $198,000
Solid Waste Management: $83,000
General - Other: $27,000
- Other Funds - Cash and Securities: $6,764,000
- Sinking Funds - Cash and Securities: $300,000
- State Intergovernmental - Education: $14,797,000
Other: $3,952,000
General Local Government Support: $1,394,000
Public Welfare: $374,000
Health and Hospitals: $13,000
- Tax - Property: $9,985,000
Other License: $395,000
Motor Vehicle License: $309,000
Public Utilities Sales: $232,000
Documentary and Stock Transfer: $45,000
- Total Salaries and Wages: $12,283,000
Lunenburg County government finances - Debt in 2017:
- Bond Funds - Cash and Securities: $2,182,000
- Charges - Elementary and Secondary Education School Lunch: $251,000
Solid Waste Management: $102,000
Air Transportation: $29,000
Other: $28,000
- Construction - Elementary and Secondary Education: $1,173,000
- Current Operations - Elementary and Secondary Education: $23,777,000
Public Welfare - Other: $2,752,000
Housing and Community Development: $1,923,000
Financial Administration: $1,377,000
Police Protection: $1,309,000
Solid Waste Management: $895,000
Judicial and Legal Services: $703,000
Health - Other: $447,000
General - Other: $377,000
Local Fire Protection: $348,000
General Public Buildings: $285,000
Protective Inspection and Regulation - Other: $92,000
Central Staff Services: $53,000
Air Transportation: $42,000
Correctional Institutions: $22,000
- Federal Intergovernmental - Public Welfare: $448,000
Education: $325,000
Other: $185,000
- General - Interest on Debt: $872,000
- Intergovernmental to Local - Other - Elementary and Secondary Education: $165,000
- Local Intergovernmental - Education: $310,000
- Long Term Debt - Beginning Outstanding - Unspecified Public Purpose: $16,626,000
Outstanding Unspecified Public Purpose: $10,211,000
Retired Unspecified Public Purpose: $6,415,000
- Miscellaneous - Interest Earnings: $342,000
General Revenue - Other: $306,000
Donations From Private Sources: $302,000
Rents: $44,000
Fines and Forfeits: $38,000
- Other Capital Outlay - Elementary and Secondary Education: $198,000
Solid Waste Management: $83,000
General - Other: $27,000
- Other Funds - Cash and Securities: $6,764,000
- Sinking Funds - Cash and Securities: $300,000
- State Intergovernmental - Education: $14,797,000
Other: $3,952,000
General Local Government Support: $1,394,000
Public Welfare: $374,000
Health and Hospitals: $13,000
- Tax - Property: $9,985,000
Other License: $395,000
Motor Vehicle License: $309,000
Public Utilities Sales: $232,000
Documentary and Stock Transfer: $45,000
- Total Salaries and Wages: $12,283,000
Lunenburg County government finances - Cash and Securities in 2017:
- Bond Funds - Cash and Securities: $2,182,000
- Charges - Elementary and Secondary Education School Lunch: $251,000
Solid Waste Management: $102,000
Air Transportation: $29,000
Other: $28,000
- Construction - Elementary and Secondary Education: $1,173,000
- Current Operations - Elementary and Secondary Education: $23,777,000
Public Welfare - Other: $2,752,000
Housing and Community Development: $1,923,000
Financial Administration: $1,377,000
Police Protection: $1,309,000
Solid Waste Management: $895,000
Judicial and Legal Services: $703,000
Health - Other: $447,000
General - Other: $377,000
Local Fire Protection: $348,000
General Public Buildings: $285,000
Protective Inspection and Regulation - Other: $92,000
Central Staff Services: $53,000
Air Transportation: $42,000
Correctional Institutions: $22,000
- Federal Intergovernmental - Public Welfare: $448,000
Education: $325,000
Other: $185,000
- General - Interest on Debt: $872,000
- Intergovernmental to Local - Other - Elementary and Secondary Education: $165,000
- Local Intergovernmental - Education: $310,000
- Long Term Debt - Beginning Outstanding - Unspecified Public Purpose: $16,626,000
Outstanding Unspecified Public Purpose: $10,211,000
Retired Unspecified Public Purpose: $6,415,000
- Miscellaneous - Interest Earnings: $342,000
General Revenue - Other: $306,000
Donations From Private Sources: $302,000
Rents: $44,000
Fines and Forfeits: $38,000
- Other Capital Outlay - Elementary and Secondary Education: $198,000
Solid Waste Management: $83,000
General - Other: $27,000
- Other Funds - Cash and Securities: $6,764,000
- Sinking Funds - Cash and Securities: $300,000
- State Intergovernmental - Education: $14,797,000
Other: $3,952,000
General Local Government Support: $1,394,000
Public Welfare: $374,000
Health and Hospitals: $13,000
- Tax - Property: $9,985,000
Other License: $395,000
Motor Vehicle License: $309,000
Public Utilities Sales: $232,000
Documentary and Stock Transfer: $45,000
- Total Salaries and Wages: $12,283,000
Supplemental Security Income (SSI) in 2006:
- Total number of recipients: 531
- Number of aged recipients: 89
- Number of blind and disabled recipients: 442
- Number of recipients under 18: 87
- Number of recipients between 18 and 64: 306
- Number of recipients older than 64: 138
- Number of recipients also receiving OASDI: 240
- Amount of payments (thousands of dollars): 206
| Most common first names in Lunenburg County, VA among deceased individuals | ||
| Name | Count | Lived (average) |
|---|---|---|
| James | 112 | 70.4 years |
| Mary | 102 | 78.0 years |
| John | 93 | 73.8 years |
| William | 92 | 72.5 years |
| Robert | 66 | 70.7 years |
| George | 55 | 70.2 years |
| Willie | 51 | 73.6 years |
| Thomas | 47 | 73.6 years |
| Richard | 40 | 71.1 years |
| Annie | 39 | 82.8 years |
| Most common last names in Lunenburg County, VA among deceased individuals | ||
| Last name | Count | Lived (average) |
|---|---|---|
| Smith | 60 | 73.9 years |
| Jones | 57 | 68.7 years |
| Williams | 55 | 76.2 years |
| Bagley | 41 | 77.6 years |
| Johnson | 38 | 69.9 years |
| Gee | 35 | 76.2 years |
| Davis | 30 | 71.4 years |
| Jackson | 29 | 71.9 years |
| Tisdale | 28 | 75.3 years |
| Love | 28 | 78.7 years |
| Businesses in Lunenburg County, VA | ||||
| Name | Count | Name | Count | |
|---|---|---|---|---|
| Ace Hardware | 1 | U-Haul | 1 | |
| Circle K | 1 | UPS | 1 | |
| H&R Block | 1 | |||