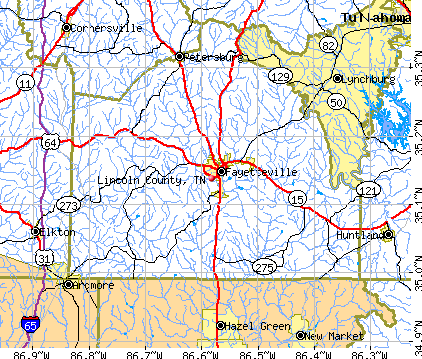
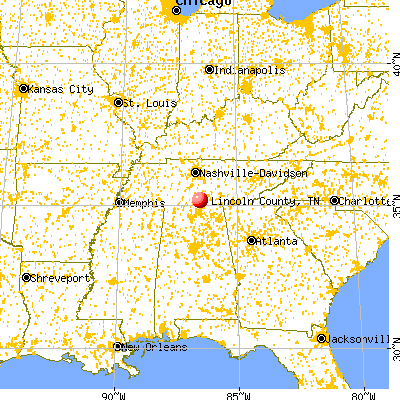
Lincoln County, Tennessee (TN)
County owner-occupied free and clear houses and condos in 2010: 4,151
County owner-occupied houses and condos in 2000: 9,533
Renter-occupied apartments: 3,333 (it was 2,970 in 2000)
| % of renters here: | 24% |
| State: | 32% |
Land area: 570 sq. mi.
Water area: 0.4 sq. mi.
Population density: 63 people per square mile (average).
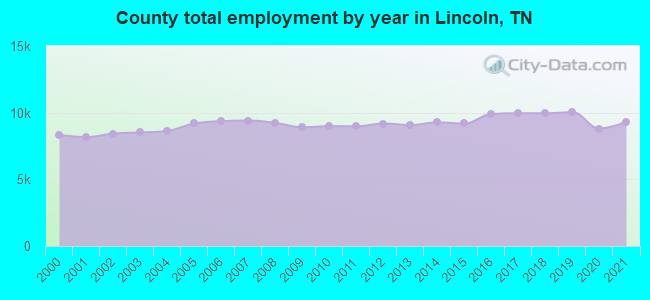
Industries providing employment: Manufacturing (20.5%), Educational, health and social services (20.4%).
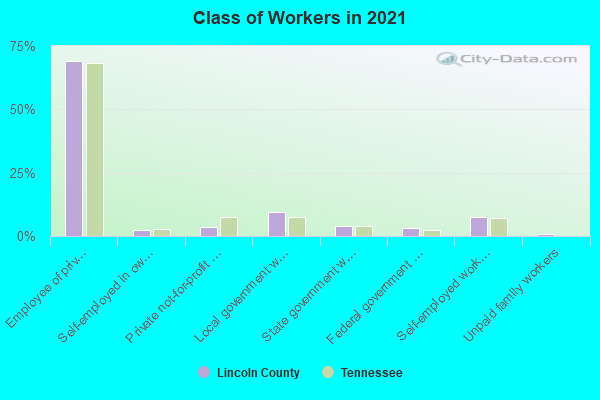
Type of workers:
- Private wage or salary: 76%
- Government: 16%
- Self-employed, not incorporated: 8%
- Unpaid family work: 1%
- OSM Map
- General Map
- Google Map
- MSN Map

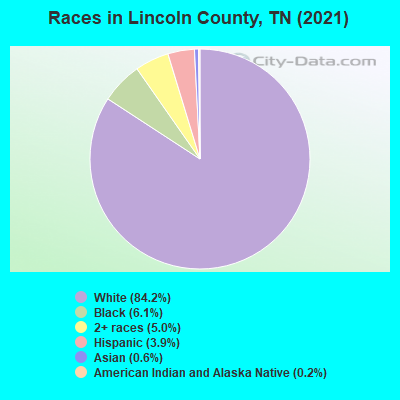
- 30,47584.4%White Non-Hispanic Alone
- 2,1455.9%Black Non-Hispanic Alone
- 1,7284.8%Two or more races
- 1,4624.0%Hispanic or Latino
- 2430.7%Asian alone
- 430.1%Some other race alone
- 330.09%American Indian and Alaska Native alone
| Median resident age: | 43.5 years |
| Tennessee median age: | 39.2 years |
| Males: 17,751 | |
| Females: 18,265 |

 | COVID-19 in Tennessee (237 replies) |
| Thinking about moving to Tennessee or Kentucky with in 1.5 hours of Nashville (8 replies) |
| Nashville vs. Louisville (108 replies) |
| Tennessee Population Estimates 2016 (28 replies) |
| Tornado, freaking out. What to do? (88 replies) |
| 3rd case of bird flu detected in Tennessee (1 reply) |
| Lincoln County: | 2.0 people |
| Tennessee: | 2 people |
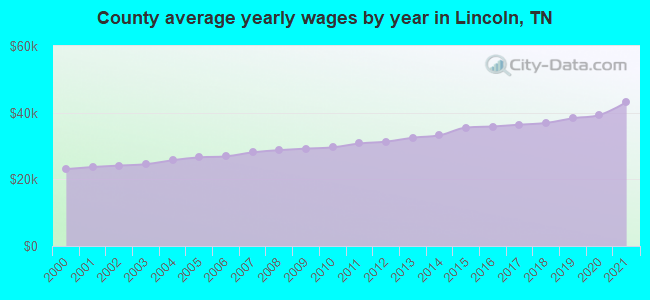
Estimated median household income in 2022: $62,542 ($33,434 in 1999)
| This county: | $62,542 |
| Tennessee: | $65,254 |
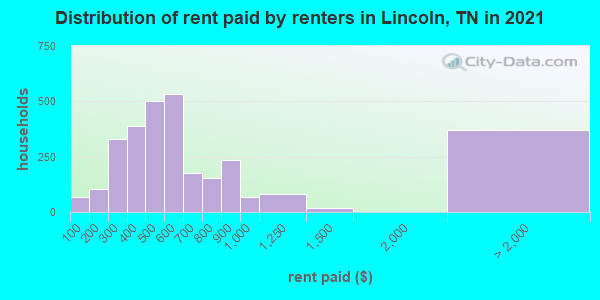
Median contract rent in 2022 for apartments: $574 (lower quartile is $404, upper quartile is $687)
| This county: | $574 |
| State: | $884 |
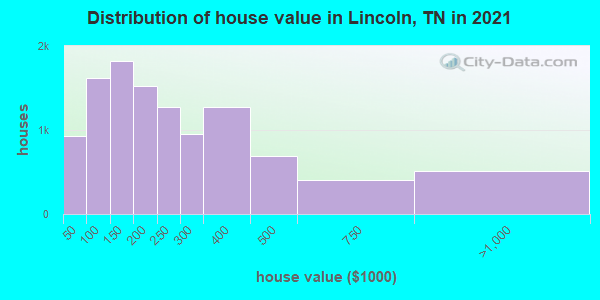
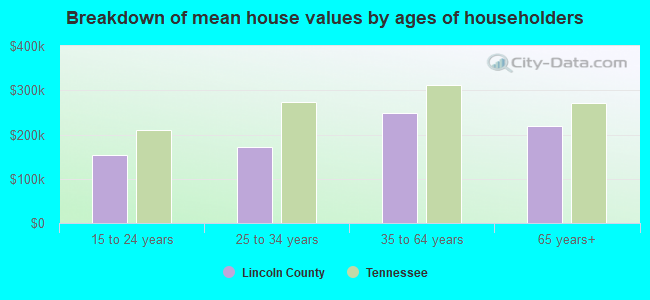
Estimated median house or condo value in 2022: $228,601 (it was $74,300 in 2000)
| Lincoln: | $228,601 |
| Tennessee: | $284,800 |
Median monthly housing costs for homes and condos with a mortgage: $1,223
Median monthly housing costs for units without a mortgage: $451
Institutionalized population: 272
Crime in 2021 (reported by the sheriff's office or county police, not the county total):
- Murders: 0
- Rapes: 7
- Robberies: 1
- Assaults: 37
- Burglaries: 62
- Thefts: 141
- Auto thefts: 28
Crime in 2020 (reported by the sheriff's office or county police, not the county total):
- Murders: 0
- Rapes: 5
- Robberies: 2
- Assaults: 47
- Burglaries: 99
- Thefts: 194
- Auto thefts: 40
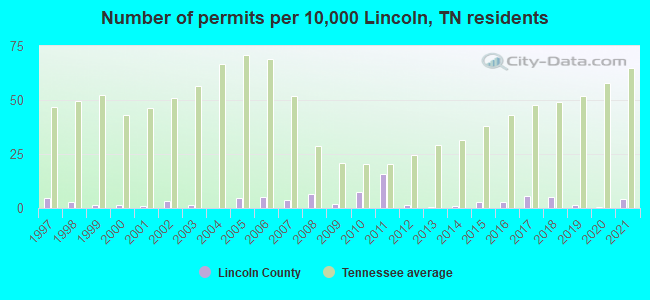
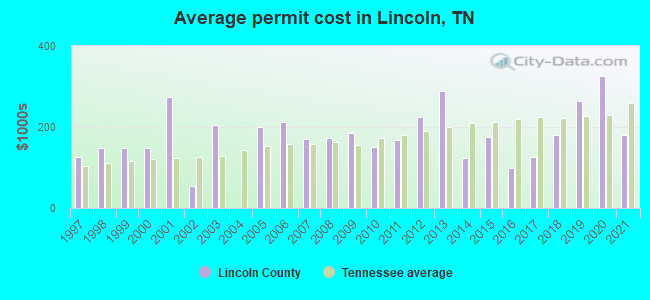
Single-family new house construction building permits:
- 2022: 6 buildings, average cost: $155,700
- 2021: 13 buildings, average cost: $179,500
- 2020: 1 building, cost: $325,000
- 2019: 5 buildings, average cost: $264,000
- 2018: 16 buildings, average cost: $180,800
- 2017: 18 buildings, average cost: $125,800
- 2016: 9 buildings, average cost: $98,300
- 2015: 8 buildings, average cost: $175,500
- 2014: 3 buildings, average cost: $123,400
- 2013: 2 buildings, average cost: $289,300
- 2012: 4 buildings, average cost: $224,300
- 2011: 50 buildings, average cost: $169,200
- 2010: 23 buildings, average cost: $149,700
- 2009: 6 buildings, average cost: $184,000
- 2008: 20 buildings, average cost: $173,300
- 2007: 12 buildings, average cost: $171,400
- 2006: 16 buildings, average cost: $213,100
- 2005: 14 buildings, average cost: $198,600
- 2004: 0 buildings
- 2003: 4 buildings, average cost: $204,600
- 2002: 10 buildings, average cost: $54,900
- 2001: 3 buildings, average cost: $275,000
- 2000: 4 buildings, average cost: $148,800
- 1999: 5 buildings, average cost: $147,200
- 1998: 8 buildings, average cost: $148,000
- 1997: 14 buildings, average cost: $124,600
Median real estate property taxes paid for housing units with mortgages in 2022: $929 (0.4%)
Median real estate property taxes paid for housing units with no mortgage in 2022: $939 (0.4%)

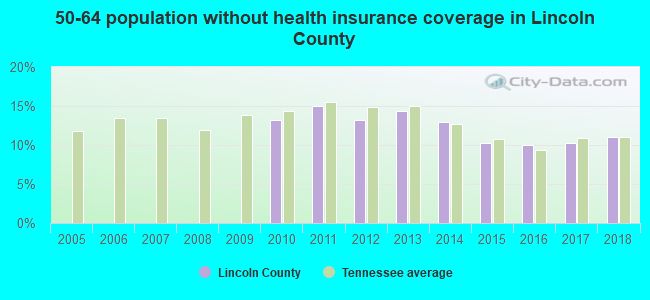
| Lincoln County: | 11.4% |
| Tennessee: | 13.3% |
Median age of residents in 2022: 43.5 years old
(Males: 42.4 years old, Females: 44.7 years old)
(Median age for: White residents: 44.9 years old, Black residents: 40.8 years old, American Indian residents: 22.2 years old, Asian residents: 39.6 years old, Hispanic or Latino residents: 24.0 years old, Other race residents: 35.0 years old)
Fair market rent in 2006 for a 1-bedroom apartment in Lincoln County is $382 a month.
Fair market rent for a 2-bedroom apartment is $460 a month.
Fair market rent for a 3-bedroom apartment is $562 a month.
Cities in this county include: Belleview, Fayetteville, Flintville, Cash Point-Blanche, Park City, Mulberry, Boonshill, Petersburg.
Neighboring counties: Caddo County, Oklahoma  , Greer County, Oklahoma , Harmon County, Oklahoma , Lancaster County, South Carolina
  , Haywood County, North Carolina , Oklahoma County, Oklahoma , Pottawatomie County, Oklahoma .
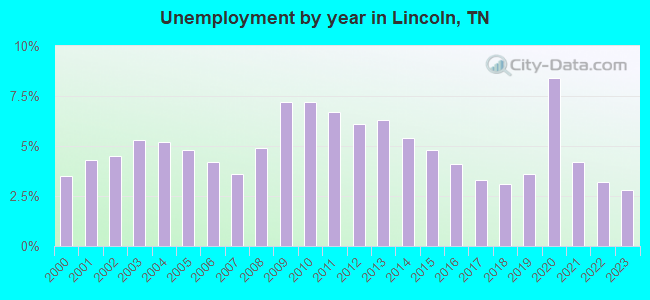
| Here: | 2.7% |
| Tennessee: | 3.0% |
Current college students: 943
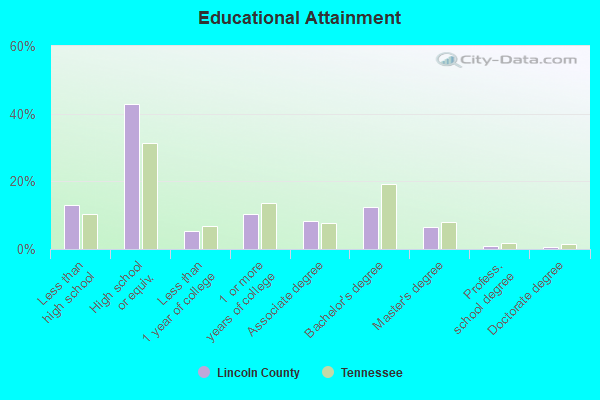
People 25 years of age or older with a high school degree or higher: 88.1%
People 25 years of age or older with a bachelor's degree or higher: 19.3%
Number of foreign born residents: 1,139 (38.2% naturalized citizens)
| Lincoln County: | 3.2% |
| Whole state: | 5.6% |
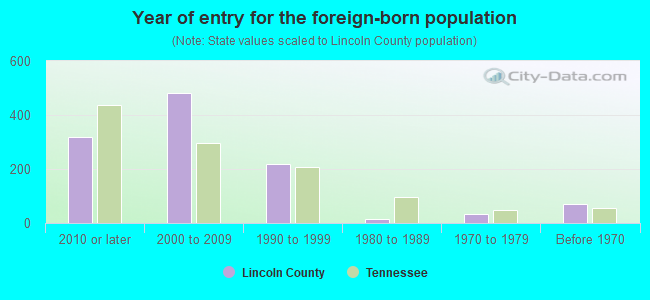
- Year of entry for the foreign-born population
- 2512010 or later
- 5842000 to 2009
- 2261990 to 1999
- 161980 to 1989
- 351970 to 1979
- 69Before 1970
Mean travel time to work (commute): minutes
Percentage of county residents living and working in this county: 76.5%
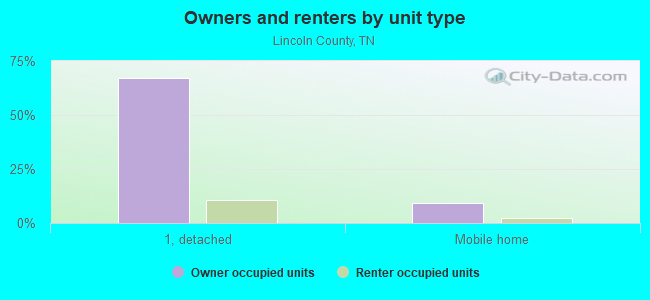
Housing units in structures:
- One, detached: 12,875
- One, attached: 148
- Two: 408
- 3 or 4: 530
- 5 to 9: 191
- 10 to 19: 66
- 20 or more: 69
- Mobile homes: 2,007
- Boats, RVs, vans, etc.: 75
Housing units in Lincoln County with a mortgage: 5,757 (414 second mortgage, 17 home equity loan, 382 both second mortgage and home equity loan)
Houses without a mortgage: 87
| Here: | 5.4% with mortgage |
| State: | 97.8% with mortgage |
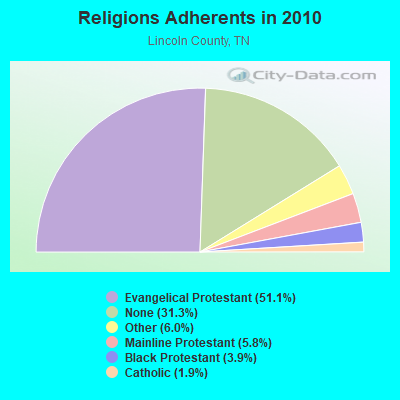
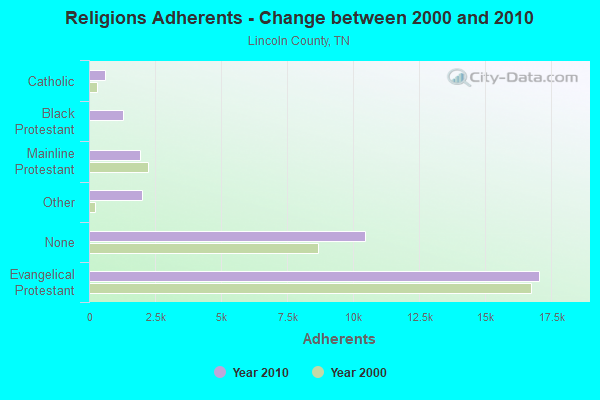
Religion statistics for Lincoln County
| Religion | Adherents | Congregations |
|---|---|---|
| Evangelical Protestant | 17,059 | 89 |
| Other | 2,009 | 3 |
| Mainline Protestant | 1,929 | 19 |
| Black Protestant | 1,294 | 8 |
| Catholic | 621 | 1 |
| None | 10,449 | - |
Source: Clifford Grammich, Kirk Hadaway, Richard Houseal, Dale E.Jones, Alexei Krindatch, Richie Stanley and Richard H.Taylor. 2012. 2010 U.S.Religion Census: Religious Congregations & Membership Study. Association of Statisticians of American Religious Bodies. Jones, Dale E., et al. 2002. Congregations and Membership in the United States 2000. Nashville, TN: Glenmary Research Center.
Food Environment Statistics:
| Lincoln County: | 2.45 / 10,000 pop. |
| State: | 1.99 / 10,000 pop. |
| Here: | 0.31 / 10,000 pop. |
| Tennessee: | 0.17 / 10,000 pop. |
| This county: | 1.22 / 10,000 pop. |
| Tennessee: | 0.65 / 10,000 pop. |
| Lincoln County: | 6.12 / 10,000 pop. |
| Tennessee: | 5.16 / 10,000 pop. |
| This county: | 6.43 / 10,000 pop. |
| State: | 6.56 / 10,000 pop. |
| Lincoln County: | 11.2% |
| Tennessee: | 11.4% |
| Lincoln County: | 29.4% |
| State: | 30.2% |
| Here: | 13.2% |
| State: | 13.5% |
Agriculture in Lincoln County:
Average size of farms: 148 acresAverage value of agricultural products sold per farm: $24,065
Average value of crops sold per acre for harvested cropland: $200.92
The value of nursery, greenhouse, floriculture, and sod as a percentage of the total market value of agricultural products sold: 13.31%
The value of livestock, poultry, and their products as a percentage of the total market value of agricultural products sold: 62.18%
Average total farm production expenses per farm: $25,143
Harvested cropland as a percentage of land in farms: 30.70%
Irrigated harvested cropland as a percentage of land in farms: 1.75%
Average market value of all machinery and equipment per farm: $40,450
The percentage of farms operated by a family or individual: 95.17%
Average age of principal farm operators: 56 years
Average number of cattle and calves per 100 acres of all land in farms: 24.83
Milk cows as a percentage of all cattle and calves: 3.40%
Corn for grain: 8233 harvested acres
All wheat for grain: 2658 harvested acres
Upland cotton: 14179 harvested acres
Soybeans for beans: 11295 harvested acres
Vegetables: 548 harvested acres
Earthquake activity:
Lincoln County-area historical earthquake activity is significantly above Tennessee state average. It is 172% greater than the overall U.S. average.On 4/29/2003 at 08:59:39, a magnitude 4.9 (4.4 MB, 4.6 MW, 4.9 LG, Class: Light, Intensity: IV - V) earthquake occurred 70.1 miles away from Lincoln County center
On 4/29/2003 at 08:59:39, a magnitude 4.6 (4.6 MW, Depth: 12.3 mi) earthquake occurred 70.1 miles away from the county center
On 4/18/2008 at 09:36:59, a magnitude 5.4 (5.1 MB, 4.8 MS, 5.4 MW, 5.2 MW, Class: Moderate, Intensity: VI - VII) earthquake occurred 240.4 miles away from the county center
On 1/18/1999 at 07:00:53, a magnitude 4.8 (4.8 MB, 4.0 LG, Depth: 0.6 mi) earthquake occurred 125.8 miles away from the county center
On 4/18/2008 at 09:36:59, a magnitude 5.2 (5.2 MW, Depth: 8.9 mi) earthquake occurred 240.3 miles away from Lincoln County center
On 5/4/1991 at 01:18:54, a magnitude 5.0 (4.4 MB, 4.6 LG, 5.0 LG, Depth: 3.1 mi) earthquake occurred 206.7 miles away from the county center
Magnitude types: regional Lg-wave magnitude (LG), body-wave magnitude (MB), surface-wave magnitude (MS), moment magnitude (MW)
Most recent natural disasters:
- Tennessee Covid-19 Pandemic, Incident Period: January 20, 2020, FEMA Id: 4514, Natural disaster type: Other
- Tennessee Severe Storms, Flooding, Landslides, And Mudslides, Incident Period: February 19, 2019 - March 30, 2019, FEMA Id: 4427, Natural disaster type: Storm, Mudslide, Landslide, Flood
- Tennessee Severe Storms, Tornadoes, Straight-line Winds, and Associated Flooding, Incident Period: April 25, 2011 to April 28, 2011, Major Disaster (Presidential) Declared DR-1974: May 01, 2011, FEMA Id: 1974, Natural disaster type: Storm, Tornado, Flood, Wind
- Tennessee Severe Storms, Tornadoes, Straight-line Winds, and Flooding, Incident Period: April 19, 2011 to June 07, 2011, Major Disaster (Presidential) Declared DR-1979: May 09, 2011, FEMA Id: 1979, Natural disaster type: Storm, Tornado, Flood, Wind
- Tennessee Hurricane Katrina Evacuation, Incident Period: August 29, 2005 to October 01, 2005, Emergency Declared EM-3217: September 05, 2005, FEMA Id: 3217, Natural disaster type: Hurricane
- Tennessee Severe Storms, Tornadoes and Flooding, Incident Period: May 04, 2003 to May 30, 2003, Major Disaster (Presidential) Declared DR-1464: May 08, 2003, FEMA Id: 1464, Natural disaster type: Storm, Tornado, Flood
- Tennessee Storms and Flooding, Incident Period: January 23, 2002 to March 20, 2002, Major Disaster (Presidential) Declared DR-1408: April 05, 2002, FEMA Id: 1408, Natural disaster type: Storm, Flood
- Tennessee Winter Storm, Incident Period: December 23, 1998 to December 29, 1998, Major Disaster (Presidential) Declared DR-1260: January 15, 1999, FEMA Id: 1260, Natural disaster type: Winter Storm
- Tennessee Ice Storm, Severe Winter Storm, Flash Flooding, Incident Period: February 09, 1994 to February 11, 1994, Major Disaster (Presidential) Declared DR-1010: February 28, 1994, FEMA Id: 1010, Natural disaster type: Ice Storm, Winter Storm, Flash Flood
- Tennessee Severe Snowfall, Winter Storm, Incident Period: March 13, 1993 to March 17, 1993, Emergency Declared EM-3095: March 14, 1993, FEMA Id: 3095, Natural disaster type: Winter Storm, Snowfall
- 3 other natural disasters have been reported since 1953.
The number of natural disasters in Lincoln County (13) is near the US average (15).
Major Disasters (Presidential) Declared: 9
Emergencies Declared: 2
Causes of natural disasters: Floods: 7, Storms: 6, Tornadoes: 4, Winter Storms: 3, Winds: 2, Flash Flood: 1, Heavy Rain: 1, Hurricane: 1, Ice Storm: 1, Landslide: 1, Mudslide: 1, Snowfall: 1, Other: 1 (Note: some incidents may be assigned to more than one category).
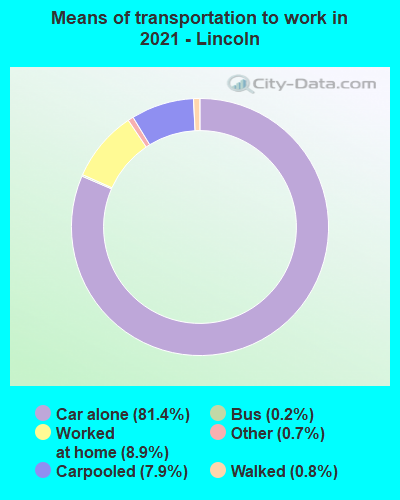
Means of transportation to work:
- Drove a car alone: 8,699 (76.8%)
- Carpooled: 944 (8.3%)
- Taxicab, motorcycle, or other means: 158 (1.4%)
- Walked: 64 (0.6%)
- Worked at home: 1,450 (12.8%)

- Health care and social assistance (19%)
- Educational services (12%)
- Manufacturing (11%)
- Retail trade (9%)
- Other services, except public administration (5%)
- Accommodation and food services (5%)
- Finance and insurance (4%)
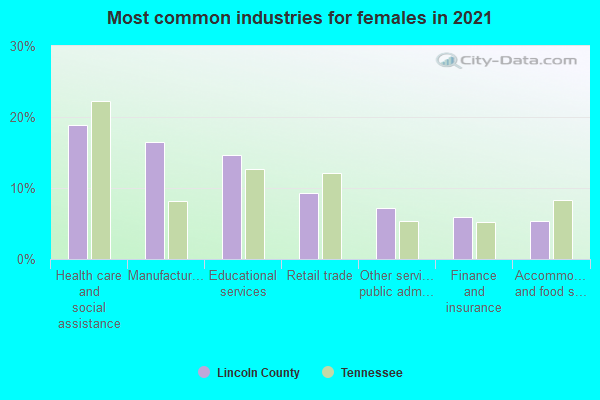
- Health care and social assistance (24%)
- Educational services (14%)
- Manufacturing (14%)
- Retail trade (11%)
- Other services, except public administration (6%)
- Accommodation and food services (6%)
- Finance and insurance (5%)
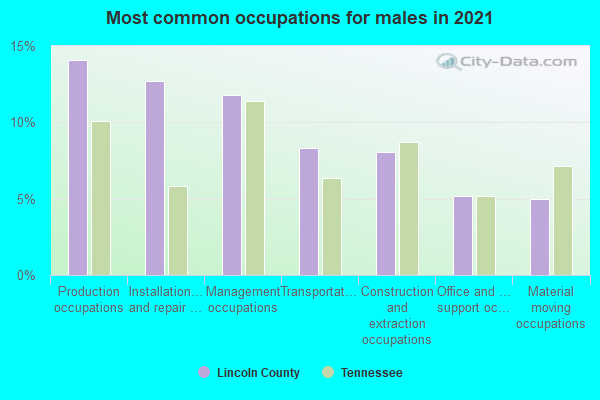
- Management occupations (13%)
- Installation, maintenance, and repair occupations (13%)
- Production occupations (13%)
- Transportation occupations (9%)
- Construction and extraction occupations (8%)
- Sales and related occupations (6%)
- Architecture and engineering occupations (5%)
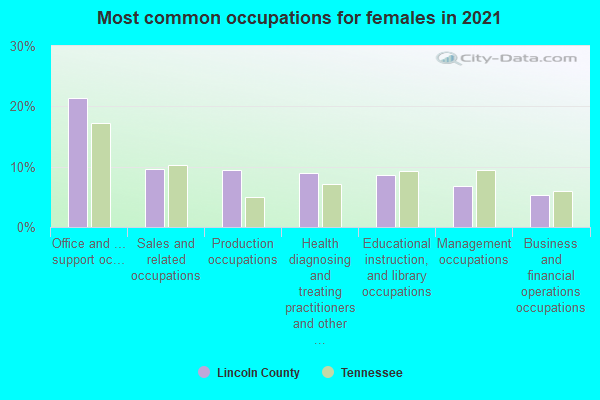
- Office and administrative support occupations (22%)
- Sales and related occupations (10%)
- Educational instruction, and library occupations (10%)
- Health diagnosing and treating practitioners and other technical occupations (9%)
- Production occupations (9%)
- Health technologists and technicians (8%)
- Management occupations (6%)
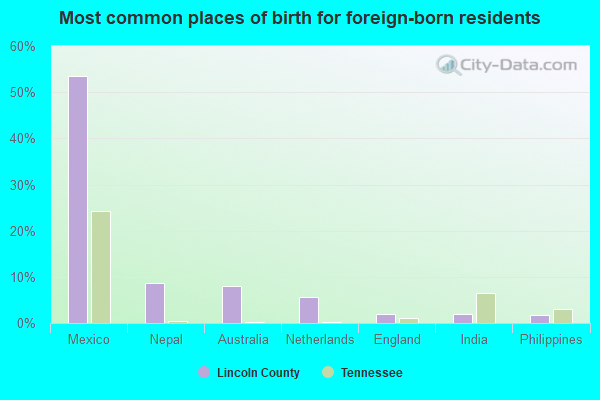
- Mexico (47%)
- Netherlands (15%)
- Australia (10%)
- India (3%)
- Philippines (3%)
- Germany (2%)
- Nepal (2%)
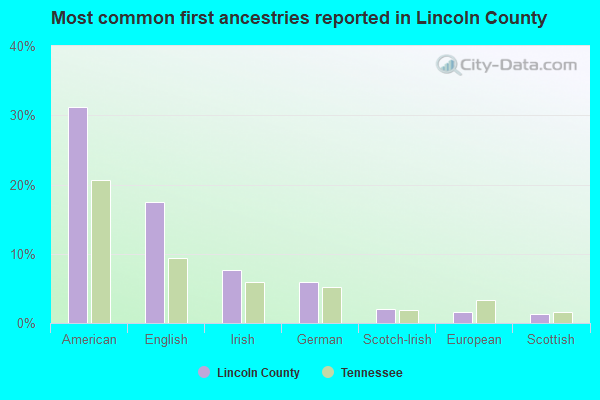
- American (37%)
- English (16%)
- Irish (8%)
- German (4%)
- Scotch-Irish (2%)
- Scottish (1%)
- European (1%)
People in group quarters in Lincoln County, Tennessee in 2010:
- 172 people in nursing facilities/skilled-nursing facilities
- 100 people in local jails and other municipal confinement facilities
- 11 people in workers' group living quarters and job corps centers
People in group quarters in Lincoln County, Tennessee in 2000:
- 293 people in nursing homes
- 79 people in local jails and other confinement facilities (including police lockups)
- 73 people in other noninstitutional group quarters
- 11 people in agriculture workers' dormitories on farms
- 6 people in homes for the mentally retarded
- 6 people in other nonhousehold living situations
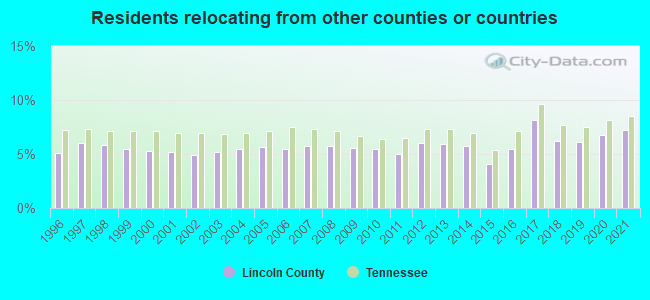
7.26% of this county's 2021 resident taxpayers lived in other counties in 2020 ($58,987 average adjusted gross income)
| Here: | 7.26% |
| Tennessee average: | 8.49% |
10 or fewer of this county's residents moved from foreign countries.
2.91% relocated from other counties in Tennessee ($18,577 average AGI)
4.35% relocated from other states ($40,412 average AGI)
Lincoln County: 4.35% Tennessee average: 4.34%
Top counties from which taxpayers relocated into this county between 2020 and 2021:
| from Madison County, AL | |
| from Franklin County, TN | |
| from Rutherford County, TN | |
| from Marshall County, TN | |
| from Bedford County, TN | |
| from Limestone County, AL | |
| from Coffee County, TN |
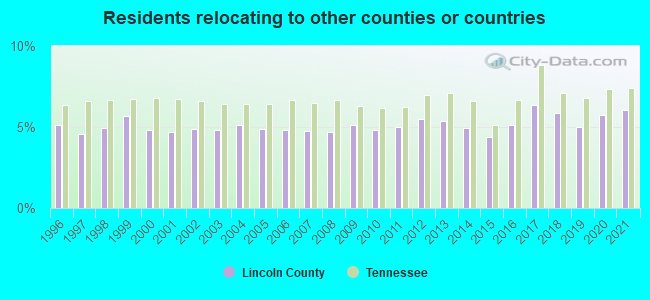
6.05% of this county's 2020 resident taxpayers moved to other counties in 2021 ($47,714 average adjusted gross income)
| Here: | 6.05% |
| Tennessee average: | 7.40% |
10 or fewer of this county's residents moved to foreign countries.
2.70% relocated to other counties in Tennessee ($16,292 average AGI)
3.35% relocated to other states ($31,423 average AGI)
Lincoln County: 3.35% Tennessee average: 3.20%
Top counties to which taxpayers relocated from this county between 2020 and 2021:
| to Madison County, AL | |
| to Franklin County, TN | |
| to Marshall County, TN | |
| to Limestone County, AL | |
| to Giles County, TN | |
| to Bedford County, TN | |
| to Rutherford County, TN |
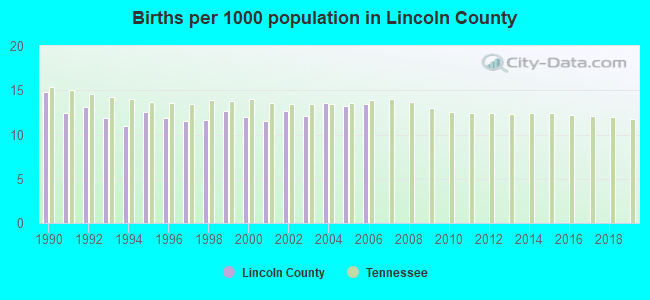
Births per 1000 population from 1990 to 1999: 12.3
Births per 1000 population from 2000 to 2006: 12.7
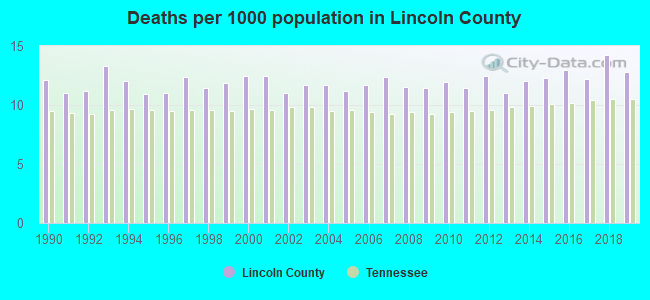
Deaths per 1000 population from 1990 to 1999: 11.7
Deaths per 1000 population from 2000 to 2009: 11.8
Deaths per 1000 population from 2010 to 2020: 12.6
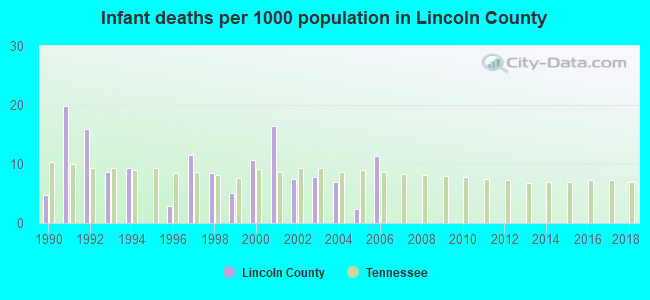
Infant deaths per 1000 live births from 1990 to 1999: 8.7
Infant deaths per 1000 live births from 2000 to 2006: 9.0
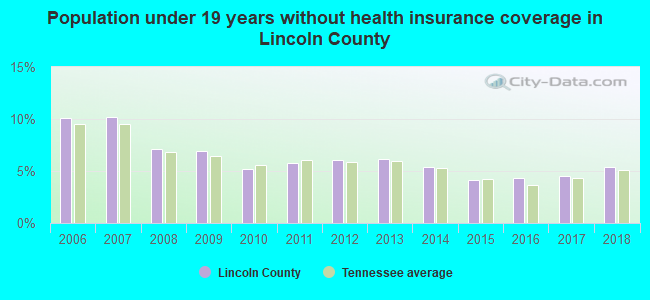
Persons under 19 years old without health insurance coverage in 2018: 5.4%
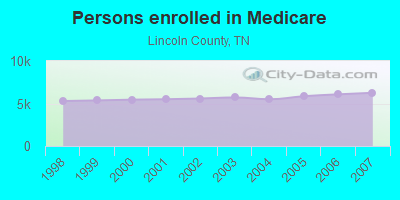
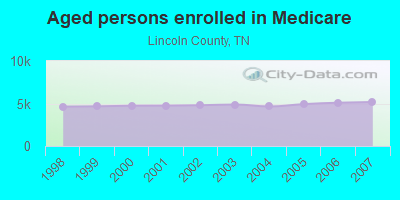
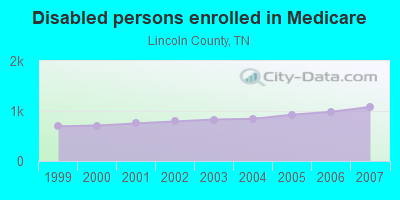
Persons enrolled in hospital insurance and/or supplemental medical insurance (Medicare) in July 1, 2007: 6,259 (5,175 aged, 1,084 disabled)
Children under 18 without health insurance coverage in 2007: 701 (9%)
Most common underlying causes of death in Lincoln County, Tennessee in 1999 - 2019:
- Acute myocardial infarction, unspecified (1,219)
- Bronchus or lung, unspecified - Malignant neoplasms (552)
- Alzheimer disease, unspecified (378)
- Atherosclerotic heart disease (352)
- Stroke, not specified as haemorrhage or infarction (340)
- Chronic obstructive pulmonary disease, unspecified (238)
- Cardiac arrest, unspecified (160)
- Essential (primary) hypertension (54)
- Colon, unspecified - Malignant neoplasms (47)
- Pneumonia, unspecified (40)
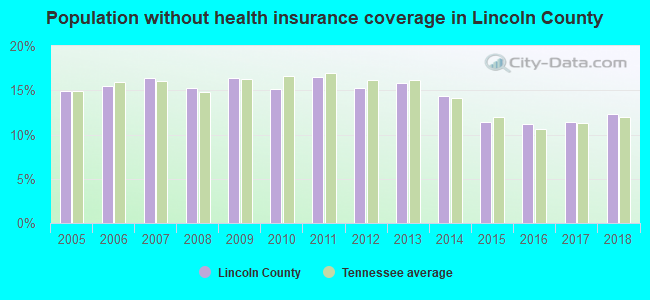
Population without health insurance coverage in 2000: 12%
Children under 18 without health insurance coverage in 2000: 6%
Short term general hospital admissions per 100,000 population in 2004: 8,173
Short term general hospital beds per 100,000 population in 2004: 1,017
Emergency room visits per 100,000 population in 2004: 47,926
General practice office based MDs per 100,000 population in 2005: 1,429
Medical specialist MDs per 100,000 population in 2005: 1,182
Dentists per 100,000 population in 1998: 9
Total births per 100,000 population, July 2005 - July 2006 : 24
Total deaths per 100,000 population, July 2005 - July 2006: 56
Limited-service eating places per 100,000 population in 2005 : 19
Suicides per 1,000,000 population from 2000 to 2006: 157.2. This is more than state average.
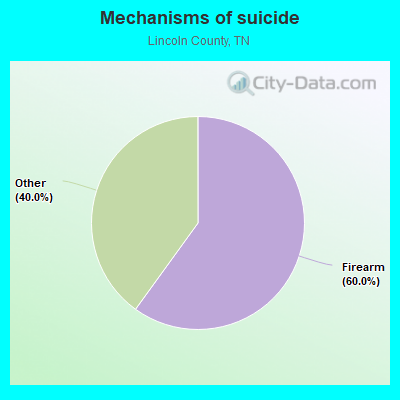
- Firearm - 94.3
- Other - 62.9
Household type by relationship:
Households: 36,016- Male householders: 7,277 (1,938 living alone), Female householders: 7,726 (2,449 living alone)
7,479 spouses (7,471 opposite-sex spouses), 632 unmarried partners, (570 opposite-sex unmarried partners), 9,273 children (8,720 natural, 133 adopted, 417 stepchildren), 1,142 grandchildren, 247 brothers or sisters, 593 parents, 25 foster children, 532 other relatives, 672 non-relatives
- In group quarters: 446
Size of family households: 4,859 2-persons, 2,525 3-persons, 1,523 4-persons, 773 5-persons, 254 6-persons, 132 7-or-more-persons.
Size of nonfamily households: 4,391 1-person, 482 2-persons, 14 3-persons, 8 4-persons, 20 5-persons.
4,384 married couples with children.
2,275 single-parent households (502 men, 1,773 women).
97.2% of residents of Lincoln speak English at home.
1.6% of residents speak Spanish at home (96% speak English very well, 2% speak English well, 2% speak English not well).
0.4% of residents speak other Indo-European language at home (68% speak English very well, 19% speak English well, 4% speak English not well, 9% don't speak English at all).
0.6% of residents speak Asian or Pacific Island language at home (46% speak English very well, 25% speak English well, 29% speak English not well).
In fiscal year 2004:
Federal Government expenditure: $202,453,000 ($6,299 per capita)
Department of Defense expenditure: $6,967,000
Federal direct payments to individuals for retirement and disability: $88,198,000
Federal other direct payments to individuals: $35,860,000
Federal direct payments not to individuals: $2,516,000
Federal grants: $70,652,000
Federal procurement contracts: $1,103,000 ($66,000 Department of Defense)
Federal salaries and wages: $4,125,000 ($410,000 Department of Defense)
Federal Government direct loans: $1,152,000
Federal guaranteed/insured loans: $8,849,000
Federal Government insurance: $13,769,000
Population change from April 1, 2000 to July 1, 2005:
Births: 2,008| Here: | 62 per 1000 residents |
| State: | 69 per 1000 residents |
Deaths: 1,992
| Here: | 61 per 1000 residents |
| State: | 50 per 1000 residents |
Net international migration: +83
| Here: | +3 per 1000 residents |
| State: | +8 per 1000 residents |
Net internal migration: +993
| Here: | +31 per 1000 residents |
| State: | +18 per 1000 residents |
Total withdrawal of fresh water for public supply: 3.52 millions of gallons per day (63% from ground, 37% from surface)
| Here: | 6.2 |
| State: | 6.5 |
| Here: | 4.4 |
| State: | 4.4 |
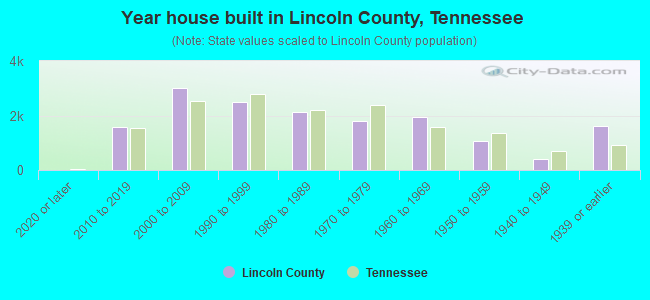
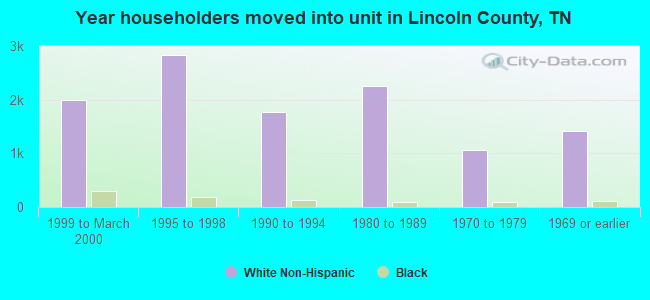
- Year house built in Lincoln County, Tennessee
- 222020 or later
- 1,5472010 to 2019
- 3,0692000 to 2009
- 2,3921990 to 1999
- 2,2031980 to 1989
- 1,7801970 to 1979
- 1,6751960 to 1969
- 1,2471950 to 1959
- 4901940 to 1949
- 1,6731939 or earlier
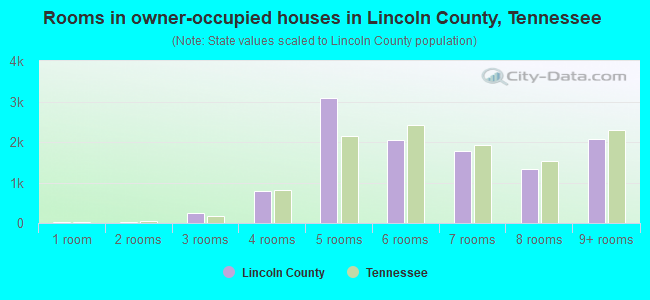
- Rooms in owner-occupied houses in Lincoln County, Tennessee
- 211 room
- 502 rooms
- 2193 rooms
- 9284 rooms
- 3,1155 rooms
- 1,9996 rooms
- 1,9247 rooms
- 1,2358 rooms
- 1,9749+ rooms

- Rooms in renter-occupied apartments in Lincoln County, Tennessee
- 391 room
- 1702 rooms
- 3503 rooms
- 1,2344 rooms
- 7505 rooms
- 3636 rooms
- 3867 rooms
- 878 rooms
- 1629+ rooms
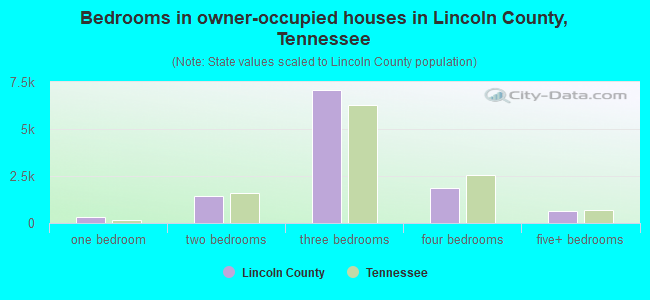
- Bedrooms in owner-occupied houses in Lincoln County, Tennessee
- 35no bedroom
- 2591 bedroom
- 1,5822 bedrooms
- 6,9733 bedrooms
- 1,9584 bedrooms
- 6605+ bedrooms
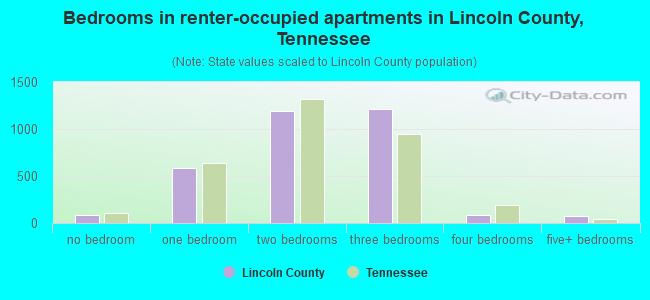
- Bedrooms in renter-occupied apartments in Lincoln County, Tennessee
- 40no bedroom
- 7011 bedroom
- 1,3352 bedrooms
- 1,2193 bedrooms
- 1304 bedrooms
- 885+ bedrooms
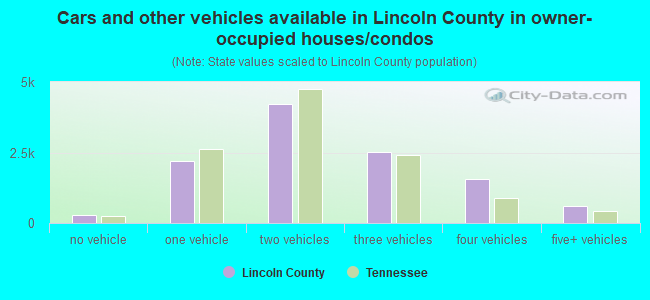
- Cars and other vehicles available in Lincoln County in owner-occupied houses/condos
- 202no vehicle
- 2,3841 vehicle
- 4,2882 vehicles
- 2,4963 vehicles
- 1,4504 vehicles
- 6315+ vehicles
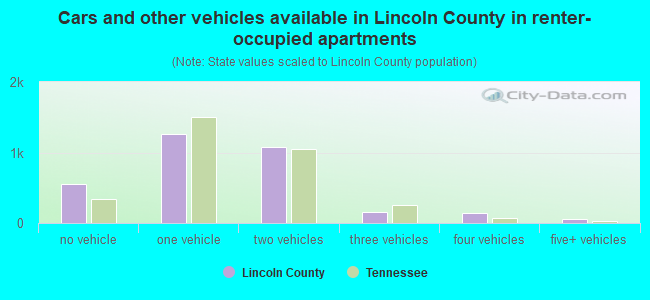
- Cars and other vehicles available in Lincoln County in renter-occupied apartments
- 451no vehicle
- 1,6081 vehicle
- 1,1722 vehicles
- 1253 vehicles
- 774 vehicles
- 945+ vehicles
90.5% of Lincoln County residents lived in the same house 1 years ago.
Out of people who lived in different houses, 32% lived in this county.
Out of people who lived in different counties, 63% lived in Tennessee.
| Lincoln County: | 90.5% |
| State average: | 87.0% |
Place of birth for U.S.-born residents:
- This state: 18,397
- Other state: 16,336
- Northeast: 832
- Midwest: 2,565
- South: 11,941
- West: 895
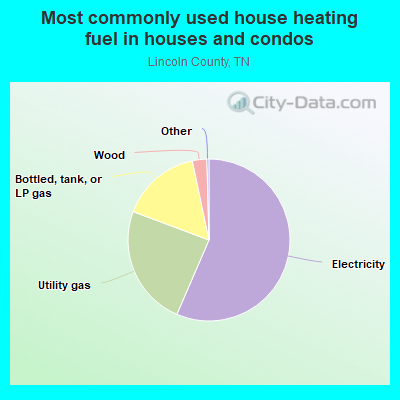
- 54.3%Electricity
- 25.9%Utility gas
- 17.0%Bottled, tank, or LP gas
- 2.6%Wood
- 0.2%Other fuel
- 0.1%No fuel used
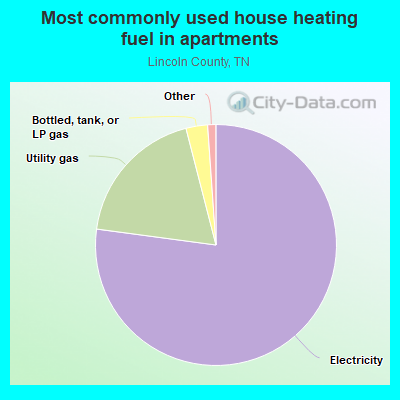
- 78.4%Electricity
- 16.9%Utility gas
- 3.2%Bottled, tank, or LP gas
- 0.7%No fuel used
- 0.4%Other fuel
- 0.3%Wood
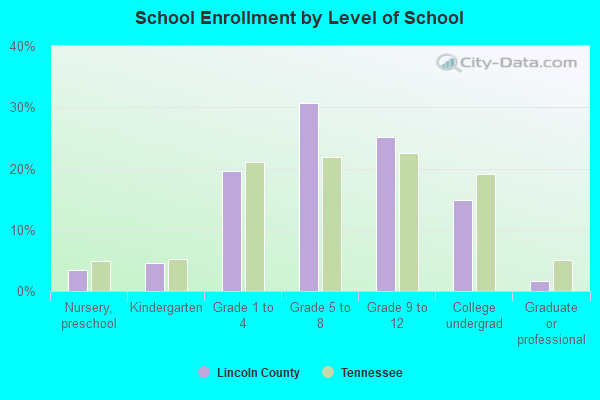
Private vs. public school enrollment:
| Here: | 9.4% |
| Tennessee: | 15.0% |
| Here: | 7.9% |
| Tennessee: | 16.2% |
| Here: | 7.7% |
| Tennessee: | 23.5% |


Lincoln County government finances - Expenditure in 2020:
- Bond Funds - Cash and Securities: $12,917,000
- Charges - Sewerage: $3,281,000
Other: $2,484,000
Sewerage: $2,260,000
Other: $990,000
Elementary and Secondary Education School Lunch: $573,000
Elementary and Secondary Education School Lunch: $400,000
Elementary and Secondary Education School Tuition and Transportation: $328,000
Elementary and Secondary Education School Tuition and Transportation: $239,000
Parks and Recreation: $157,000
Parks and Recreation: $117,000
Solid Waste Management: $46,000
Elementary and Secondary Education - Other: $46,000
Elementary and Secondary Education - Other: $43,000
Solid Waste Management: $42,000
- Construction - Water Utilities: $2,558,000
Elementary and Secondary Education: $628,000
Local Fire Protection: $513,000
Police Protection: $498,000
Parks and Recreation: $367,000
Sewerage: $295,000
Sewerage: $256,000
Water Utilities: $252,000
Central Staff Services: $186,000
Housing and Community Development: $44,000
Elementary and Secondary Education: $5,000
- Current Operations - Elementary and Secondary Education: $33,336,000
Elementary and Secondary Education: $31,393,000
General - Other: $7,270,000
Health - Other: $6,337,000
Police Protection: $5,967,000
Local Fire Protection: $4,525,000
Public Welfare - Other: $4,140,000
Public Welfare - Other: $3,952,000
Police Protection: $3,136,000
General - Other: $2,945,000
Water Utilities: $2,773,000
Sewerage: $2,773,000
Local Fire Protection: $2,643,000
Judicial and Legal Services: $2,169,000
Judicial and Legal Services: $2,156,000
Sewerage: $2,140,000
Central Staff Services: $2,060,000
Financial Administration: $2,023,000
Water Utilities: $1,955,000
Parks and Recreation: $1,864,000
Parks and Recreation: $1,611,000
Financial Administration: $1,511,000
Housing and Community Development: $1,344,000
Solid Waste Management: $878,000
Health - Other: $847,000
Housing and Community Development: $793,000
Protective Inspection and Regulation - Other: $762,000
Central Staff Services: $742,000
Protective Inspection and Regulation - Other: $682,000
Libraries: $455,000
Correctional Institutions: $453,000
Libraries: $444,000
Correctional Institutions: $312,000
- Federal Intergovernmental - Other: $2,261,000
Education: $1,710,000
Public Welfare: $1,012,000
Housing and Community Development: $280,000
Education: $231,000
Public Welfare: $160,000
Other: $53,000
Highways: $39,000
Highways: $18,000
- General - Interest on Debt: $4,387,000
Interest on Debt: $2,327,000
- Intergovernmental to Local - Other - Elementary and Secondary Education: $372,000
Other - Elementary and Secondary Education: $255,000
- Local Intergovernmental - Education: $827,000
Education: $655,000
Health and Hospitals: $557,000
- Long Term Debt - Beginning Outstanding - Unspecified Public Purpose: $99,227,000
Outstanding Unspecified Public Purpose: $95,597,000
Beginning Outstanding - Unspecified Public Purpose: $93,417,000
Outstanding Unspecified Public Purpose: $92,555,000
Retired Unspecified Public Purpose: $3,630,000
Retired Unspecified Public Purpose: $1,802,000
Issue, Unspecified Public Purpose: $940,000
- Miscellaneous - General Revenue - Other: $4,723,000
Interest Earnings: $4,557,000
General Revenue - Other: $1,600,000
Interest Earnings: $513,000
Donations From Private Sources: $232,000
Rents: $232,000
Donations From Private Sources: $215,000
Fines and Forfeits: $193,000
Rents: $56,000
Fines and Forfeits: $46,000
Sale of Property: $19,000
Sale of Property: $8,000
- Other Capital Outlay - Elementary and Secondary Education: $919,000
Elementary and Secondary Education: $379,000
- Other Funds - Cash and Securities: $70,218,000
Cash and Securities: $65,379,000
- Revenue - Water Utilities: $5,018,000
Water Utilities: $2,903,000
- Sinking Funds - Cash and Securities: $18,480,000
- State Intergovernmental - Education: $9,293,000
Education: $9,252,000
General Local Government Support: $4,432,000
Other: $3,983,000
Health and Hospitals: $3,819,000
Other: $2,588,000
General Local Government Support: $1,754,000
Public Welfare: $546,000
Public Welfare: $417,000
- Tax - Property: $48,205,000
Property: $40,922,000
General Sales and Gross Receipts: $3,972,000
General Sales and Gross Receipts: $3,082,000
Documentary and Stock Transfer: $2,413,000
Documentary and Stock Transfer: $1,708,000
Other License: $1,326,000
Occupation and Business License - Other: $1,312,000
Occupation and Business License - Other: $1,041,000
Motor Vehicle License: $947,000
Public Utilities Sales: $514,000
Public Utilities Sales: $464,000
Other License: $191,000
Motor Vehicle License: $18,000
- Total Salaries and Wages: $20,280,000
: $19,150,000
- Water Utilities - Interest on Debt: $2,069,000
Lincoln County government finances - Revenue in 2020:
- Bond Funds - Cash and Securities: $12,917,000
- Charges - Sewerage: $3,281,000
Other: $2,484,000
Sewerage: $2,260,000
Other: $990,000
Elementary and Secondary Education School Lunch: $573,000
Elementary and Secondary Education School Lunch: $400,000
Elementary and Secondary Education School Tuition and Transportation: $328,000
Elementary and Secondary Education School Tuition and Transportation: $239,000
Parks and Recreation: $157,000
Parks and Recreation: $117,000
Solid Waste Management: $46,000
Elementary and Secondary Education - Other: $46,000
Elementary and Secondary Education - Other: $43,000
Solid Waste Management: $42,000
- Construction - Water Utilities: $2,558,000
Elementary and Secondary Education: $628,000
Local Fire Protection: $513,000
Police Protection: $498,000
Parks and Recreation: $367,000
Sewerage: $295,000
Sewerage: $256,000
Water Utilities: $252,000
Central Staff Services: $186,000
Housing and Community Development: $44,000
Elementary and Secondary Education: $5,000
- Current Operations - Elementary and Secondary Education: $33,336,000
Elementary and Secondary Education: $31,393,000
General - Other: $7,270,000
Health - Other: $6,337,000
Police Protection: $5,967,000
Local Fire Protection: $4,525,000
Public Welfare - Other: $4,140,000
Public Welfare - Other: $3,952,000
Police Protection: $3,136,000
General - Other: $2,945,000
Water Utilities: $2,773,000
Sewerage: $2,773,000
Local Fire Protection: $2,643,000
Judicial and Legal Services: $2,169,000
Judicial and Legal Services: $2,156,000
Sewerage: $2,140,000
Central Staff Services: $2,060,000
Financial Administration: $2,023,000
Water Utilities: $1,955,000
Parks and Recreation: $1,864,000
Parks and Recreation: $1,611,000
Financial Administration: $1,511,000
Housing and Community Development: $1,344,000
Solid Waste Management: $878,000
Health - Other: $847,000
Housing and Community Development: $793,000
Protective Inspection and Regulation - Other: $762,000
Central Staff Services: $742,000
Protective Inspection and Regulation - Other: $682,000
Libraries: $455,000
Correctional Institutions: $453,000
Libraries: $444,000
Correctional Institutions: $312,000
- Federal Intergovernmental - Other: $2,261,000
Education: $1,710,000
Public Welfare: $1,012,000
Housing and Community Development: $280,000
Education: $231,000
Public Welfare: $160,000
Other: $53,000
Highways: $39,000
Highways: $18,000
- General - Interest on Debt: $4,387,000
Interest on Debt: $2,327,000
- Intergovernmental to Local - Other - Elementary and Secondary Education: $372,000
Other - Elementary and Secondary Education: $255,000
- Local Intergovernmental - Education: $827,000
Education: $655,000
Health and Hospitals: $557,000
- Long Term Debt - Beginning Outstanding - Unspecified Public Purpose: $99,227,000
Outstanding Unspecified Public Purpose: $95,597,000
Beginning Outstanding - Unspecified Public Purpose: $93,417,000
Outstanding Unspecified Public Purpose: $92,555,000
Retired Unspecified Public Purpose: $3,630,000
Retired Unspecified Public Purpose: $1,802,000
Issue, Unspecified Public Purpose: $940,000
- Miscellaneous - General Revenue - Other: $4,723,000
Interest Earnings: $4,557,000
General Revenue - Other: $1,600,000
Interest Earnings: $513,000
Donations From Private Sources: $232,000
Rents: $232,000
Donations From Private Sources: $215,000
Fines and Forfeits: $193,000
Rents: $56,000
Fines and Forfeits: $46,000
Sale of Property: $19,000
Sale of Property: $8,000
- Other Capital Outlay - Elementary and Secondary Education: $919,000
Elementary and Secondary Education: $379,000
- Other Funds - Cash and Securities: $70,218,000
Cash and Securities: $65,379,000
- Revenue - Water Utilities: $5,018,000
Water Utilities: $2,903,000
- Sinking Funds - Cash and Securities: $18,480,000
- State Intergovernmental - Education: $9,293,000
Education: $9,252,000
General Local Government Support: $4,432,000
Other: $3,983,000
Health and Hospitals: $3,819,000
Other: $2,588,000
General Local Government Support: $1,754,000
Public Welfare: $546,000
Public Welfare: $417,000
- Tax - Property: $48,205,000
Property: $40,922,000
General Sales and Gross Receipts: $3,972,000
General Sales and Gross Receipts: $3,082,000
Documentary and Stock Transfer: $2,413,000
Documentary and Stock Transfer: $1,708,000
Other License: $1,326,000
Occupation and Business License - Other: $1,312,000
Occupation and Business License - Other: $1,041,000
Motor Vehicle License: $947,000
Public Utilities Sales: $514,000
Public Utilities Sales: $464,000
Other License: $191,000
Motor Vehicle License: $18,000
- Total Salaries and Wages: $20,280,000
: $19,150,000
- Water Utilities - Interest on Debt: $2,069,000
Lincoln County government finances - Debt in 2020:
- Bond Funds - Cash and Securities: $12,917,000
- Charges - Sewerage: $3,281,000
Other: $2,484,000
Sewerage: $2,260,000
Other: $990,000
Elementary and Secondary Education School Lunch: $573,000
Elementary and Secondary Education School Lunch: $400,000
Elementary and Secondary Education School Tuition and Transportation: $328,000
Elementary and Secondary Education School Tuition and Transportation: $239,000
Parks and Recreation: $157,000
Parks and Recreation: $117,000
Solid Waste Management: $46,000
Elementary and Secondary Education - Other: $46,000
Elementary and Secondary Education - Other: $43,000
Solid Waste Management: $42,000
- Construction - Water Utilities: $2,558,000
Elementary and Secondary Education: $628,000
Local Fire Protection: $513,000
Police Protection: $498,000
Parks and Recreation: $367,000
Sewerage: $295,000
Sewerage: $256,000
Water Utilities: $252,000
Central Staff Services: $186,000
Housing and Community Development: $44,000
Elementary and Secondary Education: $5,000
- Current Operations - Elementary and Secondary Education: $33,336,000
Elementary and Secondary Education: $31,393,000
General - Other: $7,270,000
Health - Other: $6,337,000
Police Protection: $5,967,000
Local Fire Protection: $4,525,000
Public Welfare - Other: $4,140,000
Public Welfare - Other: $3,952,000
Police Protection: $3,136,000
General - Other: $2,945,000
Water Utilities: $2,773,000
Sewerage: $2,773,000
Local Fire Protection: $2,643,000
Judicial and Legal Services: $2,169,000
Judicial and Legal Services: $2,156,000
Sewerage: $2,140,000
Central Staff Services: $2,060,000
Financial Administration: $2,023,000
Water Utilities: $1,955,000
Parks and Recreation: $1,864,000
Parks and Recreation: $1,611,000
Financial Administration: $1,511,000
Housing and Community Development: $1,344,000
Solid Waste Management: $878,000
Health - Other: $847,000
Housing and Community Development: $793,000
Protective Inspection and Regulation - Other: $762,000
Central Staff Services: $742,000
Protective Inspection and Regulation - Other: $682,000
Libraries: $455,000
Correctional Institutions: $453,000
Libraries: $444,000
Correctional Institutions: $312,000
- Federal Intergovernmental - Other: $2,261,000
Education: $1,710,000
Public Welfare: $1,012,000
Housing and Community Development: $280,000
Education: $231,000
Public Welfare: $160,000
Other: $53,000
Highways: $39,000
Highways: $18,000
- General - Interest on Debt: $4,387,000
Interest on Debt: $2,327,000
- Intergovernmental to Local - Other - Elementary and Secondary Education: $372,000
Other - Elementary and Secondary Education: $255,000
- Local Intergovernmental - Education: $827,000
Education: $655,000
Health and Hospitals: $557,000
- Long Term Debt - Beginning Outstanding - Unspecified Public Purpose: $99,227,000
Outstanding Unspecified Public Purpose: $95,597,000
Beginning Outstanding - Unspecified Public Purpose: $93,417,000
Outstanding Unspecified Public Purpose: $92,555,000
Retired Unspecified Public Purpose: $3,630,000
Retired Unspecified Public Purpose: $1,802,000
Issue, Unspecified Public Purpose: $940,000
- Miscellaneous - General Revenue - Other: $4,723,000
Interest Earnings: $4,557,000
General Revenue - Other: $1,600,000
Interest Earnings: $513,000
Donations From Private Sources: $232,000
Rents: $232,000
Donations From Private Sources: $215,000
Fines and Forfeits: $193,000
Rents: $56,000
Fines and Forfeits: $46,000
Sale of Property: $19,000
Sale of Property: $8,000
- Other Capital Outlay - Elementary and Secondary Education: $919,000
Elementary and Secondary Education: $379,000
- Other Funds - Cash and Securities: $70,218,000
Cash and Securities: $65,379,000
- Revenue - Water Utilities: $5,018,000
Water Utilities: $2,903,000
- Sinking Funds - Cash and Securities: $18,480,000
- State Intergovernmental - Education: $9,293,000
Education: $9,252,000
General Local Government Support: $4,432,000
Other: $3,983,000
Health and Hospitals: $3,819,000
Other: $2,588,000
General Local Government Support: $1,754,000
Public Welfare: $546,000
Public Welfare: $417,000
- Tax - Property: $48,205,000
Property: $40,922,000
General Sales and Gross Receipts: $3,972,000
General Sales and Gross Receipts: $3,082,000
Documentary and Stock Transfer: $2,413,000
Documentary and Stock Transfer: $1,708,000
Other License: $1,326,000
Occupation and Business License - Other: $1,312,000
Occupation and Business License - Other: $1,041,000
Motor Vehicle License: $947,000
Public Utilities Sales: $514,000
Public Utilities Sales: $464,000
Other License: $191,000
Motor Vehicle License: $18,000
- Total Salaries and Wages: $20,280,000
: $19,150,000
- Water Utilities - Interest on Debt: $2,069,000
Lincoln County government finances - Cash and Securities in 2020:
- Bond Funds - Cash and Securities: $12,917,000
- Charges - Sewerage: $3,281,000
Other: $2,484,000
Sewerage: $2,260,000
Other: $990,000
Elementary and Secondary Education School Lunch: $573,000
Elementary and Secondary Education School Lunch: $400,000
Elementary and Secondary Education School Tuition and Transportation: $328,000
Elementary and Secondary Education School Tuition and Transportation: $239,000
Parks and Recreation: $157,000
Parks and Recreation: $117,000
Solid Waste Management: $46,000
Elementary and Secondary Education - Other: $46,000
Elementary and Secondary Education - Other: $43,000
Solid Waste Management: $42,000
- Construction - Water Utilities: $2,558,000
Elementary and Secondary Education: $628,000
Local Fire Protection: $513,000
Police Protection: $498,000
Parks and Recreation: $367,000
Sewerage: $295,000
Sewerage: $256,000
Water Utilities: $252,000
Central Staff Services: $186,000
Housing and Community Development: $44,000
Elementary and Secondary Education: $5,000
- Current Operations - Elementary and Secondary Education: $33,336,000
Elementary and Secondary Education: $31,393,000
General - Other: $7,270,000
Health - Other: $6,337,000
Police Protection: $5,967,000
Local Fire Protection: $4,525,000
Public Welfare - Other: $4,140,000
Public Welfare - Other: $3,952,000
Police Protection: $3,136,000
General - Other: $2,945,000
Water Utilities: $2,773,000
Sewerage: $2,773,000
Local Fire Protection: $2,643,000
Judicial and Legal Services: $2,169,000
Judicial and Legal Services: $2,156,000
Sewerage: $2,140,000
Central Staff Services: $2,060,000
Financial Administration: $2,023,000
Water Utilities: $1,955,000
Parks and Recreation: $1,864,000
Parks and Recreation: $1,611,000
Financial Administration: $1,511,000
Housing and Community Development: $1,344,000
Solid Waste Management: $878,000
Health - Other: $847,000
Housing and Community Development: $793,000
Protective Inspection and Regulation - Other: $762,000
Central Staff Services: $742,000
Protective Inspection and Regulation - Other: $682,000
Libraries: $455,000
Correctional Institutions: $453,000
Libraries: $444,000
Correctional Institutions: $312,000
- Federal Intergovernmental - Other: $2,261,000
Education: $1,710,000
Public Welfare: $1,012,000
Housing and Community Development: $280,000
Education: $231,000
Public Welfare: $160,000
Other: $53,000
Highways: $39,000
Highways: $18,000
- General - Interest on Debt: $4,387,000
Interest on Debt: $2,327,000
- Intergovernmental to Local - Other - Elementary and Secondary Education: $372,000
Other - Elementary and Secondary Education: $255,000
- Local Intergovernmental - Education: $827,000
Education: $655,000
Health and Hospitals: $557,000
- Long Term Debt - Beginning Outstanding - Unspecified Public Purpose: $99,227,000
Outstanding Unspecified Public Purpose: $95,597,000
Beginning Outstanding - Unspecified Public Purpose: $93,417,000
Outstanding Unspecified Public Purpose: $92,555,000
Retired Unspecified Public Purpose: $3,630,000
Retired Unspecified Public Purpose: $1,802,000
Issue, Unspecified Public Purpose: $940,000
- Miscellaneous - General Revenue - Other: $4,723,000
Interest Earnings: $4,557,000
General Revenue - Other: $1,600,000
Interest Earnings: $513,000
Donations From Private Sources: $232,000
Rents: $232,000
Donations From Private Sources: $215,000
Fines and Forfeits: $193,000
Rents: $56,000
Fines and Forfeits: $46,000
Sale of Property: $19,000
Sale of Property: $8,000
- Other Capital Outlay - Elementary and Secondary Education: $919,000
Elementary and Secondary Education: $379,000
- Other Funds - Cash and Securities: $70,218,000
Cash and Securities: $65,379,000
- Revenue - Water Utilities: $5,018,000
Water Utilities: $2,903,000
- Sinking Funds - Cash and Securities: $18,480,000
- State Intergovernmental - Education: $9,293,000
Education: $9,252,000
General Local Government Support: $4,432,000
Other: $3,983,000
Health and Hospitals: $3,819,000
Other: $2,588,000
General Local Government Support: $1,754,000
Public Welfare: $546,000
Public Welfare: $417,000
- Tax - Property: $48,205,000
Property: $40,922,000
General Sales and Gross Receipts: $3,972,000
General Sales and Gross Receipts: $3,082,000
Documentary and Stock Transfer: $2,413,000
Documentary and Stock Transfer: $1,708,000
Other License: $1,326,000
Occupation and Business License - Other: $1,312,000
Occupation and Business License - Other: $1,041,000
Motor Vehicle License: $947,000
Public Utilities Sales: $514,000
Public Utilities Sales: $464,000
Other License: $191,000
Motor Vehicle License: $18,000
- Total Salaries and Wages: $20,280,000
: $19,150,000
- Water Utilities - Interest on Debt: $2,069,000
Supplemental Security Income (SSI) in 2006:
- Total number of recipients: 786
- Number of aged recipients: 135
- Number of blind and disabled recipients: 651
- Number of recipients under 18: 65
- Number of recipients between 18 and 64: 460
- Number of recipients older than 64: 261
- Number of recipients also receiving OASDI: 380
- Amount of payments (thousands of dollars): 293
| Most common first names in Lincoln County, TN among deceased individuals | ||
| Name | Count | Lived (average) |
|---|---|---|
| James | 337 | 73.4 years |
| Mary | 248 | 80.1 years |
| William | 248 | 73.0 years |
| John | 241 | 76.0 years |
| Robert | 187 | 71.4 years |
| Charles | 122 | 69.8 years |
| Annie | 101 | 80.4 years |
| Thomas | 99 | 73.9 years |
| George | 98 | 74.0 years |
| Willie | 95 | 77.8 years |
| Most common last names in Lincoln County, TN among deceased individuals | ||
| Last name | Count | Lived (average) |
|---|---|---|
| Smith | 195 | 79.0 years |
| Moore | 90 | 74.6 years |
| Thompson | 87 | 74.8 years |
| Brown | 84 | 75.4 years |
| Taylor | 64 | 77.6 years |
| Jones | 60 | 72.4 years |
| Mitchell | 57 | 74.8 years |
| Tucker | 56 | 74.1 years |
| Gray | 56 | 79.5 years |
| Williams | 54 | 73.1 years |
| Businesses in Lincoln County, TN | ||||
| Name | Count | Name | Count | |
|---|---|---|---|---|
| AT&T | 1 | McDonald's | 1 | |
| Advance Auto Parts | 1 | Nike | 3 | |
| Arby's | 1 | Pizza Hut | 1 | |
| AutoZone | 1 | SONIC Drive-In | 1 | |
| Best Western | 1 | Sears | 1 | |
| CVS | 1 | Subway | 1 | |
| Chevrolet | 1 | T-Mobile | 1 | |
| FedEx | 2 | Taco Bell | 1 | |
| H&R Block | 1 | Toyota | 1 | |
| Hardee's | 1 | True Value | 1 | |
| KFC | 1 | U-Haul | 3 | |
| La-Z-Boy | 1 | UPS | 1 | |
| Lane Furniture | 1 | Walgreens | 1 | |
| Little Caesars Pizza | 1 | Walmart | 1 | |
| Long John Silver's | 1 | |||