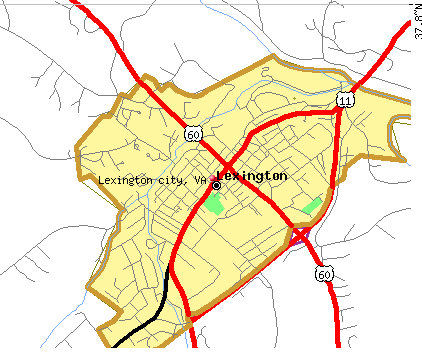
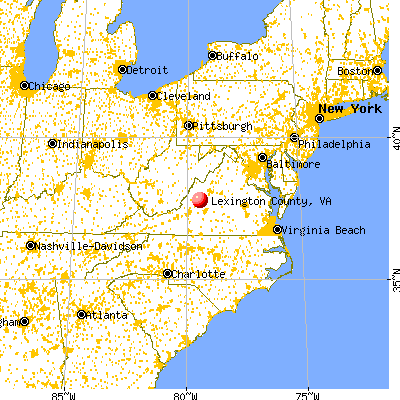
Lexington city, Virginia (VA)
County owner-occupied free and clear houses and condos in 2010: 494
County owner-occupied houses and condos in 2000: 1,232
Renter-occupied apartments: 1,071 (it was 1,000 in 2000)
| % of renters here: | 45% |
| State: | 33% |
Land area: 2 sq. mi.
Water area: 0.0 sq. mi.
Population density: 2966 people per square mile (very high).
Industries providing employment: Educational, health and social services (46.8%), Professional, scientific, management, administrative, and waste management services (15.8%), Arts, entertainment, recreation, accommodation and food services (10.0%).
Type of workers:
- Private wage or salary: 80%
- Government: 20%
- Self-employed, not incorporated: 1%
- Unpaid family work: 0%
- OSM Map
- General Map
- Google Map
- MSN Map

- 5,86479.6%White Non-Hispanic Alone
- 3985.4%Two or more races
- 3905.3%Hispanic or Latino
- 3785.1%Black Non-Hispanic Alone
- 2373.2%Asian alone
- 831.1%Some other race alone
- 180.2%American Indian and Alaska Native alone

| Median resident age: | 22.9 years |
| Virginia median age: | 39.0 years |
| Males: 4,315 | |
| Females: 3,081 |

 | Working in Lexington but living in Staunton: Good idea? (7 replies) |
| Lexington city: | 2.0 people |
| Virginia: | 3 people |
Estimated median household income in 2022: $92,174 ($28,982 in 1999)
| This county: | $92,174 |
| Virginia: | $85,873 |
Median contract rent in 2022 for apartments: $888 (lower quartile is $545, upper quartile is $1,152)
| This county: | $888 |
| State: | $1270 |
Estimated median house or condo value in 2022: $241,827 (it was $129,800 in 2000)
| Lexington city: | $241,827 |
| Virginia: | $365,700 |
Mean price in 2022:
Median monthly housing costs for homes and condos with a mortgage: $1,420Detached houses: $313,316
Here: $313,316 State: $472,865
Median monthly housing costs for units without a mortgage: $337
Institutionalized population: 52
Median real estate property taxes paid for housing units with mortgages in 2022: $2,647 (0.9%)
Median real estate property taxes paid for housing units with no mortgage in 2022: $1,549 (0.7%)


| Lexington city: | 17.6% |
| Virginia: | 10.6% |
Median age of residents in 2022: 22.9 years old
(Males: 22.1 years old, Females: 28.4 years old)
(Median age for: White residents: 22.6 years old, Black residents: 48.5 years old, American Indian residents: 22.4 years old, Asian residents: 22.6 years old, Hispanic or Latino residents: 21.3 years old)
Area name: Rockbridge County-Buena Vista city-Lexington city, VA HUD Nonmetro FMR Area
Fair market rent in 2006 for a 1-bedroom apartment in Lexington city is $434 a month.
Fair market rent for a 2-bedroom apartment is $483 a month.
Fair market rent for a 3-bedroom apartment is $703 a month.
Notable locations in this county outside city limits:
Notable locations in Lexington city: Narrows Police Department (A), Narrows Fire Department (B), Glen Lyn Police Department (C), Rich Creek Volunteer Fire Department (D). Display/hide their locations on the map
Churches in Lexington city include: Rural Retreat United Methodist Church (A), Rural Retreat Baptist Church (B). Display/hide their locations on the map
Cemetery: Frye Cemetery (1). Display/hide its location on the map
Neighboring counties: Accomack County  , Bollinger County, Missouri
  , Casey County, Kentucky , Mineral County, Colorado , Warrick County, Indiana , Nelson County, Kentucky .
| Here: | 3.9% |
| Virginia: | 2.7% |

Current college students: 2,876
People 25 years of age or older with a high school degree or higher: 96.2%
People 25 years of age or older with a bachelor's degree or higher: 60.2%
Number of foreign born residents: 342 (33.5% naturalized citizens)
| Lexington city: | 4.6% |
| Whole state: | 12.7% |

- Year of entry for the foreign-born population
- 2292010 or later
- 552000 to 2009
- 01990 to 1999
- 1221980 to 1989
- 91970 to 1979
- 38Before 1970
Mean travel time to work (commute): minutes
Percentage of county residents living and working in this county: 101.1%

Housing units in structures:
- One, detached: 1,658
- One, attached: 79
- Two: 291
- 3 or 4: 170
- 5 to 9: 209
- 10 to 19: 45
- 20 to 49: 83
- 50 or more: 19
Housing units in Lexington city with a mortgage: 552 (73 second mortgage, 0 home equity loan, 72 both second mortgage and home equity loan)
Houses without a mortgage: 51
| Here: | 91.5% with mortgage |
| State: | 97.2% with mortgage |
Food Environment Statistics:
| Lexington city: | 4.27 / 10,000 pop. |
| State: | 2.03 / 10,000 pop. |
| Lexington city: | 1.42 / 10,000 pop. |
| Virginia: | 4.03 / 10,000 pop. |
| This county: | 21.37 / 10,000 pop. |
| State: | 7.65 / 10,000 pop. |
| Lexington city: | 9.1% |
| Virginia: | 9.3% |
| Lexington city: | 26.8% |
| State: | 26.7% |
| Here: | 18.6% |
| State: | 18.6% |
Earthquake activity:
Lexington city-area historical earthquake activity is significantly above Virginia state average. It is 38% smaller than the overall U.S. average.On 8/23/2011 at 17:51:04, a magnitude 5.8 (5.8 MW, Depth: 3.7 mi, Class: Moderate, Intensity: VI - VII) earthquake occurred 82.9 miles away from Lexington city center
On 8/9/2020 at 12:07:37, a magnitude 5.1 (5.1 MW, Depth: 4.7 mi) earthquake occurred 128.2 miles away from the county center
On 12/9/2003 at 20:59:18, a magnitude 4.5 (4.5 ML, Depth: 6.2 mi, Class: Light, Intensity: IV - V) earthquake occurred 73.5 miles away from the county center
On 8/25/2011 at 05:07:52, a magnitude 4.5 (4.5 ML, Depth: 4.2 mi) earthquake occurred 81.5 miles away from the county center
On 12/9/2003 at 20:59:14, a magnitude 4.5 (4.5 MB, 4.5 LG) earthquake occurred 85.5 miles away from Lexington city center
On 7/27/1980 at 18:52:21, a magnitude 5.2 (5.1 MB, 4.7 MS, 5.0 UK, 5.2 UK) earthquake occurred 246.9 miles away from the county center
Magnitude types: regional Lg-wave magnitude (LG), body-wave magnitude (MB), local magnitude (ML), surface-wave magnitude (MS), moment magnitude (MW)

Means of transportation to work:
- Drove a car alone: 3,943 (67.4%)
- Carpooled: 436 (7.5%)
- Bus: 5 (0.1%)
- Taxicab, motorcycle, or other means: 72 (1.2%)
- Bicycle: 36 (0.6%)
- Walked: 803 (13.7%)
- Worked at home: 465 (8.0%)


- Educational services (30%)
- Health care and social assistance (21%)
- Professional, scientific, and technical services (12%)
- Retail trade (10%)
- Administrative and support and waste management services (8%)
- Other services, except public administration (6%)
- Accommodation and food services (5%)

- Educational services (29%)
- Health care and social assistance (20%)
- Professional, scientific, and technical services (11%)
- Retail trade (9%)
- Administrative and support and waste management services (8%)
- Other services, except public administration (6%)
- Accommodation and food services (5%)

- Educational instruction, and library occupations (17%)
- Health diagnosing and treating practitioners and other technical occupations (12%)
- Management occupations (12%)
- Food preparation and serving related occupations (7%)
- Architecture and engineering occupations (7%)
- Computer and mathematical occupations (6%)
- Arts, design, entertainment, sports, and media occupations (5%)

- Sales and related occupations (16%)
- Educational instruction, and library occupations (15%)
- Office and administrative support occupations (15%)
- Food preparation and serving related occupations (8%)
- Healthcare support occupations (7%)
- Management occupations (7%)
- Health technologists and technicians (6%)

- Japan (31%)
- Taiwan (17%)
- China, excluding Hong Kong and Taiwan (11%)
- England (9%)
- France (8%)
- Russia (5%)
- Belarus (5%)

- American (33%)
- Irish (13%)
- English (11%)
- German (10%)
- Scottish (2%)
- European (2%)
- Italian (2%)

People in group quarters in Lexington city, Virginia in 2010:
- 1,398 people in military barracks and dormitories (nondisciplinary)
- 1,112 people in college/university student housing
- 52 people in nursing facilities/skilled-nursing facilities
- 3 people in group homes intended for adults
- 2 people in other noninstitutional facilities
People in group quarters in Lexington city, Virginia in 2000:
- 2,118 people in college dormitories (includes college quarters off campus)
- 142 people in nursing homes
- 5 people in homes for the mentally retarded
- 3 people in other nonhousehold living situations
13.38% of this county's 2021 resident taxpayers lived in other counties in 2020 ($64,579 average adjusted gross income)
| Here: | 13.38% |
| Virginia average: | 10.16% |
10 or fewer of this county's residents moved from foreign countries.
8.16% relocated from other counties in Virginia ($37,965 average AGI)
5.21% relocated from other states ($26,614 average AGI)
Lexington city: 5.21% Virginia average: 3.91%

Top counties from which taxpayers relocated into this county between 2020 and 2021:
| from Rockbridge County, VA |
14.50% of this county's 2020 resident taxpayers moved to other counties in 2021 ($77,523 average adjusted gross income)
| Here: | 14.50% |
| Virginia average: | 10.20% |
10 or fewer of this county's residents moved to foreign countries.
9.20% relocated to other counties in Virginia ($57,602 average AGI)
5.30% relocated to other states ($19,921 average AGI)
Lexington city: 5.30% Virginia average: 3.98%

Top counties to which taxpayers relocated from this county between 2020 and 2021:
| to Rockbridge County, VA |
Births per 1000 population from 1990 to 1999: 9.4
Births per 1000 population from 2000 to 2006: 5.9

Deaths per 1000 population from 1990 to 1999: 10.6
Deaths per 1000 population from 2000 to 2009: 9.4
Deaths per 1000 population from 2010 to 2020: 10.7

Infant deaths per 1000 live births from 1990 to 1999: 5.1
Infant deaths per 1000 live births from 2000 to 2006: 6.0

Persons under 19 years old without health insurance coverage in 2018: 4.5%


Persons enrolled in hospital insurance and/or supplemental medical insurance (Medicare) in July 1, 2007: 1,465 (1,309 aged, 156 disabled)
Children under 18 without health insurance coverage in 2007: 48 (7%)


Most common underlying causes of death in Lexington city, Virginia in 1999 - 2019:
- Bronchus or lung, unspecified - Malignant neoplasms (13)
- Acute myocardial infarction, unspecified (12)
Population without health insurance coverage in 2000: 7%
Children under 18 without health insurance coverage in 2000: 4%
Short term general hospital admissions per 100,000 population in 2004: 26,657
Short term general hospital beds per 100,000 population in 2004: 651
Emergency room visits per 100,000 population in 2004: 158,263
General practice office based MDs per 100,000 population in 2005: 472
Medical specialist MDs per 100,000 population in 2005: 1,004
Dentists per 100,000 population in 1998: 30
Total births per 100,000 population, July 2005 - July 2006 : 122
Total deaths per 100,000 population, July 2005 - July 2006: 280
Limited-service eating places per 100,000 population in 2005 : 30
Household type by relationship:
Households: 7,396- Male householders: 851 (239 living alone), Female householders: 1,197 (580 living alone)
848 spouses (848 opposite-sex spouses), 275 unmarried partners, (275 opposite-sex unmarried partners), 658 children (660 natural, 0 adopted, 0 stepchildren), 36 grandchildren, 0 brothers or sisters, 19 parents, 0 foster children, 51 other relatives, 298 non-relatives
- In group quarters: 3,153
Size of family households: 530 2-persons, 216 3-persons, 106 4-persons, 75 5-persons.
Size of nonfamily households: 820 1-person, 216 2-persons, 74 3-persons, 11 6-persons.
389 married couples with children.
78 single-parent households (28 men, 50 women).
91.2% of residents of Lexington city speak English at home.
4.1% of residents speak Spanish at home (94% speak English very well, 6% speak English well).
1.9% of residents speak other Indo-European language at home (53% speak English very well, 47% speak English well).
2.5% of residents speak Asian or Pacific Island language at home (32% speak English very well, 68% speak English well).
In fiscal year 2004:
Federal Government expenditure: $71,427,000 ($10,337 per capita)
Department of Defense expenditure: $11,579,000
Federal direct payments to individuals for retirement and disability: $43,013,000
Federal other direct payments to individuals: $11,416,000
Federal direct payments not to individuals: $5,000
Federal grants: $8,437,000
Federal procurement contracts: $2,211,000 ($1,631,000 Department of Defense)
Federal salaries and wages: $6,346,000 ($3,650,000 Department of Defense)
Federal Government direct loans: $3,503,000
Federal guaranteed/insured loans: $2,226,000
Federal Government insurance: $1,184,000
Population change from April 1, 2000 to July 1, 2005:
Births: 222| Here: | 33 per 1000 residents |
| State: | 70 per 1000 residents |
Deaths: 359
| Here: | 53 per 1000 residents |
| State: | 40 per 1000 residents |
Net international migration: +68
| Here: | +10 per 1000 residents |
| State: | +18 per 1000 residents |
Net internal migration: -3
| Here: | |
| State: |

Total withdrawal of fresh water for public supply: 0.00 millions of gallons per day (all from surface)
| Here: | 6.3 |
| State: | 7.0 |
| Here: | 4.3 |
| State: | 4.3 |

- Year house built in Lexington city, Virginia
- 02020 or later
- 202010 to 2019
- 722000 to 2009
- 2221990 to 1999
- 1761980 to 1989
- 1041970 to 1979
- 5081960 to 1969
- 4301950 to 1959
- 1601940 to 1949
- 8091939 or earlier

- Rooms in owner-occupied houses in Lexington city, Virginia
- 01 room
- 02 rooms
- 03 rooms
- 264 rooms
- 3435 rooms
- 2076 rooms
- 1637 rooms
- 1508 rooms
- 1879+ rooms

- Rooms in renter-occupied apartments in Lexington city, Virginia
- 181 room
- 02 rooms
- 2483 rooms
- 2314 rooms
- 1695 rooms
- 866 rooms
- 1217 rooms
- 578 rooms
- 129+ rooms

- Bedrooms in owner-occupied houses in Lexington city, Virginia
- 0no bedroom
- 381 bedroom
- 4212 bedrooms
- 3403 bedrooms
- 1914 bedrooms
- 885+ bedrooms

- Bedrooms in renter-occupied apartments in Lexington city, Virginia
- 18no bedroom
- 3141 bedroom
- 3412 bedrooms
- 1653 bedrooms
- 1134 bedrooms
- 05+ bedrooms

- Cars and other vehicles available in Lexington city in owner-occupied houses/condos
- 19no vehicle
- 2151 vehicle
- 4322 vehicles
- 2483 vehicles
- 1674 vehicles
- 05+ vehicles

- Cars and other vehicles available in Lexington city in renter-occupied apartments
- 206no vehicle
- 4431 vehicle
- 2242 vehicles
- 603 vehicles
- 04 vehicles
- 225+ vehicles
82.7% of Lexington city residents lived in the same house 1 years ago.
Out of people who lived in different houses, 4% lived in this county.
Out of people who lived in different counties, 45% lived in Virginia.
| Lexington city: | 82.7% |
| State average: | 86.6% |
Place of birth for U.S.-born residents:
- This state: 2,664
- Other state: 4,143
- Northeast: 1,281
- Midwest: 792
- South: 1,449
- West: 624


- 78.2%Utility gas
- 19.5%Electricity
- 1.2%Bottled, tank, or LP gas
- 1.0%Wood

- 55.9%Electricity
- 44.1%Utility gas
Private vs. public school enrollment:
| Here: | 6.4% |
| Virginia: | 13.2% |
| Here: | 11.7% |
| Virginia: | 10.2% |
| Here: | 25.6% |
| Virginia: | 18.7% |


Supplemental Security Income (SSI) in 2004:
- Total number of recipients: 206
- Number of aged recipients: 25
- Number of blind and disabled recipients: 181
- Number of recipients under 18: 20
- Number of recipients between 18 and 64: 121
- Number of recipients older than 64: 65
- Number of recipients also receiving OASDI: 104
- Amount of payments (thousands of dollars): 75
| Most common first names in Lexington city, VA among deceased individuals | ||
| Name | Count | Lived (average) |
|---|---|---|
| Mary | 162 | 80.3 years |
| William | 159 | 74.6 years |
| James | 147 | 72.4 years |
| John | 133 | 72.7 years |
| Robert | 101 | 73.9 years |
| Charles | 95 | 74.3 years |
| Margaret | 68 | 80.7 years |
| Elizabeth | 57 | 81.9 years |
| George | 51 | 72.5 years |
| Ruth | 50 | 78.6 years |
| Most common last names in Lexington city, VA among deceased individuals | ||
| Last name | Count | Lived (average) |
|---|---|---|
| Smith | 84 | 75.9 years |
| Hostetter | 76 | 73.4 years |
| Clark | 69 | 72.9 years |
| Moore | 63 | 75.5 years |
| Miller | 42 | 78.1 years |
| Johnson | 40 | 76.6 years |
| Higgins | 38 | 70.9 years |
| Conner | 38 | 75.9 years |
| Sorrells | 35 | 73.7 years |
| Brown | 33 | 79.6 years |
Lexington city on our top lists:
- #48 on the list of "Top 101 counties with the highest percentage of residents relocating to other counties in 2011"
- #55 on the list of "Top 101 counties with the smallest number of children under 18 without health insurance coverage in 2000"