Grant County, Kentucky (KY)
County owner-occupied free and clear houses and condos in 2010: 1,775
County owner-occupied houses and condos in 2000: 6,060
Renter-occupied apartments: 2,449 (it was 2,115 in 2000)
| % of renters here: | 26% |
| State: | 31% |
Land area: 260 sq. mi.
Water area: 0.9 sq. mi.
Population density: 97 people per square mile (average).
Industries providing employment: Manufacturing (17.6%), Educational, health and social services (16.1%), Transportation and warehousing,and utilities (11.4%), Retail trade (10.1%).
Type of workers:
- Private wage or salary: 82%
- Government: 14%
- Self-employed, not incorporated: 4%
- Unpaid family work: 0%
- OSM Map
- General Map
- Google Map
- MSN Map

- 22,99691.2%White Non-Hispanic Alone
- 1,1324.5%Two or more races
- 8073.2%Hispanic or Latino
- 2120.8%Black Non-Hispanic Alone
- 310.1%Asian alone
- 230.09%Some other race alone
- 60.02%American Indian and Alaska Native alone

| Median resident age: | 36.8 years |
| Kentucky median age: | 39.4 years |
| Males: 12,710 | |
| Females: 12,427 |

 | Another hopeful transplant with questions (24 replies) |
| Why are people from northern kentucky considered yankees to the rest of the state (175 replies) |
| Worst Winter Storm in decades about to hit (68 replies) |
| WOOOHOOOO! Snow......snow, snow, snow!!! (49 replies) |
| KY Culture (18 replies) |
| Grant County Animal Shelter emergency (11 replies) |
| Grant County: | 2.0 people |
| Kentucky: | 2 people |
Estimated median household income in 2022: $64,545 ($38,438 in 1999)
| This county: | $64,545 |
| Kentucky: | $59,341 |
Median contract rent in 2022 for apartments: $591 (lower quartile is $498, upper quartile is $687)
| This county: | $591 |
| State: | $702 |
Estimated median house or condo value in 2022: $192,529 (it was $84,200 in 2000)
| Grant: | $192,529 |
| Kentucky: | $196,300 |
Mean price in 2022:
Median monthly housing costs for homes and condos with a mortgage: $1,328Detached houses: $258,059
Here: $258,059 State: $256,452 In 2-unit structures: $222,740
Here: $222,740 State: $211,203 Mobile homes: $97,361
Here: $97,361 State: $84,635
Median monthly housing costs for units without a mortgage: $464
Institutionalized population: 437
Crime in 2021 (reported by the sheriff's office or county police, not the county total):
- Murders: 0
- Rapes: 3
- Robberies: 2
- Assaults: 4
- Burglaries: 21
- Thefts: 54
- Auto thefts: 17
Crime in 2020 (reported by the sheriff's office or county police, not the county total):
- Murders: 0
- Rapes: 2
- Robberies: 0
- Assaults: 3
- Burglaries: 33
- Thefts: 91
- Auto thefts: 25
Health of residents in Grant County based on CDC Behavioral Risk Factor Surveillance System Survey Questionnaires from 2013 to 2021:
General health status score of residents in this county from 1 (poor) to 5 (excellent) is 3.4. This is about average.71.1% of residents exercised in the past month. This is about average.
44.4% of residents smoked 100+ cigarettes in their lives. This is about average.
51.4% of adult residents drank alcohol in the past 30 days. This is less than average.
67.6% of residents visited a dentist within the past year. This is about average.
Average weight of males is 202 pounds. This is more than average.
Average weight of females is 167 pounds. This is more than average.
Single-family new house construction building permits:
- 2022: 70 buildings, average cost: $267,300
- 2021: 88 buildings, average cost: $222,100
- 2020: 51 buildings, average cost: $597,300
- 2019: 59 buildings, average cost: $185,300
- 2018: 56 buildings, average cost: $235,400
- 2017: 52 buildings, average cost: $164,800
- 2016: 29 buildings, average cost: $180,500
- 2015: 38 buildings, average cost: $222,100
- 2014: 31 buildings, average cost: $203,900
- 2013: 19 buildings, average cost: $202,400
- 2012: 29 buildings, average cost: $144,100
- 2011: 24 buildings, average cost: $205,800
- 2010: 32 buildings, average cost: $184,100
- 2009: 31 buildings, average cost: $182,200
- 2008: 52 buildings, average cost: $138,400
- 2007: 90 buildings, average cost: $137,900
- 2006: 113 buildings, average cost: $134,300
- 2005: 148 buildings, average cost: $132,900
- 2004: 146 buildings, average cost: $123,800
- 2003: 115 buildings, average cost: $127,400
- 2002: 118 buildings, average cost: $116,900
- 2001: 117 buildings, average cost: $115,700
- 2000: 157 buildings, average cost: $107,100
- 1999: 157 buildings, average cost: $88,000
- 1998: 130 buildings, average cost: $85,400
- 1997: 135 buildings, average cost: $95,800


Median real estate property taxes paid for housing units with mortgages in 2022: $1,531 (0.7%)
Median real estate property taxes paid for housing units with no mortgage in 2022: $1,061 (0.6%)


| Grant County: | 13.1% |
| Kentucky: | 16.5% |
Median age of residents in 2022: 36.8 years old
(Males: 35.1 years old, Females: 37.6 years old)
(Median age for: White residents: 38.3 years old, Black residents: 23.6 years old, Asian residents: 36.2 years old, Hispanic or Latino residents: 19.0 years old, Other race residents: 20.9 years old)
Fair market rent in 2006 for a 1-bedroom apartment in Grant County is $478 a month.
Fair market rent for a 2-bedroom apartment is $608 a month.
Fair market rent for a 3-bedroom apartment is $748 a month.
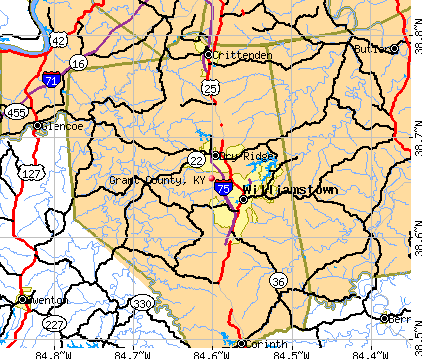
Cities in this county include: Williamstown, Crittenden, Dry Ridge, Corinth.
Neighboring counties: Washington County, Indiana  .
.
| Here: | 3.7% |
| Kentucky: | 3.8% |


Current college students: 503
People 25 years of age or older with a high school degree or higher: 88.9%
People 25 years of age or older with a bachelor's degree or higher: 15.7%
Number of foreign born residents: 174 (89.7% naturalized citizens)
| Grant County: | 0.7% |
| Whole state: | 4.0% |

- Year of entry for the foreign-born population
- 92010 or later
- 872000 to 2009
- 01990 to 1999
- 351980 to 1989
- 201970 to 1979
- 57Before 1970
Mean travel time to work (commute): minutes
Percentage of county residents living and working in this county: 92.5%
Housing units in structures:
- One, detached: 6,027
- One, attached: 233
- Two: 308
- 3 or 4: 412
- 5 to 9: 439
- 10 to 19: 207
- 20 to 49: 57
- 50 or more: 31
- Mobile homes: 2,465
Housing units in Grant County with a mortgage: 3,172 (372 second mortgage, 0 home equity loan, 286 both second mortgage and home equity loan)
Houses without a mortgage: 86
| Here: | 3.4% with mortgage |
| State: | 96.8% with mortgage |
Religion statistics for Grant County
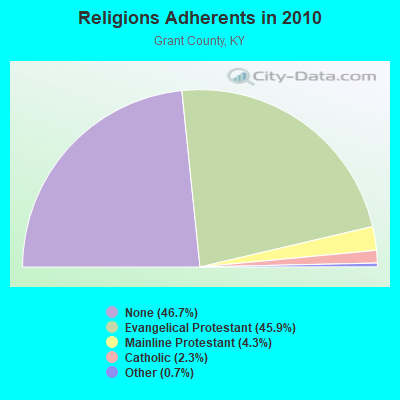
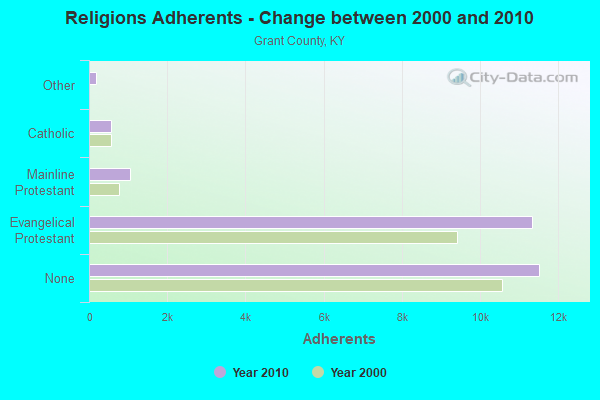
| Religion | Adherents | Congregations |
|---|---|---|
| Evangelical Protestant | 11,327 | 39 |
| Mainline Protestant | 1,055 | 7 |
| Catholic | 575 | 1 |
| Other | 180 | 2 |
| None | 11,525 | - |
Source: Clifford Grammich, Kirk Hadaway, Richard Houseal, Dale E.Jones, Alexei Krindatch, Richie Stanley and Richard H.Taylor. 2012. 2010 U.S.Religion Census: Religious Congregations & Membership Study. Association of Statisticians of American Religious Bodies. Jones, Dale E., et al. 2002. Congregations and Membership in the United States 2000. Nashville, TN: Glenmary Research Center.
Food Environment Statistics:
| Grant County: | 1.99 / 10,000 pop. |
| State: | 2.19 / 10,000 pop. |
| Here: | 0.40 / 10,000 pop. |
| Kentucky: | 0.25 / 10,000 pop. |
| This county: | 0.40 / 10,000 pop. |
| Kentucky: | 0.74 / 10,000 pop. |
| Grant County: | 7.15 / 10,000 pop. |
| Kentucky: | 4.36 / 10,000 pop. |
| This county: | 6.36 / 10,000 pop. |
| State: | 5.74 / 10,000 pop. |
| Grant County: | 9.3% |
| Kentucky: | 11.0% |
| Grant County: | 32.2% |
| State: | 30.0% |
| Here: | 11.8% |
| State: | 15.9% |
Agriculture in Grant County:
Average size of farms: 114 acresAverage value of agricultural products sold per farm: $12,940
Average value of crops sold per acre for harvested cropland: $217.97
The value of nursery, greenhouse, floriculture, and sod as a percentage of the total market value of agricultural products sold: 1.41%
The value of livestock, poultry, and their products as a percentage of the total market value of agricultural products sold: 58.19%
Average total farm production expenses per farm: $12,096
Harvested cropland as a percentage of land in farms: 21.74%
Irrigated harvested cropland as a percentage of land in farms: 1.30%
Average market value of all machinery and equipment per farm: $38,221
The percentage of farms operated by a family or individual: 94.02%
Average age of principal farm operators: 56 years
Average number of cattle and calves per 100 acres of all land in farms: 13.18
Milk cows as a percentage of all cattle and calves: 1.58%
Corn for grain: 153 harvested acres
All wheat for grain: 17 harvested acres
Vegetables: 25 harvested acres
Land in orchards: 15 acres
Earthquake activity:
Grant County-area historical earthquake activity is significantly above Kentucky state average. It is 62% greater than the overall U.S. average.On 7/27/1980 at 18:52:21, a magnitude 5.2 (5.1 MB, 4.7 MS, 5.0 UK, 5.2 UK, Class: Moderate, Intensity: VI - VII) earthquake occurred 47.5 miles away from Grant County center
On 4/18/2008 at 09:36:59, a magnitude 5.4 (5.1 MB, 4.8 MS, 5.4 MW, 5.2 MW) earthquake occurred 178.2 miles away from the county center
On 4/18/2008 at 09:36:59, a magnitude 5.2 (5.2 MW, Depth: 8.9 mi) earthquake occurred 178.2 miles away from the county center
On 9/7/1988 at 02:28:09, a magnitude 4.6 (4.5 MB, 4.6 LG, Class: Light, Intensity: IV - V) earthquake occurred 53.0 miles away from the county center
On 6/10/1987 at 23:48:54, a magnitude 5.1 (4.9 MB, 4.4 MS, 4.6 MS, 5.1 LG) earthquake occurred 177.5 miles away from Grant County center
On 6/18/2002 at 17:37:15, a magnitude 5.0 (4.3 MB, 4.6 MW, 5.0 LG) earthquake occurred 178.6 miles away from the county center
Magnitude types: regional Lg-wave magnitude (LG), body-wave magnitude (MB), surface-wave magnitude (MS), moment magnitude (MW)
Most recent natural disasters:
- Kentucky Covid-19 Pandemic, Incident Period: January 20, 2020, FEMA Id: 4497, Natural disaster type: Other
- Kentucky Severe Storms, Straight-line Winds, Flooding, Landslides, And Mudslides, Incident Period: February 6, 2019 - March 10, 2019, FEMA Id: 4428, Natural disaster type: Storm, Mudslide, Landslide, Flood, Wind
- Kentucky Severe Storms, Tornadoes, Flooding, Landslides, And Mudslides, Incident Period: February 21, 2018 - March 21, 2018, FEMA Id: 4361, Natural disaster type: Storm, Tornado, Mudslide, Landslide, Flood
- Kentucky Severe Winter Storm, Snowstorm, Flooding, Landslides, and Mudslides, Incident Period: March 03, 2015 to March 09, 2015, Major Disaster (Presidential) Declared DR-4218: May 12, 2015, FEMA Id: 4218, Natural disaster type: Snowstorm, Winter Storm, Mudslide, Landslide, Flood
- Kentucky Severe Storms, Tornadoes, Straight-line Winds, and Flooding, Incident Period: February 29, 2012 to March 03, 2012, Major Disaster (Presidential) Declared DR-4057: March 06, 2012, FEMA Id: 4057, Natural disaster type: Storm, Tornado, Flood, Wind
- Kentucky Severe Storms, Tornadoes, and Flooding, Incident Period: April 12, 2011 to May 20, 2011, Major Disaster (Presidential) Declared DR-1976: May 04, 2011, FEMA Id: 1976, Natural disaster type: Storm, Tornado, Flood
- Kentucky Severe Winter Storm, Incident Period: January 27, 2009 to February 05, 2009, Emergency Declared EM-3302: January 28, 2009, FEMA Id: 3302, Natural disaster type: Winter Storm
- Kentucky Severe Winter Storm and Flooding, Incident Period: January 26, 2009 to February 13, 2009, Major Disaster (Presidential) Declared DR-1818: February 05, 2009, FEMA Id: 1818, Natural disaster type: Winter Storm, Flood
- Kentucky Hurricane Katrina Evacuation, Incident Period: August 29, 2005 to October 01, 2005, Emergency Declared EM-3231: September 10, 2005, FEMA Id: 3231, Natural disaster type: Hurricane
- Kentucky Severe Winter Storm and Record Snow, Incident Period: December 21, 2004 to December 23, 2004, Major Disaster (Presidential) Declared DR-1578: February 08, 2005, FEMA Id: 1578, Natural disaster type: Winter Storm, Snow
- 3 other natural disasters have been reported since 1953.
The number of natural disasters in Grant County (13) is near the US average (15).
Major Disasters (Presidential) Declared: 8
Emergencies Declared: 2
Causes of natural disasters: Floods: 7, Storms: 5, Winter Storms: 5, Landslides: 3, Mudslides: 3, Tornadoes: 3, Winds: 2, Blizzard: 1, Hurricane: 1, Snow: 1, Snowstorm: 1, Other: 1 (Note: some incidents may be assigned to more than one category).

Means of transportation to work:
- Drove a car alone: 4,445 (70.5%)
- Carpooled: 794 (12.6%)
- Taxicab, motorcycle, or other means: 151 (2.4%)
- Walked: 278 (4.4%)
- Worked at home: 691 (11.0%)


- Educational services (12%)
- Health care and social assistance (10%)
- Transportation and warehousing (9%)
- Retail trade (9%)
- Manufacturing (9%)
- Finance and insurance (6%)
- Accommodation and food services (6%)

- Educational services (15%)
- Health care and social assistance (13%)
- Transportation and warehousing (11%)
- Retail trade (11%)
- Manufacturing (11%)
- Finance and insurance (7%)
- Accommodation and food services (7%)

- Production occupations (17%)
- Material moving occupations (14%)
- Management occupations (12%)
- Transportation occupations (10%)
- Construction and extraction occupations (8%)
- Installation, maintenance, and repair occupations (8%)
- Sales and related occupations (6%)

- Office and administrative support occupations (23%)
- Food preparation and serving related occupations (9%)
- Sales and related occupations (9%)
- Educational instruction, and library occupations (9%)
- Production occupations (9%)
- Health diagnosing and treating practitioners and other technical occupations (8%)
- Management occupations (7%)

- Canada (35%)
- Guatemala (19%)
- Mexico (15%)
- Scotland (6%)
- Netherlands (6%)
- Cambodia (6%)
- Thailand (4%)

- German (25%)
- American (22%)
- Irish (16%)
- English (15%)
- European (2%)
- French (except Basque) (1%)
- Scottish (1%)


People in group quarters in Grant County, Kentucky in 2010:
- 288 people in local jails and other municipal confinement facilities
- 149 people in nursing facilities/skilled-nursing facilities
- 20 people in other noninstitutional facilities
5 people in other noninstitutional group quarters
9.29% of this county's 2021 resident taxpayers lived in other counties in 2020 ($45,437 average adjusted gross income)
| Here: | 9.29% |
| Kentucky average: | 7.04% |
10 or fewer of this county's residents moved from foreign countries.
7.46% relocated from other counties in Kentucky ($36,224 average AGI)
1.83% relocated from other states ($9,213 average AGI)
Grant County: 1.83% Kentucky average: 2.87%

Top counties from which taxpayers relocated into this county between 2020 and 2021:
| from Boone County, KY | |
| from Kenton County, KY | |
| from Pendleton County, KY | |
| from Campbell County, KY | |
| from Gallatin County, KY | |
| from Scott County, KY | |
| from Owen County, KY |
8.65% of this county's 2020 resident taxpayers moved to other counties in 2021 ($44,071 average adjusted gross income)
| Here: | 8.65% |
| Kentucky average: | 6.89% |
10 or fewer of this county's residents moved to foreign countries.
7.09% relocated to other counties in Kentucky ($34,334 average AGI)
1.56% relocated to other states ($9,737 average AGI)
Grant County: 1.56% Kentucky average: 2.73%

Top counties to which taxpayers relocated from this county between 2020 and 2021:
| to Boone County, KY | |
| to Kenton County, KY | |
| to Pendleton County, KY | |
| to Campbell County, KY | |
| to Owen County, KY | |
| to Gallatin County, KY | |
| to Hamilton County, OH |
Births per 1000 population from 1990 to 1999: 16.3
Births per 1000 population from 2000 to 2006: 16.6

Deaths per 1000 population from 1990 to 1999: 8.6
Deaths per 1000 population from 2000 to 2009: 8.1
Deaths per 1000 population from 2010 to 2020: 9.6

Infant deaths per 1000 live births from 1990 to 1999: 7.9
Infant deaths per 1000 live births from 2000 to 2006: 6.2

Persons under 19 years old without health insurance coverage in 2018: 4.0%


Persons enrolled in hospital insurance and/or supplemental medical insurance (Medicare) in July 1, 2007: 3,537 (2,497 aged, 1,040 disabled)
Children under 18 without health insurance coverage in 2007: 699 (9%)


Most common underlying causes of death in Grant County, Kentucky in 1999 - 2019:
- Bronchus or lung, unspecified - Malignant neoplasms (332)
- Acute myocardial infarction, unspecified (269)
- Atherosclerotic heart disease (239)
- Chronic obstructive pulmonary disease, unspecified (189)
- Cardiac arrest, unspecified (104)
- Unspecified dementia (39)
- Hypertensive heart disease without (congestive) heart failure (36)
- Alzheimer disease, unspecified (21)
- Accidental poisoning by and exposure to narcotics and psychodysleptics [hallucinogens], not elsewhere classified (11)
- Accidental poisoning by and exposure to other and unspecified drugs, medicaments and biological substances (10)
Population without health insurance coverage in 2000: 13%
Children under 18 without health insurance coverage in 2000: 8%
Short term general hospital admissions per 100,000 population in 2004: 2,574
Short term general hospital beds per 100,000 population in 2004: 62
Emergency room visits per 100,000 population in 2004: 61,451
General practice office based MDs per 100,000 population in 2005: 1,499
Medical specialist MDs per 100,000 population in 2005: 614
Dentists per 100,000 population in 1998: 4
Total births per 100,000 population, July 2005 - July 2006 : 20
Total deaths per 100,000 population, July 2005 - July 2006: 89
Limited-service eating places per 100,000 population in 2005 : 8
Household type by relationship:
Households: 25,137- Male householders: 4,920 (1,274 living alone), Female householders: 4,505 (1,116 living alone)
4,795 spouses (4,757 opposite-sex spouses), 706 unmarried partners, (706 opposite-sex unmarried partners), 7,204 children (6,795 natural, 53 adopted, 360 stepchildren), 1,315 grandchildren, 174 brothers or sisters, 146 parents, 27 foster children, 301 other relatives, 636 non-relatives
- In group quarters: 312
Size of family households: 2,975 2-persons, 1,445 3-persons, 1,138 4-persons, 671 5-persons, 190 6-persons, 95 7-or-more-persons.
Size of nonfamily households: 2,389 1-person, 484 2-persons, 1 3-persons, 44 4-persons, 4 5-persons, 1 7-or-more-persons.
3,663 married couples with children.
1,612 single-parent households (470 men, 1,142 women).
98.7% of residents of Grant speak English at home.
0.8% of residents speak Spanish at home (100% speak English very well).
0.2% of residents speak other Indo-European language at home (100% speak English very well).
0.2% of residents speak Asian or Pacific Island language at home (33% speak English very well, 67% speak English well).
In fiscal year 2004:
Federal Government expenditure: $97,435,000 ($4,007 per capita)
Department of Defense expenditure: $1,552,000
Federal direct payments to individuals for retirement and disability: $51,337,000
Federal other direct payments to individuals: $20,138,000
Federal direct payments not to individuals: $313,000
Federal grants: $21,312,000
Federal procurement contracts: $1,085,000 ($323,000 Department of Defense)
Federal salaries and wages: $3,249,000 ($0,000 Department of Defense)
Federal Government direct loans: $2,701,000
Federal guaranteed/insured loans: $14,431,000
Federal Government insurance: $530,000
Population change from April 1, 2000 to July 1, 2005:
Births: 1,974| Here: | 80 per 1000 residents |
| State: | 69 per 1000 residents |
Deaths: 998
| Here: | 41 per 1000 residents |
| State: | 50 per 1000 residents |
Net international migration: +55
| Here: | +2 per 1000 residents |
| State: | +7 per 1000 residents |
Net internal migration: +1,222
| Here: | +50 per 1000 residents |
| State: | +8 per 1000 residents |

Total withdrawal of fresh water for public supply: 1.87 millions of gallons per day (all from surface)
| Here: | 6.2 |
| State: | 6.4 |
| Here: | 5.0 |
| State: | 4.4 |

- Year house built in Grant County, Kentucky
- 722020 or later
- 9942010 to 2019
- 2,0912000 to 2009
- 2,3531990 to 1999
- 1,3331980 to 1989
- 1,6121970 to 1979
- 5491960 to 1969
- 3101950 to 1959
- 1931940 to 1949
- 6621939 or earlier

- Rooms in owner-occupied houses in Grant County, Kentucky
- 51 room
- 232 rooms
- 1223 rooms
- 4704 rooms
- 1,4965 rooms
- 1,9056 rooms
- 1,0417 rooms
- 6198 rooms
- 1,1979+ rooms

- Rooms in renter-occupied apartments in Grant County, Kentucky
- 511 room
- 202 rooms
- 2173 rooms
- 6074 rooms
- 6975 rooms
- 6906 rooms
- 1067 rooms
- 638 rooms
- 949+ rooms

- Bedrooms in owner-occupied houses in Grant County, Kentucky
- 5no bedroom
- 1171 bedroom
- 1,2002 bedrooms
- 4,1153 bedrooms
- 1,1764 bedrooms
- 2805+ bedrooms

- Bedrooms in renter-occupied apartments in Grant County, Kentucky
- 53no bedroom
- 3351 bedroom
- 1,0812 bedrooms
- 8963 bedrooms
- 1754 bedrooms
- 05+ bedrooms

- Cars and other vehicles available in Grant County in owner-occupied houses/condos
- 159no vehicle
- 1,1811 vehicle
- 2,9702 vehicles
- 1,5783 vehicles
- 6754 vehicles
- 3045+ vehicles

- Cars and other vehicles available in Grant County in renter-occupied apartments
- 339no vehicle
- 1,3781 vehicle
- 6482 vehicles
- 2003 vehicles
- 94 vehicles
- 95+ vehicles
93.8% of Grant County residents lived in the same house 1 years ago.
Out of people who lived in different houses, 23% lived in this county.
Out of people who lived in different counties, 86% lived in Kentucky.
| Grant County: | 93.8% |
| State average: | 87.2% |
Place of birth for U.S.-born residents:
- This state: 18,053
- Other state: 6,619
- Northeast: 438
- Midwest: 3,979
- South: 1,328
- West: 879


- 54.5%Electricity
- 19.3%Bottled, tank, or LP gas
- 12.3%Utility gas
- 6.4%Wood
- 6.0%Fuel oil, kerosene, etc.
- 0.6%Other fuel
- 0.6%No fuel used
- 0.3%Solar energy

- 64.2%Electricity
- 17.9%Utility gas
- 10.8%Bottled, tank, or LP gas
- 4.2%Fuel oil, kerosene, etc.
- 1.5%Other fuel
- 1.3%Wood
Private vs. public school enrollment:
| Here: | 9.9% |
| Kentucky: | 17.2% |
| Here: | 14.6% |
| Kentucky: | 15.2% |
| Here: | 24.5% |
| Kentucky: | 19.6% |


Grant County government finances - Expenditure in 2017:
- Bond Funds - Cash and Securities: $384,000
- Charges - Other: $114,000
Parks and Recreation: $2,000
- Construction - Central Staff Services: $518,000
Regular Highways: $102,000
- Current Operations - Correctional Institutions: $2,481,000
General - Other: $2,180,000
Police Protection: $1,141,000
Regular Highways: $691,000
Central Staff Services: $373,000
Judicial and Legal Services: $246,000
Health - Other: $231,000
Financial Administration: $148,000
Parks and Recreation: $130,000
Solid Waste Management: $126,000
General Public Buildings: $98,000
Protective Inspection and Regulation - Other: $87,000
Local Fire Protection: $61,000
Public Welfare - Other: $5,000
Natural Resources - Other: $2,000
- Federal Intergovernmental - Health and Hospitals: $3,000
- General - Interest on Debt: $2,000
- Intergovernmental to Local - Other - Parks and Recreation: $181,000
Other - General - Other: $30,000
Other - Central Staff Services: $23,000
Other - Correctional Institutions: $1,000
- Local Intergovernmental - Other: $390,000
- Long Term Debt - Beginning Outstanding - Unspecified Public Purpose: $5,795,000
Outstanding Unspecified Public Purpose: $5,660,000
Beginning Outstanding - Public Debt for Private Purpose: $224,000
Outstanding Nonguaranteed - Industrial Revenue: $194,000
Retired Unspecified Public Purpose: $135,000
Retired Nonguaranteed - Public Debt for Private Purpose: $30,000
- Miscellaneous - General Revenue - Other: $762,000
Rents: $20,000
Interest Earnings: $6,000
Donations From Private Sources: $5,000
- Other Capital Outlay - Correctional Institutions: $485,000
General - Other: $124,000
Regular Highways: $83,000
Police Protection: $10,000
General Public Building: $10,000
Financial Administration: $1,000
- Other Funds - Cash and Securities: $399,000
- Sinking Funds - Cash and Securities: $194,000
- State Intergovernmental - Other: $3,096,000
Highways: $1,103,000
- Tax - Property: $1,947,000
Other Selective Sales: $187,000
Public Utilities Sales: $185,000
Other: $157,000
Documentary and Stock Transfer: $67,000
Other License: $59,000
Corporation License: $51,000
Individual Income: $16,000
- Total Salaries and Wages: $3,226,000
Grant County government finances - Revenue in 2017:
- Bond Funds - Cash and Securities: $384,000
- Charges - Other: $114,000
Parks and Recreation: $2,000
- Construction - Central Staff Services: $518,000
Regular Highways: $102,000
- Current Operations - Correctional Institutions: $2,481,000
General - Other: $2,180,000
Police Protection: $1,141,000
Regular Highways: $691,000
Central Staff Services: $373,000
Judicial and Legal Services: $246,000
Health - Other: $231,000
Financial Administration: $148,000
Parks and Recreation: $130,000
Solid Waste Management: $126,000
General Public Buildings: $98,000
Protective Inspection and Regulation - Other: $87,000
Local Fire Protection: $61,000
Public Welfare - Other: $5,000
Natural Resources - Other: $2,000
- Federal Intergovernmental - Health and Hospitals: $3,000
- General - Interest on Debt: $2,000
- Intergovernmental to Local - Other - Parks and Recreation: $181,000
Other - General - Other: $30,000
Other - Central Staff Services: $23,000
Other - Correctional Institutions: $1,000
- Local Intergovernmental - Other: $390,000
- Long Term Debt - Beginning Outstanding - Unspecified Public Purpose: $5,795,000
Outstanding Unspecified Public Purpose: $5,660,000
Beginning Outstanding - Public Debt for Private Purpose: $224,000
Outstanding Nonguaranteed - Industrial Revenue: $194,000
Retired Unspecified Public Purpose: $135,000
Retired Nonguaranteed - Public Debt for Private Purpose: $30,000
- Miscellaneous - General Revenue - Other: $762,000
Rents: $20,000
Interest Earnings: $6,000
Donations From Private Sources: $5,000
- Other Capital Outlay - Correctional Institutions: $485,000
General - Other: $124,000
Regular Highways: $83,000
Police Protection: $10,000
General Public Building: $10,000
Financial Administration: $1,000
- Other Funds - Cash and Securities: $399,000
- Sinking Funds - Cash and Securities: $194,000
- State Intergovernmental - Other: $3,096,000
Highways: $1,103,000
- Tax - Property: $1,947,000
Other Selective Sales: $187,000
Public Utilities Sales: $185,000
Other: $157,000
Documentary and Stock Transfer: $67,000
Other License: $59,000
Corporation License: $51,000
Individual Income: $16,000
- Total Salaries and Wages: $3,226,000
Grant County government finances - Debt in 2017:
- Bond Funds - Cash and Securities: $384,000
- Charges - Other: $114,000
Parks and Recreation: $2,000
- Construction - Central Staff Services: $518,000
Regular Highways: $102,000
- Current Operations - Correctional Institutions: $2,481,000
General - Other: $2,180,000
Police Protection: $1,141,000
Regular Highways: $691,000
Central Staff Services: $373,000
Judicial and Legal Services: $246,000
Health - Other: $231,000
Financial Administration: $148,000
Parks and Recreation: $130,000
Solid Waste Management: $126,000
General Public Buildings: $98,000
Protective Inspection and Regulation - Other: $87,000
Local Fire Protection: $61,000
Public Welfare - Other: $5,000
Natural Resources - Other: $2,000
- Federal Intergovernmental - Health and Hospitals: $3,000
- General - Interest on Debt: $2,000
- Intergovernmental to Local - Other - Parks and Recreation: $181,000
Other - General - Other: $30,000
Other - Central Staff Services: $23,000
Other - Correctional Institutions: $1,000
- Local Intergovernmental - Other: $390,000
- Long Term Debt - Beginning Outstanding - Unspecified Public Purpose: $5,795,000
Outstanding Unspecified Public Purpose: $5,660,000
Beginning Outstanding - Public Debt for Private Purpose: $224,000
Outstanding Nonguaranteed - Industrial Revenue: $194,000
Retired Unspecified Public Purpose: $135,000
Retired Nonguaranteed - Public Debt for Private Purpose: $30,000
- Miscellaneous - General Revenue - Other: $762,000
Rents: $20,000
Interest Earnings: $6,000
Donations From Private Sources: $5,000
- Other Capital Outlay - Correctional Institutions: $485,000
General - Other: $124,000
Regular Highways: $83,000
Police Protection: $10,000
General Public Building: $10,000
Financial Administration: $1,000
- Other Funds - Cash and Securities: $399,000
- Sinking Funds - Cash and Securities: $194,000
- State Intergovernmental - Other: $3,096,000
Highways: $1,103,000
- Tax - Property: $1,947,000
Other Selective Sales: $187,000
Public Utilities Sales: $185,000
Other: $157,000
Documentary and Stock Transfer: $67,000
Other License: $59,000
Corporation License: $51,000
Individual Income: $16,000
- Total Salaries and Wages: $3,226,000
Grant County government finances - Cash and Securities in 2017:
- Bond Funds - Cash and Securities: $384,000
- Charges - Other: $114,000
Parks and Recreation: $2,000
- Construction - Central Staff Services: $518,000
Regular Highways: $102,000
- Current Operations - Correctional Institutions: $2,481,000
General - Other: $2,180,000
Police Protection: $1,141,000
Regular Highways: $691,000
Central Staff Services: $373,000
Judicial and Legal Services: $246,000
Health - Other: $231,000
Financial Administration: $148,000
Parks and Recreation: $130,000
Solid Waste Management: $126,000
General Public Buildings: $98,000
Protective Inspection and Regulation - Other: $87,000
Local Fire Protection: $61,000
Public Welfare - Other: $5,000
Natural Resources - Other: $2,000
- Federal Intergovernmental - Health and Hospitals: $3,000
- General - Interest on Debt: $2,000
- Intergovernmental to Local - Other - Parks and Recreation: $181,000
Other - General - Other: $30,000
Other - Central Staff Services: $23,000
Other - Correctional Institutions: $1,000
- Local Intergovernmental - Other: $390,000
- Long Term Debt - Beginning Outstanding - Unspecified Public Purpose: $5,795,000
Outstanding Unspecified Public Purpose: $5,660,000
Beginning Outstanding - Public Debt for Private Purpose: $224,000
Outstanding Nonguaranteed - Industrial Revenue: $194,000
Retired Unspecified Public Purpose: $135,000
Retired Nonguaranteed - Public Debt for Private Purpose: $30,000
- Miscellaneous - General Revenue - Other: $762,000
Rents: $20,000
Interest Earnings: $6,000
Donations From Private Sources: $5,000
- Other Capital Outlay - Correctional Institutions: $485,000
General - Other: $124,000
Regular Highways: $83,000
Police Protection: $10,000
General Public Building: $10,000
Financial Administration: $1,000
- Other Funds - Cash and Securities: $399,000
- Sinking Funds - Cash and Securities: $194,000
- State Intergovernmental - Other: $3,096,000
Highways: $1,103,000
- Tax - Property: $1,947,000
Other Selective Sales: $187,000
Public Utilities Sales: $185,000
Other: $157,000
Documentary and Stock Transfer: $67,000
Other License: $59,000
Corporation License: $51,000
Individual Income: $16,000
- Total Salaries and Wages: $3,226,000
Supplemental Security Income (SSI) in 2006:
- Total number of recipients: 740
- Number of aged recipients: 47
- Number of blind and disabled recipients: 693
- Number of recipients under 18: 153
- Number of recipients between 18 and 64: 481
- Number of recipients older than 64: 106
- Number of recipients also receiving OASDI: 281
- Amount of payments (thousands of dollars): 321
| Most common first names in Grant County, KY among deceased individuals | ||
| Name | Count | Lived (average) |
|---|---|---|
| Mary | 109 | 78.8 years |
| William | 100 | 73.0 years |
| John | 98 | 74.8 years |
| Robert | 95 | 74.2 years |
| James | 91 | 71.2 years |
| Charles | 89 | 73.2 years |
| George | 46 | 75.6 years |
| Anna | 44 | 78.7 years |
| Harold | 40 | 71.6 years |
| Ruth | 37 | 80.5 years |
| Most common last names in Grant County, KY among deceased individuals | ||
| Last name | Count | Lived (average) |
|---|---|---|
| Webster | 54 | 72.7 years |
| Smith | 50 | 73.4 years |
| Kinman | 44 | 73.6 years |
| Jones | 41 | 77.7 years |
| Brown | 33 | 76.8 years |
| Simpson | 32 | 76.4 years |
| Caldwell | 32 | 74.0 years |
| Roland | 29 | 76.8 years |
| Jump | 29 | 70.7 years |
| Taylor | 28 | 70.6 years |
| Businesses in Grant County, KY | ||||
| Name | Count | Name | Count | |
|---|---|---|---|---|
| Advance Auto Parts | 1 | McDonald's | 2 | |
| Arby's | 1 | Microtel | 1 | |
| Blockbuster | 1 | Nike | 1 | |
| Burger King | 1 | Pizza Hut | 1 | |
| Chevrolet | 1 | RadioShack | 1 | |
| Comfort Inn | 1 | Rue21 | 1 | |
| Cracker Barrel | 1 | Subway | 4 | |
| Days Inn | 1 | Super 8 | 1 | |
| Decora Cabinetry | 4 | T-Mobile | 1 | |
| Domino's Pizza | 1 | Taco Bell | 1 | |
| FedEx | 1 | Toyota | 1 | |
| H&R Block | 3 | U-Haul | 2 | |
| Hilton | 1 | UPS | 3 | |
| KFC | 1 | Waffle House | 1 | |
| Long John Silver's | 1 | Walmart | 1 | |
| MasterBrand Cabinets | 7 | Wendy's | 2 | |