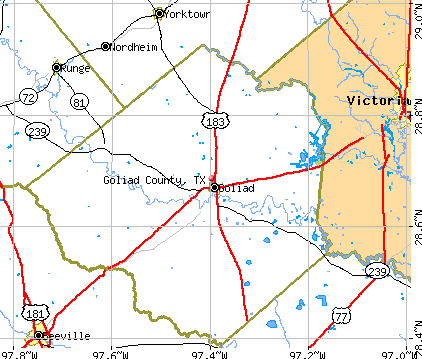
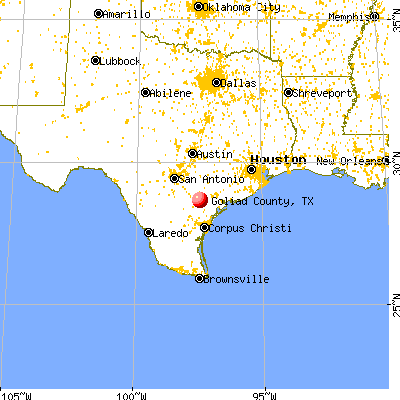
Goliad County, Texas (TX)
County owner-occupied free and clear houses and condos in 2010: 1,381
County owner-occupied houses and condos in 2000: 2,122
Renter-occupied apartments: 573 (it was 522 in 2000)
| % of renters here: | 20% |
| State: | 36% |
Land area: 854 sq. mi.
Water area: 5.8 sq. mi.
Population density: 9 people per square mile (low).
Industries providing employment: Educational, health and social services (23.8%), Construction (14.2%).
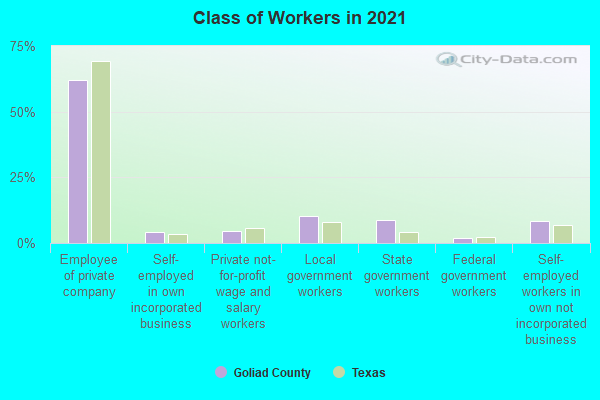
Type of workers:
- Private wage or salary: 71%
- Government: 20%
- Self-employed, not incorporated: 9%
- Unpaid family work: 0%
- OSM Map
- General Map
- Google Map
- MSN Map

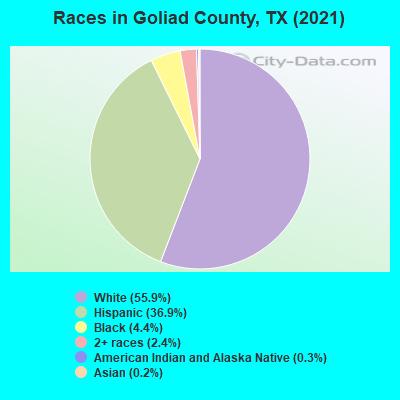
- 4,04856.2%White Non-Hispanic Alone
- 2,63136.5%Hispanic or Latino
- 3244.5%Black Non-Hispanic Alone
- 1672.3%Two or more races
- 210.3%American Indian and Alaska Native alone
- 100.1%Asian alone
| Median resident age: | 45.2 years |
| Texas median age: | 35.6 years |
| Males: 3,617 | |
| Females: 3,665 |

 | What do you think of Kerrville as a place to live? (34 replies) |
| New County Population Estimates from the Census Bureau for Jluy 1, 2016 posted this morning about 9 A. M. (13 replies) |
| i have a question for the mexican people in san antonio (7 replies) |
| Favorite Courthouses (11 replies) |
| San Antonio Off Topic Thread (11020 replies) |
| Retire to Woodville, Texas (23 replies) |
| Goliad County: | 2.0 people |
| Texas: | 3 people |
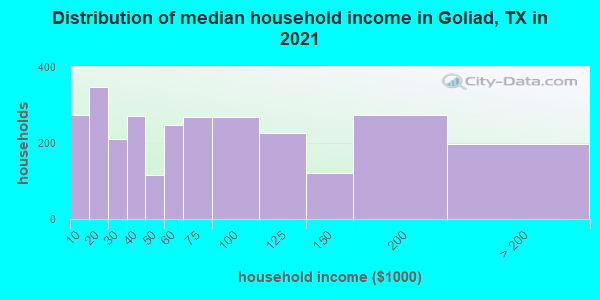
Estimated median household income in 2022: $57,527 ($34,201 in 1999)
| This county: | $57,527 |
| Texas: | $72,284 |
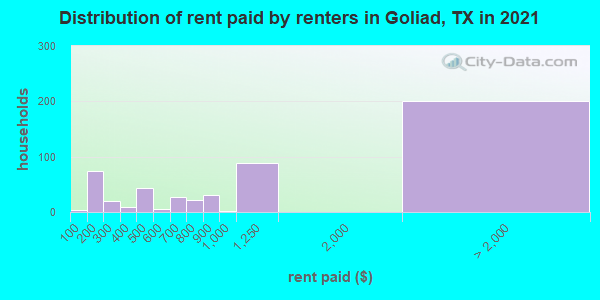
Median contract rent in 2022 for apartments: $646
| This county: | $646 |
| State: | $1117 |
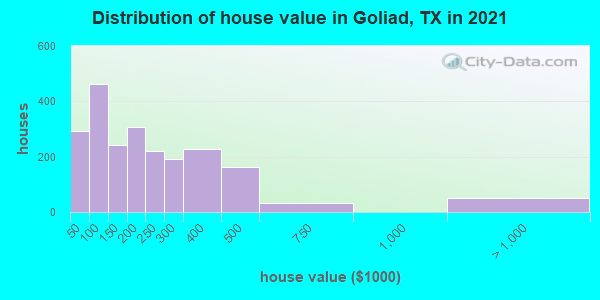
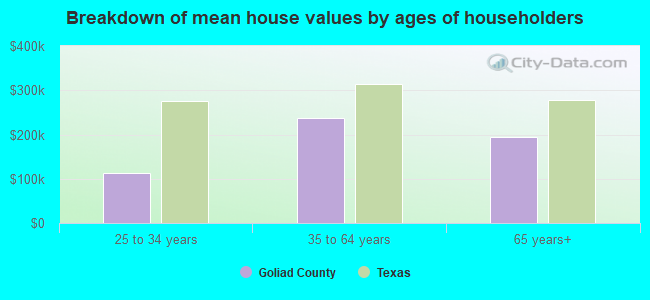
Estimated median house or condo value in 2022: $199,491 (it was $61,800 in 2000)
| Goliad: | $199,491 |
| Texas: | $275,400 |
Median monthly housing costs for homes and condos with a mortgage: $1,468
Median monthly housing costs for units without a mortgage: $472
Institutionalized population: 88
Crime in 2021 (reported by the sheriff's office or county police, not the county total):
- Murders: 0
- Rapes: 1
- Robberies: 3
- Assaults: 9
- Burglaries: 122
- Thefts: 46
- Auto thefts: 7
Crime in 2020 (reported by the sheriff's office or county police, not the county total):
- Murders: 0
- Rapes: 1
- Robberies: 1
- Assaults: 20
- Burglaries: 46
- Thefts: 42
- Auto thefts: 10
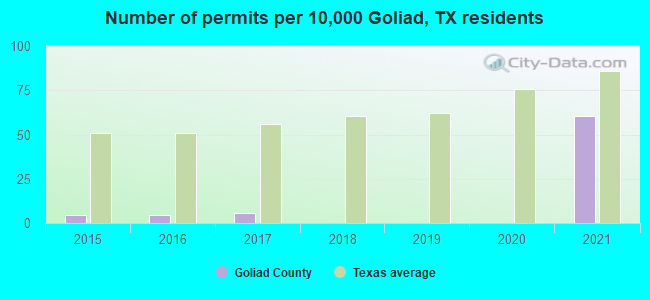
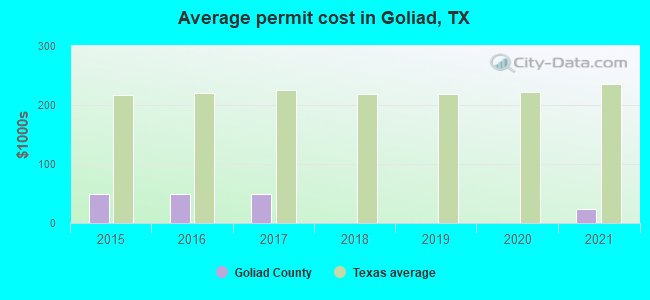
Single-family new house construction building permits:
- 2022: 2 buildings, average cost: $147,900
- 2021: 42 buildings, average cost: $24,100
- 2020: 0 buildings
- 2019: 0 buildings
- 2018: 0 buildings
- 2017: 4 buildings, average cost: $50,000
- 2016: 3 buildings, average cost: $50,000
- 2015: 3 buildings, average cost: $50,000
Median real estate property taxes paid for housing units with mortgages in 2022: $2,518 (1.0%)
Median real estate property taxes paid for housing units with no mortgage in 2022: $1,497 (0.9%)
| Goliad County: | 10.0% |
| Texas: | 14.0% |
Median age of residents in 2022: 45.2 years old
(Males: 42.0 years old, Females: 46.1 years old)
(Median age for: White residents: 51.8 years old, Black residents: 39.6 years old, Asian residents: 39.9 years old, Hispanic or Latino residents: 34.1 years old, Other race residents: 51.4 years old)
Area name: Victoria, TX HUD Metro FMR Area
Fair market rent in 2006 for a 1-bedroom apartment in Goliad County is $460 a month.
Fair market rent for a 2-bedroom apartment is $589 a month.
Fair market rent for a 3-bedroom apartment is $733 a month.
Cities in this county include: Goliad, Weesatche-Ander.
Neighboring counties: Seminole County, Florida  , DeWitt County
  , Live Oak County
  , Wilson County
  .
.
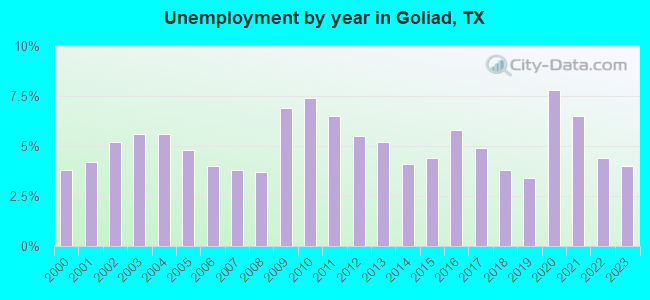
| Here: | 3.0% |
| Texas: | 3.5% |
Current college students: 159
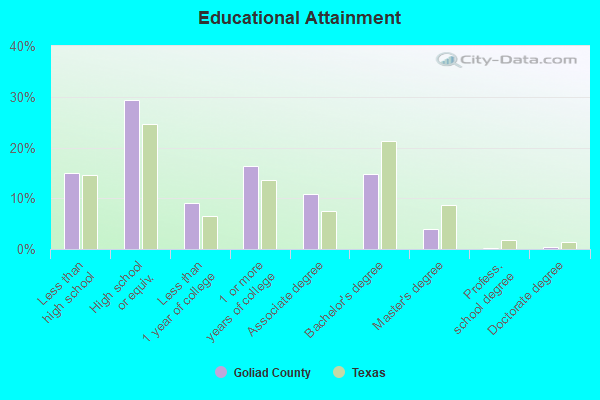
People 25 years of age or older with a high school degree or higher: 84.5%
People 25 years of age or older with a bachelor's degree or higher: 17.8%
Number of foreign born residents: 386 (33.6% naturalized citizens)
| Goliad County: | 5.3% |
| Whole state: | 17.2% |
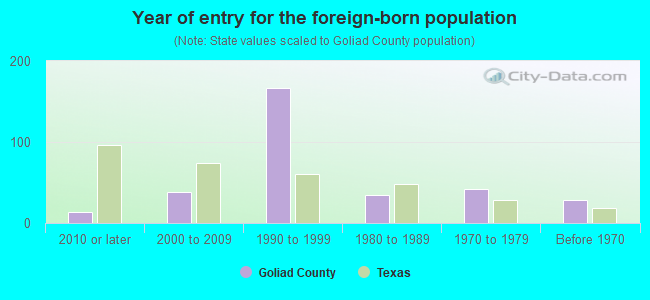
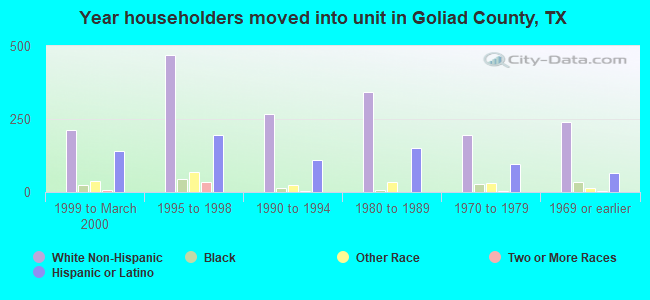
- Year of entry for the foreign-born population
- 202010 or later
- 242000 to 2009
- 1551990 to 1999
- 351980 to 1989
- 421970 to 1979
- 29Before 1970
Mean travel time to work (commute): minutes
Percentage of county residents living and working in this county: 100.1%
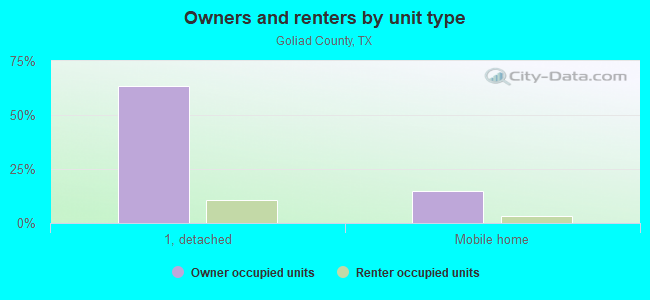
Housing units in structures:
- One, detached: 2,904
- One, attached: 16
- Two: 74
- 3 or 4: 50
- 5 to 9: 12
- 10 to 19: 21
- Mobile homes: 546
- Boats, RVs, vans, etc.: 13
Housing units in Goliad County with a mortgage: 735 (8 second mortgage, 0 home equity loan, 9 both second mortgage and home equity loan)
Houses without a mortgage: 15
| Here: | 98.0% with mortgage |
| State: | 98.4% with mortgage |
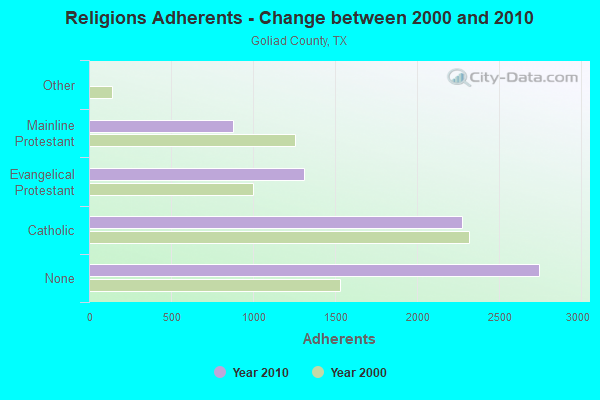
Religion statistics for Goliad County
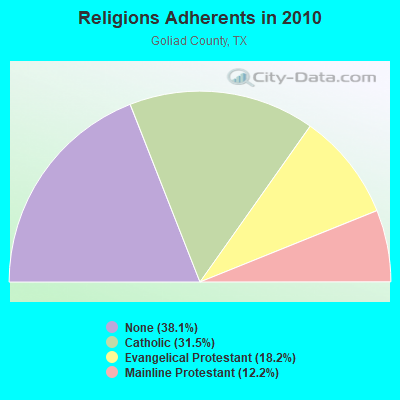
| Religion | Adherents | Congregations |
|---|---|---|
| Catholic | 2,271 | 3 |
| Evangelical Protestant | 1,312 | 10 |
| Mainline Protestant | 880 | 7 |
| Other | 3 | 1 |
| None | 2,744 | - |
Source: Clifford Grammich, Kirk Hadaway, Richard Houseal, Dale E.Jones, Alexei Krindatch, Richie Stanley and Richard H.Taylor. 2012. 2010 U.S.Religion Census: Religious Congregations & Membership Study. Association of Statisticians of American Religious Bodies. Jones, Dale E., et al. 2002. Congregations and Membership in the United States 2000. Nashville, TN: Glenmary Research Center.
Food Environment Statistics:
| Goliad County: | 1.41 / 10,000 pop. |
| State: | 1.47 / 10,000 pop. |
| Goliad County: | 7.04 / 10,000 pop. |
| Texas: | 3.95 / 10,000 pop. |
| This county: | 8.45 / 10,000 pop. |
| State: | 6.13 / 10,000 pop. |
| Goliad County: | 9.8% |
| Texas: | 8.9% |
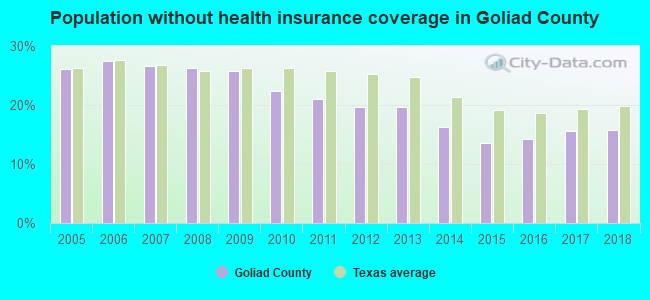
| Goliad County: | 25.9% |
| State: | 26.6% |
| Here: | 13.0% |
| State: | 15.7% |
Agriculture in Goliad County:
Average size of farms: 514 acresAverage value of agricultural products sold per farm: $17,209
Average value of crops sold per acre for harvested cropland: $64.19
The value of livestock, poultry, and their products as a percentage of the total market value of agricultural products sold: 89.83%
Average total farm production expenses per farm: $18,888
Harvested cropland as a percentage of land in farms: 5.30%
Irrigated harvested cropland as a percentage of land in farms: 2.42%
Average market value of all machinery and equipment per farm: $24,007
The percentage of farms operated by a family or individual: 93.09%
Average age of principal farm operators: 57 years
Average number of cattle and calves per 100 acres of all land in farms: 12.53
Corn for grain: 6469 harvested acres
Upland cotton: 1994 harvested acres
Vegetables: 12 harvested acres
Land in orchards: 40 acres
Earthquake activity:
Goliad County-area historical earthquake activity is significantly above Texas state average. It is 38% smaller than the overall U.S. average.On 10/20/2011 at 12:24:41, a magnitude 4.8 (4.8 MW, Depth: 3.1 mi, Class: Light, Intensity: IV - V) earthquake occurred 43.1 miles away from Goliad County center
On 4/9/1993 at 12:29:19, a magnitude 4.3 (4.1 MB, 4.3 LG, Depth: 3.1 mi) earthquake occurred 44.9 miles away from the county center
On 5/1/2018 at 16:28:56, a magnitude 4.0 (4.0 MW, Depth: 3.1 mi) earthquake occurred 40.8 miles away from the county center
On 4/14/1995 at 00:32:56, a magnitude 5.7 (5.6 MB, 5.7 MS, 5.7 MW, Depth: 11.1 mi, Class: Moderate, Intensity: VI - VII) earthquake occurred 375.9 miles away from the county center
On 4/7/2008 at 09:51:12, a magnitude 3.9 (3.9 MW, Depth: 3.1 mi, Class: Light, Intensity: II - III) earthquake occurred 41.9 miles away from Goliad County center
On 4/25/2010 at 02:10:42, a magnitude 3.9 (3.9 MB, Depth: 3.1 mi) earthquake occurred 72.9 miles away from the county center
Magnitude types: regional Lg-wave magnitude (LG), body-wave magnitude (MB), surface-wave magnitude (MS), moment magnitude (MW)
Most recent natural disasters:
- Texas Covid-19 Pandemic, Incident Period: January 20, 2020, FEMA Id: 4485, Natural disaster type: Other
- Texas Hurricane Harvey, Incident Period: August 23, 2017 - September 15, 2017, FEMA Id: 4332, Natural disaster type: Hurricane
- Texas Hurricane Ike, Incident Period: September 07, 2008 to September 26, 2008, Emergency Declared EM-3294: September 10, 2008, FEMA Id: 3294, Natural disaster type: Hurricane
- Texas Hurricane Gustav, Incident Period: August 27, 2008 to September 07, 2008, Emergency Declared EM-3290: August 29, 2008, FEMA Id: 3290, Natural disaster type: Hurricane
- Texas Hurricane Dean, Incident Period: August 17, 2007 to September 05, 2007, Emergency Declared EM-3277: August 18, 2007, FEMA Id: 3277, Natural disaster type: Hurricane
- Texas Hurricane Rita, Incident Period: September 23, 2005 to October 14, 2005, Major Disaster (Presidential) Declared DR-1606: September 24, 2005, FEMA Id: 1606, Natural disaster type: Hurricane
- Texas Hurricane Rita, Incident Period: September 20, 2005 to October 14, 2005, Emergency Declared EM-3261: September 21, 2005, FEMA Id: 3261, Natural disaster type: Hurricane
- Texas Hurricane Katrina, Incident Period: August 29, 2005 to October 01, 2005, Emergency Declared EM-3216: September 02, 2005, FEMA Id: 3216, Natural disaster type: Hurricane
- Texas Hurricane Claudette, Incident Period: July 15, 2003 to July 28, 2003, Major Disaster (Presidential) Declared DR-1479: July 17, 2003, FEMA Id: 1479, Natural disaster type: Hurricane
- Texas Severe Storms and Flooding, Incident Period: June 29, 2002 to July 31, 2002, Major Disaster (Presidential) Declared DR-1425: July 04, 2002, FEMA Id: 1425, Natural disaster type: Storm, Flood
- 4 other natural disasters have been reported since 1953.
The number of natural disasters in Goliad County (14) is near the US average (15).
Major Disasters (Presidential) Declared: 6
Emergencies Declared: 6
Causes of natural disasters: Hurricanes: 9, Floods: 3, Storms: 3, Fire: 1, Tornado: 1, Other: 1 (Note: some incidents may be assigned to more than one category).
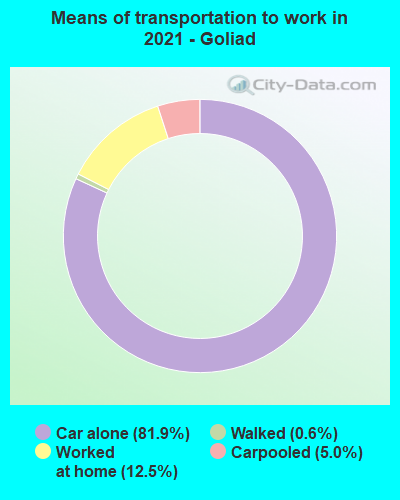
Means of transportation to work:
- Drove a car alone: 1,393 (73.7%)
- Carpooled: 133 (7.0%)
- Walked: 7 (0.4%)
- Worked at home: 374 (19.8%)
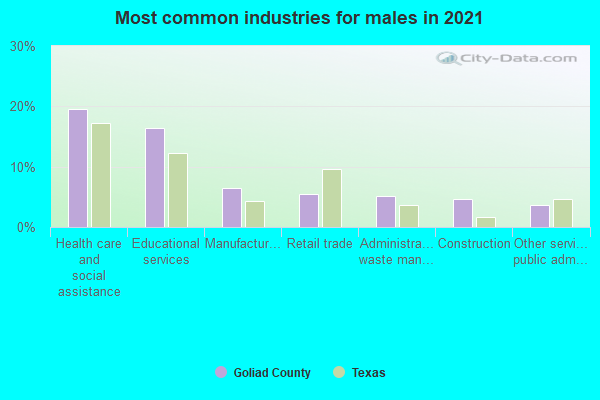
- Health care and social assistance (24%)
- Educational services (12%)
- Administrative and support and waste management services (7%)
- Manufacturing (6%)
- Construction (5%)
- Retail trade (5%)
- Information (4%)
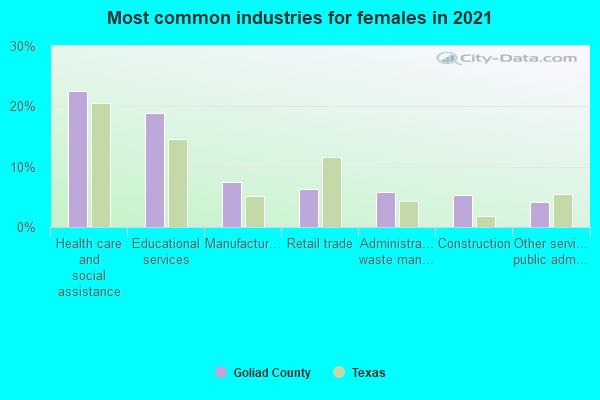
- Health care and social assistance (27%)
- Educational services (13%)
- Administrative and support and waste management services (8%)
- Manufacturing (6%)
- Construction (6%)
- Retail trade (6%)
- Information (5%)
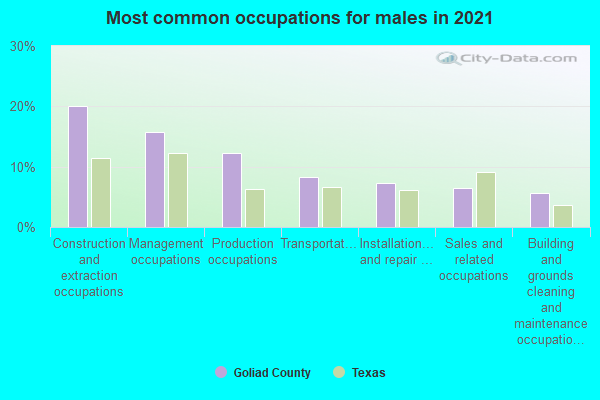
- Construction and extraction occupations (16%)
- Management occupations (16%)
- Installation, maintenance, and repair occupations (12%)
- Production occupations (10%)
- Transportation occupations (8%)
- Sales and related occupations (7%)
- Building and grounds cleaning and maintenance occupations (6%)
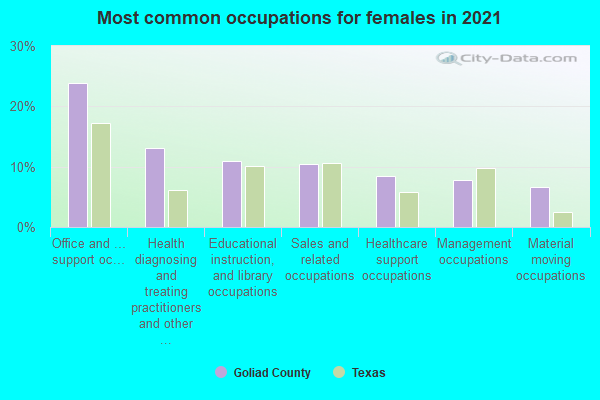
- Office and administrative support occupations (28%)
- Health diagnosing and treating practitioners and other technical occupations (12%)
- Educational instruction, and library occupations (10%)
- Material moving occupations (8%)
- Management occupations (7%)
- Healthcare support occupations (7%)
- Sales and related occupations (6%)
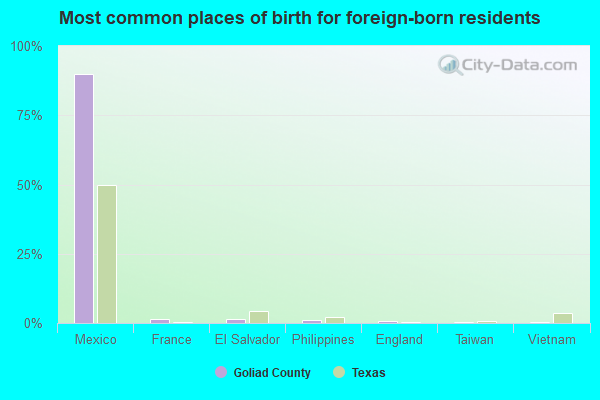
- Mexico (87%)
- England (4%)
- Canada (2%)
- El Salvador (1%)
- France (1%)
- Taiwan (1%)
- Vietnam (0%)
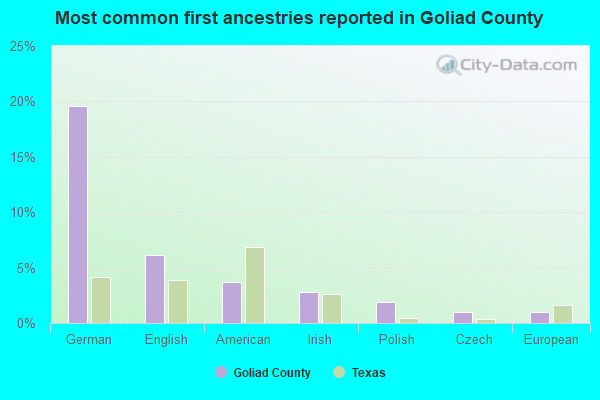
- German (20%)
- English (5%)
- American (4%)
- Irish (3%)
- European (1%)
- Czech (1%)
- French (except Basque) (1%)
People in group quarters in Goliad County, Texas in 2010:
- 49 people in nursing facilities/skilled-nursing facilities
- 30 people in local jails and other municipal confinement facilities
- 9 people in group homes for juveniles (non-correctional)
- 5 people in workers' group living quarters and job corps centers
People in group quarters in Goliad County, Texas in 2000:
- 71 people in nursing homes
- 18 people in local jails and other confinement facilities (including police lockups)
- 14 people in other noninstitutional group quarters
- 12 people in federal prisons and detention centers
- 8 people in state prisons
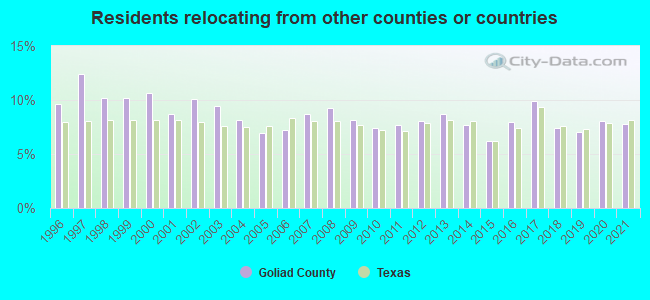
7.76% of this county's 2021 resident taxpayers lived in other counties in 2020 ($58,792 average adjusted gross income)
| Here: | 7.76% |
| Texas average: | 8.12% |
10 or fewer of this county's residents moved from foreign countries.
7.76% relocated from other counties in Texas ($58,792 average AGI)
10 or fewer of this county's residents relocated from other states.
Top counties from which taxpayers relocated into this county between 2020 and 2021:
| from Victoria County, TX |
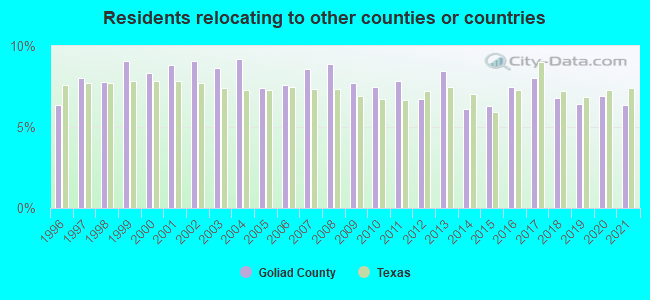
6.38% of this county's 2020 resident taxpayers moved to other counties in 2021 ($54,766 average adjusted gross income)
| Here: | 6.38% |
| Texas average: | 7.40% |
10 or fewer of this county's residents moved to foreign countries.
6.38% relocated to other counties in Texas ($54,766 average AGI)
10 or fewer of this county's residents relocated to other states.
Top counties to which taxpayers relocated from this county between 2020 and 2021:
| to Victoria County, TX |
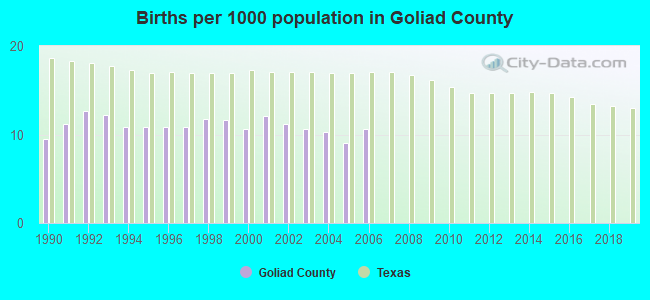
Births per 1000 population from 1990 to 1999: 11.2
Births per 1000 population from 2000 to 2006: 10.6
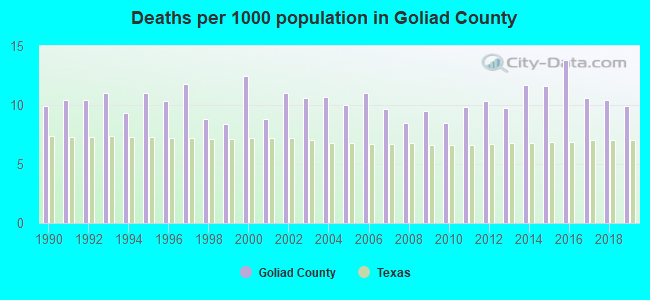
Deaths per 1000 population from 1990 to 1999: 10.1
Deaths per 1000 population from 2000 to 2009: 10.2
Deaths per 1000 population from 2010 to 2020: 10.6
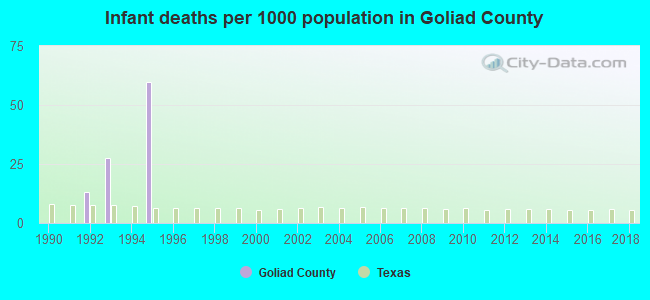
Infant deaths per 1000 live births from 1990 to 1999: 10.0
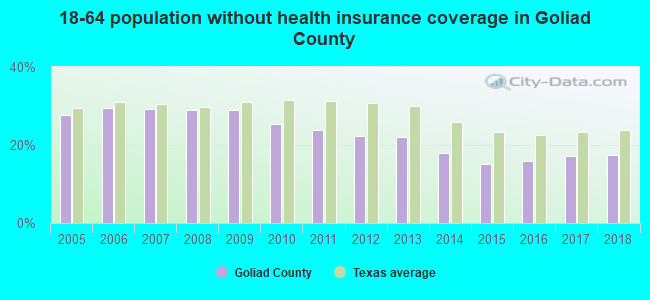
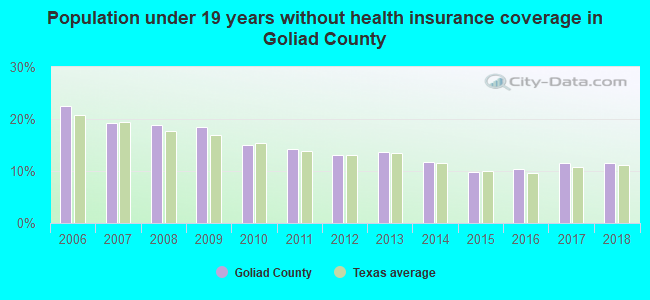
Persons under 19 years old without health insurance coverage in 2018: 11.6%
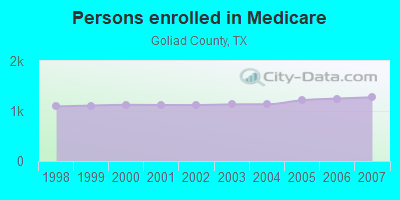
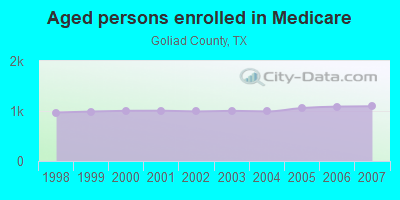
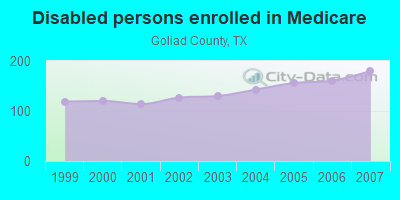
Persons enrolled in hospital insurance and/or supplemental medical insurance (Medicare) in July 1, 2007: 1,275 (1,095 aged, 180 disabled)
Children under 18 without health insurance coverage in 2007: 288 (18%)
Most common underlying causes of death in Goliad County, Texas in 1999 - 2019:
- Acute myocardial infarction, unspecified (30)
Population without health insurance coverage in 2000: 17%
Children under 18 without health insurance coverage in 2000: 18%
Medical specialist MDs per 100,000 population in 2005: 1,183
Total births per 100,000 population, July 2005 - July 2006 : 29
Total deaths per 100,000 population, July 2005 - July 2006: 28
Limited-service eating places per 100,000 population in 2005 : 14
Household type by relationship:
Households: 7,282- Male householders: 1,246 (490 living alone), Female householders: 1,631 (494 living alone)
1,505 spouses (1,498 opposite-sex spouses), 94 unmarried partners, (94 opposite-sex unmarried partners), 2,215 children (2,152 natural, 20 adopted, 41 stepchildren), 84 grandchildren, 102 brothers or sisters, 128 parents, 0 foster children, 142 other relatives, 36 non-relatives
- In group quarters: 110
Size of family households: 867 2-persons, 355 3-persons, 375 4-persons, 177 5-persons, 23 6-persons, 20 7-or-more-persons.
Size of nonfamily households: 984 1-person, 77 2-persons.
1,184 married couples with children.
172 single-parent households (42 men, 130 women).
80.5% of residents of Goliad speak English at home.
18.2% of residents speak Spanish at home (72% speak English very well, 16% speak English well, 8% speak English not well, 4% don't speak English at all).
1.7% of residents speak other Indo-European language at home (100% speak English very well).
0.1% of residents speak Asian or Pacific Island language at home (33% speak English very well, 67% speak English well).
In fiscal year 2004:
Federal Government expenditure: $39,761,000 ($5,597 per capita)
Department of Defense expenditure: $1,133,000
Federal direct payments to individuals for retirement and disability: $17,067,000
Federal other direct payments to individuals: $10,190,000
Federal direct payments not to individuals: $940,000
Federal grants: $10,229,000
Federal procurement contracts: $264,000 ($0,000 Department of Defense)
Federal salaries and wages: $1,072,000 ($0,000 Department of Defense)
Federal Government direct loans: $153,000
Federal guaranteed/insured loans: $1,414,000
Federal Government insurance: $1,663,000
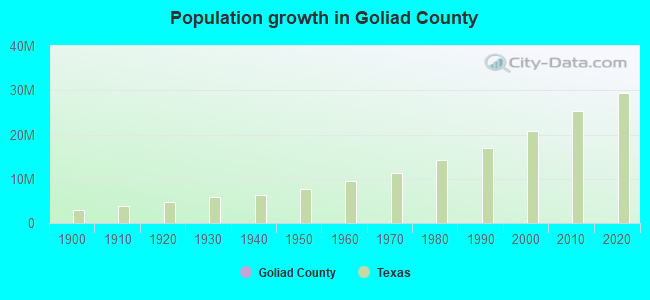
Population change from April 1, 2000 to July 1, 2005:
Births: 405| Here: | 57 per 1000 residents |
| State: | 85 per 1000 residents |
Deaths: 387
| Here: | 54 per 1000 residents |
| State: | 35 per 1000 residents |
Net international migration: +14
| Here: | +2 per 1000 residents |
| State: | +29 per 1000 residents |
Net internal migration: +155
| Here: | +22 per 1000 residents |
| State: | +10 per 1000 residents |
Total withdrawal of fresh water for public supply: 0.33 millions of gallons per day (all from ground)
| Here: | 5.6 |
| State: | 6.3 |
| Here: | 4.7 |
| State: | 4.0 |
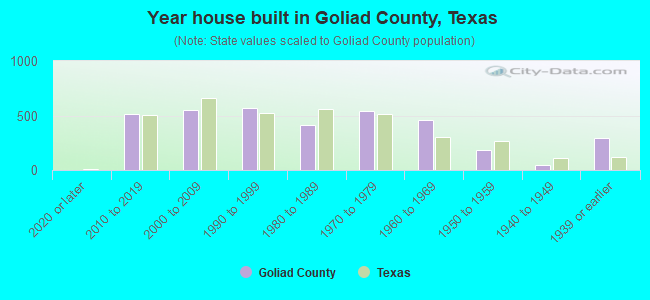
- Year house built in Goliad County, Texas
- 122020 or later
- 4932010 to 2019
- 4192000 to 2009
- 6301990 to 1999
- 4321980 to 1989
- 6201970 to 1979
- 4031960 to 1969
- 1641950 to 1959
- 621940 to 1949
- 2821939 or earlier
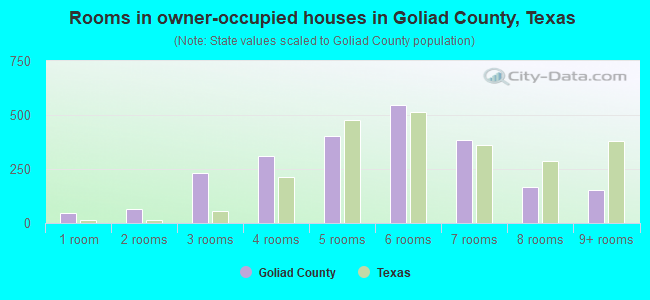
- Rooms in owner-occupied houses in Goliad County, Texas
- 461 room
- 612 rooms
- 1793 rooms
- 3854 rooms
- 4935 rooms
- 4846 rooms
- 3887 rooms
- 1958 rooms
- 1709+ rooms
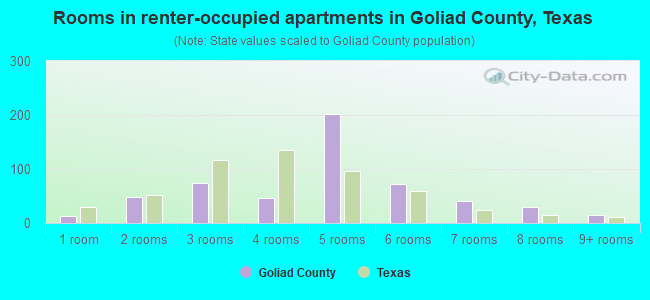
- Rooms in renter-occupied apartments in Goliad County, Texas
- 131 room
- 642 rooms
- 543 rooms
- 624 rooms
- 1945 rooms
- 406 rooms
- 407 rooms
- 258 rooms
- 09+ rooms
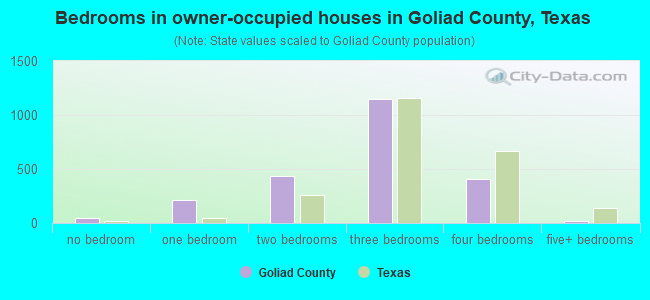
- Bedrooms in owner-occupied houses in Goliad County, Texas
- 51no bedroom
- 1811 bedroom
- 5072 bedrooms
- 1,2353 bedrooms
- 3514 bedrooms
- 495+ bedrooms
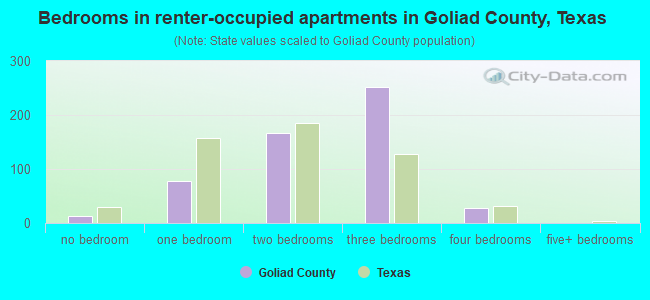
- Bedrooms in renter-occupied apartments in Goliad County, Texas
- 13no bedroom
- 741 bedroom
- 1852 bedrooms
- 2113 bedrooms
- 54 bedrooms
- 05+ bedrooms
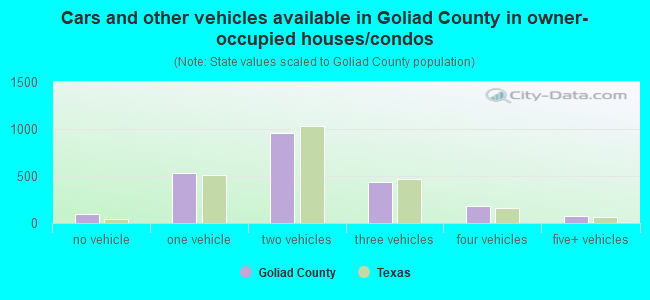
- Cars and other vehicles available in Goliad County in owner-occupied houses/condos
- 126no vehicle
- 5191 vehicle
- 9762 vehicles
- 4423 vehicles
- 2224 vehicles
- 985+ vehicles
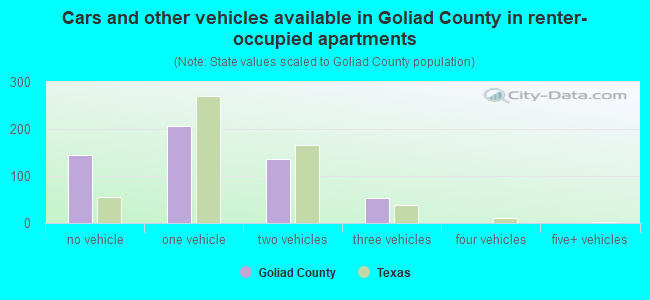
- Cars and other vehicles available in Goliad County in renter-occupied apartments
- 131no vehicle
- 1781 vehicle
- 1352 vehicles
- 533 vehicles
- 04 vehicles
- 05+ vehicles
96.1% of Goliad County residents lived in the same house 1 years ago.
Out of people who lived in different houses, 21% lived in this county.
Out of people who lived in different counties, 100% lived in Texas.
| Goliad County: | 96.1% |
| State average: | 85.7% |
Place of birth for U.S.-born residents:
- This state: 6,215
- Other state: 569
- Northeast: 28
- Midwest: 171
- South: 206
- West: 163
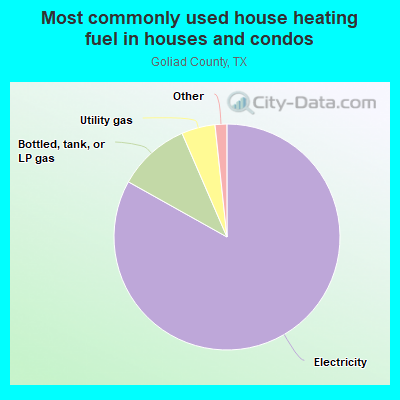
- 79.4%Electricity
- 12.5%Bottled, tank, or LP gas
- 6.5%Utility gas
- 1.2%Other fuel
- 0.3%Wood
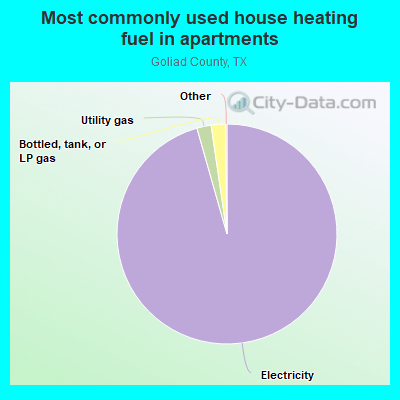
- 90.0%Electricity
- 7.9%Utility gas
- 2.1%Bottled, tank, or LP gas
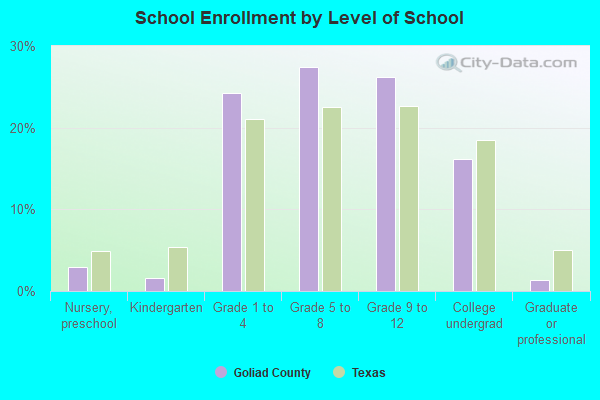
Private vs. public school enrollment:
| Here: | 13.5% |
| Texas: | 8.8% |
| Here: | 10.2% |
| Texas: | 8.0% |
| Here: | 6.6% |
| Texas: | 16.2% |
Goliad County government finances - Expenditure in 2017:
- Bond Funds - Cash and Securities: $39,000
- Charges - Other: $294,000
Regular Highways: $7,000
- Construction - Regular Highways: $166,000
General - Other: $57,000
Judicial and Legal Services: $3,000
- Current Operations - Correctional Institutions: $571,000
Judicial and Legal Services: $469,000
Corrections - Other: $383,000
Police Protection: $343,000
General - Other: $251,000
Regular Highways: $248,000
Financial Administration: $100,000
General Public Buildings: $53,000
Local Fire Protection: $24,000
Central Staff Services: $24,000
Public Welfare, Vendor Payments for Medical Care: $19,000
Public Welfare - Other: $17,000
Natural Resources - Other: $7,000
Solid Waste Management: $7,000
- Federal Intergovernmental - Other: $19,000
- General - Interest on Debt: $32,000
- Local Intergovernmental - Other: $34,000
- Long Term Debt - Beginning Outstanding - Unspecified Public Purpose: $893,000
Outstanding Unspecified Public Purpose: $779,000
Retired Unspecified Public Purpose: $114,000
- Miscellaneous - General Revenue - Other: $102,000
Fines and Forfeits: $45,000
Interest Earnings: $9,000
Rents: $2,000
Donations From Private Sources: $1,000
Sale of Property: $1,000
- Other Capital Outlay - General - Other: $37,000
Corrections - Other: $14,000
Correctional Institutions: $6,000
Judicial and Legal Services: $2,000
Central Staff Services: $1,000
- Other Funds - Cash and Securities: $1,732,000
- Sinking Funds - Cash and Securities: $54,000
- State Intergovernmental - Other: $116,000
General Local Government Support: $18,000
Highways: $3,000
- Tax - Property: $1,751,000
General Sales and Gross Receipts: $558,000
Motor Vehicle License: $111,000
Other Selective Sales: $67,000
Amusements Sales: $3,000
Goliad County government finances - Revenue in 2017:
- Bond Funds - Cash and Securities: $39,000
- Charges - Other: $294,000
Regular Highways: $7,000
- Construction - Regular Highways: $166,000
General - Other: $57,000
Judicial and Legal Services: $3,000
- Current Operations - Correctional Institutions: $571,000
Judicial and Legal Services: $469,000
Corrections - Other: $383,000
Police Protection: $343,000
General - Other: $251,000
Regular Highways: $248,000
Financial Administration: $100,000
General Public Buildings: $53,000
Local Fire Protection: $24,000
Central Staff Services: $24,000
Public Welfare, Vendor Payments for Medical Care: $19,000
Public Welfare - Other: $17,000
Natural Resources - Other: $7,000
Solid Waste Management: $7,000
- Federal Intergovernmental - Other: $19,000
- General - Interest on Debt: $32,000
- Local Intergovernmental - Other: $34,000
- Long Term Debt - Beginning Outstanding - Unspecified Public Purpose: $893,000
Outstanding Unspecified Public Purpose: $779,000
Retired Unspecified Public Purpose: $114,000
- Miscellaneous - General Revenue - Other: $102,000
Fines and Forfeits: $45,000
Interest Earnings: $9,000
Rents: $2,000
Donations From Private Sources: $1,000
Sale of Property: $1,000
- Other Capital Outlay - General - Other: $37,000
Corrections - Other: $14,000
Correctional Institutions: $6,000
Judicial and Legal Services: $2,000
Central Staff Services: $1,000
- Other Funds - Cash and Securities: $1,732,000
- Sinking Funds - Cash and Securities: $54,000
- State Intergovernmental - Other: $116,000
General Local Government Support: $18,000
Highways: $3,000
- Tax - Property: $1,751,000
General Sales and Gross Receipts: $558,000
Motor Vehicle License: $111,000
Other Selective Sales: $67,000
Amusements Sales: $3,000
Goliad County government finances - Debt in 2017:
- Bond Funds - Cash and Securities: $39,000
- Charges - Other: $294,000
Regular Highways: $7,000
- Construction - Regular Highways: $166,000
General - Other: $57,000
Judicial and Legal Services: $3,000
- Current Operations - Correctional Institutions: $571,000
Judicial and Legal Services: $469,000
Corrections - Other: $383,000
Police Protection: $343,000
General - Other: $251,000
Regular Highways: $248,000
Financial Administration: $100,000
General Public Buildings: $53,000
Local Fire Protection: $24,000
Central Staff Services: $24,000
Public Welfare, Vendor Payments for Medical Care: $19,000
Public Welfare - Other: $17,000
Natural Resources - Other: $7,000
Solid Waste Management: $7,000
- Federal Intergovernmental - Other: $19,000
- General - Interest on Debt: $32,000
- Local Intergovernmental - Other: $34,000
- Long Term Debt - Beginning Outstanding - Unspecified Public Purpose: $893,000
Outstanding Unspecified Public Purpose: $779,000
Retired Unspecified Public Purpose: $114,000
- Miscellaneous - General Revenue - Other: $102,000
Fines and Forfeits: $45,000
Interest Earnings: $9,000
Rents: $2,000
Donations From Private Sources: $1,000
Sale of Property: $1,000
- Other Capital Outlay - General - Other: $37,000
Corrections - Other: $14,000
Correctional Institutions: $6,000
Judicial and Legal Services: $2,000
Central Staff Services: $1,000
- Other Funds - Cash and Securities: $1,732,000
- Sinking Funds - Cash and Securities: $54,000
- State Intergovernmental - Other: $116,000
General Local Government Support: $18,000
Highways: $3,000
- Tax - Property: $1,751,000
General Sales and Gross Receipts: $558,000
Motor Vehicle License: $111,000
Other Selective Sales: $67,000
Amusements Sales: $3,000
Goliad County government finances - Cash and Securities in 2017:
- Bond Funds - Cash and Securities: $39,000
- Charges - Other: $294,000
Regular Highways: $7,000
- Construction - Regular Highways: $166,000
General - Other: $57,000
Judicial and Legal Services: $3,000
- Current Operations - Correctional Institutions: $571,000
Judicial and Legal Services: $469,000
Corrections - Other: $383,000
Police Protection: $343,000
General - Other: $251,000
Regular Highways: $248,000
Financial Administration: $100,000
General Public Buildings: $53,000
Local Fire Protection: $24,000
Central Staff Services: $24,000
Public Welfare, Vendor Payments for Medical Care: $19,000
Public Welfare - Other: $17,000
Natural Resources - Other: $7,000
Solid Waste Management: $7,000
- Federal Intergovernmental - Other: $19,000
- General - Interest on Debt: $32,000
- Local Intergovernmental - Other: $34,000
- Long Term Debt - Beginning Outstanding - Unspecified Public Purpose: $893,000
Outstanding Unspecified Public Purpose: $779,000
Retired Unspecified Public Purpose: $114,000
- Miscellaneous - General Revenue - Other: $102,000
Fines and Forfeits: $45,000
Interest Earnings: $9,000
Rents: $2,000
Donations From Private Sources: $1,000
Sale of Property: $1,000
- Other Capital Outlay - General - Other: $37,000
Corrections - Other: $14,000
Correctional Institutions: $6,000
Judicial and Legal Services: $2,000
Central Staff Services: $1,000
- Other Funds - Cash and Securities: $1,732,000
- Sinking Funds - Cash and Securities: $54,000
- State Intergovernmental - Other: $116,000
General Local Government Support: $18,000
Highways: $3,000
- Tax - Property: $1,751,000
General Sales and Gross Receipts: $558,000
Motor Vehicle License: $111,000
Other Selective Sales: $67,000
Amusements Sales: $3,000
Supplemental Security Income (SSI) in 2006:
- Total number of recipients: 179
- Number of aged recipients: 42
- Number of blind and disabled recipients: 137
- Number of recipients under 18: 19
- Number of recipients between 18 and 64: 87
- Number of recipients older than 64: 73
- Number of recipients also receiving OASDI: 96
- Amount of payments (thousands of dollars): 64
| Most common first names in Goliad County, TX among deceased individuals | ||
| Name | Count | Lived (average) |
|---|---|---|
| James | 33 | 69.7 years |
| John | 30 | 74.8 years |
| Mary | 26 | 84.5 years |
| William | 22 | 79.9 years |
| Robert | 18 | 70.9 years |
| Frank | 15 | 74.9 years |
| Charles | 14 | 76.3 years |
| Joe | 14 | 75.4 years |
| Annie | 13 | 85.7 years |
| Elizabeth | 12 | 83.1 years |
| Most common last names in Goliad County, TX among deceased individuals | ||
| Last name | Count | Lived (average) |
|---|---|---|
| Flores | 36 | 70.1 years |
| Garcia | 34 | 76.5 years |
| Albrecht | 31 | 81.4 years |
| Williams | 30 | 74.5 years |
| Martinez | 21 | 73.5 years |
| Hernandez | 18 | 77.1 years |
| Garza | 17 | 70.0 years |
| Lott | 17 | 73.9 years |
| Perez | 17 | 73.4 years |
| Smith | 14 | 76.7 years |
Businesses in Goliad County, TX
- FedEx: 1