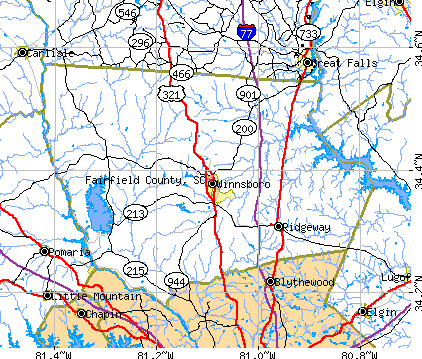
Fairfield County, South Carolina (SC)
County owner-occupied free and clear houses and condos in 2010: 3,023
County owner-occupied houses and condos in 2000: 6,799
Renter-occupied apartments: 2,430 (it was 1,975 in 2000)
| % of renters here: | 23% |
| State: | 31% |
Land area: 687 sq. mi.
Water area: 23.3 sq. mi.
Population density: 31 people per square mile (low).
Industries providing employment: Manufacturing (21.8%), Educational, health and social services (19.1%), Professional, scientific, management, administrative, and waste management services (11.5%).
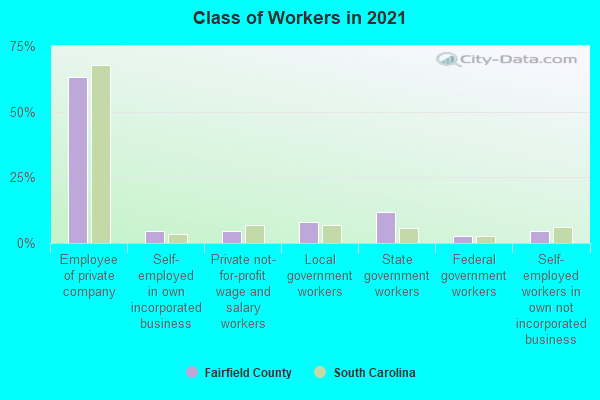
Type of workers:
- Private wage or salary: 71%
- Government: 24%
- Self-employed, not incorporated: 4%
- Unpaid family work: 1%
- OSM Map
- General Map
- Google Map
- MSN Map

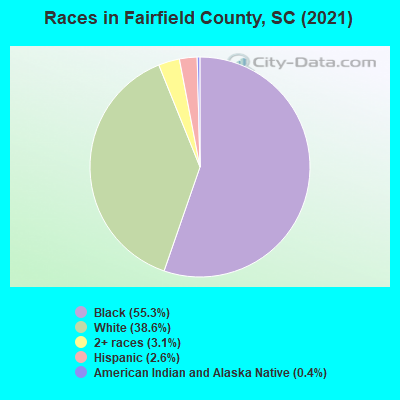
- 11,68955.0%Black Non-Hispanic Alone
- 8,23338.7%White Non-Hispanic Alone
- 7203.4%Two or more races
- 5942.8%Hispanic or Latino
- 260.1%Asian alone
- 30.01%American Indian and Alaska Native alone
| Median resident age: | 47.2 years |
| South Carolina median age: | 40.5 years |
| Males: 10,484 | |
| Females: 11,027 |

 | Fairfield County - pros and cons? (38 replies) |
| Columbia - general (5183 replies) |
| New metro area development/construction (790 replies) |
| Charleston is old and busted. Greenville is the new hotness. (717 replies) |
| 2020 SC Census Number (360 replies) |
| Charleston general - a broad topic, a thread for news that doesn’t fit anywhere else (386 replies) |
| Fairfield County: | 2.0 people |
| South Carolina: | 2 people |
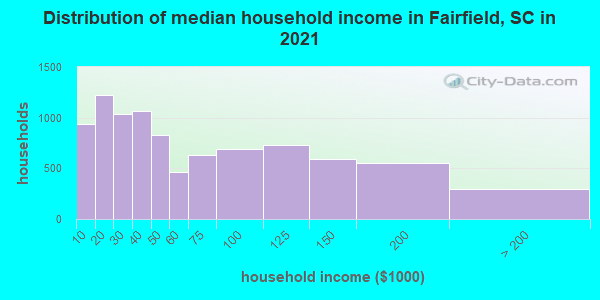
Estimated median household income in 2022: $44,865 ($30,376 in 1999)
| This county: | $44,865 |
| South Carolina: | $64,115 |
Median contract rent in 2022 for apartments: $551 (lower quartile is $454, upper quartile is $635)
| This county: | $551 |
| State: | $893 |
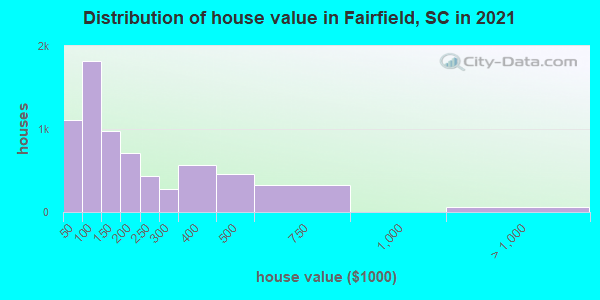
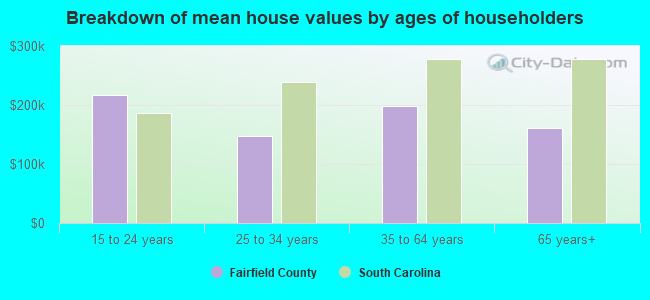
Estimated median house or condo value in 2022: $145,082 (it was $63,100 in 2000)
| Fairfield: | $145,082 |
| South Carolina: | $254,600 |
Median monthly housing costs for homes and condos with a mortgage: $1,222
Median monthly housing costs for units without a mortgage: $333
Institutionalized population: 318
Crime in 2021 (reported by the sheriff's office or county police, not the county total):
- Murders: 6
- Rapes: 3
- Robberies: 7
- Assaults: 91
- Burglaries: 58
- Thefts: 197
- Auto thefts: 59
Crime in 2020 (reported by the sheriff's office or county police, not the county total):
- Murders: 6
- Rapes: 1
- Robberies: 7
- Assaults: 119
- Burglaries: 114
- Thefts: 268
- Auto thefts: 50
Health of residents in Fairfield County based on CDC Behavioral Risk Factor Surveillance System Survey Questionnaires from 2013 to 2021:
General health status score of residents in this county from 1 (poor) to 5 (excellent) is 3.4. This is about average.71.3% of residents exercised in the past month. This is about average.
42.0% of residents smoked 100+ cigarettes in their lives. This is about average.
49.2% of adult residents drank alcohol in the past 30 days. This is less than average.
66.9% of residents visited a dentist within the past year. This is less than average.
Average weight of males is 200 pounds. This is more than average.
Average weight of females is 169 pounds. This is more than average.
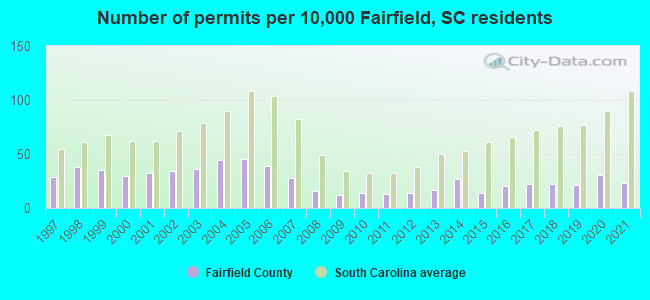
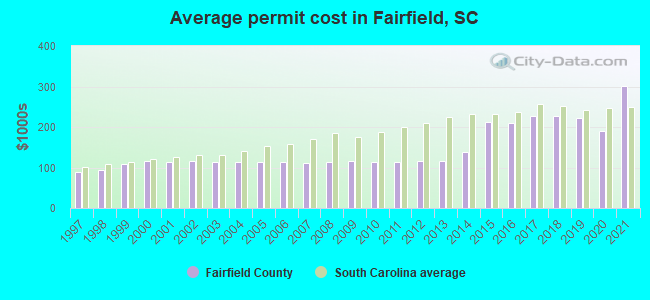
Single-family new house construction building permits:
- 2022: 66 buildings, average cost: $298,600
- 2021: 55 buildings, average cost: $302,100
- 2020: 72 buildings, average cost: $190,200
- 2019: 50 buildings, average cost: $222,700
- 2018: 51 buildings, average cost: $226,200
- 2017: 51 buildings, average cost: $228,400
- 2016: 47 buildings, average cost: $210,300
- 2015: 33 buildings, average cost: $212,600
- 2014: 64 buildings, average cost: $139,000
- 2013: 39 buildings, average cost: $116,000
- 2012: 34 buildings, average cost: $116,000
- 2011: 30 buildings, average cost: $114,300
- 2010: 32 buildings, average cost: $113,700
- 2009: 27 buildings, average cost: $116,000
- 2008: 37 buildings, average cost: $113,000
- 2007: 65 buildings, average cost: $110,900
- 2006: 92 buildings, average cost: $113,600
- 2005: 106 buildings, average cost: $113,800
- 2004: 104 buildings, average cost: $113,200
- 2003: 84 buildings, average cost: $114,300
- 2002: 79 buildings, average cost: $115,600
- 2001: 74 buildings, average cost: $114,200
- 2000: 71 buildings, average cost: $116,900
- 1999: 82 buildings, average cost: $109,200
- 1998: 90 buildings, average cost: $95,200
- 1997: 67 buildings, average cost: $87,500
Median real estate property taxes paid for housing units with mortgages in 2022: $1,041 (0.5%)
Median real estate property taxes paid for housing units with no mortgage in 2022: $548 (0.4%)

| Fairfield County: | 18.2% |
| South Carolina: | 14.0% |
Median age of residents in 2022: 47.2 years old
(Males: 44.9 years old, Females: 49.2 years old)
(Median age for: White residents: 55.8 years old, Black residents: 42.3 years old, Asian residents: 33.3 years old, Hispanic or Latino residents: 31.3 years old)
Area name: Columbia, SC HUD Metro FMR Area
Fair market rent in 2006 for a 1-bedroom apartment in Fairfield County is $567 a month.
Fair market rent for a 2-bedroom apartment is $632 a month.
Fair market rent for a 3-bedroom apartment is $781 a month.
Cities in this county include: Winnsboro, Winnsboro Mills, Monticello-Salem, Ridgeway, Jenkinsville.
Neighboring counties: Atoka County, Oklahoma  , Bolivar County, Mississippi , Grant County, Arkansas , Lancaster County
  , Lauderdale County, Alabama , Fulton County, Georgia , Scott County, Arkansas .
| Here: | 4.3% |
| South Carolina: | 3.1% |
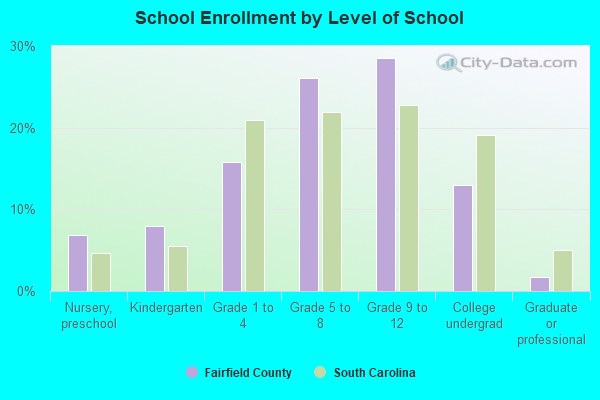
Current college students: 646
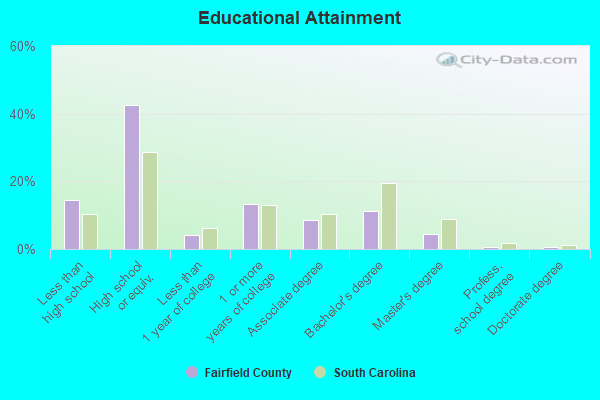
People 25 years of age or older with a high school degree or higher: 84.1%
People 25 years of age or older with a bachelor's degree or higher: 14.7%
Number of foreign born residents: 209 (91.0% naturalized citizens)
| Fairfield County: | 1.0% |
| Whole state: | 5.2% |
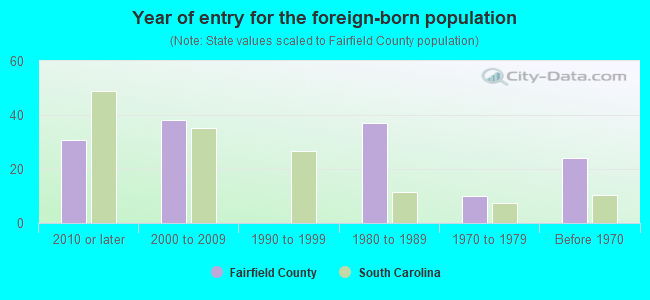
- Year of entry for the foreign-born population
- 372010 or later
- 1182000 to 2009
- 01990 to 1999
- 371980 to 1989
- 101970 to 1979
- 24Before 1970
Mean travel time to work (commute): minutes
Percentage of county residents living and working in this county: 97.5%
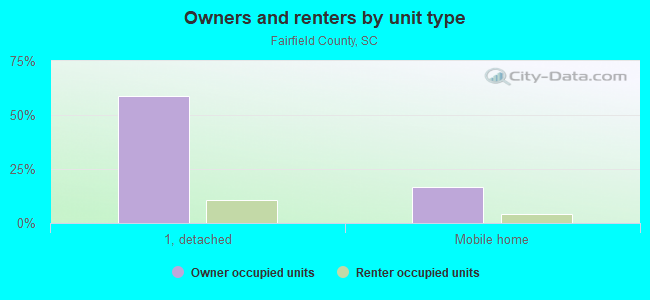
Housing units in structures:
- One, detached: 7,803
- One, attached: 62
- Two: 242
- 3 or 4: 197
- 5 to 9: 97
- 10 to 19: 25
- 50 or more: 213
- Mobile homes: 2,577
Housing units in Fairfield County with a mortgage: 2,936 (231 second mortgage, 0 home equity loan, 198 both second mortgage and home equity loan)
Houses without a mortgage: 120
| Here: | 1.6% with mortgage |
| State: | 97.3% with mortgage |
Religion statistics for Fairfield County
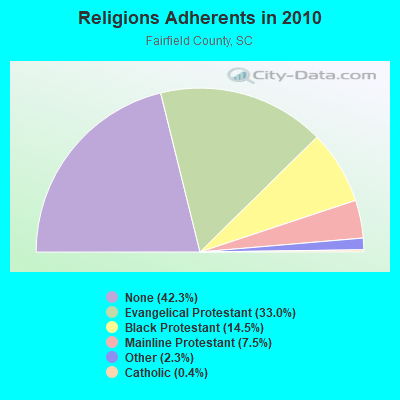
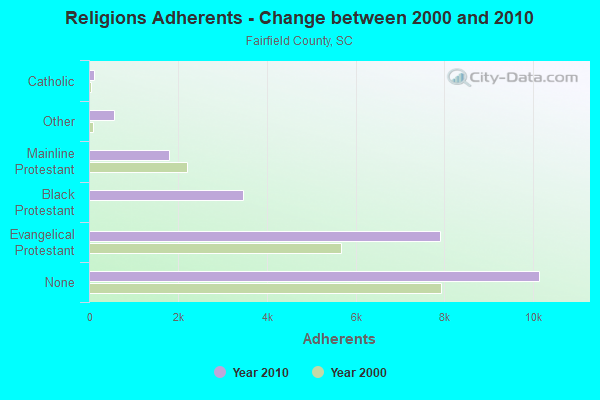
| Religion | Adherents | Congregations |
|---|---|---|
| Evangelical Protestant | 7,894 | 40 |
| Black Protestant | 3,467 | 21 |
| Mainline Protestant | 1,790 | 19 |
| Other | 561 | 2 |
| Catholic | 105 | 1 |
| None | 10,139 | - |
Source: Clifford Grammich, Kirk Hadaway, Richard Houseal, Dale E.Jones, Alexei Krindatch, Richie Stanley and Richard H.Taylor. 2012. 2010 U.S.Religion Census: Religious Congregations & Membership Study. Association of Statisticians of American Religious Bodies. Jones, Dale E., et al. 2002. Congregations and Membership in the United States 2000. Nashville, TN: Glenmary Research Center.
Food Environment Statistics:
| Fairfield County: | 1.29 / 10,000 pop. |
| State: | 1.99 / 10,000 pop. |
| Here: | 0.43 / 10,000 pop. |
| South Carolina: | 0.15 / 10,000 pop. |
| This county: | 1.72 / 10,000 pop. |
| South Carolina: | 0.85 / 10,000 pop. |
| Fairfield County: | 5.58 / 10,000 pop. |
| South Carolina: | 5.38 / 10,000 pop. |
| This county: | 4.72 / 10,000 pop. |
| State: | 7.75 / 10,000 pop. |
| Fairfield County: | 14.0% |
| South Carolina: | 10.6% |
| Fairfield County: | 34.4% |
| State: | 29.4% |
| Here: | 13.1% |
| State: | 13.4% |
Agriculture in Fairfield County:
Average size of farms: 238 acresAverage value of agricultural products sold per farm: $68,804
Average value of crops sold per acre for harvested cropland: $92.01
The value of livestock, poultry, and their products as a percentage of the total market value of agricultural products sold: 95.39%
Average total farm production expenses per farm: $52,158
Harvested cropland as a percentage of land in farms: 14.50%
Irrigated harvested cropland as a percentage of land in farms: 2.50%
Average market value of all machinery and equipment per farm: $38,120
The percentage of farms operated by a family or individual: 93.25%
Average age of principal farm operators: 54 years
Average number of cattle and calves per 100 acres of all land in farms: 10.66
Corn for grain: 299 harvested acres
All wheat for grain: 151 harvested acres
Vegetables: 8 harvested acres
Land in orchards: 26 acres
Earthquake activity:
Fairfield County-area historical earthquake activity is significantly above South Carolina state average. It is 21% smaller than the overall U.S. average.On 8/2/1974 at 08:52:09, a magnitude 4.9 (4.3 MB, 4.9 LG, Class: Light, Intensity: IV - V) earthquake occurred 87.4 miles away from Fairfield County center
On 8/9/2020 at 12:07:37, a magnitude 5.1 (5.1 MW, Depth: 4.7 mi, Class: Moderate, Intensity: VI - VII) earthquake occurred 144.7 miles away from the county center
On 8/23/2011 at 17:51:04, a magnitude 5.8 (5.8 MW, Depth: 3.7 mi) earthquake occurred 300.9 miles away from the county center
On 11/22/1974 at 05:25:55, a magnitude 4.7 (4.7 MB) earthquake occurred 116.3 miles away from the county center
On 8/21/1992 at 16:31:55, a magnitude 4.4 (4.1 MB, 4.1 LG, 4.4 LG, Depth: 6.2 mi) earthquake occurred 108.0 miles away from Fairfield County center
On 11/30/1973 at 07:48:41, a magnitude 4.7 (4.7 MB, 4.6 ML) earthquake occurred 189.6 miles away from the county center
Magnitude types: regional Lg-wave magnitude (LG), body-wave magnitude (MB), local magnitude (ML), moment magnitude (MW)
Most recent natural disasters:
- South Carolina Covid-19 Pandemic, Incident Period: January 20, 2020, FEMA Id: 4492, Natural disaster type: Other
- South Carolina Hurricane Irma, Incident Period: September 6, 2017 - September 13, 2017, FEMA Id: 4346, Natural disaster type: Hurricane
- South Carolina Hurricane Matthew, Incident Period: October 04, 2016 to October 30, 2016, Emergency Declared EM-3378: October 06, 2016, FEMA Id: 3378, Natural disaster type: Hurricane
- South Carolina Severe Storms and Flooding, Incident Period: October 01, 2015 to October 23, 2015, Emergency Declared EM-3373: October 03, 2015, FEMA Id: 3373, Natural disaster type: Storm, Flood
- South Carolina Severe Storms and Flooding, Incident Period: October 01, 2015 to October 23, 2015, Major Disaster (Presidential) Declared DR-4241: October 05, 2015, FEMA Id: 4241, Natural disaster type: Storm, Flood
- South Carolina Severe Winter Storm, Incident Period: February 10, 2014 to February 19, 2014, Emergency Declared EM-3369: February 12, 2014, FEMA Id: 3369, Natural disaster type: Winter Storm
- South Carolina Hurricane Katrina Evacuation, Incident Period: August 29, 2005 to October 01, 2005, Emergency Declared EM-3233: September 10, 2005, FEMA Id: 3233, Natural disaster type: Hurricane
- South Carolina Tropical Storm Frances, Incident Period: September 06, 2004 to October 11, 2004, Major Disaster (Presidential) Declared DR-1566: October 07, 2004, FEMA Id: 1566, Natural disaster type: Tropical Storm
- South Carolina Severe Ice Storm, Incident Period: January 26, 2004 to January 30, 2004, Major Disaster (Presidential) Declared DR-1509: February 13, 2004, FEMA Id: 1509, Natural disaster type: Ice Storm
- South Carolina Winter Storms, Incident Period: January 22, 2000 to February 01, 2000, Major Disaster (Presidential) Declared DR-1313: January 31, 2000, FEMA Id: 1313, Natural disaster type: Winter Storm
- 2 other natural disasters have been reported since 1953.
The number of natural disasters in Fairfield County (12) is smaller than the US average (15).
Major Disasters (Presidential) Declared: 6
Emergencies Declared: 4
Causes of natural disasters: Hurricanes: 4, Storms: 3, Floods: 2, Winter Storms: 2, Ice Storm: 1, Tornado: 1, Tropical Storm: 1, Other: 1 (Note: some incidents may be assigned to more than one category).
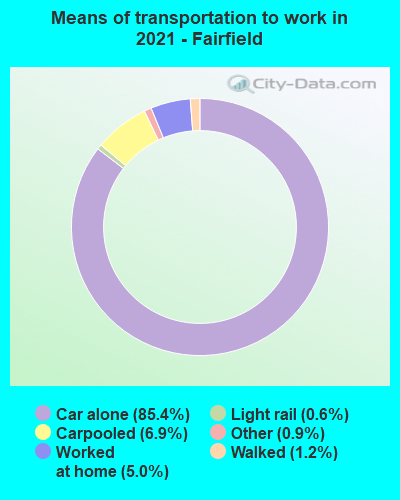
Means of transportation to work:
- Drove a car alone: 5,000 (79.9%)
- Carpooled: 488 (7.8%)
- Light rail, streetcar or trolley: 51 (0.8%)
- Taxicab, motorcycle, or other means: 124 (2.0%)
- Walked: 88 (1.4%)
- Worked at home: 419 (6.7%)

- Health care and social assistance (23%)
- Manufacturing (21%)
- Retail trade (12%)
- Educational services (11%)
- Administrative and support and waste management services (9%)
- Public administration (6%)
- Other services, except public administration (6%)
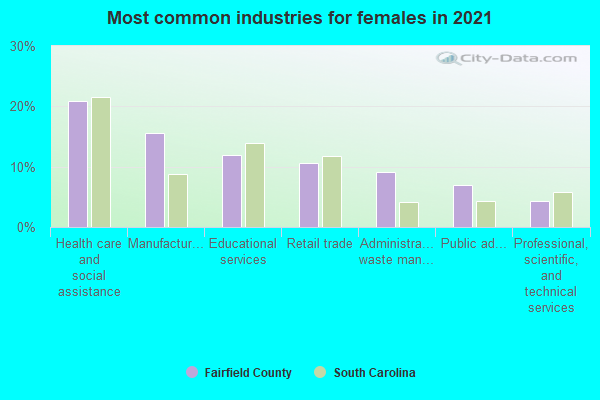
- Health care and social assistance (21%)
- Manufacturing (19%)
- Retail trade (11%)
- Educational services (10%)
- Administrative and support and waste management services (8%)
- Public administration (6%)
- Other services, except public administration (6%)
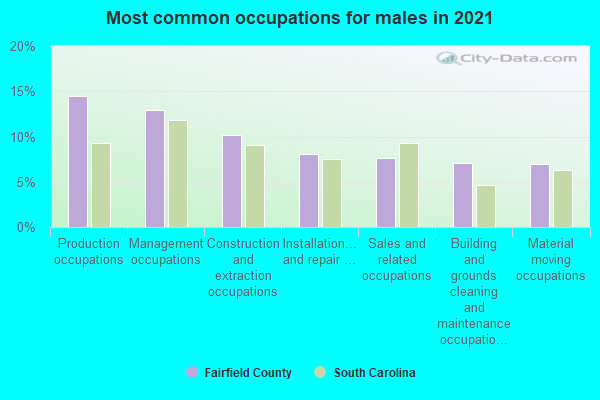
- Production occupations (15%)
- Management occupations (12%)
- Transportation occupations (9%)
- Construction and extraction occupations (8%)
- Material moving occupations (8%)
- Building and grounds cleaning and maintenance occupations (7%)
- Sales and related occupations (7%)

- Office and administrative support occupations (19%)
- Production occupations (12%)
- Sales and related occupations (11%)
- Business and financial operations occupations (8%)
- Educational instruction, and library occupations (7%)
- Health diagnosing and treating practitioners and other technical occupations (6%)
- Management occupations (6%)
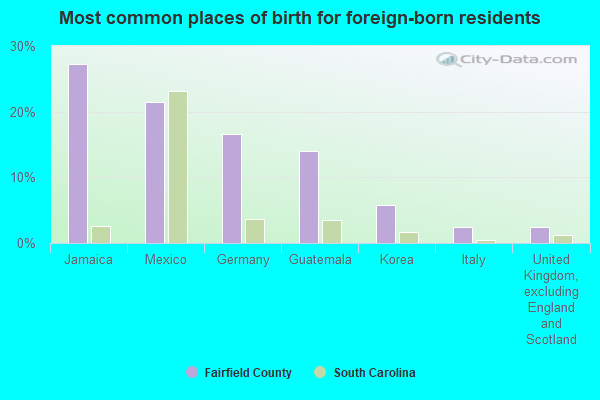
- Guatemala (49%)
- Germany (12%)
- Mexico (12%)
- Canada (8%)
- Korea (5%)
- Japan (3%)
- United Kingdom, excluding England and Scotland (2%)
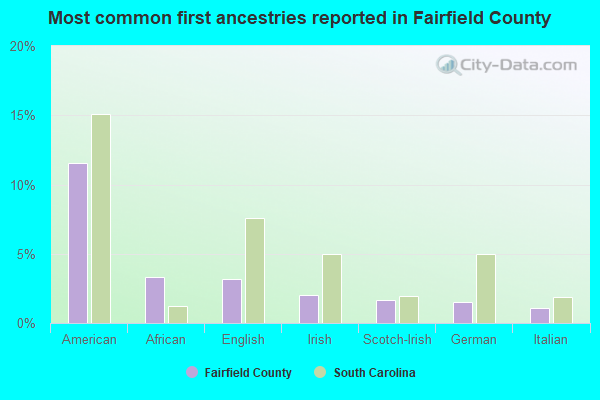
- American (11%)
- English (4%)
- Irish (2%)
- Scotch-Irish (2%)
- African (2%)
- German (1%)
- Scottish (1%)
People in group quarters in Fairfield County, South Carolina in 2010:
- 246 people in nursing facilities/skilled-nursing facilities
- 72 people in local jails and other municipal confinement facilities
- 53 people in group homes intended for adults
- 24 people in emergency and transitional shelters (with sleeping facilities) for people experiencing homelessness
- 2 people in workers' group living quarters and job corps centers
People in group quarters in Fairfield County, South Carolina in 2000:
- 275 people in nursing homes
- 58 people in local jails and other confinement facilities (including police lockups)
- 41 people in other noninstitutional group quarters
- 39 people in homes for the mentally retarded
- 8 people in schools, hospitals, or wards for the intellectually disabled
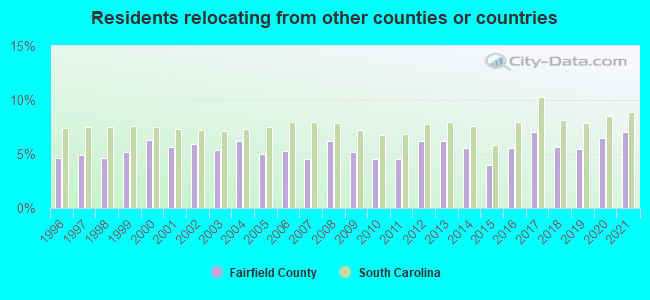
7.07% of this county's 2021 resident taxpayers lived in other counties in 2020 ($66,381 average adjusted gross income)
| Here: | 7.07% |
| South Carolina average: | 8.89% |
10 or fewer of this county's residents moved from foreign countries.
5.29% relocated from other counties in South Carolina ($45,583 average AGI)
1.78% relocated from other states ($20,798 average AGI)
Fairfield County: 1.78% South Carolina average: 4.96%
Top counties from which taxpayers relocated into this county between 2020 and 2021:
| from Richland County, SC | |
| from Lexington County, SC | |
| from Kershaw County, SC | |
| from York County, SC | |
| from Chester County, SC | |
| from Mecklenburg County, NC |
5.92% of this county's 2020 resident taxpayers moved to other counties in 2021 ($44,702 average adjusted gross income)
| Here: | 5.92% |
| South Carolina average: | 7.46% |
10 or fewer of this county's residents moved to foreign countries.
5.04% relocated to other counties in South Carolina ($37,267 average AGI)
0.88% relocated to other states ($7,435 average AGI)
Fairfield County: 0.88% South Carolina average: 3.47%
Top counties to which taxpayers relocated from this county between 2020 and 2021:
| to Richland County, SC | |
| to Lexington County, SC | |
| to Kershaw County, SC | |
| to Chester County, SC | |
| to York County, SC |
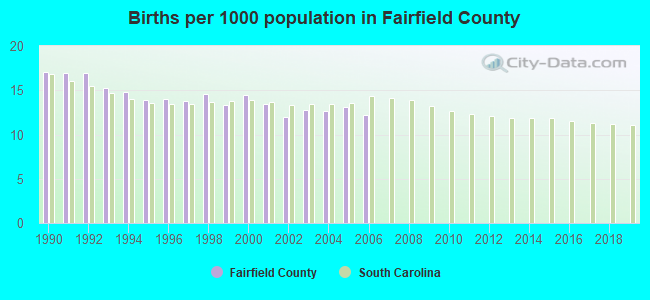
Births per 1000 population from 1990 to 1999: 15.1
Births per 1000 population from 2000 to 2006: 13.0
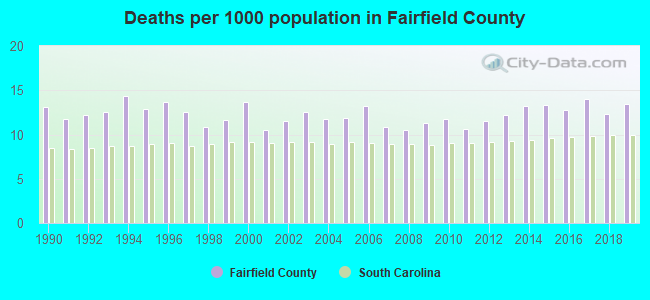
Deaths per 1000 population from 1990 to 1999: 12.5
Deaths per 1000 population from 2000 to 2009: 11.8
Deaths per 1000 population from 2010 to 2020: 12.9
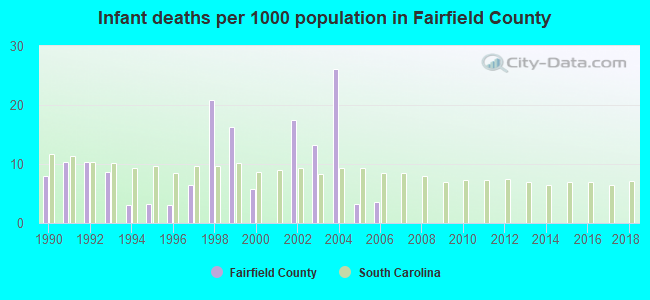
Infant deaths per 1000 live births from 1990 to 1999: 9.0
Infant deaths per 1000 live births from 2000 to 2006: 9.9
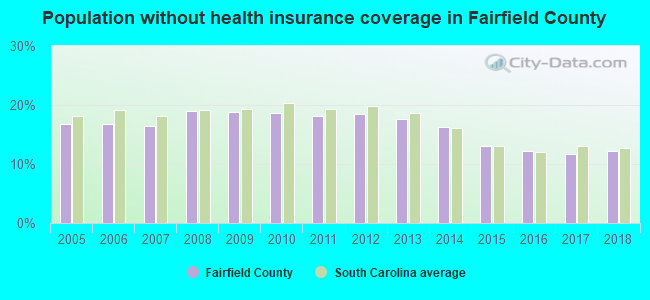
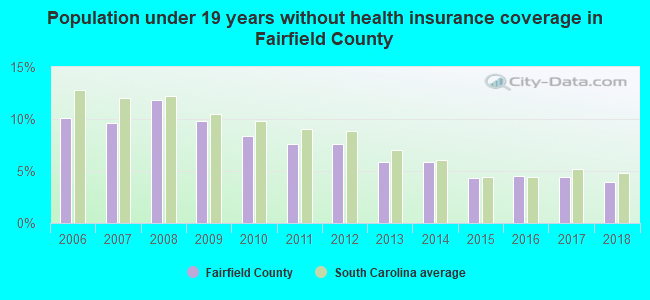
Persons under 19 years old without health insurance coverage in 2018: 3.9%
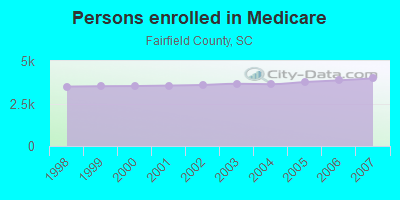
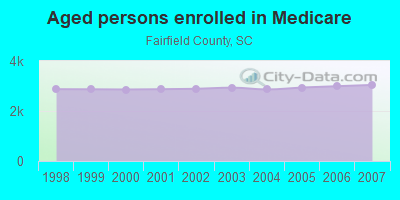
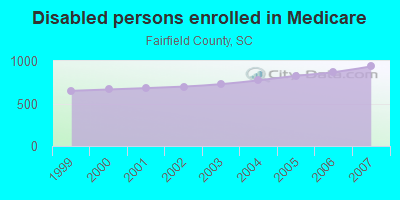
Persons enrolled in hospital insurance and/or supplemental medical insurance (Medicare) in July 1, 2007: 3,979 (3,042 aged, 937 disabled)
Children under 18 without health insurance coverage in 2007: 517 (9%)
Most common underlying causes of death in Fairfield County, South Carolina in 1999 - 2019:
- Acute myocardial infarction, unspecified (728)
- Bronchus or lung, unspecified - Malignant neoplasms (327)
- Atherosclerotic heart disease (275)
- Unspecified dementia (218)
- Alzheimer disease, unspecified (188)
- Chronic obstructive pulmonary disease, unspecified (116)
- Stroke, not specified as haemorrhage or infarction (112)
- Unspecified diabetes mellitus, without complications (45)
- Cardiac arrest, unspecified (13)
- Colon, unspecified - Malignant neoplasms (12)
Population without health insurance coverage in 2000: 16%
Children under 18 without health insurance coverage in 2000: 13%
Short term general hospital admissions per 100,000 population in 2004: 3,148
Short term general hospital beds per 100,000 population in 2004: 104
Emergency room visits per 100,000 population in 2004: 15,434
General practice office based MDs per 100,000 population in 2005: 1,393
Medical specialist MDs per 100,000 population in 2005: 1,256
Dentists per 100,000 population in 1998: 4
Total births per 100,000 population, July 2005 - July 2006 : 18
Total deaths per 100,000 population, July 2005 - July 2006: 25
Limited-service eating places per 100,000 population in 2005 : 4
EPA green book nonattainment status in 2004-2006: 1
Crimes per 100,000 population in 1996: 1
Suicides per 1,000,000 population from 2000 to 2006: 138.8. This is more than state average.
Household type by relationship:
Households: 21,511- Male householders: 4,381 (1,787 living alone), Female householders: 4,904 (1,191 living alone)
3,675 spouses (3,600 opposite-sex spouses), 204 unmarried partners, (204 opposite-sex unmarried partners), 5,439 children (4,925 natural, 252 adopted, 267 stepchildren), 1,396 grandchildren, 257 brothers or sisters, 89 parents, 22 foster children, 504 other relatives, 272 non-relatives
- In group quarters: 387
Size of family households: 3,379 2-persons, 1,242 3-persons, 1,111 4-persons, 224 5-persons, 89 6-persons, 119 7-or-more-persons.
Size of nonfamily households: 2,972 1-person, 159 2-persons, 3 3-persons.
1,400 married couples with children.
1,331 single-parent households (115 men, 1,216 women).
97.2% of residents of Fairfield speak English at home.
2.5% of residents speak Spanish at home (62% speak English very well, 28% speak English well, 10% speak English not well, 1% don't speak English at all).
0.2% of residents speak other Indo-European language at home (61% speak English very well, 39% speak English not well).
0.2% of residents speak Asian or Pacific Island language at home (76% speak English very well, 24% speak English well).
In fiscal year 2004:
Federal Government expenditure: $139,774,000 ($5,790 per capita)
Department of Defense expenditure: $8,434,000
Federal direct payments to individuals for retirement and disability: $58,532,000
Federal other direct payments to individuals: $29,973,000
Federal direct payments not to individuals: $258,000
Federal grants: $42,171,000
Federal procurement contracts: $5,736,000 ($3,277,000 Department of Defense)
Federal salaries and wages: $3,104,000 ($0,000 Department of Defense)
Federal Government direct loans: $102,000
Federal guaranteed/insured loans: $2,812,000
Federal Government insurance: $23,021,000
Population change from April 1, 2000 to July 1, 2005:
Births: 1,712| Here: | 71 per 1000 residents |
| State: | 69 per 1000 residents |
Deaths: 1,490
| Here: | 62 per 1000 residents |
| State: | 46 per 1000 residents |
Net international migration: +27
| Here: | +1 per 1000 residents |
| State: | +9 per 1000 residents |
Net internal migration: +383
| Here: | +16 per 1000 residents |
| State: | +27 per 1000 residents |
Total withdrawal of fresh water for public supply: 2.29 millions of gallons per day (9% from ground, 91% from surface)
| Here: | 6.6 |
| State: | 6.4 |
| Here: | 5.0 |
| State: | 4.5 |
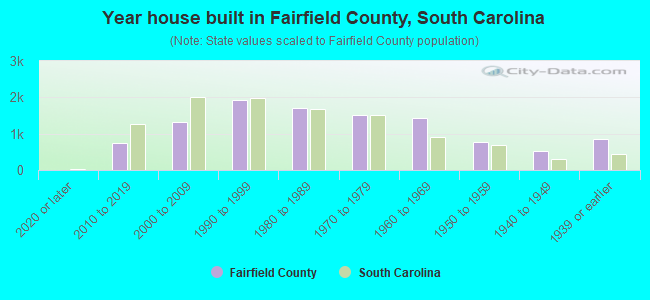
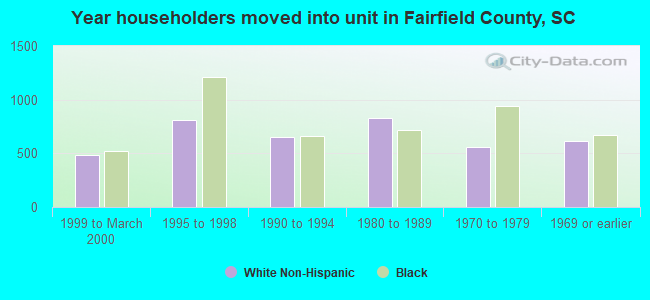
- Year house built in Fairfield County, South Carolina
- 82020 or later
- 6822010 to 2019
- 1,3812000 to 2009
- 1,7671990 to 1999
- 1,8101980 to 1989
- 1,7781970 to 1979
- 1,4581960 to 1969
- 6531950 to 1959
- 4791940 to 1949
- 7651939 or earlier
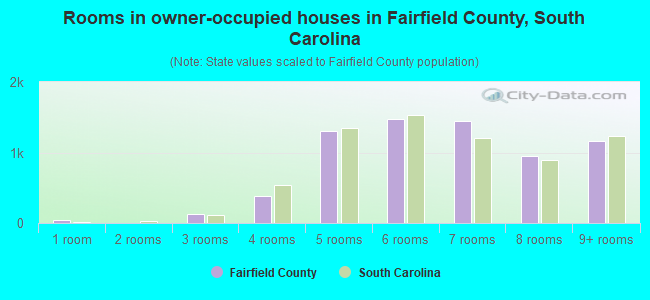
- Rooms in owner-occupied houses in Fairfield County, South Carolina
- 481 room
- 02 rooms
- 953 rooms
- 4514 rooms
- 1,4005 rooms
- 1,4476 rooms
- 1,3827 rooms
- 1,0558 rooms
- 1,2039+ rooms
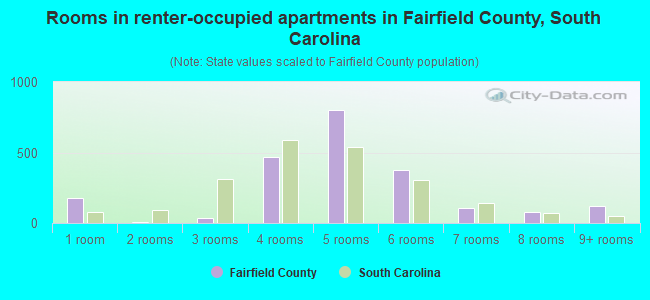
- Rooms in renter-occupied apartments in Fairfield County, South Carolina
- 1781 room
- 132 rooms
- 263 rooms
- 5054 rooms
- 8235 rooms
- 2436 rooms
- 977 rooms
- 868 rooms
- 2269+ rooms
- Bedrooms in owner-occupied houses in Fairfield County, South Carolina
- 47no bedroom
- 321 bedroom
- 1,1892 bedrooms
- 3,8963 bedrooms
- 1,6824 bedrooms
- 2295+ bedrooms
- Bedrooms in renter-occupied apartments in Fairfield County, South Carolina
- 181no bedroom
- 1381 bedroom
- 9252 bedrooms
- 6763 bedrooms
- 2834 bedrooms
- 05+ bedrooms
- Cars and other vehicles available in Fairfield County in owner-occupied houses/condos
- 258no vehicle
- 1,8451 vehicle
- 2,3782 vehicles
- 1,3603 vehicles
- 8024 vehicles
- 4205+ vehicles
- Cars and other vehicles available in Fairfield County in renter-occupied apartments
- 321no vehicle
- 1,1571 vehicle
- 5962 vehicles
- 983 vehicles
- 334 vehicles
- 185+ vehicles
91.7% of Fairfield County residents lived in the same house 1 years ago.
Out of people who lived in different houses, 35% lived in this county.
Out of people who lived in different counties, 73% lived in South Carolina.
| Fairfield County: | 91.7% |
| State average: | 86.5% |
Place of birth for U.S.-born residents:
- This state: 16,500
- Other state: 4,377
- Northeast: 1,136
- Midwest: 402
- South: 2,440
- West: 381
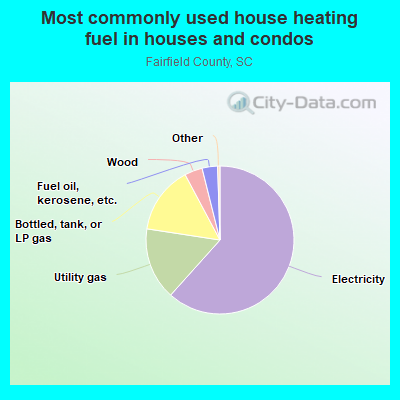
- 66.5%Electricity
- 15.8%Utility gas
- 12.0%Bottled, tank, or LP gas
- 3.2%Fuel oil, kerosene, etc.
- 1.9%Wood
- 0.4%No fuel used
- 0.2%Solar energy
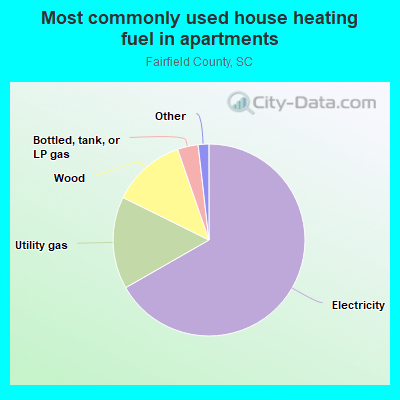
- 73.3%Electricity
- 12.0%Wood
- 10.9%Utility gas
- 3.2%Bottled, tank, or LP gas
- 0.3%No fuel used
- 0.3%Fuel oil, kerosene, etc.
Private vs. public school enrollment:
| Here: | 19.4% |
| South Carolina: | 14.4% |
| Here: | 14.5% |
| South Carolina: | 11.1% |
| Here: | 41.1% |
| South Carolina: | 21.9% |
Fairfield County government finances - Expenditure in 2018:
- Charges - Other: $18,000
Other: $17,000
- Current Operations - Central Staff Services: $5,821,000
Police Protection: $5,789,000
Central Staff Services: $5,233,000
Police Protection: $5,204,000
Health - Other: $4,147,000
Health - Other: $3,728,000
General - Other: $2,830,000
General - Other: $2,545,000
Solid Waste Management: $2,458,000
Correctional Institutions: $2,234,000
Solid Waste Management: $2,210,000
Correctional Institutions: $2,008,000
Financial Administration: $1,909,000
Financial Administration: $1,716,000
Libraries: $1,403,000
Libraries: $1,262,000
Hospitals: $1,209,000
Hospitals: $1,087,000
General Public Buildings: $973,000
Judicial and Legal Services: $887,000
Parks and Recreation: $882,000
General Public Buildings: $875,000
Judicial and Legal Services: $797,000
Parks and Recreation: $793,000
Local Fire Protection: $679,000
Local Fire Protection: $610,000
Air Transportation: $100,000
Air Transportation: $90,000
Natural Resources - Other: $36,000
Natural Resources - Other: $32,000
- General - Interest on Debt: $867,000
Interest on Debt: $792,000
- Long Term Debt - Beginning Outstanding - Unspecified Public Purpose: $28,218,000
Outstanding Unspecified Public Purpose: $27,275,000
Beginning Outstanding - Unspecified Public Purpose: $26,332,000
Outstanding Unspecified Public Purpose: $25,389,000
Retired Unspecified Public Purpose: $943,000
Retired Unspecified Public Purpose: $943,000
- Miscellaneous - General Revenue - Other: $3,321,000
General Revenue - Other: $2,786,000
Donations From Private Sources: $62,000
Donations From Private Sources: $52,000
Interest Earnings: $39,000
Interest Earnings: $32,000
- Other Funds - Cash and Securities: $46,631,000
Cash and Securities: $36,917,000
- State Intergovernmental - General Local Government Support: $1,680,000
General Local Government Support: $1,605,000
Other: $105,000
Other: $100,000
- Tax - Property: $29,837,000
Property: $27,607,000
Other License: $1,312,000
Other License: $1,214,000
- Total Salaries and Wages: $13,047,000
: $12,313,000
Fairfield County government finances - Revenue in 2018:
- Charges - Other: $18,000
Other: $17,000
- Current Operations - Central Staff Services: $5,821,000
Police Protection: $5,789,000
Central Staff Services: $5,233,000
Police Protection: $5,204,000
Health - Other: $4,147,000
Health - Other: $3,728,000
General - Other: $2,830,000
General - Other: $2,545,000
Solid Waste Management: $2,458,000
Correctional Institutions: $2,234,000
Solid Waste Management: $2,210,000
Correctional Institutions: $2,008,000
Financial Administration: $1,909,000
Financial Administration: $1,716,000
Libraries: $1,403,000
Libraries: $1,262,000
Hospitals: $1,209,000
Hospitals: $1,087,000
General Public Buildings: $973,000
Judicial and Legal Services: $887,000
Parks and Recreation: $882,000
General Public Buildings: $875,000
Judicial and Legal Services: $797,000
Parks and Recreation: $793,000
Local Fire Protection: $679,000
Local Fire Protection: $610,000
Air Transportation: $100,000
Air Transportation: $90,000
Natural Resources - Other: $36,000
Natural Resources - Other: $32,000
- General - Interest on Debt: $867,000
Interest on Debt: $792,000
- Long Term Debt - Beginning Outstanding - Unspecified Public Purpose: $28,218,000
Outstanding Unspecified Public Purpose: $27,275,000
Beginning Outstanding - Unspecified Public Purpose: $26,332,000
Outstanding Unspecified Public Purpose: $25,389,000
Retired Unspecified Public Purpose: $943,000
Retired Unspecified Public Purpose: $943,000
- Miscellaneous - General Revenue - Other: $3,321,000
General Revenue - Other: $2,786,000
Donations From Private Sources: $62,000
Donations From Private Sources: $52,000
Interest Earnings: $39,000
Interest Earnings: $32,000
- Other Funds - Cash and Securities: $46,631,000
Cash and Securities: $36,917,000
- State Intergovernmental - General Local Government Support: $1,680,000
General Local Government Support: $1,605,000
Other: $105,000
Other: $100,000
- Tax - Property: $29,837,000
Property: $27,607,000
Other License: $1,312,000
Other License: $1,214,000
- Total Salaries and Wages: $13,047,000
: $12,313,000
Fairfield County government finances - Debt in 2018:
- Charges - Other: $18,000
Other: $17,000
- Current Operations - Central Staff Services: $5,821,000
Police Protection: $5,789,000
Central Staff Services: $5,233,000
Police Protection: $5,204,000
Health - Other: $4,147,000
Health - Other: $3,728,000
General - Other: $2,830,000
General - Other: $2,545,000
Solid Waste Management: $2,458,000
Correctional Institutions: $2,234,000
Solid Waste Management: $2,210,000
Correctional Institutions: $2,008,000
Financial Administration: $1,909,000
Financial Administration: $1,716,000
Libraries: $1,403,000
Libraries: $1,262,000
Hospitals: $1,209,000
Hospitals: $1,087,000
General Public Buildings: $973,000
Judicial and Legal Services: $887,000
Parks and Recreation: $882,000
General Public Buildings: $875,000
Judicial and Legal Services: $797,000
Parks and Recreation: $793,000
Local Fire Protection: $679,000
Local Fire Protection: $610,000
Air Transportation: $100,000
Air Transportation: $90,000
Natural Resources - Other: $36,000
Natural Resources - Other: $32,000
- General - Interest on Debt: $867,000
Interest on Debt: $792,000
- Long Term Debt - Beginning Outstanding - Unspecified Public Purpose: $28,218,000
Outstanding Unspecified Public Purpose: $27,275,000
Beginning Outstanding - Unspecified Public Purpose: $26,332,000
Outstanding Unspecified Public Purpose: $25,389,000
Retired Unspecified Public Purpose: $943,000
Retired Unspecified Public Purpose: $943,000
- Miscellaneous - General Revenue - Other: $3,321,000
General Revenue - Other: $2,786,000
Donations From Private Sources: $62,000
Donations From Private Sources: $52,000
Interest Earnings: $39,000
Interest Earnings: $32,000
- Other Funds - Cash and Securities: $46,631,000
Cash and Securities: $36,917,000
- State Intergovernmental - General Local Government Support: $1,680,000
General Local Government Support: $1,605,000
Other: $105,000
Other: $100,000
- Tax - Property: $29,837,000
Property: $27,607,000
Other License: $1,312,000
Other License: $1,214,000
- Total Salaries and Wages: $13,047,000
: $12,313,000
Fairfield County government finances - Cash and Securities in 2018:
- Charges - Other: $18,000
Other: $17,000
- Current Operations - Central Staff Services: $5,821,000
Police Protection: $5,789,000
Central Staff Services: $5,233,000
Police Protection: $5,204,000
Health - Other: $4,147,000
Health - Other: $3,728,000
General - Other: $2,830,000
General - Other: $2,545,000
Solid Waste Management: $2,458,000
Correctional Institutions: $2,234,000
Solid Waste Management: $2,210,000
Correctional Institutions: $2,008,000
Financial Administration: $1,909,000
Financial Administration: $1,716,000
Libraries: $1,403,000
Libraries: $1,262,000
Hospitals: $1,209,000
Hospitals: $1,087,000
General Public Buildings: $973,000
Judicial and Legal Services: $887,000
Parks and Recreation: $882,000
General Public Buildings: $875,000
Judicial and Legal Services: $797,000
Parks and Recreation: $793,000
Local Fire Protection: $679,000
Local Fire Protection: $610,000
Air Transportation: $100,000
Air Transportation: $90,000
Natural Resources - Other: $36,000
Natural Resources - Other: $32,000
- General - Interest on Debt: $867,000
Interest on Debt: $792,000
- Long Term Debt - Beginning Outstanding - Unspecified Public Purpose: $28,218,000
Outstanding Unspecified Public Purpose: $27,275,000
Beginning Outstanding - Unspecified Public Purpose: $26,332,000
Outstanding Unspecified Public Purpose: $25,389,000
Retired Unspecified Public Purpose: $943,000
Retired Unspecified Public Purpose: $943,000
- Miscellaneous - General Revenue - Other: $3,321,000
General Revenue - Other: $2,786,000
Donations From Private Sources: $62,000
Donations From Private Sources: $52,000
Interest Earnings: $39,000
Interest Earnings: $32,000
- Other Funds - Cash and Securities: $46,631,000
Cash and Securities: $36,917,000
- State Intergovernmental - General Local Government Support: $1,680,000
General Local Government Support: $1,605,000
Other: $105,000
Other: $100,000
- Tax - Property: $29,837,000
Property: $27,607,000
Other License: $1,312,000
Other License: $1,214,000
- Total Salaries and Wages: $13,047,000
: $12,313,000
Supplemental Security Income (SSI) in 2006:
- Total number of recipients: 850
- Number of aged recipients: 119
- Number of blind and disabled recipients: 731
- Number of recipients under 18: 144
- Number of recipients between 18 and 64: 462
- Number of recipients older than 64: 244
- Number of recipients also receiving OASDI: 338
- Amount of payments (thousands of dollars): 345
| Most common first names in Fairfield County, SC among deceased individuals | ||
| Name | Count | Lived (average) |
|---|---|---|
| James | 231 | 70.1 years |
| John | 211 | 71.9 years |
| Willie | 162 | 72.5 years |
| Mary | 160 | 78.0 years |
| Robert | 129 | 71.2 years |
| William | 125 | 74.2 years |
| Annie | 73 | 78.9 years |
| George | 71 | 71.6 years |
| David | 63 | 67.2 years |
| Henry | 55 | 75.2 years |
| Most common last names in Fairfield County, SC among deceased individuals | ||
| Last name | Count | Lived (average) |
|---|---|---|
| Johnson | 101 | 70.9 years |
| Branham | 95 | 74.4 years |
| Davis | 91 | 73.7 years |
| Smith | 90 | 75.4 years |
| Belton | 72 | 70.4 years |
| Brown | 65 | 73.3 years |
| Young | 65 | 68.1 years |
| Jackson | 60 | 75.0 years |
| Murphy | 56 | 75.0 years |
| Kennedy | 56 | 74.0 years |
| Businesses in Fairfield County, SC | ||||
| Name | Count | Name | Count | |
|---|---|---|---|---|
| Advance Auto Parts | 1 | McDonald's | 1 | |
| AutoZone | 1 | Pizza Hut | 1 | |
| CVS | 1 | Ramada | 1 | |
| Chevrolet | 1 | SONIC Drive-In | 1 | |
| Dairy Queen | 1 | Subway | 1 | |
| Days Inn | 1 | True Value | 1 | |
| Dunkin Donuts | 1 | UPS | 2 | |
| FedEx | 1 | Waffle House | 1 | |
| H&R Block | 1 | Walmart | 1 | |
| KFC | 1 | Wendy's | 2 | |