De Baca County, New Mexico (NM)
County owner-occupied free and clear houses and condos in 2010: 446
County owner-occupied houses and condos in 2000: 717
Renter-occupied apartments: 234 (it was 205 in 2000)
| % of renters here: | 22% |
| State: | 31% |
Land area: 2325 sq. mi.
Water area: 9.0 sq. mi.
Population density: 1 people per square mile (very low).
Industries providing employment: Transportation and warehousing,and utilities (25.7%), Construction (24.4%), Agriculture,forestry,fishing and hunting, and mining (20.2%).
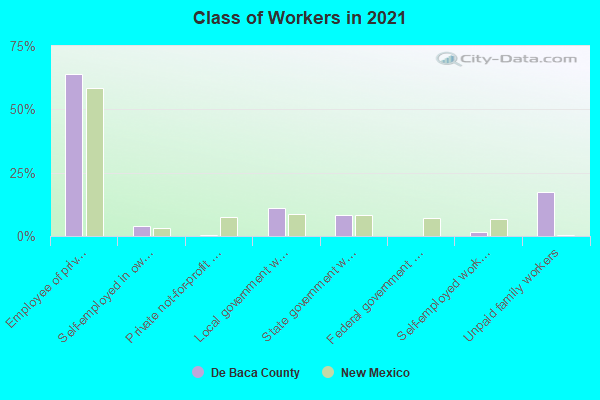
Type of workers:
- Private wage or salary: 68%
- Government: 7%
- Self-employed, not incorporated: 5%
- Unpaid family work: 20%
- OSM Map
- General Map
- Google Map
- MSN Map

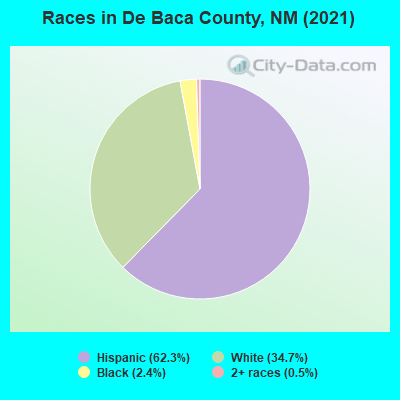
- 1,08464.0%Hispanic or Latino
- 57934.2%White Non-Hispanic Alone
- 301.8%Two or more races
| Median resident age: | 29.1 years |
| New Mexico median age: | 39.4 years |
| Males: 1,057 | |
| Females: 638 |

 | Quietest Places in NM..Least Man-Made Noise? (32 replies) |
| De Baca County: | 2.0 people |
| New Mexico: | 3 people |
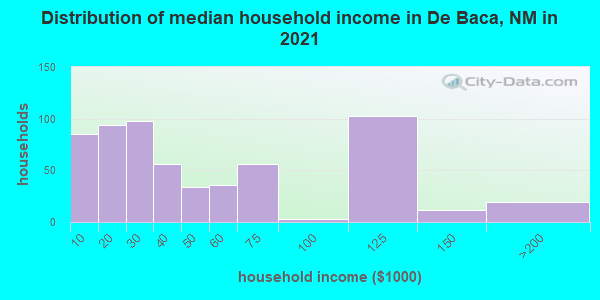
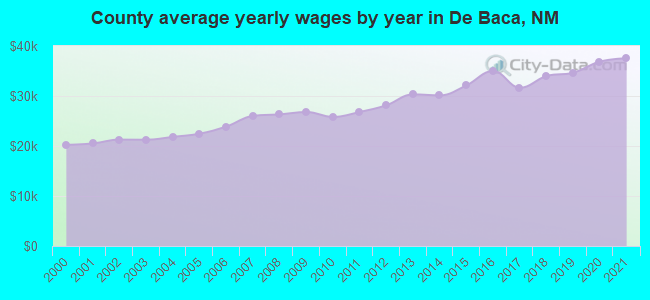
Estimated median household income in 2022: $35,295 ($25,441 in 1999)
| This county: | $35,295 |
| New Mexico: | $59,726 |
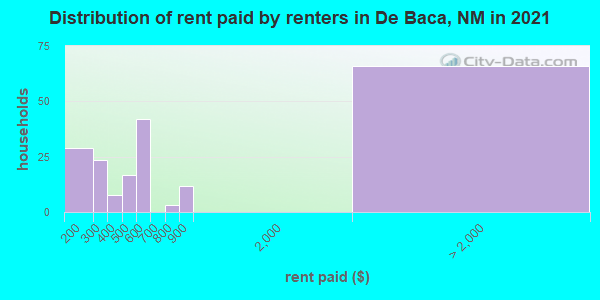
Median contract rent in 2022 for apartments: $431 (lower quartile is $197, upper quartile is $538)
| This county: | $431 |
| State: | $816 |
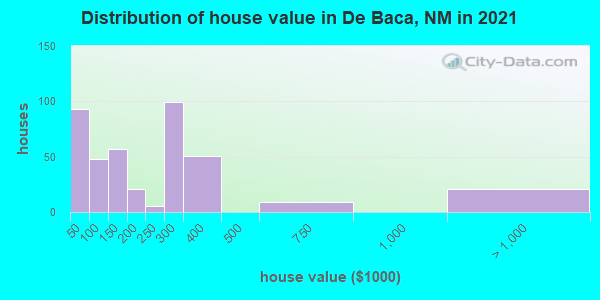
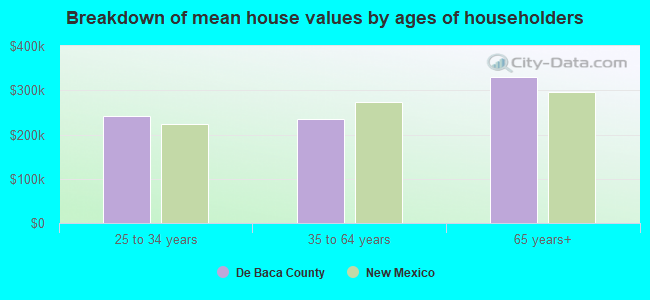
Estimated median house or condo value in 2022: $246,701 (it was $51,300 in 2000)
| De Baca: | $246,701 |
| New Mexico: | $243,100 |
Mean price in 2022:
Median monthly housing costs for homes and condos with a mortgage: $1,771Detached houses: $398,083
Here: $398,083 State: $322,045 Mobile homes: $81,578
Here: $81,578 State: $117,675
Median monthly housing costs for units without a mortgage: $345
Institutionalized population: 9
Crime in 2020 (reported by the sheriff's office or county police, not the county total):
- Murders: 0
- Rapes: 0
- Robberies: 0
- Assaults: 2
- Burglaries: 6
- Thefts: 7
- Auto thefts: 0
Crime in 2019 (reported by the sheriff's office or county police, not the county total):
- Murders: 0
- Rapes: 1
- Robberies: 0
- Assaults: 3
- Burglaries: 11
- Thefts: 2
- Auto thefts: 2
Median real estate property taxes paid for housing units with mortgages in 2022: $1,770 (0.6%)
Median real estate property taxes paid for housing units with no mortgage in 2022: $601 (0.4%)
| De Baca County: | 15.6% |
| New Mexico: | 17.6% |
Median age of residents in 2022: 29.1 years old
(Males: 28.6 years old, Females: 37.5 years old)
(Median age for: White residents: 60.6 years old, Hispanic or Latino residents: 28.4 years old, Other race residents: 26.9 years old)
Fair market rent in 2006 for a 1-bedroom apartment in De Baca County is $390 a month.
Fair market rent for a 2-bedroom apartment is $456 a month.
Fair market rent for a 3-bedroom apartment is $615 a month.
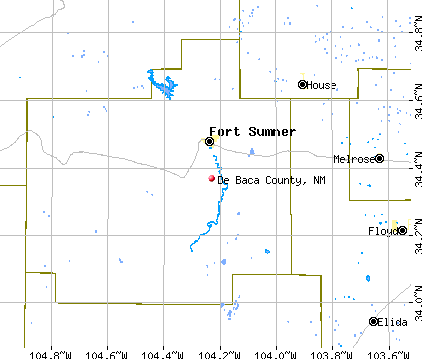
Cities in this county include: East De Baca, Fort Sumner, West De Baca, Lake Sumner.
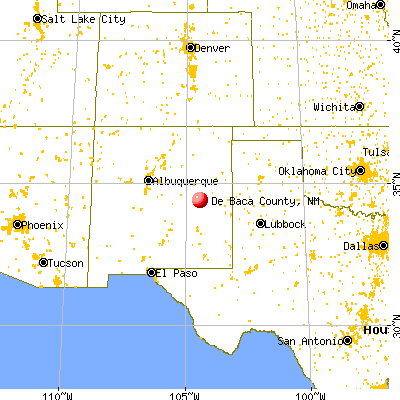
Neighboring counties: Greer County, Oklahoma  , Jackson County, Oklahoma , Johnston County, Oklahoma , Childress County, Texas , Marion County, Tennessee .
| Here: | 2.9% |
| New Mexico: | 3.6% |

Current college students: 42
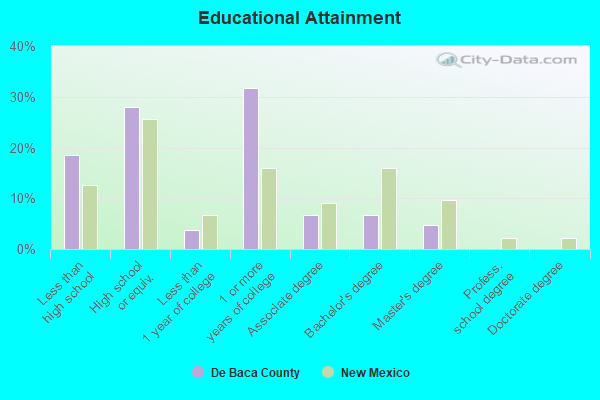
People 25 years of age or older with a high school degree or higher: 84.6%
People 25 years of age or older with a bachelor's degree or higher: 9.2%
Number of foreign born residents: 5 (59.2% naturalized citizens)
| De Baca County: | 0.3% |
| Whole state: | 9.3% |
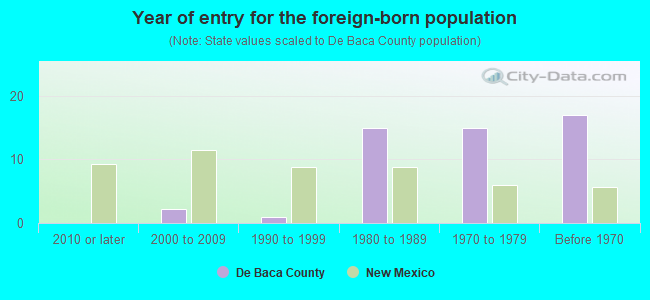
- Year of entry for the foreign-born population
- 02010 or later
- 22000 to 2009
- 01990 to 1999
- 151980 to 1989
- 151970 to 1979
- 17Before 1970
Mean travel time to work (commute): minutes
Percentage of county residents living and working in this county: 98.7%
Housing units in structures:
- One, detached: 873
- Two: 45
- Mobile homes: 248
Housing units in De Baca County with a mortgage: 210 (0 second mortgage, 0 home equity loan, 0 both second mortgage and home equity loan)
Houses without a mortgage: 0
| Here: | 100.0% with mortgage |
| State: | 98.8% with mortgage |
Religion statistics for De Baca County
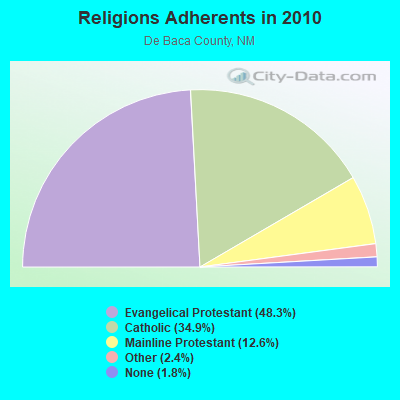
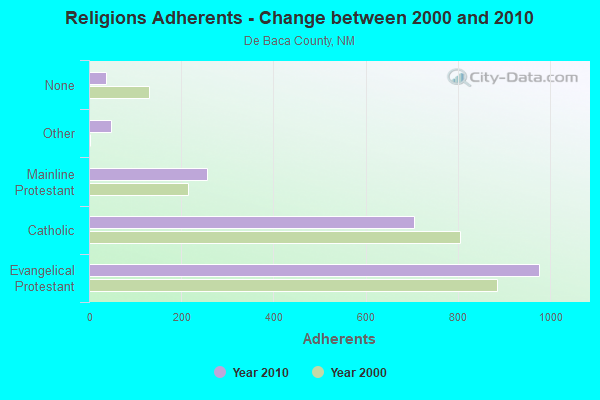
| Religion | Adherents | Congregations |
|---|---|---|
| Evangelical Protestant | 977 | 4 |
| Catholic | 705 | 1 |
| Mainline Protestant | 255 | 2 |
| Other | 48 | 1 |
| None | 37 | - |
Source: Clifford Grammich, Kirk Hadaway, Richard Houseal, Dale E.Jones, Alexei Krindatch, Richie Stanley and Richard H.Taylor. 2012. 2010 U.S.Religion Census: Religious Congregations & Membership Study. Association of Statisticians of American Religious Bodies. Jones, Dale E., et al. 2002. Congregations and Membership in the United States 2000. Nashville, TN: Glenmary Research Center.
Food Environment Statistics:
| De Baca County: | 10.51 / 10,000 pop. |
| State: | 1.44 / 10,000 pop. |
| De Baca County: | 10.51 / 10,000 pop. |
| New Mexico: | 4.06 / 10,000 pop. |
| This county: | 10.51 / 10,000 pop. |
| State: | 7.12 / 10,000 pop. |
| De Baca County: | 7.7% |
| New Mexico: | 6.4% |
| De Baca County: | 22.4% |
| State: | 22.1% |
Agriculture in De Baca County:
Average size of farms: 7497 acresAverage value of agricultural products sold per farm: $81,069
Average value of crops sold per acre for harvested cropland: $563.35
The value of livestock, poultry, and their products as a percentage of the total market value of agricultural products sold: 76.39%
Average total farm production expenses per farm: $71,311
Harvested cropland as a percentage of land in farms: 0.45%
Irrigated harvested cropland as a percentage of land in farms: 98.75%
Average market value of all machinery and equipment per farm: $49,028
The percentage of farms operated by a family or individual: 83.51%
Average age of principal farm operators: 55 years
Average number of cattle and calves per 100 acres of all land in farms: 2.20
Milk cows as a percentage of all cattle and calves: 0.03%
Land in orchards: 11 acres
Earthquake activity:
De Baca County-area historical earthquake activity is significantly above New Mexico state average. It is 480% greater than the overall U.S. average.On 8/23/2011 at 05:46:18, a magnitude 5.3 (5.3 MW, Depth: 2.5 mi, Class: Moderate, Intensity: VI - VII) earthquake occurred 188.5 miles away from De Baca County center
On 4/14/1995 at 00:32:56, a magnitude 5.7 (5.6 MB, 5.7 MS, 5.7 MW, Depth: 11.1 mi) earthquake occurred 287.1 miles away from the county center
On 1/2/1992 at 11:45:35, a magnitude 5.0 (4.6 MB, 5.0 LG, Depth: 3.1 mi) earthquake occurred 154.9 miles away from the county center
On 6/16/1978 at 11:46:54, a magnitude 5.3 (4.4 MB, 4.6 UK, 5.3 ML) earthquake occurred 219.8 miles away from the county center
On 8/10/2005 at 22:08:22, a magnitude 5.0 (5.0 MB, 4.7 MS, 5.0 MW) earthquake occurred 179.3 miles away from De Baca County center
On 8/10/2005 at 22:08:22, a magnitude 5.0 (5.0 MW, Depth: 3.1 mi) earthquake occurred 181.7 miles away from the county center
Magnitude types: regional Lg-wave magnitude (LG), body-wave magnitude (MB), local magnitude (ML), surface-wave magnitude (MS), moment magnitude (MW)
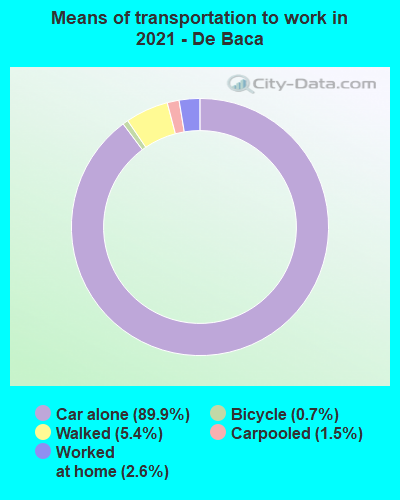
Means of transportation to work:
- Drove a car alone: 742 (87.9%)
- Carpooled: 25 (3.0%)
- Walked: 34 (4.0%)
- Worked at home: 18 (2.1%)
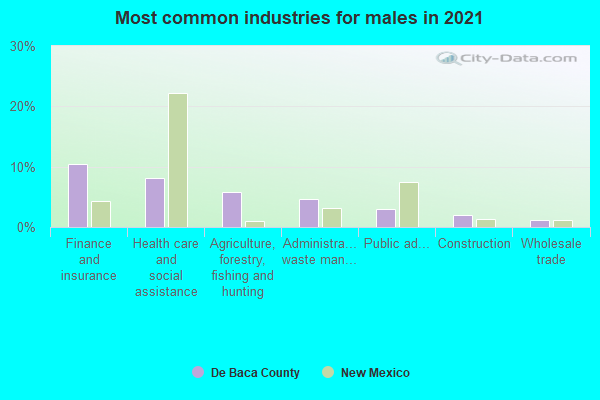
- Finance and insurance (7%)
- Health care and social assistance (7%)
- Agriculture, forestry, fishing and hunting (4%)
- Administrative and support and waste management services (2%)
- Public administration (2%)
- Educational services (1%)
- Construction (1%)
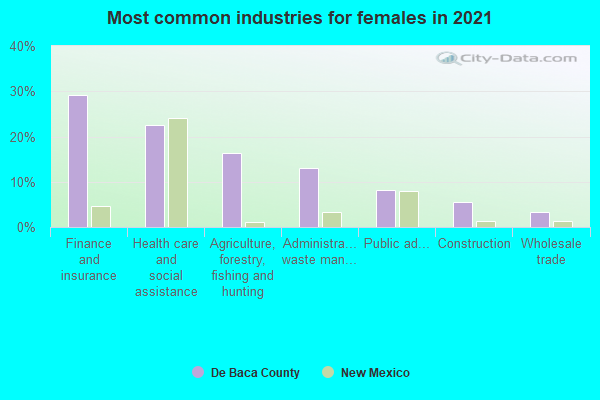
- Finance and insurance (27%)
- Health care and social assistance (27%)
- Agriculture, forestry, fishing and hunting (15%)
- Administrative and support and waste management services (9%)
- Public administration (9%)
- Educational services (3%)
- Construction (3%)
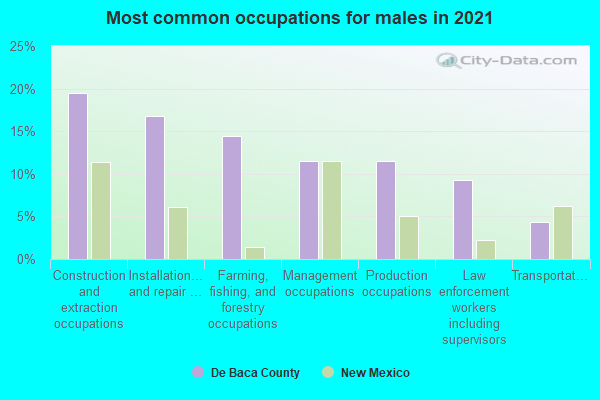
- Installation, maintenance, and repair occupations (24%)
- Construction and extraction occupations (18%)
- Farming, fishing, and forestry occupations (15%)
- Production occupations (15%)
- Management occupations (11%)
- Building and grounds cleaning and maintenance occupations (3%)
- Healthcare support occupations (3%)
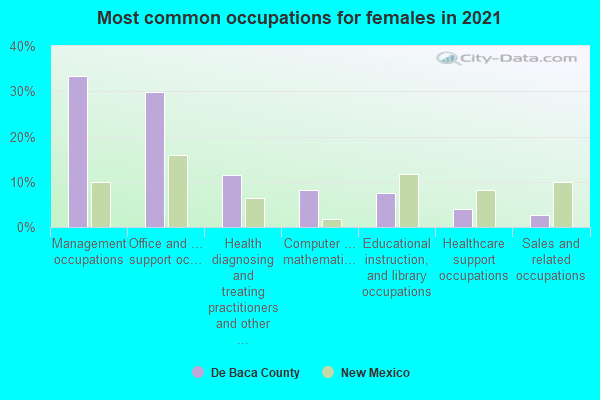
- Office and administrative support occupations (33%)
- Management occupations (29%)
- Educational instruction, and library occupations (8%)
- Health diagnosing and treating practitioners and other technical occupations (8%)
- Health technologists and technicians (6%)
- Healthcare support occupations (6%)
- Sales and related occupations (5%)
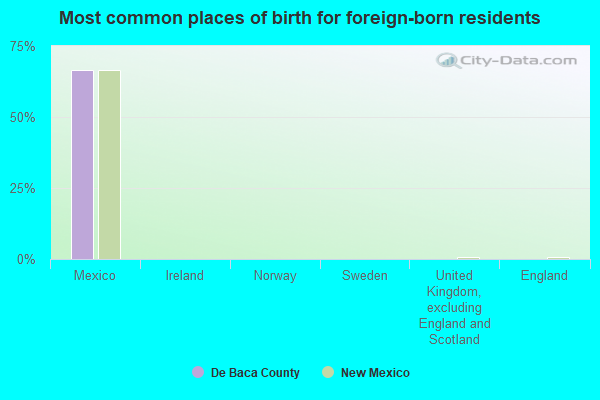
- Mexico (40%)
- United Kingdom, excluding England and Scotland (20%)
- Ireland (0%)
- Norway (0%)
- Sweden (0%)
- England (0%)
- Scotland (0%)
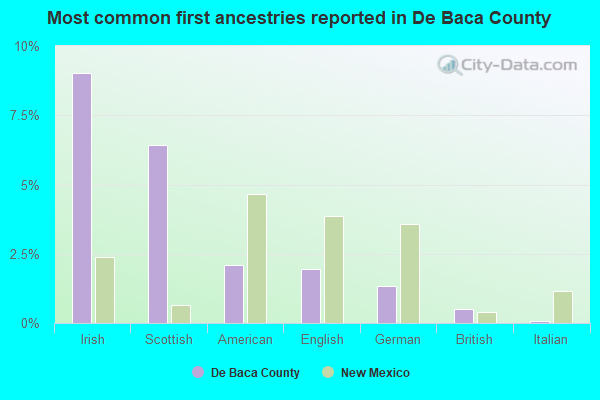
- Irish (9%)
- American (3%)
- German (2%)
- English (2%)
- British (1%)
- Italian (1%)
- Scottish (0%)
66 people in nursing homes
5 people in local jails and other confinement facilities (including police lockups)
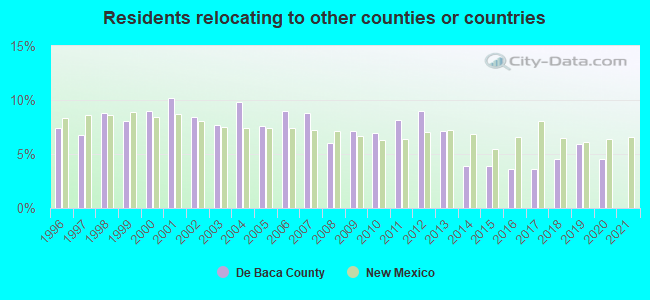
4.17% of this county's 2021 resident taxpayers lived in other counties in 2020 ($32,080 average adjusted gross income)
| Here: | 4.17% |
| New Mexico average: | 6.50% |
10 or fewer of this county's residents moved from foreign countries.
4.17% relocated from other counties in New Mexico ($32,080 average AGI)
10 or fewer of this county's residents relocated from other states.

10 or fewer of this county's residents relocated to other counties between 2020 and 2021.1,000 average adjusted gross income)
10 or fewer of this county's residents moved to foreign countries.
10 or fewer of this county's residents relocated to other counties in New Mexico.
10 or fewer of this county's residents relocated to other states.
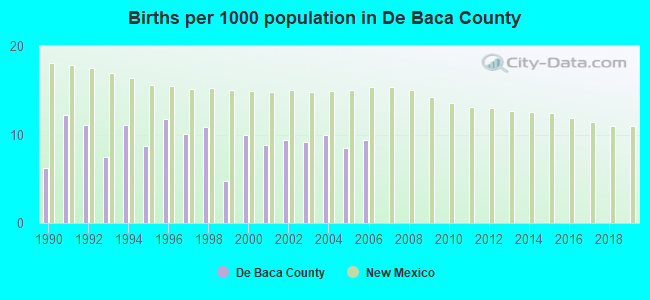
Births per 1000 population from 1990 to 1999: 9.4
Births per 1000 population from 2000 to 2006: 9.3
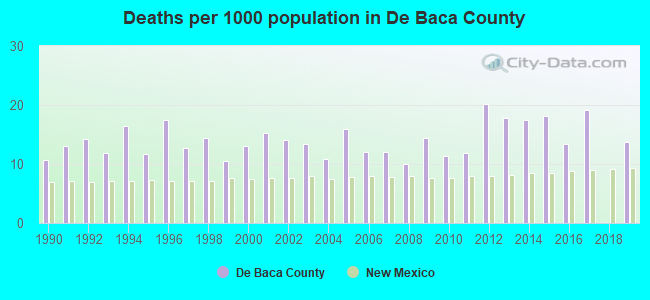
Deaths per 1000 population from 1990 to 1999: 13.3
Deaths per 1000 population from 2000 to 2009: 13.1
Deaths per 1000 population from 2010 to 2020: 14.9
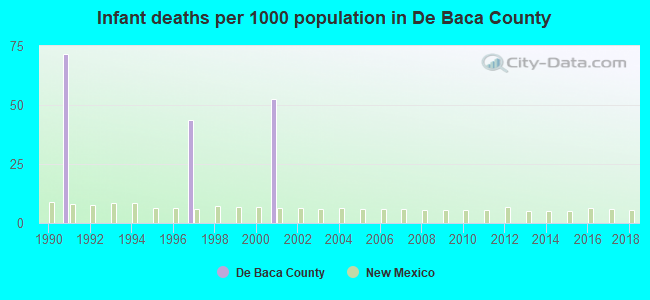
Infant deaths per 1000 live births from 1990 to 1999: 11.5
Infant deaths per 1000 live births from 2000 to 2006: 7.5
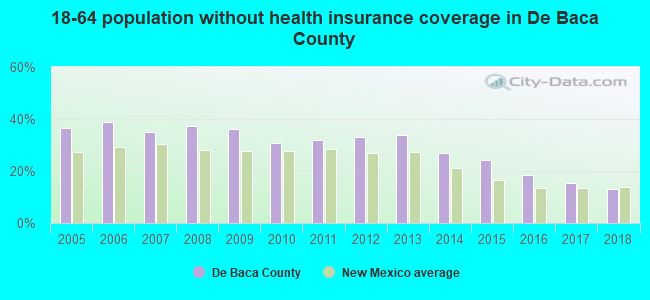
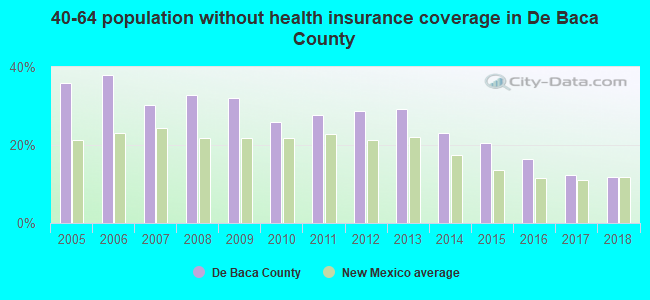
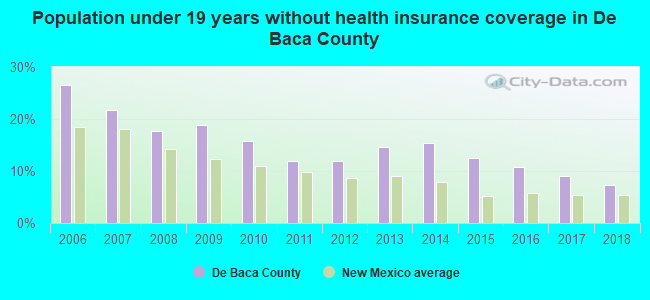
Persons under 19 years old without health insurance coverage in 2018: 7.3%
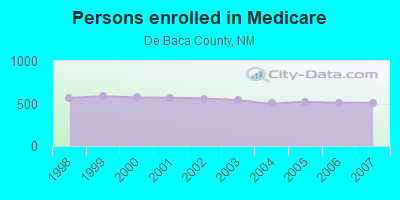
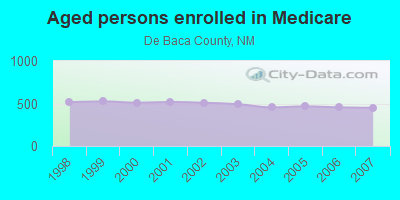
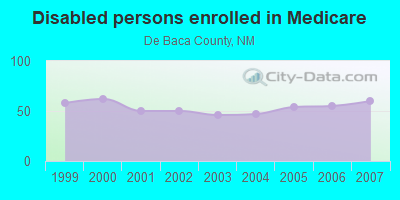
Persons enrolled in hospital insurance and/or supplemental medical insurance (Medicare) in July 1, 2007: 509 (449 aged, 60 disabled)
Children under 18 without health insurance coverage in 2007: 78 (25%)
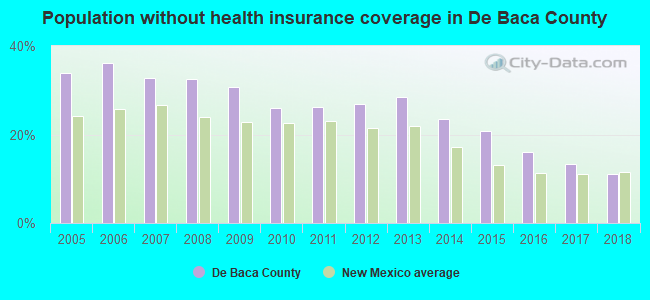
Population without health insurance coverage in 2000: 27%
Children under 18 without health insurance coverage in 2000: 25%
Medical specialist MDs per 100,000 population in 2005: 496
Total births per 100,000 population, July 2005 - July 2006 : 42
Total deaths per 100,000 population, July 2005 - July 2006: 50
Household type by relationship:
Households: 1,695- Male householders: 538 (265 living alone), Female householders: 232 (157 living alone)
168 spouses (168 opposite-sex spouses), 74 unmarried partners, (74 opposite-sex unmarried partners), 463 children (390 natural, 20 adopted, 56 stepchildren), 155 grandchildren, 0 brothers or sisters, 8 parents, 0 foster children, 0 other relatives, 36 non-relatives
- In group quarters: 16
Size of family households: 99 2-persons, 37 3-persons, 18 4-persons, 162 5-persons, 19 6-persons.
Size of nonfamily households: 423 1-person, 16 2-persons.
153 married couples with children.
241 single-parent households (220 men, 21 women).
58.9% of residents of De Baca speak English at home.
38.8% of residents speak Spanish at home (97% speak English very well, 1% speak English well, 2% speak English not well).
0.7% of residents speak other Indo-European language at home (100% speak English very well).
In fiscal year 2004:
Federal Government expenditure: $18,663,000 ($9,171 per capita)
Department of Defense expenditure: $452,000
Federal direct payments to individuals for retirement and disability: $7,552,000
Federal other direct payments to individuals: $3,719,000
Federal direct payments not to individuals: $709,000
Federal grants: $5,658,000
Federal procurement contracts: $243,000 ($78,000 Department of Defense)
Federal salaries and wages: $781,000 ($0,000 Department of Defense)
Federal Government direct loans: $25,000
Federal guaranteed/insured loans: $267,000
Federal Government insurance: $121,000
Population change from April 1, 2000 to July 1, 2005:
Births: 103| Here: | 51 per 1000 residents |
| State: | 74 per 1000 residents |
Deaths: 140
| Here: | 69 per 1000 residents |
| State: | 36 per 1000 residents |
Net international migration: 0
| Here: | 0 per 1000 residents |
| State: | +15 per 1000 residents |
Net internal migration: -177
| Here: | |
| State: |
Total withdrawal of fresh water for public supply: 0.35 millions of gallons per day (all from ground)
| Here: | 6.7 |
| State: | 5.9 |
| Here: | 4.9 |
| State: | 4.2 |
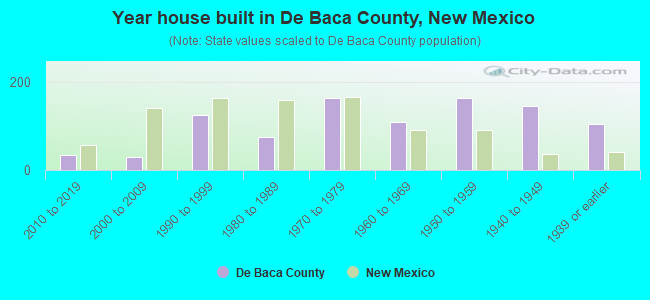
- Year house built in De Baca County, New Mexico
- 02020 or later
- 632010 to 2019
- 222000 to 2009
- 1801990 to 1999
- 781980 to 1989
- 1801970 to 1979
- 1241960 to 1969
- 2451950 to 1959
- 1341940 to 1949
- 1111939 or earlier
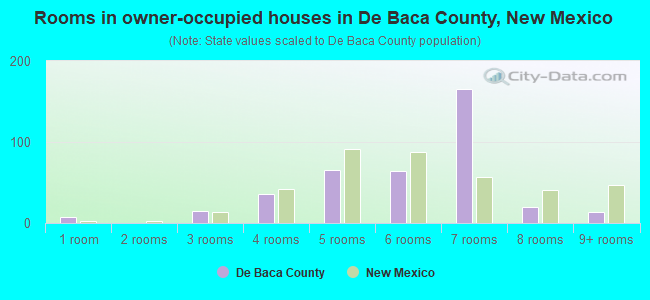
- Rooms in owner-occupied houses in De Baca County, New Mexico
- 81 room
- 02 rooms
- 213 rooms
- 554 rooms
- 795 rooms
- 586 rooms
- 2717 rooms
- 388 rooms
- 179+ rooms
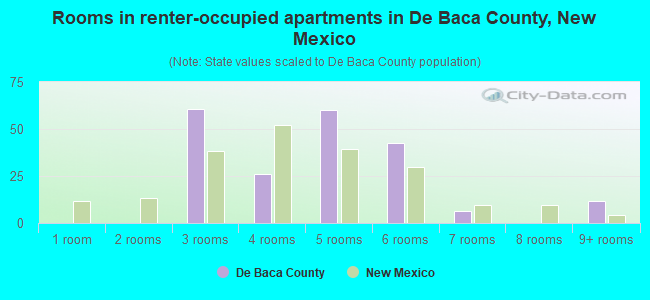
- Rooms in renter-occupied apartments in De Baca County, New Mexico
- 01 room
- 02 rooms
- 373 rooms
- 264 rooms
- 1145 rooms
- 276 rooms
- 47 rooms
- 108 rooms
- 89+ rooms
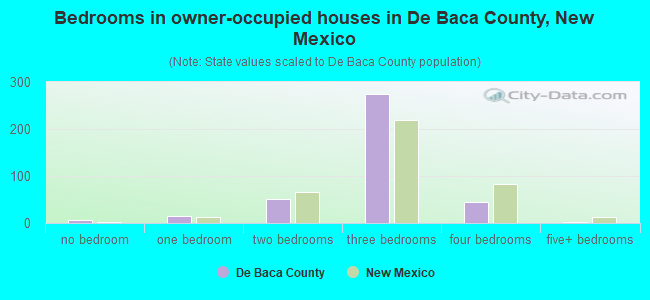
- Bedrooms in owner-occupied houses in De Baca County, New Mexico
- 8no bedroom
- 181 bedroom
- 752 bedrooms
- 3863 bedrooms
- 454 bedrooms
- 65+ bedrooms
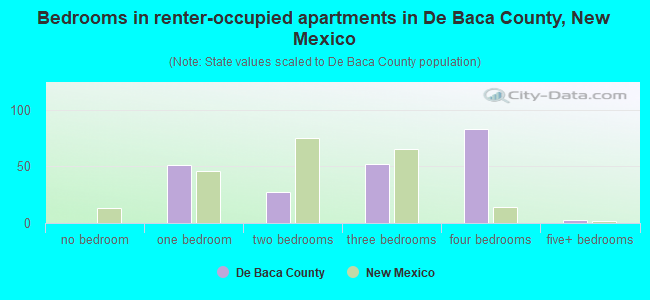
- Bedrooms in renter-occupied apartments in De Baca County, New Mexico
- 0no bedroom
- 361 bedroom
- 342 bedrooms
- 373 bedrooms
- 1074 bedrooms
- 45+ bedrooms
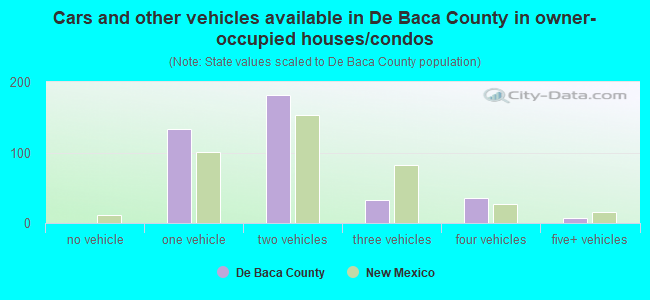
- Cars and other vehicles available in De Baca County in owner-occupied houses/condos
- 0no vehicle
- 1781 vehicle
- 3042 vehicles
- 143 vehicles
- 374 vehicles
- 75+ vehicles
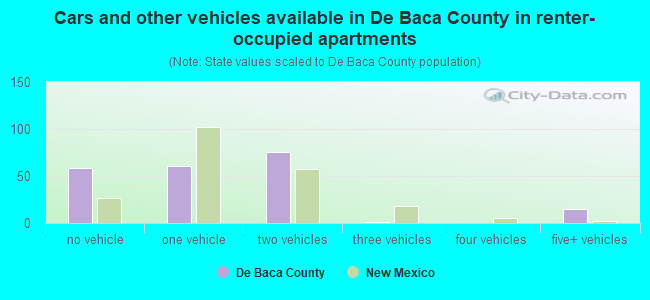
- Cars and other vehicles available in De Baca County in renter-occupied apartments
- 39no vehicle
- 721 vehicle
- 1152 vehicles
- 33 vehicles
- 04 vehicles
- 05+ vehicles
77.9% of De Baca County residents lived in the same house 1 years ago.
Out of people who lived in different houses, 44% lived in this county.
Out of people who lived in different counties, 37% lived in New Mexico.
| De Baca County: | 77.9% |
| State average: | 88.2% |
Place of birth for U.S.-born residents:
- This state: 1,287
- Other state: 376
- Northeast: 29
- Midwest: 24
- South: 218
- West: 103
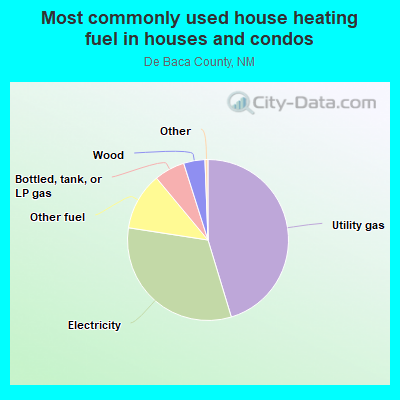
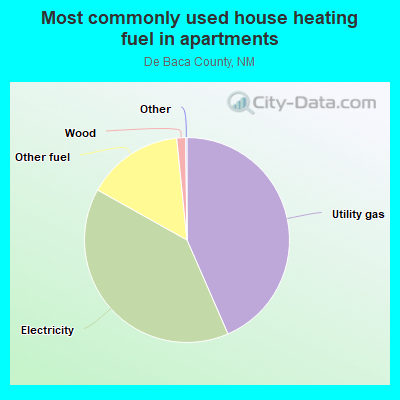
- 40.4%Electricity
- 34.5%Utility gas
- 12.0%Other fuel
- 7.2%Wood
- 6.0%Bottled, tank, or LP gas
- 61.5%Electricity
- 29.7%Utility gas
- 4.6%Other fuel
- 2.5%Wood
- 1.7%Bottled, tank, or LP gas
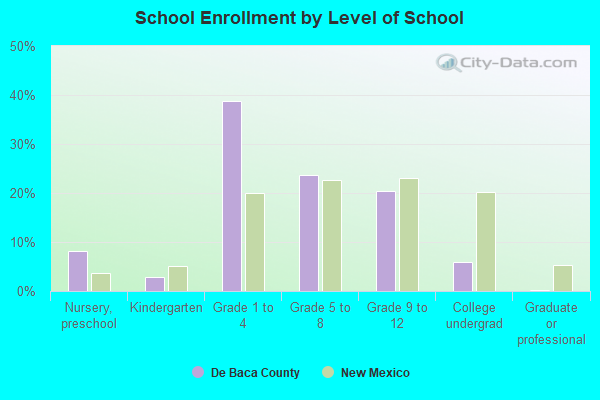
Private vs. public school enrollment:
| Here: | 13.1% |
| New Mexico: | 10.2% |
| Here: | 0.0% |
| New Mexico: | 10.0% |
| Here: | 0.0% |
| New Mexico: | 12.3% |

De Baca County government finances - Expenditure in 2018:
- Charges - Hospital Public: $2,801,000
Solid Waste Management: $351,000
Solid Waste Management: $259,000
Other: $205,000
Parks and Recreation: $1,000
- Construction - Regular Highways: $211,000
- Current Operations - Hospitals: $3,839,000
Regular Highways: $1,035,000
Toll Highways: $709,000
Solid Waste Management: $560,000
General - Other: $542,000
Financial Administration: $488,000
Correctional Institutions: $486,000
Correctional Institutions: $419,000
Police Protection: $407,000
Police Protection: $389,000
Solid Waste Management: $386,000
Central Staff Services: $362,000
Financial Administration: $317,000
Parks and Recreation: $118,000
Local Fire Protection: $114,000
Central Staff Services: $114,000
Local Fire Protection: $70,000
Health - Other: $60,000
Public Welfare, Vendor Payments for Medical Care: $54,000
Natural Resources - Other: $45,000
Judicial and Legal Services: $13,000
Judicial and Legal Services: $12,000
Regular Highways: $8,000
Corrections - Other: $8,000
- General - Interest on Debt: $31,000
Interest on Debt: $28,000
- Long Term Debt - Beginning Outstanding - Unspecified Public Purpose: $939,000
Outstanding Unspecified Public Purpose: $817,000
Beginning Outstanding - Unspecified Public Purpose: $695,000
Outstanding Unspecified Public Purpose: $573,000
Retired Unspecified Public Purpose: $122,000
Retired Unspecified Public Purpose: $122,000
- Miscellaneous - General Revenue - Other: $249,000
General Revenue - Other: $119,000
Fines and Forfeits: $51,000
Interest Earnings: $36,000
Interest Earnings: $12,000
Fines and Forfeits: $9,000
- Other Capital Outlay - Solid Waste Management: $296,000
Toll Highways: $134,000
Police Protection: $52,000
Correctional Institutions: $7,000
- Other Funds - Cash and Securities: $3,762,000
- Sinking Funds - Cash and Securities: $6,263,000
- State Intergovernmental - Other: $1,010,000
General Local Government Support: $808,000
Highways: $425,000
Health and Hospitals: $9,000
- Tax - Property: $2,426,000
Property: $946,000
General Sales and Gross Receipts: $243,000
General Sales and Gross Receipts: $234,000
Motor Vehicle License: $19,000
Other License: $2,000
Occupation and Business License - Other: $1,000
- Total Salaries and Wages: $1,080,000
: $127,000
De Baca County government finances - Revenue in 2018:
- Charges - Hospital Public: $2,801,000
Solid Waste Management: $351,000
Solid Waste Management: $259,000
Other: $205,000
Parks and Recreation: $1,000
- Construction - Regular Highways: $211,000
- Current Operations - Hospitals: $3,839,000
Regular Highways: $1,035,000
Toll Highways: $709,000
Solid Waste Management: $560,000
General - Other: $542,000
Financial Administration: $488,000
Correctional Institutions: $486,000
Correctional Institutions: $419,000
Police Protection: $407,000
Police Protection: $389,000
Solid Waste Management: $386,000
Central Staff Services: $362,000
Financial Administration: $317,000
Parks and Recreation: $118,000
Local Fire Protection: $114,000
Central Staff Services: $114,000
Local Fire Protection: $70,000
Health - Other: $60,000
Public Welfare, Vendor Payments for Medical Care: $54,000
Natural Resources - Other: $45,000
Judicial and Legal Services: $13,000
Judicial and Legal Services: $12,000
Regular Highways: $8,000
Corrections - Other: $8,000
- General - Interest on Debt: $31,000
Interest on Debt: $28,000
- Long Term Debt - Beginning Outstanding - Unspecified Public Purpose: $939,000
Outstanding Unspecified Public Purpose: $817,000
Beginning Outstanding - Unspecified Public Purpose: $695,000
Outstanding Unspecified Public Purpose: $573,000
Retired Unspecified Public Purpose: $122,000
Retired Unspecified Public Purpose: $122,000
- Miscellaneous - General Revenue - Other: $249,000
General Revenue - Other: $119,000
Fines and Forfeits: $51,000
Interest Earnings: $36,000
Interest Earnings: $12,000
Fines and Forfeits: $9,000
- Other Capital Outlay - Solid Waste Management: $296,000
Toll Highways: $134,000
Police Protection: $52,000
Correctional Institutions: $7,000
- Other Funds - Cash and Securities: $3,762,000
- Sinking Funds - Cash and Securities: $6,263,000
- State Intergovernmental - Other: $1,010,000
General Local Government Support: $808,000
Highways: $425,000
Health and Hospitals: $9,000
- Tax - Property: $2,426,000
Property: $946,000
General Sales and Gross Receipts: $243,000
General Sales and Gross Receipts: $234,000
Motor Vehicle License: $19,000
Other License: $2,000
Occupation and Business License - Other: $1,000
- Total Salaries and Wages: $1,080,000
: $127,000
De Baca County government finances - Debt in 2018:
- Charges - Hospital Public: $2,801,000
Solid Waste Management: $351,000
Solid Waste Management: $259,000
Other: $205,000
Parks and Recreation: $1,000
- Construction - Regular Highways: $211,000
- Current Operations - Hospitals: $3,839,000
Regular Highways: $1,035,000
Toll Highways: $709,000
Solid Waste Management: $560,000
General - Other: $542,000
Financial Administration: $488,000
Correctional Institutions: $486,000
Correctional Institutions: $419,000
Police Protection: $407,000
Police Protection: $389,000
Solid Waste Management: $386,000
Central Staff Services: $362,000
Financial Administration: $317,000
Parks and Recreation: $118,000
Local Fire Protection: $114,000
Central Staff Services: $114,000
Local Fire Protection: $70,000
Health - Other: $60,000
Public Welfare, Vendor Payments for Medical Care: $54,000
Natural Resources - Other: $45,000
Judicial and Legal Services: $13,000
Judicial and Legal Services: $12,000
Regular Highways: $8,000
Corrections - Other: $8,000
- General - Interest on Debt: $31,000
Interest on Debt: $28,000
- Long Term Debt - Beginning Outstanding - Unspecified Public Purpose: $939,000
Outstanding Unspecified Public Purpose: $817,000
Beginning Outstanding - Unspecified Public Purpose: $695,000
Outstanding Unspecified Public Purpose: $573,000
Retired Unspecified Public Purpose: $122,000
Retired Unspecified Public Purpose: $122,000
- Miscellaneous - General Revenue - Other: $249,000
General Revenue - Other: $119,000
Fines and Forfeits: $51,000
Interest Earnings: $36,000
Interest Earnings: $12,000
Fines and Forfeits: $9,000
- Other Capital Outlay - Solid Waste Management: $296,000
Toll Highways: $134,000
Police Protection: $52,000
Correctional Institutions: $7,000
- Other Funds - Cash and Securities: $3,762,000
- Sinking Funds - Cash and Securities: $6,263,000
- State Intergovernmental - Other: $1,010,000
General Local Government Support: $808,000
Highways: $425,000
Health and Hospitals: $9,000
- Tax - Property: $2,426,000
Property: $946,000
General Sales and Gross Receipts: $243,000
General Sales and Gross Receipts: $234,000
Motor Vehicle License: $19,000
Other License: $2,000
Occupation and Business License - Other: $1,000
- Total Salaries and Wages: $1,080,000
: $127,000
De Baca County government finances - Cash and Securities in 2018:
- Charges - Hospital Public: $2,801,000
Solid Waste Management: $351,000
Solid Waste Management: $259,000
Other: $205,000
Parks and Recreation: $1,000
- Construction - Regular Highways: $211,000
- Current Operations - Hospitals: $3,839,000
Regular Highways: $1,035,000
Toll Highways: $709,000
Solid Waste Management: $560,000
General - Other: $542,000
Financial Administration: $488,000
Correctional Institutions: $486,000
Correctional Institutions: $419,000
Police Protection: $407,000
Police Protection: $389,000
Solid Waste Management: $386,000
Central Staff Services: $362,000
Financial Administration: $317,000
Parks and Recreation: $118,000
Local Fire Protection: $114,000
Central Staff Services: $114,000
Local Fire Protection: $70,000
Health - Other: $60,000
Public Welfare, Vendor Payments for Medical Care: $54,000
Natural Resources - Other: $45,000
Judicial and Legal Services: $13,000
Judicial and Legal Services: $12,000
Regular Highways: $8,000
Corrections - Other: $8,000
- General - Interest on Debt: $31,000
Interest on Debt: $28,000
- Long Term Debt - Beginning Outstanding - Unspecified Public Purpose: $939,000
Outstanding Unspecified Public Purpose: $817,000
Beginning Outstanding - Unspecified Public Purpose: $695,000
Outstanding Unspecified Public Purpose: $573,000
Retired Unspecified Public Purpose: $122,000
Retired Unspecified Public Purpose: $122,000
- Miscellaneous - General Revenue - Other: $249,000
General Revenue - Other: $119,000
Fines and Forfeits: $51,000
Interest Earnings: $36,000
Interest Earnings: $12,000
Fines and Forfeits: $9,000
- Other Capital Outlay - Solid Waste Management: $296,000
Toll Highways: $134,000
Police Protection: $52,000
Correctional Institutions: $7,000
- Other Funds - Cash and Securities: $3,762,000
- Sinking Funds - Cash and Securities: $6,263,000
- State Intergovernmental - Other: $1,010,000
General Local Government Support: $808,000
Highways: $425,000
Health and Hospitals: $9,000
- Tax - Property: $2,426,000
Property: $946,000
General Sales and Gross Receipts: $243,000
General Sales and Gross Receipts: $234,000
Motor Vehicle License: $19,000
Other License: $2,000
Occupation and Business License - Other: $1,000
- Total Salaries and Wages: $1,080,000
: $127,000
Supplemental Security Income (SSI) in 2006:
- Total number of recipients: 87
- Number of aged recipients: 20
- Number of blind and disabled recipients: 67
- Number of recipients under 18: 9
- Number of recipients between 18 and 64: 45
- Number of recipients older than 64: 33
- Number of recipients also receiving OASDI: 42
- Amount of payments (thousands of dollars): 33
| Most common first names in De Baca County, NM among deceased individuals | ||
| Name | Count | Lived (average) |
|---|---|---|
| James | 23 | 75.8 years |
| Mary | 17 | 84.1 years |
| John | 15 | 81.1 years |
| Joe | 13 | 80.1 years |
| George | 11 | 73.2 years |
| William | 11 | 72.7 years |
| Thomas | 9 | 78.3 years |
| Alice | 8 | 83.9 years |
| Robert | 8 | 65.1 years |
| Sam | 7 | 82.1 years |
| Most common last names in De Baca County, NM among deceased individuals | ||
| Last name | Count | Lived (average) |
|---|---|---|
| Sena | 21 | 70.8 years |
| Lopez | 19 | 80.1 years |
| Gonzales | 12 | 76.7 years |
| Casaus | 11 | 80.1 years |
| Lucero | 10 | 72.0 years |
| Smith | 10 | 71.9 years |
| Wright | 8 | 81.1 years |
| Lovato | 7 | 78.6 years |
| Baca | 7 | 77.0 years |
| Bell | 7 | 71.0 years |
Businesses in De Baca County, NM
- Super 8: 1