Cimarron County, Oklahoma (OK)
County owner-occupied free and clear houses and condos in 2010: 510
County owner-occupied houses and condos in 2000: 912
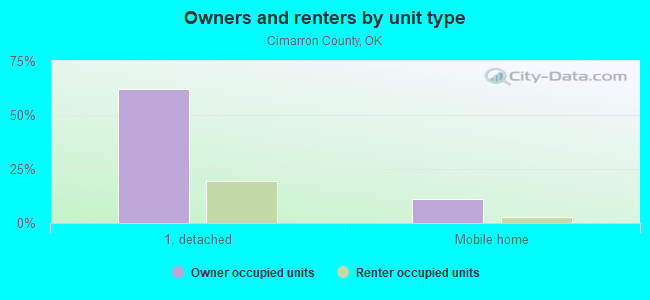
Renter-occupied apartments: 286 (it was 345 in 2000)
| % of renters here: | 27% |
| State: | 33% |
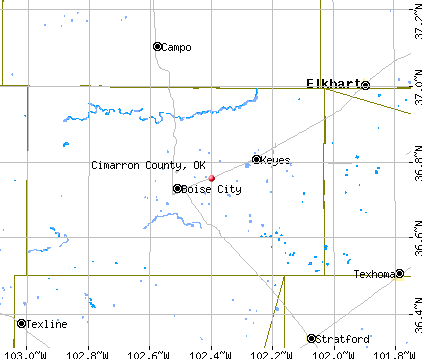
Land area: 1835 sq. mi.
Water area: 6.1 sq. mi.
Population density: 1 people per square mile (very low).
Industries providing employment: Agriculture,forestry,fishing and hunting, and mining (31.7%), Retail trade (24.7%).
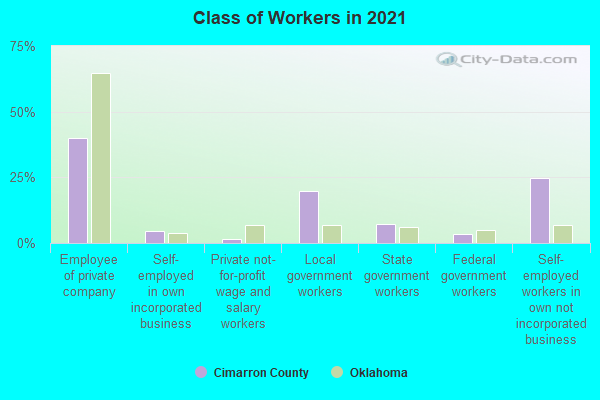
Type of workers:
- Private wage or salary: 48%
- Government: 24%
- Self-employed, not incorporated: 27%
- Unpaid family work: 1%
- OSM Map
- General Map
- Google Map
- MSN Map

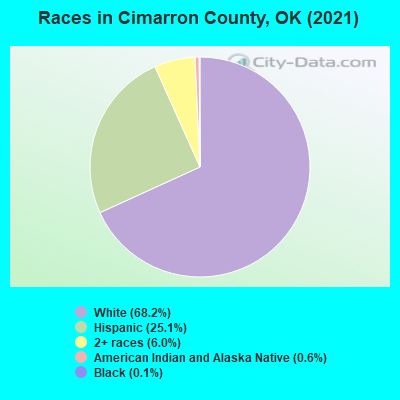
- 1,58068.3%White Non-Hispanic Alone
- 57724.9%Hispanic or Latino
- 1486.4%Two or more races
- 60.3%American Indian and Alaska Native alone
- 20.09%Black Non-Hispanic Alone
| Median resident age: | 46.1 years |
| Oklahoma median age: | 37.1 years |
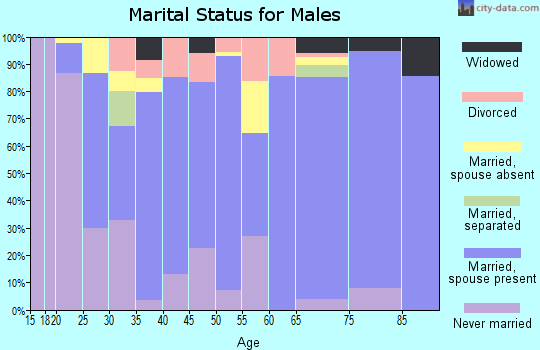
| Males: 1,164 | |
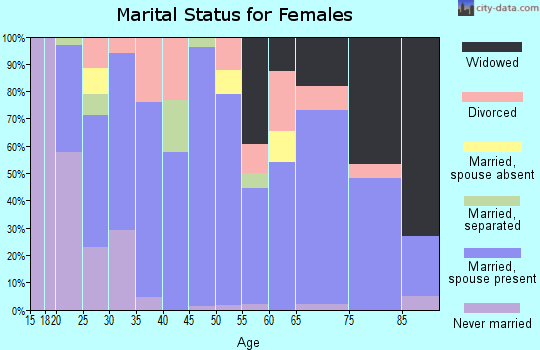
| Females: 1,136 |

 | Any areas Tornado free in OK? (42 replies) |
| Looking for the location of the "Anubis Caves" (15 replies) |
| Don't Go Here! (119 replies) |
| Boise City, OK (69 replies) |
| What is it with you Oklahomans? (136 replies) |
| What Oklahoma's all about email (47 replies) |
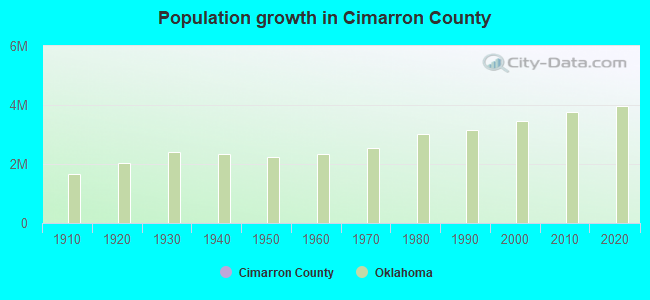
| Cimarron County: | 2.0 people |
| Oklahoma: | 2 people |
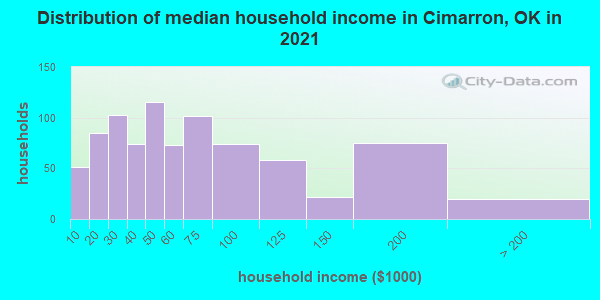
Estimated median household income in 2022: $55,526 ($30,625 in 1999)
| This county: | $55,526 |
| Oklahoma: | $59,673 |
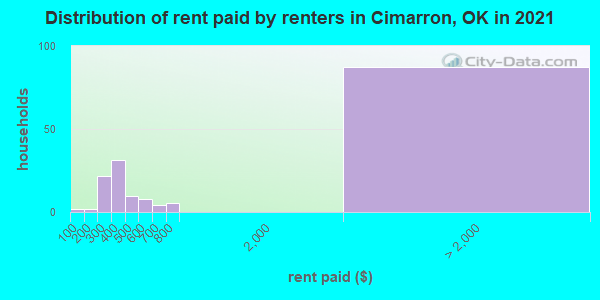
Median contract rent in 2022 for apartments: $384 (lower quartile is $301, upper quartile is $446)
| This county: | $384 |
| State: | $744 |
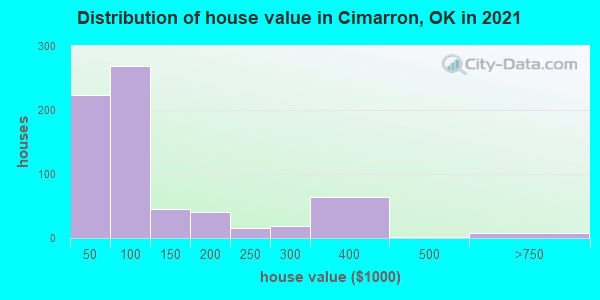
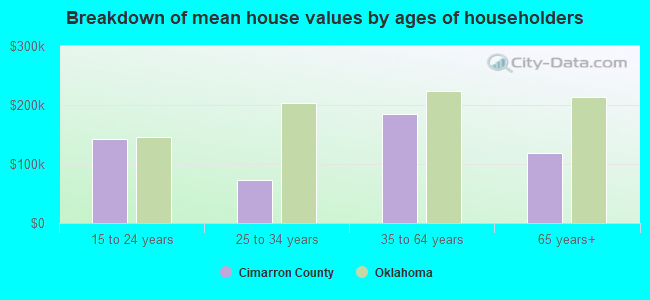
Estimated median house or condo value in 2022: $87,586 (it was $41,200 in 2000)
| Cimarron: | $87,586 |
| Oklahoma: | $191,700 |
Mean price in 2022:
Median monthly housing costs for homes and condos with a mortgage: $1,047Detached houses: $108,318
Here: $108,318 State: $255,409 Mobile homes: $61,292
Here: $61,292 State: $110,804
Median monthly housing costs for units without a mortgage: $450
Institutionalized population: 7
Crime in 2021 (reported by the sheriff's office or county police, not the county total):
- Murders: 0
- Rapes: 0
- Robberies: 0
- Assaults: 0
- Burglaries: 4
- Thefts: 4
- Auto thefts: 2
Crime in 2020 (reported by the sheriff's office or county police, not the county total):
- Murders: 0
- Rapes: 1
- Robberies: 0
- Assaults: 0
- Burglaries: 3
- Thefts: 4
- Auto thefts: 2
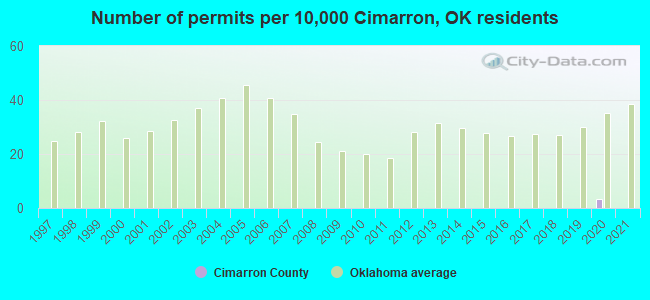
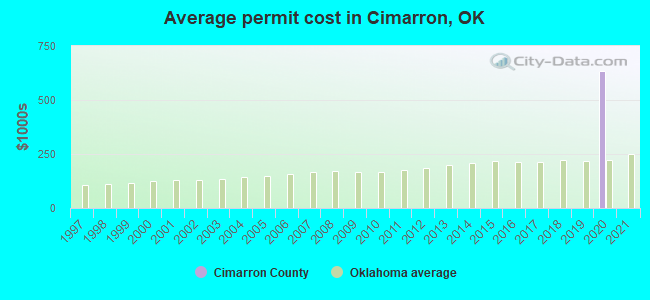
Single-family new house construction building permits:
- 2022: 0 buildings
- 2021: 0 buildings
- 2020: 1 building, cost: $633,000
- 2019: 0 buildings
- 2018: 0 buildings
- 2017: 0 buildings
- 2016: 0 buildings
- 2015: 0 buildings
- 2014: 0 buildings
- 2013: 0 buildings
- 2012: 0 buildings
- 2011: 0 buildings
- 2010: 0 buildings
- 2009: 0 buildings
- 2008: 0 buildings
- 2007: 0 buildings
- 2006: 0 buildings
- 2005: 0 buildings
- 2004: 0 buildings
- 2003: 0 buildings
- 2002: 0 buildings
- 2001: 0 buildings
- 2000: 0 buildings
- 1999: 0 buildings
- 1998: 0 buildings
- 1997: 0 buildings
Median real estate property taxes paid for housing units with mortgages in 2022: $404 (0.5%)
Median real estate property taxes paid for housing units with no mortgage in 2022: $293 (0.3%)
| Cimarron County: | 11.2% |
| Oklahoma: | 15.7% |
Median age of residents in 2022: 46.1 years old
(Males: 41.5 years old, Females: 49.5 years old)
(Median age for: White residents: 49.9 years old, Black residents: 43.3 years old, American Indian residents: 62.9 years old, Hispanic or Latino residents: 28.7 years old)
Fair market rent in 2006 for a 1-bedroom apartment in Cimarron County is $388 a month.
Fair market rent for a 2-bedroom apartment is $451 a month.
Fair market rent for a 3-bedroom apartment is $612 a month.
Neighboring counties: Navajo County, Arizona  , Custer County
  , Crittenden County, Kentucky
  , Grundy County, Tennessee , Putnam County, West Virginia , Grayson County, Kentucky , Henry County, Virginia , Marion County, Alabama .
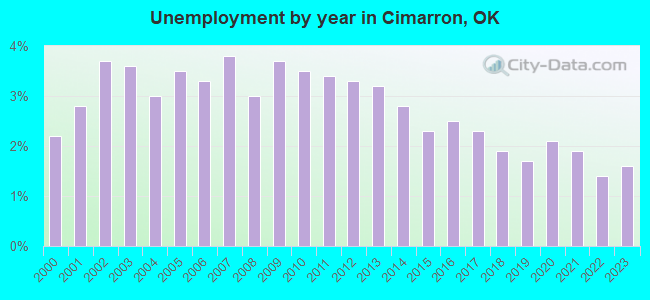
| Here: | 1.8% |
| Oklahoma: | 3.2% |
Current college students: 66
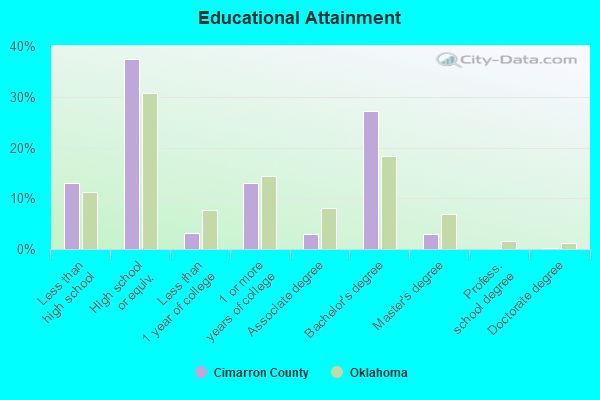
People 25 years of age or older with a high school degree or higher: 87.5%
People 25 years of age or older with a bachelor's degree or higher: 31.7%
Number of foreign born residents: 86 (34.6% naturalized citizens)
| Cimarron County: | 3.8% |
| Whole state: | 6.0% |
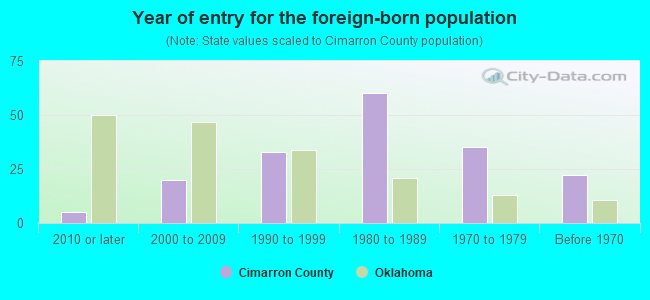
- Year of entry for the foreign-born population
- 02010 or later
- 202000 to 2009
- 91990 to 1999
- 601980 to 1989
- 351970 to 1979
- 22Before 1970
Mean travel time to work (commute): minutes
Percentage of county residents living and working in this county: 94.1%
Housing units in structures:
- One, detached: 1,105
- Two: 13
- 3 or 4: 37
- 5 to 9: 16
- 10 to 19: 2
- 20 or more: 2
- Mobile homes: 206
Housing units in Cimarron County with a mortgage: 112 (11 second mortgage, 0 home equity loan, 11 both second mortgage and home equity loan)
Houses without a mortgage: 0
| Here: | 100.0% with mortgage |
| State: | 98.5% with mortgage |
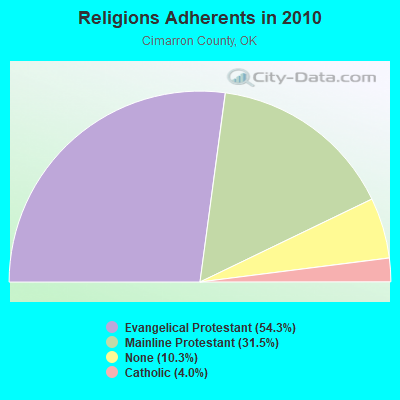
Religion statistics for Cimarron County
| Religion | Adherents | Congregations |
|---|---|---|
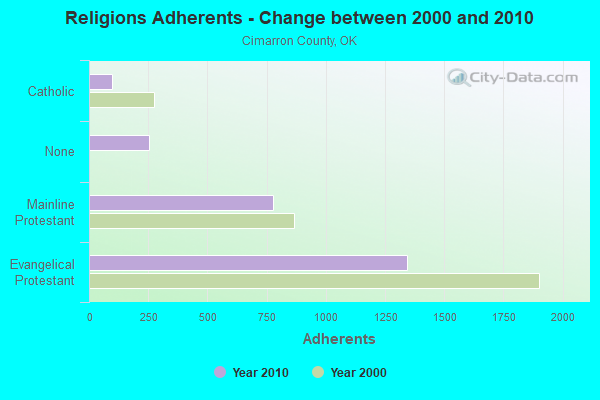
| Evangelical Protestant | 1,343 | 14 |
| Mainline Protestant | 779 | 5 |
| Catholic | 98 | 1 |
| None | 255 | - |
Source: Clifford Grammich, Kirk Hadaway, Richard Houseal, Dale E.Jones, Alexei Krindatch, Richie Stanley and Richard H.Taylor. 2012. 2010 U.S.Religion Census: Religious Congregations & Membership Study. Association of Statisticians of American Religious Bodies. Jones, Dale E., et al. 2002. Congregations and Membership in the United States 2000. Nashville, TN: Glenmary Research Center.
Food Environment Statistics:
| Cimarron County: | 3.80 / 10,000 pop. |
| State: | 1.97 / 10,000 pop. |
| Cimarron County: | 15.21 / 10,000 pop. |
| Oklahoma: | 4.35 / 10,000 pop. |
| This county: | 11.41 / 10,000 pop. |
| State: | 6.89 / 10,000 pop. |
| Cimarron County: | 10.9% |
| Oklahoma: | 10.3% |
| Cimarron County: | 27.0% |
| State: | 29.2% |
Agriculture in Cimarron County:
Average size of farms: 2058 acresAverage value of agricultural products sold per farm: $334,021
Average value of crops sold per acre for harvested cropland: $112.03
The value of nursery, greenhouse, floriculture, and sod as a percentage of the total market value of agricultural products sold: 0.00%
The value of livestock, poultry, and their products as a percentage of the total market value of agricultural products sold: 90.82%
Average total farm production expenses per farm: $316,702
Harvested cropland as a percentage of land in farms: 13.29%
Irrigated harvested cropland as a percentage of land in farms: 29.59%
Average market value of all machinery and equipment per farm: $102,811
The percentage of farms operated by a family or individual: 80.55%
Average age of principal farm operators: 58 years
Average number of cattle and calves per 100 acres of all land in farms: 11.81
Corn for grain: 18730 harvested acres
All wheat for grain: 56243 harvested acres
Earthquake activity:
Cimarron County-area historical earthquake activity is significantly above Oklahoma state average. It is 630% greater than the overall U.S. average.On 8/23/2011 at 05:46:18, a magnitude 5.3 (5.3 MW, Depth: 2.5 mi, Class: Moderate, Intensity: VI - VII) earthquake occurred 129.0 miles away from Cimarron County center
On 8/10/2005 at 22:08:22, a magnitude 5.0 (5.0 MB, 4.7 MS, 5.0 MW) earthquake occurred 131.5 miles away from the county center
On 8/10/2005 at 22:08:22, a magnitude 5.0 (5.0 MW, Depth: 3.1 mi) earthquake occurred 135.3 miles away from the county center
On 9/3/2016 at 12:02:44, a magnitude 5.8 (5.8 MW, Depth: 3.5 mi) earthquake occurred 304.7 miles away from the county center
On 2/15/1974 at 13:33:49, a magnitude 4.6 (4.5 MB, 4.6 LG, Class: Light, Intensity: IV - V) earthquake occurred 96.4 miles away from Cimarron County center
On 8/22/2011 at 23:30:19, a magnitude 4.7 (4.7 MW, Depth: 3.1 mi) earthquake occurred 120.6 miles away from the county center
Magnitude types: regional Lg-wave magnitude (LG), body-wave magnitude (MB), surface-wave magnitude (MS), moment magnitude (MW)
Most recent natural disasters:
- Oklahoma Covid-19 Pandemic, Incident Period: January 20, 2020, FEMA Id: 4530, Natural disaster type: Other
- Oklahoma Severe Storms, Tornadoes, And Flooding, Incident Period: April 28, 2017 - May 2, 2017, FEMA Id: 4315, Natural disaster type: Storm, Tornado, Flood
- Oklahoma Severe Winter Storm, Incident Period: January 31, 2011 to February 05, 2011, Emergency Declared EM-3316: February 02, 2011, FEMA Id: 3316, Natural disaster type: Winter Storm
- Oklahoma Severe Storms, Tornadoes, Straight-line Winds, and Flooding, Incident Period: June 13, 2010 to June 15, 2010, Major Disaster (Presidential) Declared DR-1926: July 26, 2010, FEMA Id: 1926, Natural disaster type: Storm, Tornado, Flood, Wind
- Oklahoma Severe Winter Storm, Incident Period: January 28, 2010 to January 30, 2010, Emergency Declared EM-3308: January 30, 2010, FEMA Id: 3308, Natural disaster type: Winter Storm
- Oklahoma Severe Storms, Tornadoes, and Flooding, Incident Period: September 12, 2008 to September 19, 2008, Major Disaster (Presidential) Declared DR-1803: October 09, 2008, FEMA Id: 1803, Natural disaster type: Storm, Tornado, Flood
- Oklahoma Severe Winter Storms, Incident Period: December 08, 2007 to January 03, 2008, Emergency Declared EM-3280: December 10, 2007, FEMA Id: 3280, Natural disaster type: Winter Storm
- Oklahoma Severe Winter Storms and Flooding, Incident Period: January 12, 2007 to January 26, 2007, Emergency Declared EM-3272: January 14, 2007, FEMA Id: 3272, Natural disaster type: Winter Storm, Flood
- Oklahoma Severe Winter Storm, Incident Period: December 28, 2006 to December 30, 2006, Major Disaster (Presidential) Declared DR-1677: February 01, 2007, FEMA Id: 1677, Natural disaster type: Winter Storm
- Oklahoma Hurricane Katrina Evacuation, Incident Period: August 29, 2005 to October 01, 2005, Emergency Declared EM-3219: September 05, 2005, FEMA Id: 3219, Natural disaster type: Hurricane
- 3 other natural disasters have been reported since 1953.
The number of natural disasters in Cimarron County (13) is near the US average (15).
Major Disasters (Presidential) Declared: 6
Emergencies Declared: 5
Causes of natural disasters: Storms: 5, Winter Storms: 5, Floods: 4, Tornadoes: 4, Hurricane: 1, Ice Storm: 1, Wind: 1, Other: 1 (Note: some incidents may be assigned to more than one category).
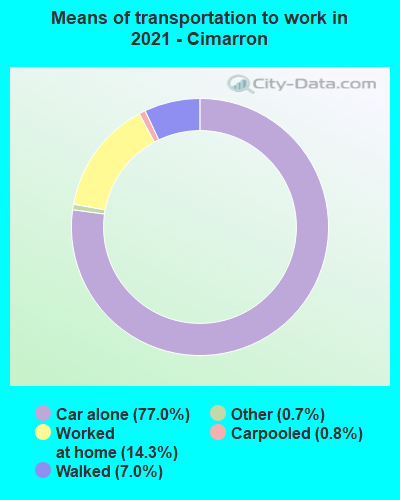
Means of transportation to work:
- Drove a car alone: 755 (71.8%)
- Carpooled: 11 (1.0%)
- Taxicab, motorcycle, or other means: 4 (0.4%)
- Walked: 81 (7.7%)
- Worked at home: 229 (21.8%)
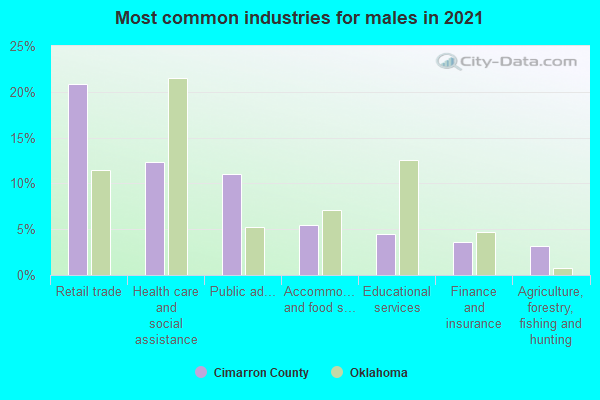
- Retail trade (18%)
- Health care and social assistance (10%)
- Public administration (6%)
- Accommodation and food services (5%)
- Agriculture, forestry, fishing and hunting (4%)
- Finance and insurance (3%)
- Educational services (2%)
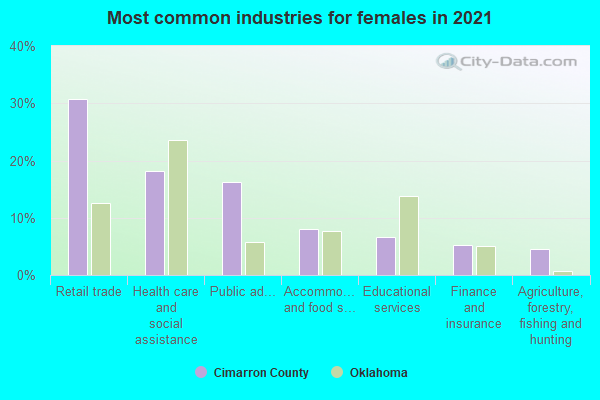
- Retail trade (32%)
- Health care and social assistance (19%)
- Public administration (12%)
- Accommodation and food services (9%)
- Agriculture, forestry, fishing and hunting (8%)
- Finance and insurance (5%)
- Educational services (4%)
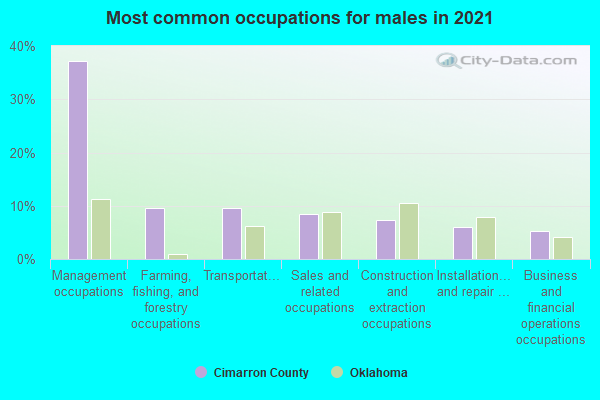
- Management occupations (39%)
- Farming, fishing, and forestry occupations (10%)
- Transportation occupations (10%)
- Sales and related occupations (8%)
- Installation, maintenance, and repair occupations (7%)
- Business and financial operations occupations (7%)
- Material moving occupations (7%)
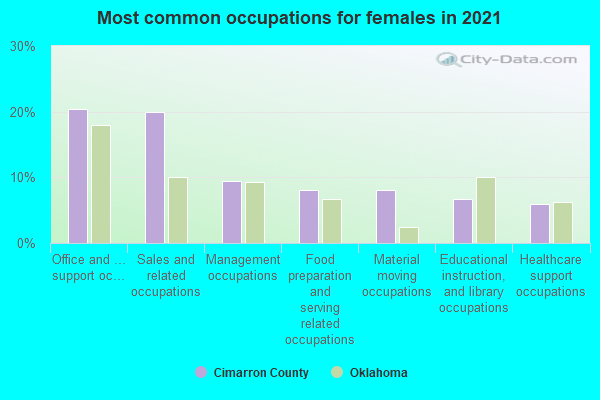
- Sales and related occupations (21%)
- Office and administrative support occupations (17%)
- Management occupations (14%)
- Material moving occupations (9%)
- Food preparation and serving related occupations (8%)
- Healthcare support occupations (5%)
- Building and grounds cleaning and maintenance occupations (5%)
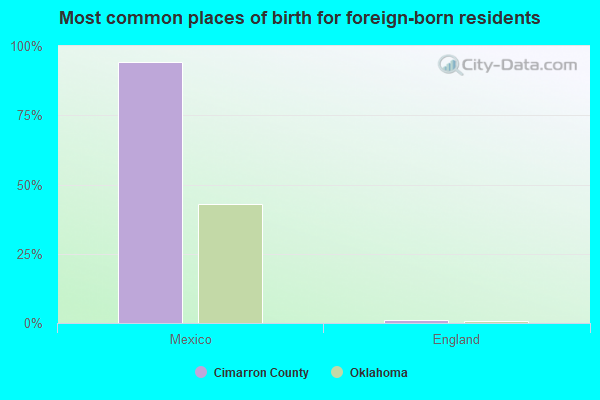
- Mexico (101%)
- Ireland (0%)
- Norway (0%)
- Sweden (0%)
- United Kingdom, excluding England and Scotland (0%)
- England (0%)
- Scotland (0%)
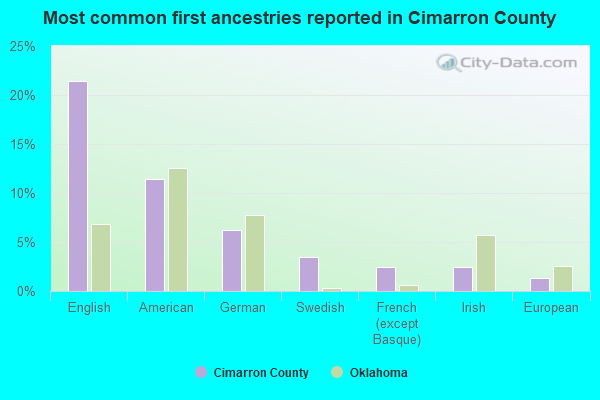
- English (19%)
- American (13%)
- German (8%)
- Swedish (3%)
- French (except Basque) (2%)
- European (1%)
- Irish (1%)
3 people in nursing facilities/skilled-nursing facilities
32 people in nursing homes
9 people in local jails and other confinement facilities (including police lockups)
10 or fewer of this county's residents relocated from other counties between 2020 and 2021.1,000 average adjusted gross income)
10 or fewer of this county's residents moved from foreign countries.
10 or fewer of this county's residents relocated from other counties in Oklahoma.
10 or fewer of this county's residents relocated from other states.
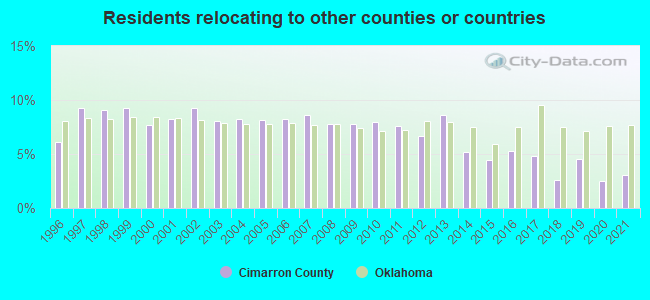
3.02% of this county's 2020 resident taxpayers moved to other counties in 2021 ($47,840 average adjusted gross income)
| Here: | 3.02% |
| Oklahoma average: | 7.66% |
10 or fewer of this county's residents moved to foreign countries.
3.02% relocated to other counties in Oklahoma ($47,840 average AGI)
10 or fewer of this county's residents relocated to other states.
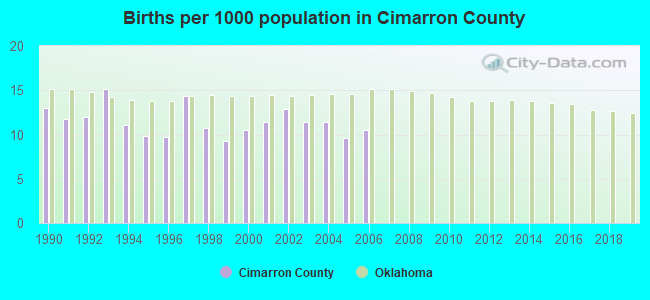
Births per 1000 population from 1990 to 1999: 11.7
Births per 1000 population from 2000 to 2006: 11.1
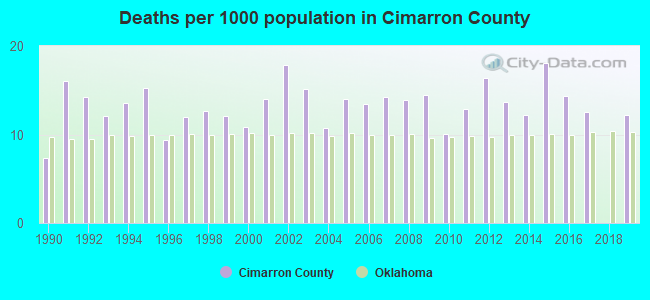
Deaths per 1000 population from 1990 to 1999: 12.5
Deaths per 1000 population from 2000 to 2009: 13.9
Deaths per 1000 population from 2010 to 2020: 12.1
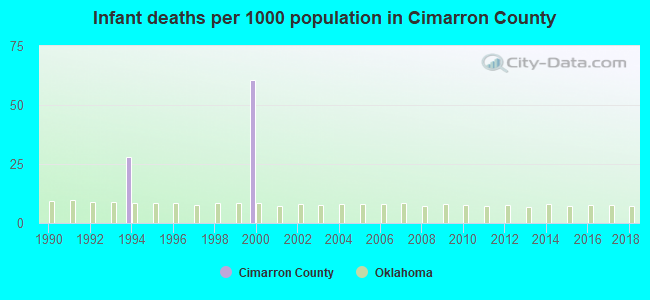
Infant deaths per 1000 live births from 1990 to 1999: 2.8
Infant deaths per 1000 live births from 2000 to 2006: 8.7
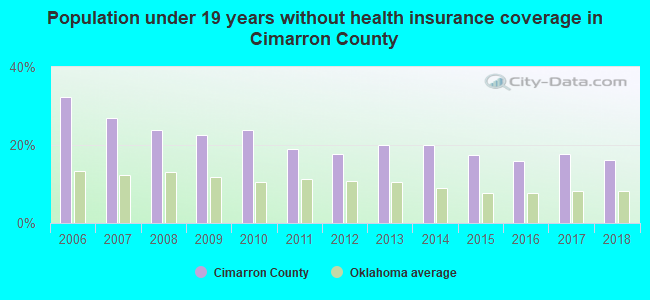
Persons under 19 years old without health insurance coverage in 2018: 16.2%

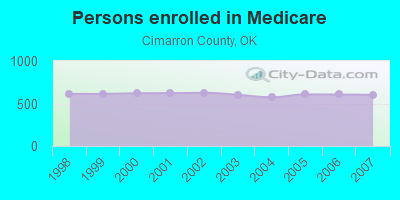
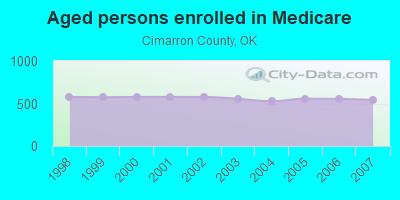
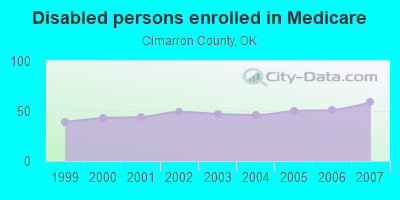
Persons enrolled in hospital insurance and/or supplemental medical insurance (Medicare) in July 1, 2007: 602 (543 aged, 59 disabled)
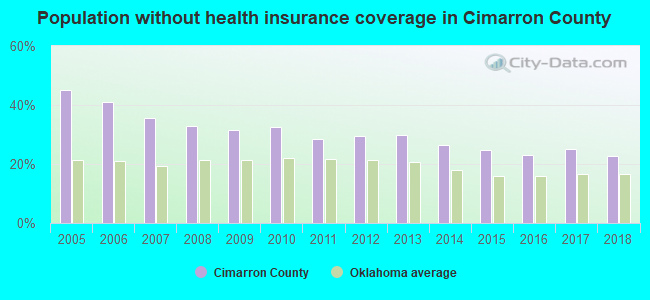
Children under 18 without health insurance coverage in 2007: 144 (26%)
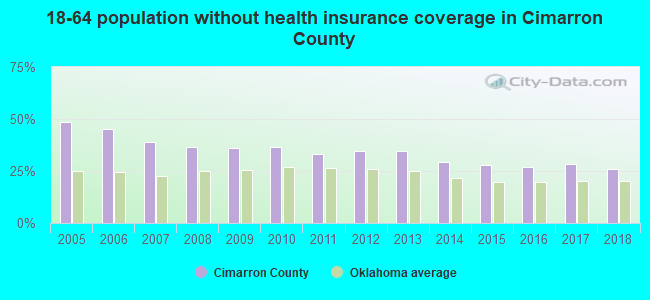
Population without health insurance coverage in 2000: 24%
Children under 18 without health insurance coverage in 2000: 25%
Short term general hospital admissions per 100,000 population in 2004: 13,807
Short term general hospital beds per 100,000 population in 2004: 690
Emergency room visits per 100,000 population in 2004: 61,443
General practice office based MDs per 100,000 population in 2005: 1,059
Medical specialist MDs per 100,000 population in 2005: 1,200
Dentists per 100,000 population in 1998: 35
Total deaths per 100,000 population, July 2005 - July 2006: 71
Household type by relationship:
Households: 2,300- Male householders: 416 (67 living alone), Female householders: 359 (164 living alone)
458 spouses (458 opposite-sex spouses), 32 unmarried partners, (31 opposite-sex unmarried partners), 655 children (599 natural, 0 adopted, 55 stepchildren), 146 grandchildren, 33 brothers or sisters, 44 parents, 0 foster children, 47 other relatives, 74 non-relatives
- In group quarters: 19
Size of family households: 306 2-persons, 69 3-persons, 77 4-persons, 27 5-persons, 29 6-persons, 12 7-or-more-persons.
Size of nonfamily households: 232 1-person, 21 2-persons.
414 married couples with children.
68 single-parent households (4 men, 64 women).
77.2% of residents of Cimarron speak English at home.
20.4% of residents speak Spanish at home (88% speak English very well, 10% speak English not well, 2% don't speak English at all).
2.4% of residents speak other Indo-European language at home (100% speak English very well).
In fiscal year 2004:
Federal Government expenditure: $30,523,000 ($10,536 per capita)
Department of Defense expenditure: $63,000
Federal direct payments to individuals for retirement and disability: $8,005,000
Federal other direct payments to individuals: $3,760,000
Federal direct payments not to individuals: $13,992,000
Federal grants: $3,444,000
Federal procurement contracts: $315,000 ($0,000 Department of Defense)
Federal salaries and wages: $1,006,000 ($0,000 Department of Defense)
Federal Government direct loans: $654,000
Federal guaranteed/insured loans: $2,253,000
Federal Government insurance: $15,568,000
Population change from April 1, 2000 to July 1, 2005:
Births: 177| Here: | 62 per 1000 residents |
| State: | 75 per 1000 residents |
Deaths: 214
| Here: | 76 per 1000 residents |
| State: | 52 per 1000 residents |
Net international migration: +126
| Here: | +44 per 1000 residents |
| State: | +10 per 1000 residents |
Net internal migration: -400
| Here: | |
| State: |
Total withdrawal of fresh water for public supply: 0.49 millions of gallons per day (all from ground)
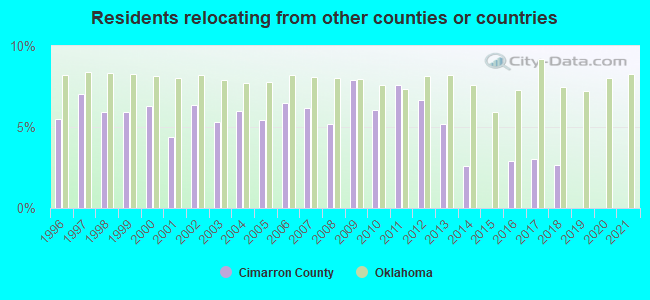
| Here: | 6.4 |
| State: | 6.1 |
| Here: | 5.1 |
| State: | 4.5 |
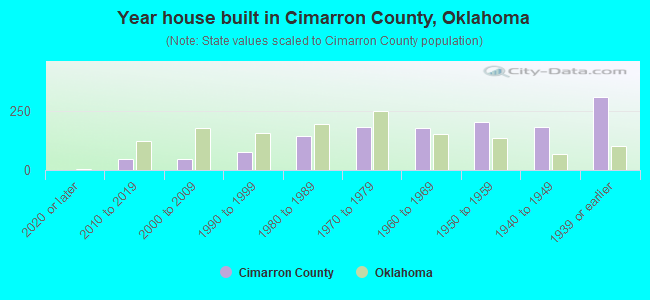
- Year house built in Cimarron County, Oklahoma
- 02020 or later
- 642010 to 2019
- 532000 to 2009
- 531990 to 1999
- 1531980 to 1989
- 1531970 to 1979
- 2301960 to 1969
- 1471950 to 1959
- 1671940 to 1949
- 3271939 or earlier
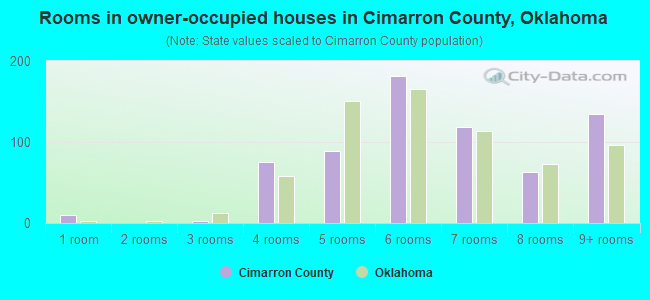
- Rooms in owner-occupied houses in Cimarron County, Oklahoma
- 01 room
- 02 rooms
- 33 rooms
- 634 rooms
- 895 rooms
- 1736 rooms
- 1007 rooms
- 638 rooms
- 1329+ rooms
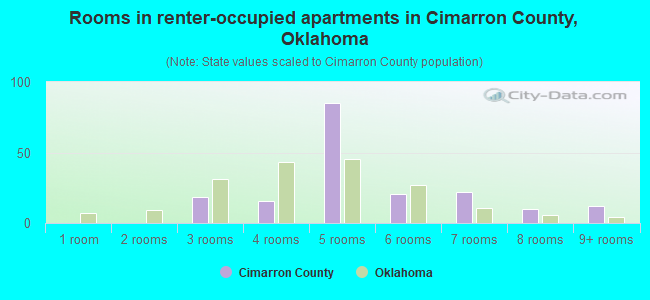
- Rooms in renter-occupied apartments in Cimarron County, Oklahoma
- 01 room
- 02 rooms
- 113 rooms
- 234 rooms
- 685 rooms
- 186 rooms
- 147 rooms
- 78 rooms
- 59+ rooms
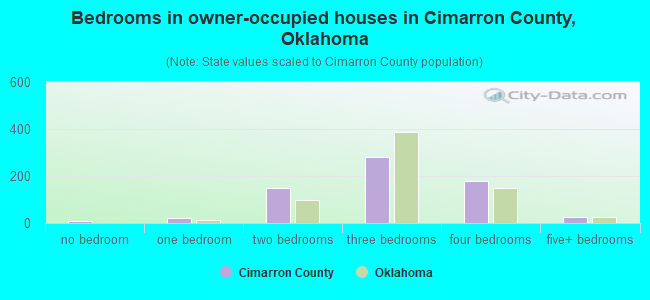
- Bedrooms in owner-occupied houses in Cimarron County, Oklahoma
- 0no bedroom
- 291 bedroom
- 1372 bedrooms
- 2613 bedrooms
- 1654 bedrooms
- 345+ bedrooms
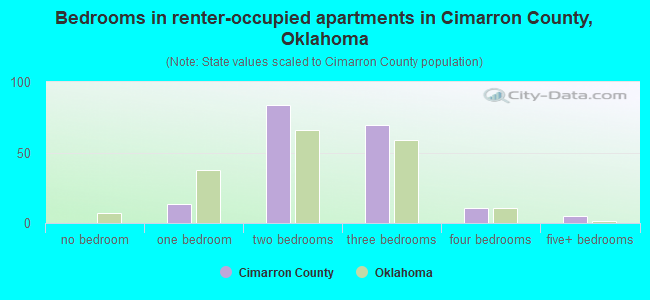
- Bedrooms in renter-occupied apartments in Cimarron County, Oklahoma
- 0no bedroom
- 131 bedroom
- 672 bedrooms
- 593 bedrooms
- 84 bedrooms
- 25+ bedrooms
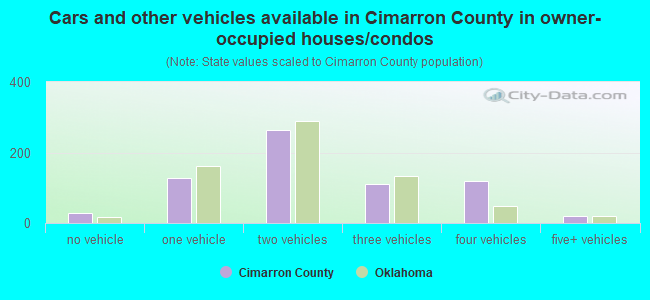
- Cars and other vehicles available in Cimarron County in owner-occupied houses/condos
- 23no vehicle
- 1121 vehicle
- 2332 vehicles
- 1323 vehicles
- 1094 vehicles
- 105+ vehicles
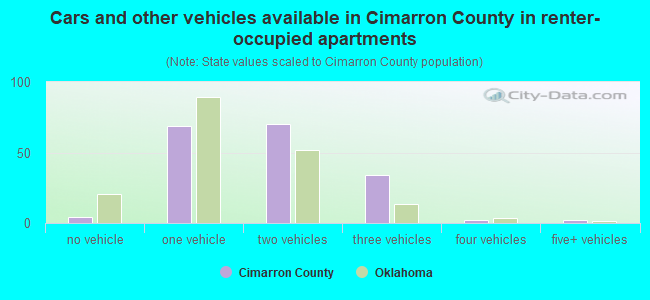
- Cars and other vehicles available in Cimarron County in renter-occupied apartments
- 2no vehicle
- 521 vehicle
- 682 vehicles
- 233 vehicles
- 04 vehicles
- 35+ vehicles
96.3% of Cimarron County residents lived in the same house 1 years ago.
Out of people who lived in different houses, 14% lived in this county.
Out of people who lived in different counties, 33% lived in Oklahoma.
| Cimarron County: | 96.3% |
| State average: | 85.5% |
Place of birth for U.S.-born residents:
- This state: 1,074
- Other state: 1,152
- Northeast: 8
- Midwest: 376
- South: 396
- West: 376
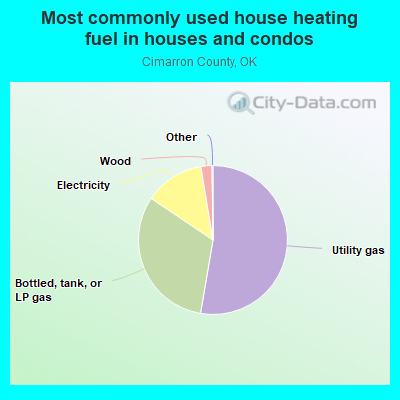
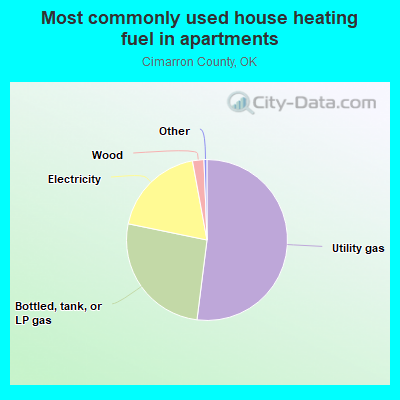
- 55.0%Utility gas
- 32.3%Bottled, tank, or LP gas
- 12.0%Electricity
- 0.7%Wood
- 67.8%Utility gas
- 25.9%Bottled, tank, or LP gas
- 6.3%Electricity
Private vs. public school enrollment:
| Here: | 5.4% |
| Oklahoma: | 11.7% |
| Here: | 0.0% |
| Oklahoma: | 11.7% |
| Here: | 52.9% |
| Oklahoma: | 19.3% |
Cimarron County government finances - Expenditure in 2018:
- Construction - Regular Highways: $5,000
- Current Operations - Regular Highways: $867,000
Police Protection: $197,000
Financial Administration: $147,000
Central Staff Services: $59,000
Public Welfare, Vendor Payments for Medical Care: $15,000
Libraries: $5,000
- Intergovernmental to Local - Other - Correctional Institutions: $2,000
- Local Intergovernmental - General Local Government Support: $9,000
- Miscellaneous - General Revenue - Other: $22,000
- Other Capital Outlay - Regular Highways: $686,000
- Other Funds - Cash and Securities: $5,112,000
- State Intergovernmental - Highways: $3,020,000
General Local Government Support: $63,000
- Tax - Property: $626,000
Public Utilities Sales: $50,000
- Total Salaries and Wages: $404,000
Cimarron County government finances - Revenue in 2018:
- Construction - Regular Highways: $5,000
- Current Operations - Regular Highways: $867,000
Police Protection: $197,000
Financial Administration: $147,000
Central Staff Services: $59,000
Public Welfare, Vendor Payments for Medical Care: $15,000
Libraries: $5,000
- Intergovernmental to Local - Other - Correctional Institutions: $2,000
- Local Intergovernmental - General Local Government Support: $9,000
- Miscellaneous - General Revenue - Other: $22,000
- Other Capital Outlay - Regular Highways: $686,000
- Other Funds - Cash and Securities: $5,112,000
- State Intergovernmental - Highways: $3,020,000
General Local Government Support: $63,000
- Tax - Property: $626,000
Public Utilities Sales: $50,000
- Total Salaries and Wages: $404,000
Cimarron County government finances - Debt in 2018:
- Construction - Regular Highways: $5,000
- Current Operations - Regular Highways: $867,000
Police Protection: $197,000
Financial Administration: $147,000
Central Staff Services: $59,000
Public Welfare, Vendor Payments for Medical Care: $15,000
Libraries: $5,000
- Intergovernmental to Local - Other - Correctional Institutions: $2,000
- Local Intergovernmental - General Local Government Support: $9,000
- Miscellaneous - General Revenue - Other: $22,000
- Other Capital Outlay - Regular Highways: $686,000
- Other Funds - Cash and Securities: $5,112,000
- State Intergovernmental - Highways: $3,020,000
General Local Government Support: $63,000
- Tax - Property: $626,000
Public Utilities Sales: $50,000
- Total Salaries and Wages: $404,000
Cimarron County government finances - Cash and Securities in 2018:
- Construction - Regular Highways: $5,000
- Current Operations - Regular Highways: $867,000
Police Protection: $197,000
Financial Administration: $147,000
Central Staff Services: $59,000
Public Welfare, Vendor Payments for Medical Care: $15,000
Libraries: $5,000
- Intergovernmental to Local - Other - Correctional Institutions: $2,000
- Local Intergovernmental - General Local Government Support: $9,000
- Miscellaneous - General Revenue - Other: $22,000
- Other Capital Outlay - Regular Highways: $686,000
- Other Funds - Cash and Securities: $5,112,000
- State Intergovernmental - Highways: $3,020,000
General Local Government Support: $63,000
- Tax - Property: $626,000
Public Utilities Sales: $50,000
- Total Salaries and Wages: $404,000
Supplemental Security Income (SSI) in 2006:
- Total number of recipients: 39
- Number of aged recipients: 9
- Number of blind and disabled recipients: 30
- Number of recipients under 18: 7
- Number of recipients between 18 and 64: 15
- Number of recipients older than 64: 17
- Number of recipients also receiving OASDI: 23
- Amount of payments (thousands of dollars): 13
| Most common first names in Cimarron County, OK among deceased individuals | ||
| Name | Count | Lived (average) |
|---|---|---|
| Mary | 97 | 75.6 years |
| James | 86 | 70.2 years |
| John | 72 | 75.7 years |
| Robert | 68 | 71.4 years |
| Willie | 60 | 71.5 years |
| William | 60 | 73.7 years |
| Annie | 54 | 78.9 years |
| Charles | 32 | 73.6 years |
| George | 30 | 75.0 years |
| Thomas | 24 | 67.5 years |
| Most common last names in Cimarron County, OK among deceased individuals | ||
| Last name | Count | Lived (average) |
|---|---|---|
| Smith | 48 | 77.4 years |
| Davis | 39 | 76.4 years |
| Carter | 34 | 74.7 years |
| Williams | 32 | 74.2 years |
| Johnson | 32 | 73.8 years |
| Brown | 29 | 73.8 years |
| Culver | 27 | 68.0 years |
| Jones | 27 | 67.3 years |
| Kirkland | 27 | 80.1 years |
| Money | 26 | 70.8 years |
| Businesses in Cimarron County, OK | ||||
| Name | Count | Name | Count | |
|---|---|---|---|---|
| Dairy Queen | 1 | Subway | 1 | |
| Kroger | 1 | U-Haul | 1 | |
Cimarron County on our top lists:
- #11 on the list of "Top 101 counties with highest percentage of residents voting for Romney (Republican) in the 2012 Presidential Election"