Brunswick County, Virginia (VA)
County owner-occupied free and clear houses and condos in 2010: 2,190
County owner-occupied houses and condos in 2000: 4,875
Renter-occupied apartments: 1,724 (it was 1,402 in 2000)
| % of renters here: | 22% |
| State: | 33% |
Land area: 566 sq. mi.
Water area: 3.2 sq. mi.
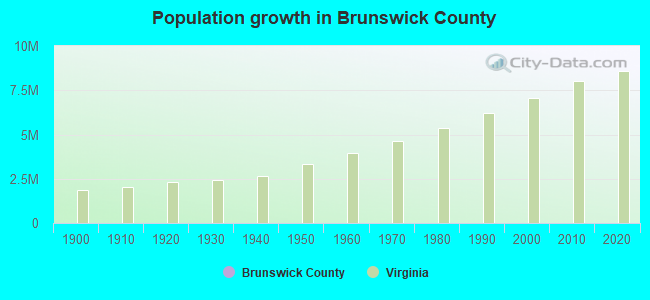
Population density: 28 people per square mile (low).
Industries providing employment: Educational, health and social services (22.9%), Retail trade (17.1%), Transportation and warehousing,and utilities (14.4%).
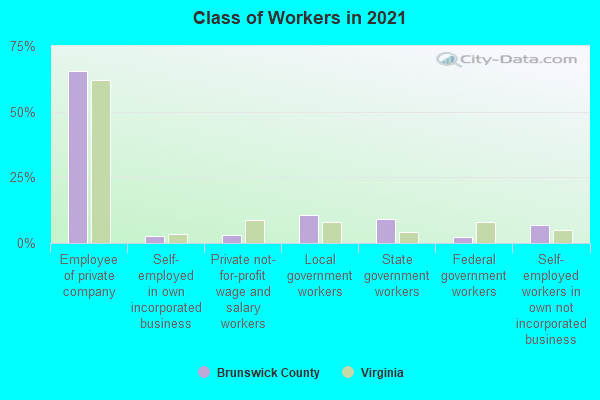
Type of workers:
- Private wage or salary: 72%
- Government: 21%
- Self-employed, not incorporated: 7%
- Unpaid family work: 0%
- OSM Map
- General Map
- Google Map
- MSN Map

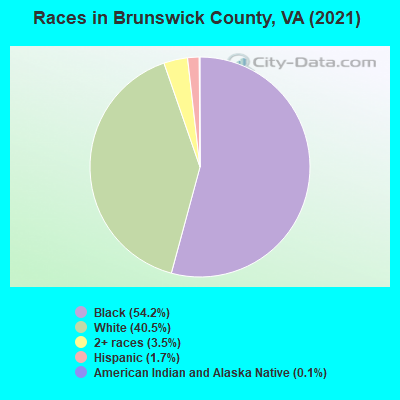
- 8,59554.0%Black Non-Hispanic Alone
- 6,44440.5%White Non-Hispanic Alone
- 4342.7%Hispanic or Latino
- 3932.5%Two or more races
- 290.2%American Indian and Alaska Native alone
- 150.09%Asian alone
| Median resident age: | 44.9 years |
| Virginia median age: | 39.0 years |
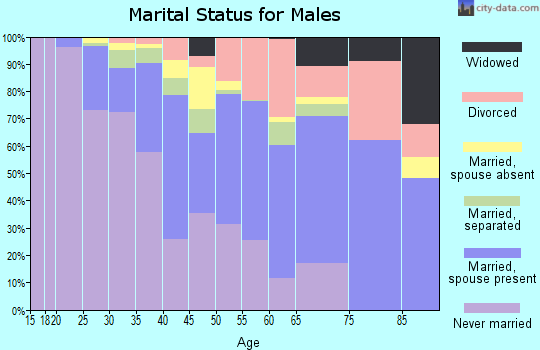
| Males: 8,573 | |
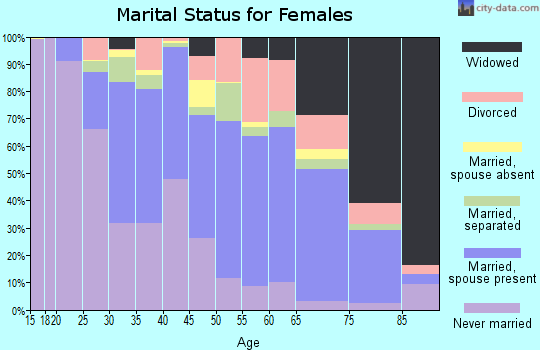
| Females: 7,501 |

 | Wash DC needs to annex Arlington and Alexandria back (95 replies) |
| Speeding ticket in Brunswick CO (5 replies) |
| Official Reckless Driving Thread (2249 replies) |
| Worst county in Virginia *drum roll* (51 replies) |
| Speeding Ticket Lawyer (25 replies) |
| Wegmans looking to open a store in Newport News (11 replies) |
| Brunswick County: | 2.0 people |
| Virginia: | 3 people |
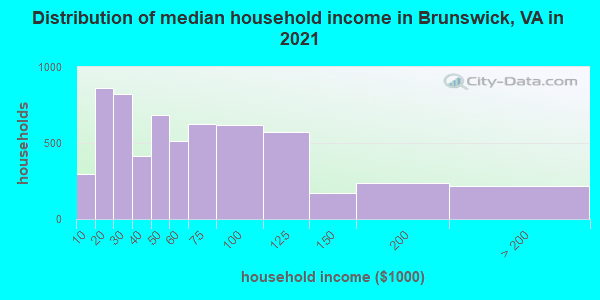
Estimated median household income in 2022: $51,847 ($31,288 in 1999)
| This county: | $51,847 |
| Virginia: | $85,873 |
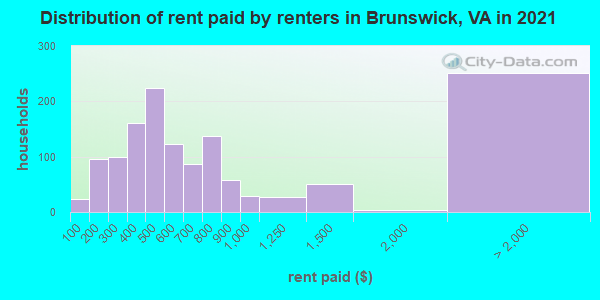
Median contract rent in 2022 for apartments: $551 (lower quartile is $322, upper quartile is $744)
| This county: | $551 |
| State: | $1270 |
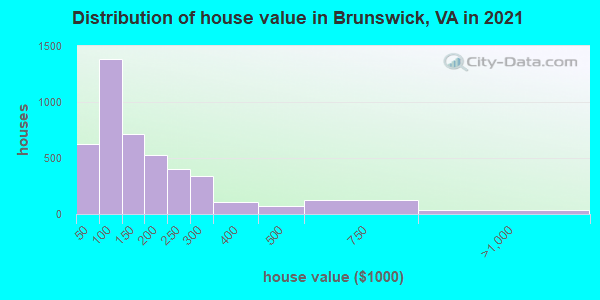
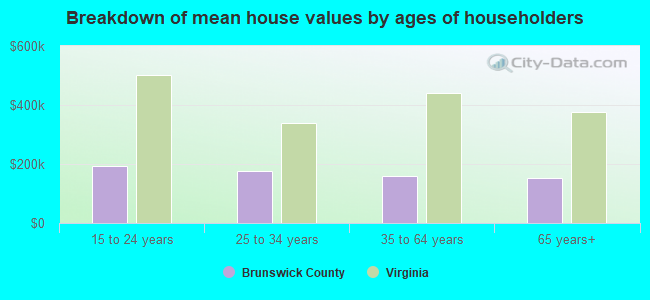
Estimated median house or condo value in 2022: $136,680 (it was $66,300 in 2000)
| Brunswick: | $136,680 |
| Virginia: | $365,700 |
Median monthly housing costs for homes and condos with a mortgage: $1,090
Median monthly housing costs for units without a mortgage: $372
Institutionalized population: 1,847
Crime in 2021 (reported by the sheriff's office or county police, not the county total):
- Murders: 0
- Rapes: 3
- Robberies: 0
- Assaults: 3
- Burglaries: 19
- Thefts: 77
- Auto thefts: 8
Crime in 2020 (reported by the sheriff's office or county police, not the county total):
- Murders: 0
- Rapes: 0
- Robberies: 0
- Assaults: 9
- Burglaries: 21
- Thefts: 72
- Auto thefts: 8
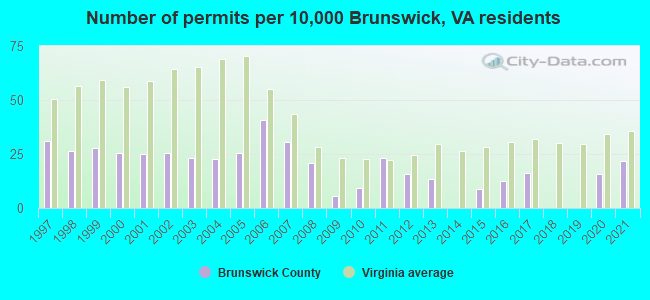
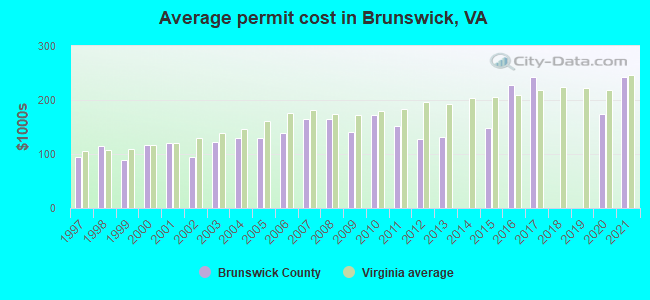
Single-family new house construction building permits:
- 2022: 40 buildings, average cost: $225,400
- 2021: 40 buildings, average cost: $242,200
- 2020: 29 buildings, average cost: $174,900
- 2019: 0 buildings
- 2018: 0 buildings
- 2017: 30 buildings, average cost: $243,300
- 2016: 23 buildings, average cost: $228,200
- 2015: 16 buildings, average cost: $148,000
- 2014: 0 buildings
- 2013: 25 buildings, average cost: $130,700
- 2012: 29 buildings, average cost: $127,800
- 2011: 43 buildings, average cost: $151,500
- 2010: 17 buildings, average cost: $171,500
- 2009: 10 buildings, average cost: $139,500
- 2008: 38 buildings, average cost: $164,000
- 2007: 56 buildings, average cost: $164,000
- 2006: 75 buildings, average cost: $138,900
- 2005: 47 buildings, average cost: $129,300
- 2004: 42 buildings, average cost: $129,300
- 2003: 43 buildings, average cost: $122,900
- 2002: 47 buildings, average cost: $94,000
- 2001: 46 buildings, average cost: $120,900
- 2000: 47 buildings, average cost: $117,100
- 1999: 51 buildings, average cost: $88,400
- 1998: 49 buildings, average cost: $113,500
- 1997: 57 buildings, average cost: $94,800
Median real estate property taxes paid for housing units with mortgages in 2022: $766 (0.5%)
Median real estate property taxes paid for housing units with no mortgage in 2022: $596 (0.6%)
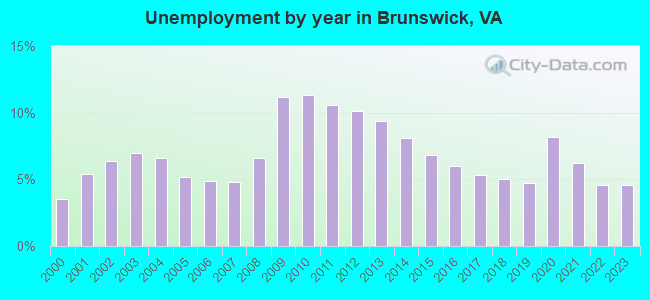
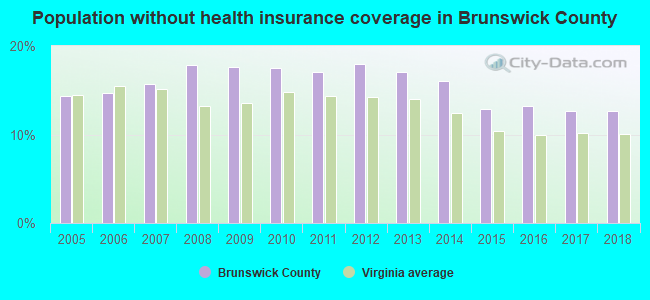
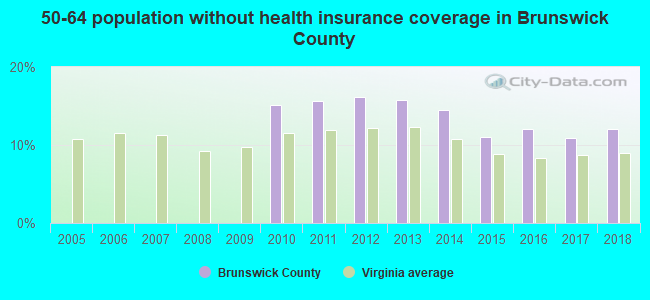
| Brunswick County: | 18.2% |
| Virginia: | 10.6% |
Median age of residents in 2022: 44.9 years old
(Males: 40.7 years old, Females: 50.2 years old)
(Median age for: White residents: 51.1 years old, Black residents: 39.4 years old, American Indian residents: 20.0 years old, Asian residents: 36.7 years old, Hispanic or Latino residents: 52.5 years old, Other race residents: 65.3 years old)
Fair market rent in 2006 for a 1-bedroom apartment in Brunswick County is $428 a month.
Fair market rent for a 2-bedroom apartment is $499 a month.
Fair market rent for a 3-bedroom apartment is $622 a month.
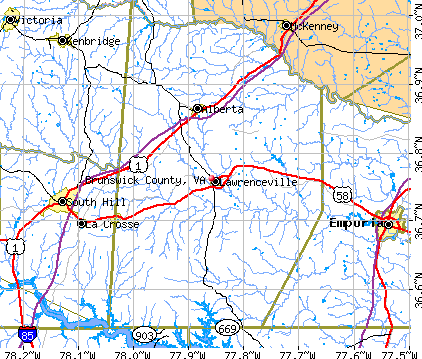
Cities in this county include: Lawrenceville, Gasburg, Brodnax, Alberta, Ebony, Warfield.
Neighboring counties: Greensville County  , Santa Cruz County, California
  , Hart County, Kentucky , Prince George County
  , Newport News city
  , Norton city .
| Here: | 4.3% |
| Virginia: | 2.7% |
Current college students: 908
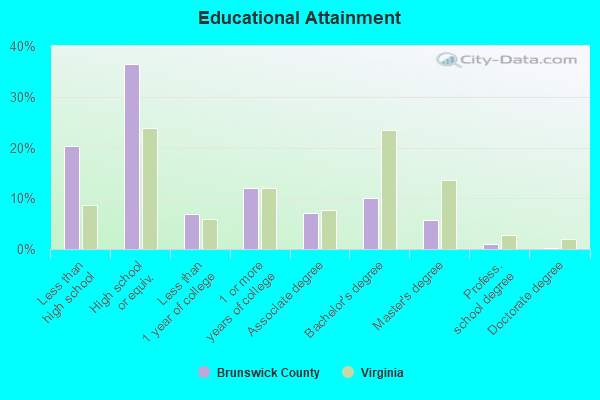
People 25 years of age or older with a high school degree or higher: 76.5%
People 25 years of age or older with a bachelor's degree or higher: 16.0%
Number of foreign born residents: 314 (6.4% naturalized citizens)
| Brunswick County: | 2.0% |
| Whole state: | 12.7% |
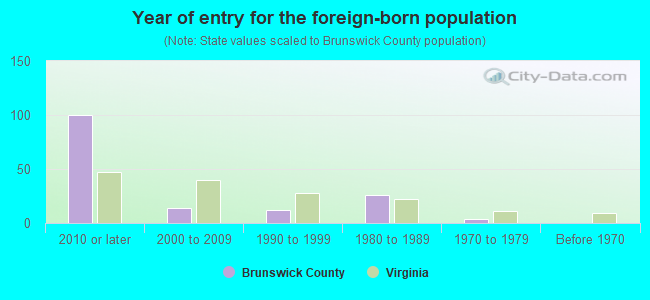
- Year of entry for the foreign-born population
- 1202010 or later
- 322000 to 2009
- 131990 to 1999
- 261980 to 1989
- 41970 to 1979
- 0Before 1970
Mean travel time to work (commute): minutes
Percentage of county residents living and working in this county: 95.7%
Housing units in structures:
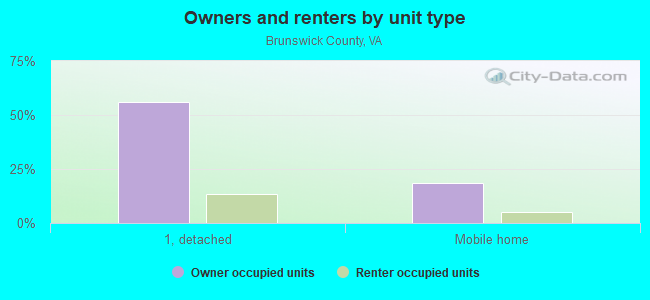
- One, detached: 5,459
- One, attached: 38
- Two: 37
- 3 or 4: 102
- 5 to 9: 68
- 10 to 19: 38
- 50 or more: 46
- Mobile homes: 2,188
Housing units in Brunswick County with a mortgage: 2,318 (49 second mortgage, 0 home equity loan, 38 both second mortgage and home equity loan)
Houses without a mortgage: 103
| Here: | 1.9% with mortgage |
| State: | 97.2% with mortgage |
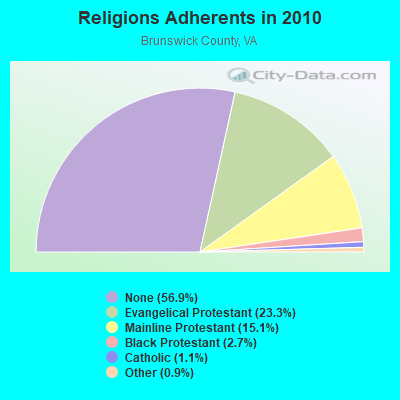
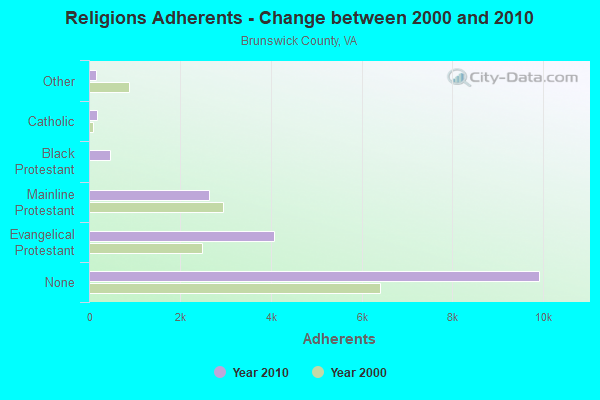
Religion statistics for Brunswick County
| Religion | Adherents | Congregations |
|---|---|---|
| Evangelical Protestant | 4,068 | 19 |
| Mainline Protestant | 2,637 | 27 |
| Black Protestant | 467 | 8 |
| Catholic | 185 | 1 |
| Other | 161 | 1 |
| None | 9,916 | - |
Source: Clifford Grammich, Kirk Hadaway, Richard Houseal, Dale E.Jones, Alexei Krindatch, Richie Stanley and Richard H.Taylor. 2012. 2010 U.S.Religion Census: Religious Congregations & Membership Study. Association of Statisticians of American Religious Bodies. Jones, Dale E., et al. 2002. Congregations and Membership in the United States 2000. Nashville, TN: Glenmary Research Center.
Food Environment Statistics:
| Brunswick County: | 1.13 / 10,000 pop. |
| State: | 2.03 / 10,000 pop. |
| This county: | 2.83 / 10,000 pop. |
| Virginia: | 1.43 / 10,000 pop. |
| Brunswick County: | 8.48 / 10,000 pop. |
| Virginia: | 4.03 / 10,000 pop. |
| This county: | 4.52 / 10,000 pop. |
| State: | 7.65 / 10,000 pop. |
| Brunswick County: | 11.7% |
| Virginia: | 9.3% |
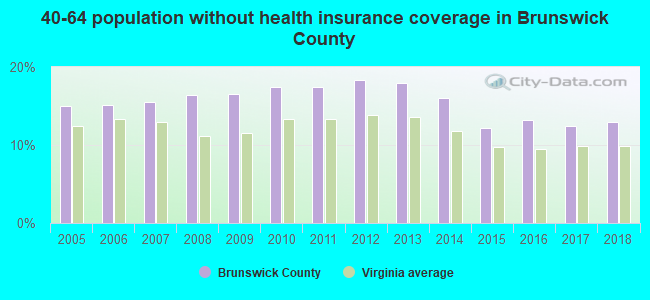
| Brunswick County: | 31.2% |
| State: | 26.7% |
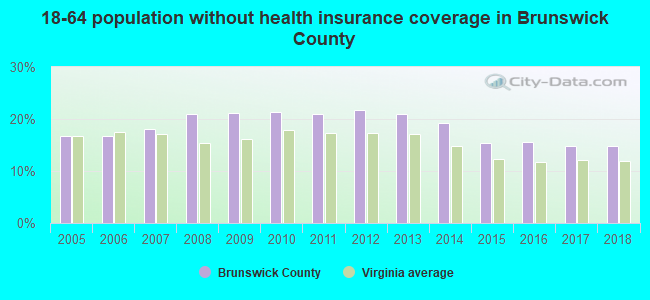
| Here: | 25.1% |
| State: | 18.6% |
Agriculture in Brunswick County:
Average size of farms: 237 acresAverage value of agricultural products sold per farm: $37,935
Average value of crops sold per acre for harvested cropland: $407.17
The value of nursery, greenhouse, floriculture, and sod as a percentage of the total market value of agricultural products sold: 1.02%
The value of livestock, poultry, and their products as a percentage of the total market value of agricultural products sold: 41.80%
Average total farm production expenses per farm: $35,777
Harvested cropland as a percentage of land in farms: 22.84%
Irrigated harvested cropland as a percentage of land in farms: 7.20%
Average market value of all machinery and equipment per farm: $36,071
The percentage of farms operated by a family or individual: 89.79%
Average age of principal farm operators: 58 years
Average number of cattle and calves per 100 acres of all land in farms: 10.09
Milk cows as a percentage of all cattle and calves: 6.62%
Corn for grain: 576 harvested acres
All wheat for grain: 865 harvested acres
Upland cotton: 477 harvested acres
Soybeans for beans: 4340 harvested acres
Vegetables: 12 harvested acres
Land in orchards: 11 acres
Earthquake activity:
Brunswick County-area historical earthquake activity is significantly above Virginia state average. It is 52% smaller than the overall U.S. average.On 8/23/2011 at 17:51:04, a magnitude 5.8 (5.8 MW, Depth: 3.7 mi, Class: Moderate, Intensity: VI - VII) earthquake occurred 79.6 miles away from Brunswick County center
On 8/9/2020 at 12:07:37, a magnitude 5.1 (5.1 MW, Depth: 4.7 mi) earthquake occurred 180.6 miles away from the county center
On 12/9/2003 at 20:59:14, a magnitude 4.5 (4.5 MB, 4.5 LG, Class: Light, Intensity: IV - V) earthquake occurred 57.2 miles away from the county center
On 12/9/2003 at 20:59:18, a magnitude 4.5 (4.5 ML, Depth: 6.2 mi) earthquake occurred 71.3 miles away from the county center
On 8/25/2011 at 05:07:52, a magnitude 4.5 (4.5 ML, Depth: 4.2 mi) earthquake occurred 82.2 miles away from Brunswick County center
On 8/24/2011 at 00:04:36, a magnitude 4.2 (4.2 ML) earthquake occurred 80.0 miles away from the county center
Magnitude types: regional Lg-wave magnitude (LG), body-wave magnitude (MB), local magnitude (ML), moment magnitude (MW)
Most recent natural disasters:
- Virginia Covid-19 Pandemic, Incident Period: January 20, 2020, Major Disaster (Presidential) Declared DR-4512-VA: April 2, 2020, FEMA Id: 4512, Natural disaster type: Other
- Virginia Tropical Storm Michael, Incident Period: October 9, 2018 - October 16, 2018, FEMA Id: 4411, Natural disaster type: Tropical Storm
- Virginia Hurricane Sandy, Incident Period: October 26, 2012 to November 01, 2012, Emergency Declared EM-3359: October 29, 2012, FEMA Id: 3359, Natural disaster type: Hurricane
- Virginia Hurricane Irene, Incident Period: August 26, 2011 to August 28, 2011, Major Disaster (Presidential) Declared DR-4024: September 03, 2011, FEMA Id: 4024, Natural disaster type: Hurricane
- Virginia Hurricane Katrina Evacuation, Incident Period: August 29, 2005 to October 01, 2005, Emergency Declared EM-3240: September 12, 2005, FEMA Id: 3240, Natural disaster type: Hurricane
- Virginia Hurricane Isabel, Incident Period: September 18, 2003 to October 01, 2003, Major Disaster (Presidential) Declared DR-1491: September 18, 2003, FEMA Id: 1491, Natural disaster type: Hurricane
- Virginia Winter Storm, Incident Period: January 25, 2000 to January 30, 2000, Major Disaster (Presidential) Declared DR-1318: February 28, 2000, FEMA Id: 1318, Natural disaster type: Winter Storm
- Virginia Hurricane Floyd, Incident Period: September 13, 1999 to September 26, 1999, Major Disaster (Presidential) Declared DR-1293: September 18, 1999, FEMA Id: 1293, Natural disaster type: Hurricane
- Virginia Hurricane Fran, Incident Period: September 05, 1996 to September 23, 1996, Major Disaster (Presidential) Declared DR-1135: September 06, 1996, FEMA Id: 1135, Natural disaster type: Hurricane
- Virginia Blizzard, Incident Period: January 06, 1996 to January 12, 1996, Major Disaster (Presidential) Declared DR-1086: January 13, 1996, FEMA Id: 1086, Natural disaster type: Blizzard
- 5 other natural disasters have been reported since 1953.
The number of natural disasters in Brunswick County (15) is near the US average (15).
Major Disasters (Presidential) Declared: 9
Emergencies Declared: 5
Causes of natural disasters: Hurricanes: 6, Droughts: 2, Floods: 2, Storms: 2, Winter Storms: 2, Blizzard: 1, Ice Storm: 1, Tropical Storm: 1, Other: 1 (Note: some incidents may be assigned to more than one category).
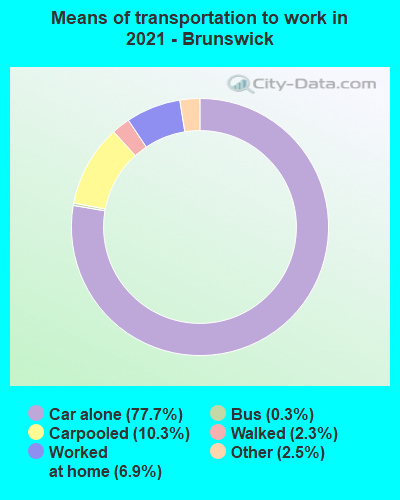
Means of transportation to work:
- Drove a car alone: 2,475 (69.3%)
- Carpooled: 446 (12.5%)
- Bus: 2 (0.1%)
- Taxicab, motorcycle, or other means: 172 (4.8%)
- Walked: 87 (2.4%)
- Worked at home: 352 (9.9%)
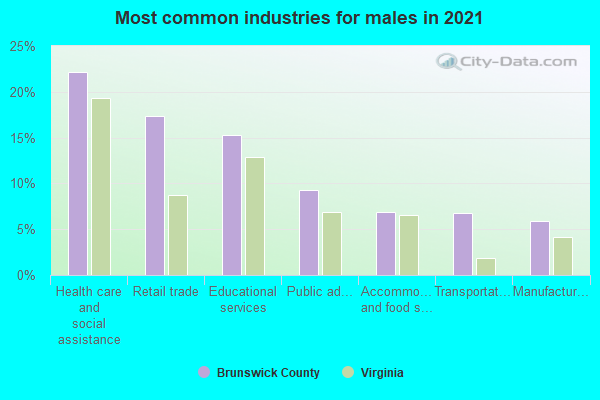
- Retail trade (23%)
- Health care and social assistance (22%)
- Educational services (14%)
- Public administration (9%)
- Accommodation and food services (7%)
- Transportation and warehousing (6%)
- Manufacturing (5%)
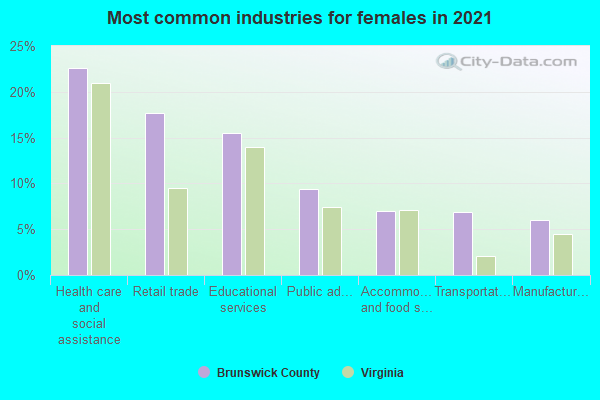
- Retail trade (24%)
- Health care and social assistance (23%)
- Educational services (14%)
- Public administration (9%)
- Accommodation and food services (7%)
- Transportation and warehousing (6%)
- Manufacturing (5%)
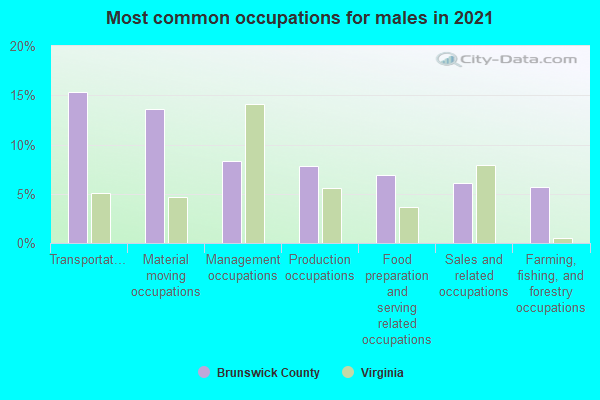
- Transportation occupations (18%)
- Material moving occupations (11%)
- Food preparation and serving related occupations (8%)
- Management occupations (8%)
- Production occupations (6%)
- Office and administrative support occupations (6%)
- Farming, fishing, and forestry occupations (5%)

- Sales and related occupations (20%)
- Healthcare support occupations (12%)
- Office and administrative support occupations (11%)
- Educational instruction, and library occupations (11%)
- Food preparation and serving related occupations (6%)
- Production occupations (6%)
- Transportation occupations (5%)
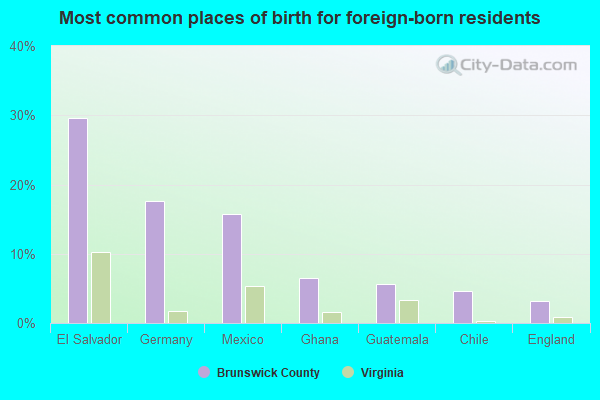
- El Salvador (41%)
- Mexico (16%)
- Germany (11%)
- Ghana (5%)
- Chile (4%)
- Guatemala (4%)
- United Kingdom, excluding England and Scotland (3%)
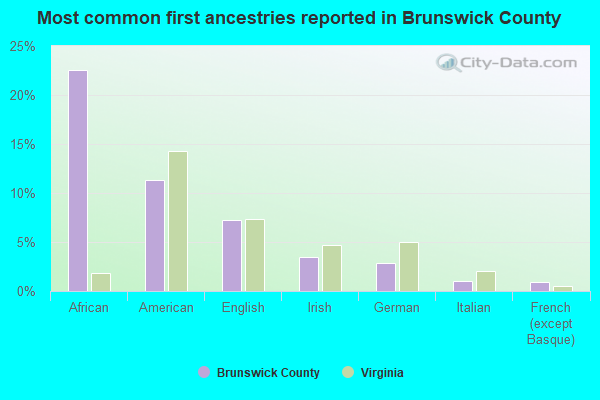
- African (26%)
- American (11%)
- English (8%)
- Irish (4%)
- German (3%)
- French (except Basque) (1%)
- Scotch-Irish (1%)
People in group quarters in Brunswick County, Virginia in 2010:
- 1,583 people in federal detention centers
- 323 people in college/university student housing
- 132 people in state prisons
- 85 people in nursing facilities/skilled-nursing facilities
- 47 people in local jails and other municipal confinement facilities
- 12 people in group homes intended for adults
- 2 people in workers' group living quarters and job corps centers
People in group quarters in Brunswick County, Virginia in 2000:
- 1,571 people in state prisons
- 871 people in local jails and other confinement facilities (including police lockups)
- 354 people in college dormitories (includes college quarters off campus)
- 86 people in nursing homes
- 16 people in other noninstitutional group quarters
- 3 people in homes for abused, dependent, and neglected children
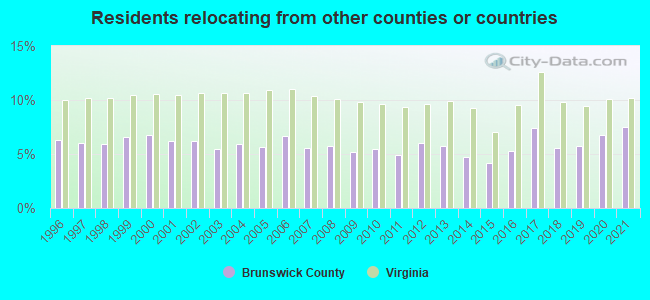
7.52% of this county's 2021 resident taxpayers lived in other counties in 2020 ($40,225 average adjusted gross income)
| Here: | 7.52% |
| Virginia average: | 10.16% |
10 or fewer of this county's residents moved from foreign countries.
5.94% relocated from other counties in Virginia ($28,636 average AGI)
1.58% relocated from other states ($11,589 average AGI)
Brunswick County: 1.58% Virginia average: 3.91%
Top counties from which taxpayers relocated into this county between 2020 and 2021:
| from Mecklenburg County, VA | |
| from Chesterfield County, VA | |
| from Richmond city, VA |
5.58% of this county's 2020 resident taxpayers moved to other counties in 2021 ($38,512 average adjusted gross income)
| Here: | 5.58% |
| Virginia average: | 10.20% |
10 or fewer of this county's residents moved to foreign countries.
4.40% relocated to other counties in Virginia ($25,929 average AGI)
1.18% relocated to other states ($12,582 average AGI)
Brunswick County: 1.18% Virginia average: 3.98%

Top counties to which taxpayers relocated from this county between 2020 and 2021:
| to Mecklenburg County, VA | |
| to Emporia city, VA | |
| to Chesterfield County, VA |
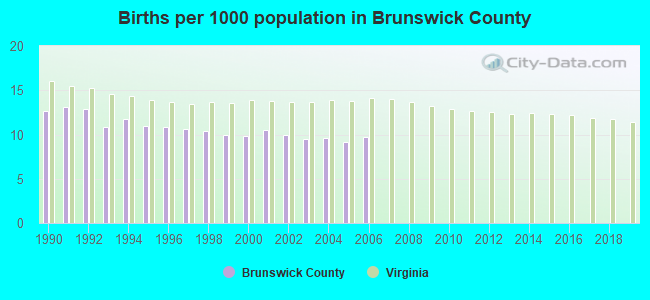
Births per 1000 population from 1990 to 1999: 11.4
Births per 1000 population from 2000 to 2006: 9.7
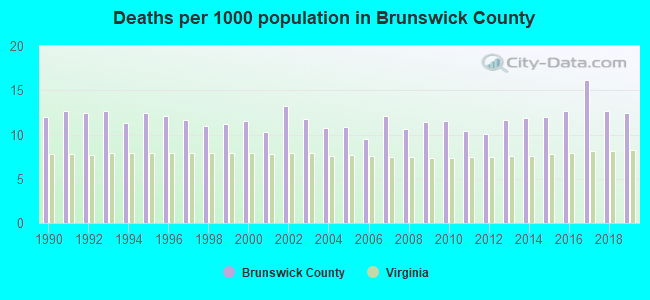
Deaths per 1000 population from 1990 to 1999: 11.9
Deaths per 1000 population from 2000 to 2009: 11.2
Deaths per 1000 population from 2010 to 2020: 12.3
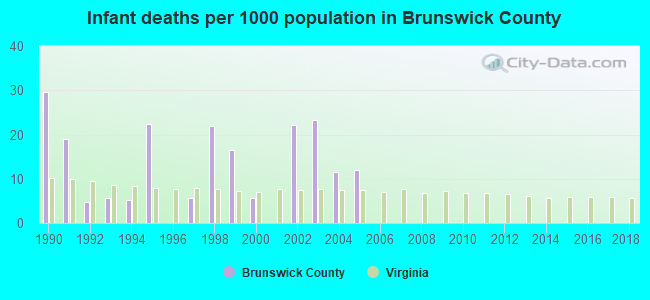
Infant deaths per 1000 live births from 1990 to 1999: 13.1
Infant deaths per 1000 live births from 2000 to 2006: 10.7
Persons under 19 years old without health insurance coverage in 2018: 5.7%

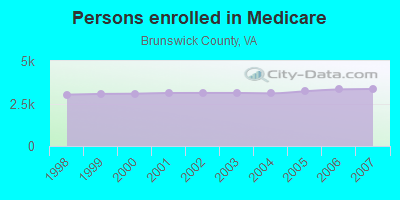
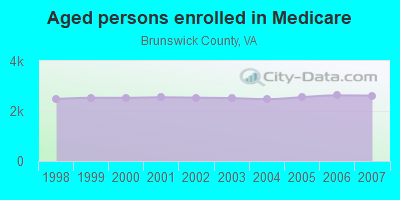
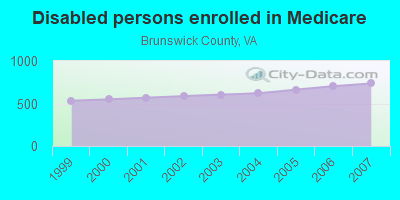
Persons enrolled in hospital insurance and/or supplemental medical insurance (Medicare) in July 1, 2007: 3,353 (2,617 aged, 736 disabled)
Children under 18 without health insurance coverage in 2007: 271 (8%)
Most common underlying causes of death in Brunswick County, Virginia in 1999 - 2019:
- Bronchus or lung, unspecified - Malignant neoplasms (244)
- Atherosclerotic cardiovascular disease, so described (148)
- Acute myocardial infarction, unspecified (110)
- Atherosclerotic heart disease (95)
- Stroke, not specified as haemorrhage or infarction (63)
- Chronic obstructive pulmonary disease, unspecified (27)
- Sequelae of other and unspecified cerebrovascular diseases (23)
- Pneumonia, unspecified (10)
- Septicaemia, unspecified (10)
- Unspecified diabetes mellitus, without complications (10)
Population without health insurance coverage in 2000: 15%
Children under 18 without health insurance coverage in 2000: 11%
Medical specialist MDs per 100,000 population in 2005: 988
Dentists per 100,000 population in 1998: 6
Total births per 100,000 population, July 2005 - July 2006 : 6
Total deaths per 100,000 population, July 2005 - July 2006: 28
Limited-service eating places per 100,000 population in 2005 : 6
Crimes per 100,000 population in 1996: 1
Household type by relationship:
Households: 16,074- Male householders: 2,681 (938 living alone), Female householders: 3,659 (1,136 living alone)
2,265 spouses (2,265 opposite-sex spouses), 772 unmarried partners, (761 opposite-sex unmarried partners), 3,279 children (3,104 natural, 67 adopted, 108 stepchildren), 722 grandchildren, 81 brothers or sisters, 73 parents, 0 foster children, 126 other relatives, 130 non-relatives
- In group quarters: 2,306
Size of family households: 1,839 2-persons, 954 3-persons, 537 4-persons, 412 5-persons, 161 6-persons, 25 7-or-more-persons.
Size of nonfamily households: 2,074 1-person, 316 2-persons, 12 3-persons, 3 5-persons.
791 married couples with children.
1,073 single-parent households (190 men, 883 women).
97.1% of residents of Brunswick speak English at home.
2.2% of residents speak Spanish at home (49% speak English very well, 44% speak English well, 7% speak English not well).
0.2% of residents speak other Indo-European language at home (100% speak English very well).
0.1% of residents speak Asian or Pacific Island language at home (38% speak English very well, 62% speak English well).
0.4% of residents speak other language at home (100% speak English very well).
In fiscal year 2004:
Federal Government expenditure: $103,453,000 ($5,686 per capita)
Department of Defense expenditure: $3,323,000
Federal direct payments to individuals for retirement and disability: $47,537,000
Federal other direct payments to individuals: $28,908,000
Federal direct payments not to individuals: $914,000
Federal grants: $22,202,000
Federal procurement contracts: $1,062,000 ($367,000 Department of Defense)
Federal salaries and wages: $2,830,000 ($0,000 Department of Defense)
Federal Government direct loans: $2,937,000
Federal guaranteed/insured loans: $1,407,000
Federal Government insurance: $7,519,000
Population change from April 1, 2000 to July 1, 2005:
Births: 993| Here: | 55 per 1000 residents |
| State: | 70 per 1000 residents |
Deaths: 1,091
| Here: | 61 per 1000 residents |
| State: | 40 per 1000 residents |
Net international migration: +71
| Here: | +4 per 1000 residents |
| State: | +18 per 1000 residents |
Net internal migration: -425
| Here: | |
| State: |
Total withdrawal of fresh water for public supply: 19.40 millions of gallons per day (all from surface)
| Here: | 6.3 |
| State: | 7.0 |
| Here: | 5.0 |
| State: | 4.3 |
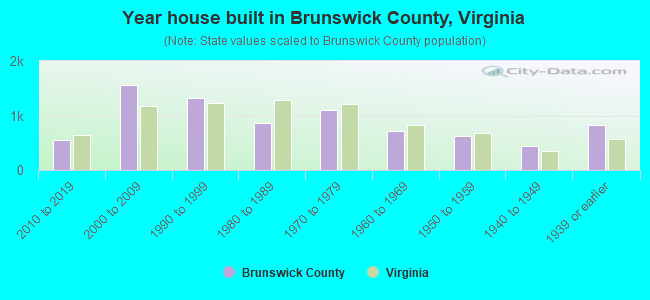
- Year house built in Brunswick County, Virginia
- 02020 or later
- 6022010 to 2019
- 1,5502000 to 2009
- 1,3931990 to 1999
- 7801980 to 1989
- 1,0071970 to 1979
- 6041960 to 1969
- 7811950 to 1959
- 4631940 to 1949
- 7841939 or earlier
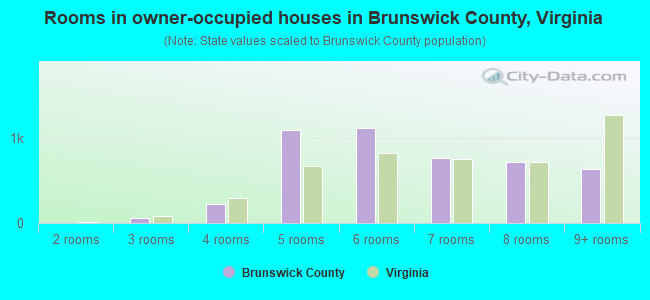
- Rooms in owner-occupied houses in Brunswick County, Virginia
- 01 room
- 32 rooms
- 653 rooms
- 2894 rooms
- 1,0275 rooms
- 1,1416 rooms
- 7427 rooms
- 7148 rooms
- 6699+ rooms
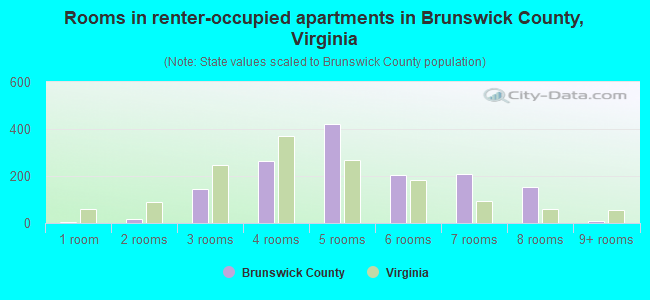
- Rooms in renter-occupied apartments in Brunswick County, Virginia
- 231 room
- 32 rooms
- 1783 rooms
- 3254 rooms
- 5285 rooms
- 2246 rooms
- 1637 rooms
- 1808 rooms
- 99+ rooms
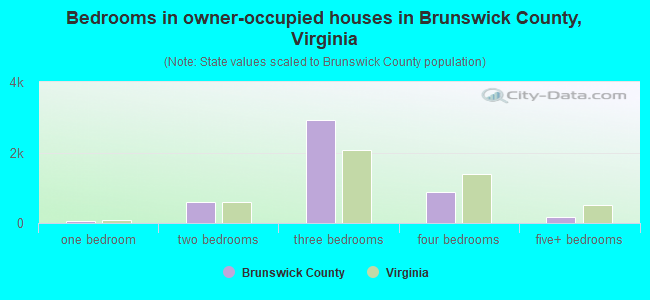
- Bedrooms in owner-occupied houses in Brunswick County, Virginia
- 0no bedroom
- 641 bedroom
- 5722 bedrooms
- 2,9793 bedrooms
- 8884 bedrooms
- 1625+ bedrooms
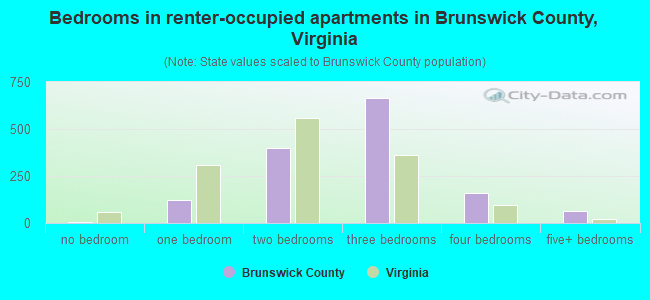
- Bedrooms in renter-occupied apartments in Brunswick County, Virginia
- 23no bedroom
- 981 bedroom
- 4982 bedrooms
- 7883 bedrooms
- 1384 bedrooms
- 1085+ bedrooms
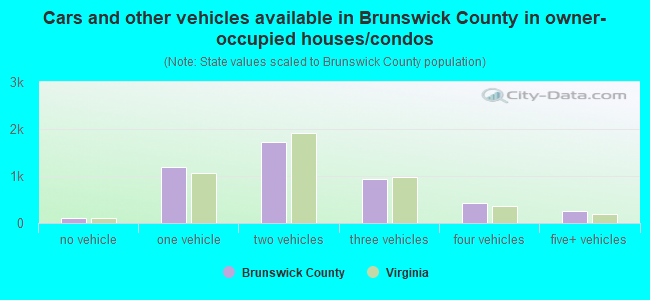
- Cars and other vehicles available in Brunswick County in owner-occupied houses/condos
- 141no vehicle
- 1,2161 vehicle
- 1,7212 vehicles
- 8163 vehicles
- 4754 vehicles
- 3135+ vehicles
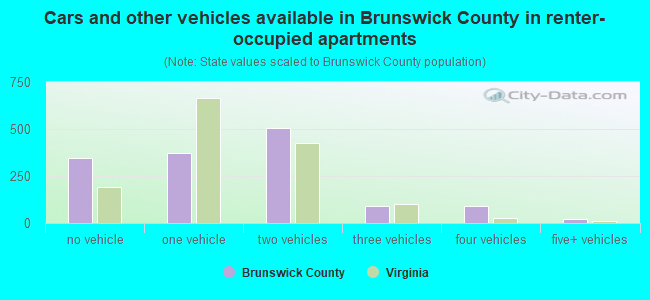
- Cars and other vehicles available in Brunswick County in renter-occupied apartments
- 343no vehicle
- 4671 vehicle
- 5262 vehicles
- 2023 vehicles
- 944 vehicles
- 175+ vehicles
89.5% of Brunswick County residents lived in the same house 1 years ago.
Out of people who lived in different houses, 18% lived in this county.
Out of people who lived in different counties, 79% lived in Virginia.
| Brunswick County: | 89.5% |
| State average: | 86.6% |
Place of birth for U.S.-born residents:
- This state: 12,246
- Other state: 3,222
- Northeast: 1,078
- Midwest: 244
- South: 1,754
- West: 135

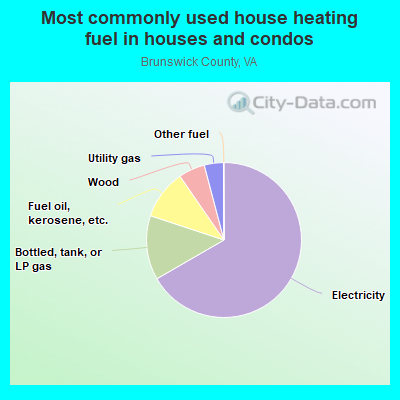
- 66.9%Electricity
- 12.0%Bottled, tank, or LP gas
- 10.7%Fuel oil, kerosene, etc.
- 5.2%Wood
- 4.2%Utility gas
- 0.9%Other fuel
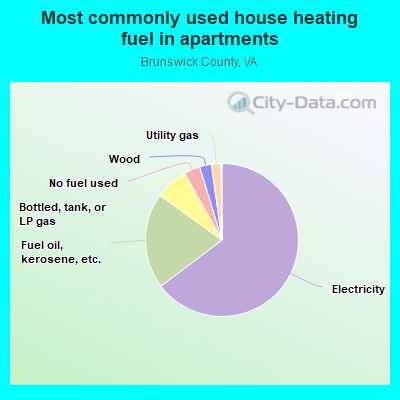
- 63.5%Electricity
- 23.4%Fuel oil, kerosene, etc.
- 6.7%Bottled, tank, or LP gas
- 3.9%Wood
- 2.4%No fuel used
- 0.1%Other fuel
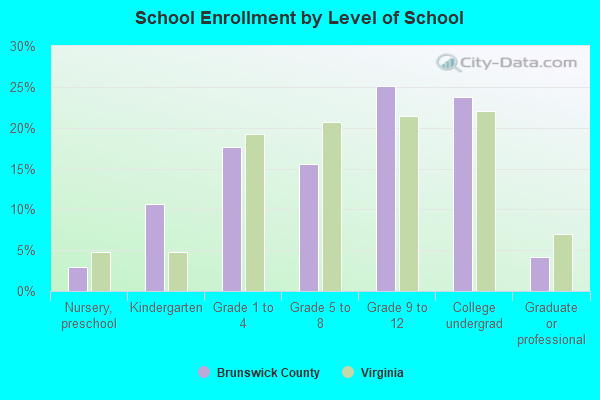
Private vs. public school enrollment:
| Here: | 16.9% |
| Virginia: | 13.2% |
| Here: | 1.9% |
| Virginia: | 10.2% |
| Here: | 23.1% |
| Virginia: | 18.7% |
Brunswick County government finances - Expenditure in 2020:
- Bond Funds - Cash and Securities: $4,323,000
- Charges - Solid Waste Management: $456,000
Elementary and Secondary Education School Lunch: $190,000
Elementary and Secondary Education School Tuition and Transportation: $7,000
Elementary and Secondary Education - Other: $2,000
- Construction - Elementary and Secondary Education: $36,000
- Current Operations - Elementary and Secondary Education: $23,110,000
Elementary and Secondary Education: $21,811,000
General - Other: $6,968,000
Police Protection: $3,975,000
Police Protection: $3,393,000
Correctional Institutions: $3,148,000
Judicial and Legal Services: $1,084,000
General Public Buildings: $1,051,000
Health - Other: $1,030,000
Financial Administration: $978,000
Solid Waste Management: $964,000
Central Staff Services: $844,000
Solid Waste Management: $730,000
Financial Administration: $726,000
Central Staff Services: $629,000
Libraries: $193,000
- Federal Intergovernmental - Education: $465,000
Housing and Community Development: $105,000
Education: $52,000
- General - Interest on Debt: $534,000
- Intergovernmental to Local - Other - Elementary and Secondary Education: $493,000
Other - Elementary and Secondary Education: $310,000
- Local Intergovernmental - Education: $154,000
Education: $142,000
- Long Term Debt - Beginning Outstanding - Unspecified Public Purpose: $17,826,000
Outstanding Unspecified Public Purpose: $17,826,000
Beginning Outstanding - Unspecified Public Purpose: $11,055,000
Outstanding Unspecified Public Purpose: $10,205,000
Beginning Outstanding - Public Debt for Private Purpose: $1,501,000
Outstanding Nonguaranteed - Industrial Revenue: $1,290,000
Retired Unspecified Public Purpose: $850,000
Retired Nonguaranteed - Public Debt for Private Purpose: $211,000
- Miscellaneous - Fines and Forfeits: $1,437,000
Fines and Forfeits: $1,334,000
General Revenue - Other: $942,000
General Revenue - Other: $320,000
Interest Earnings: $88,000
Sale of Property: $8,000
Donations From Private Sources: $5,000
- Other Capital Outlay - Elementary and Secondary Education: $243,000
Elementary and Secondary Education: $156,000
- Other Funds - Cash and Securities: $16,680,000
- Sinking Funds - Cash and Securities: $1,290,000
- State Intergovernmental - Education: $16,683,000
Education: $16,635,000
General Local Government Support: $4,155,000
Public Welfare: $643,000
- Tax - Property: $16,442,000
Property: $14,258,000
General Sales and Gross Receipts: $881,000
General Sales and Gross Receipts: $457,000
Other Selective Sales: $428,000
Motor Vehicle License: $388,000
Motor Vehicle License: $308,000
Public Utilities Sales: $301,000
- Total Salaries and Wages: $13,093,000
: $12,515,000
Brunswick County government finances - Revenue in 2020:
- Bond Funds - Cash and Securities: $4,323,000
- Charges - Solid Waste Management: $456,000
Elementary and Secondary Education School Lunch: $190,000
Elementary and Secondary Education School Tuition and Transportation: $7,000
Elementary and Secondary Education - Other: $2,000
- Construction - Elementary and Secondary Education: $36,000
- Current Operations - Elementary and Secondary Education: $23,110,000
Elementary and Secondary Education: $21,811,000
General - Other: $6,968,000
Police Protection: $3,975,000
Police Protection: $3,393,000
Correctional Institutions: $3,148,000
Judicial and Legal Services: $1,084,000
General Public Buildings: $1,051,000
Health - Other: $1,030,000
Financial Administration: $978,000
Solid Waste Management: $964,000
Central Staff Services: $844,000
Solid Waste Management: $730,000
Financial Administration: $726,000
Central Staff Services: $629,000
Libraries: $193,000
- Federal Intergovernmental - Education: $465,000
Housing and Community Development: $105,000
Education: $52,000
- General - Interest on Debt: $534,000
- Intergovernmental to Local - Other - Elementary and Secondary Education: $493,000
Other - Elementary and Secondary Education: $310,000
- Local Intergovernmental - Education: $154,000
Education: $142,000
- Long Term Debt - Beginning Outstanding - Unspecified Public Purpose: $17,826,000
Outstanding Unspecified Public Purpose: $17,826,000
Beginning Outstanding - Unspecified Public Purpose: $11,055,000
Outstanding Unspecified Public Purpose: $10,205,000
Beginning Outstanding - Public Debt for Private Purpose: $1,501,000
Outstanding Nonguaranteed - Industrial Revenue: $1,290,000
Retired Unspecified Public Purpose: $850,000
Retired Nonguaranteed - Public Debt for Private Purpose: $211,000
- Miscellaneous - Fines and Forfeits: $1,437,000
Fines and Forfeits: $1,334,000
General Revenue - Other: $942,000
General Revenue - Other: $320,000
Interest Earnings: $88,000
Sale of Property: $8,000
Donations From Private Sources: $5,000
- Other Capital Outlay - Elementary and Secondary Education: $243,000
Elementary and Secondary Education: $156,000
- Other Funds - Cash and Securities: $16,680,000
- Sinking Funds - Cash and Securities: $1,290,000
- State Intergovernmental - Education: $16,683,000
Education: $16,635,000
General Local Government Support: $4,155,000
Public Welfare: $643,000
- Tax - Property: $16,442,000
Property: $14,258,000
General Sales and Gross Receipts: $881,000
General Sales and Gross Receipts: $457,000
Other Selective Sales: $428,000
Motor Vehicle License: $388,000
Motor Vehicle License: $308,000
Public Utilities Sales: $301,000
- Total Salaries and Wages: $13,093,000
: $12,515,000
Brunswick County government finances - Debt in 2020:
- Bond Funds - Cash and Securities: $4,323,000
- Charges - Solid Waste Management: $456,000
Elementary and Secondary Education School Lunch: $190,000
Elementary and Secondary Education School Tuition and Transportation: $7,000
Elementary and Secondary Education - Other: $2,000
- Construction - Elementary and Secondary Education: $36,000
- Current Operations - Elementary and Secondary Education: $23,110,000
Elementary and Secondary Education: $21,811,000
General - Other: $6,968,000
Police Protection: $3,975,000
Police Protection: $3,393,000
Correctional Institutions: $3,148,000
Judicial and Legal Services: $1,084,000
General Public Buildings: $1,051,000
Health - Other: $1,030,000
Financial Administration: $978,000
Solid Waste Management: $964,000
Central Staff Services: $844,000
Solid Waste Management: $730,000
Financial Administration: $726,000
Central Staff Services: $629,000
Libraries: $193,000
- Federal Intergovernmental - Education: $465,000
Housing and Community Development: $105,000
Education: $52,000
- General - Interest on Debt: $534,000
- Intergovernmental to Local - Other - Elementary and Secondary Education: $493,000
Other - Elementary and Secondary Education: $310,000
- Local Intergovernmental - Education: $154,000
Education: $142,000
- Long Term Debt - Beginning Outstanding - Unspecified Public Purpose: $17,826,000
Outstanding Unspecified Public Purpose: $17,826,000
Beginning Outstanding - Unspecified Public Purpose: $11,055,000
Outstanding Unspecified Public Purpose: $10,205,000
Beginning Outstanding - Public Debt for Private Purpose: $1,501,000
Outstanding Nonguaranteed - Industrial Revenue: $1,290,000
Retired Unspecified Public Purpose: $850,000
Retired Nonguaranteed - Public Debt for Private Purpose: $211,000
- Miscellaneous - Fines and Forfeits: $1,437,000
Fines and Forfeits: $1,334,000
General Revenue - Other: $942,000
General Revenue - Other: $320,000
Interest Earnings: $88,000
Sale of Property: $8,000
Donations From Private Sources: $5,000
- Other Capital Outlay - Elementary and Secondary Education: $243,000
Elementary and Secondary Education: $156,000
- Other Funds - Cash and Securities: $16,680,000
- Sinking Funds - Cash and Securities: $1,290,000
- State Intergovernmental - Education: $16,683,000
Education: $16,635,000
General Local Government Support: $4,155,000
Public Welfare: $643,000
- Tax - Property: $16,442,000
Property: $14,258,000
General Sales and Gross Receipts: $881,000
General Sales and Gross Receipts: $457,000
Other Selective Sales: $428,000
Motor Vehicle License: $388,000
Motor Vehicle License: $308,000
Public Utilities Sales: $301,000
- Total Salaries and Wages: $13,093,000
: $12,515,000
Brunswick County government finances - Cash and Securities in 2020:
- Bond Funds - Cash and Securities: $4,323,000
- Charges - Solid Waste Management: $456,000
Elementary and Secondary Education School Lunch: $190,000
Elementary and Secondary Education School Tuition and Transportation: $7,000
Elementary and Secondary Education - Other: $2,000
- Construction - Elementary and Secondary Education: $36,000
- Current Operations - Elementary and Secondary Education: $23,110,000
Elementary and Secondary Education: $21,811,000
General - Other: $6,968,000
Police Protection: $3,975,000
Police Protection: $3,393,000
Correctional Institutions: $3,148,000
Judicial and Legal Services: $1,084,000
General Public Buildings: $1,051,000
Health - Other: $1,030,000
Financial Administration: $978,000
Solid Waste Management: $964,000
Central Staff Services: $844,000
Solid Waste Management: $730,000
Financial Administration: $726,000
Central Staff Services: $629,000
Libraries: $193,000
- Federal Intergovernmental - Education: $465,000
Housing and Community Development: $105,000
Education: $52,000
- General - Interest on Debt: $534,000
- Intergovernmental to Local - Other - Elementary and Secondary Education: $493,000
Other - Elementary and Secondary Education: $310,000
- Local Intergovernmental - Education: $154,000
Education: $142,000
- Long Term Debt - Beginning Outstanding - Unspecified Public Purpose: $17,826,000
Outstanding Unspecified Public Purpose: $17,826,000
Beginning Outstanding - Unspecified Public Purpose: $11,055,000
Outstanding Unspecified Public Purpose: $10,205,000
Beginning Outstanding - Public Debt for Private Purpose: $1,501,000
Outstanding Nonguaranteed - Industrial Revenue: $1,290,000
Retired Unspecified Public Purpose: $850,000
Retired Nonguaranteed - Public Debt for Private Purpose: $211,000
- Miscellaneous - Fines and Forfeits: $1,437,000
Fines and Forfeits: $1,334,000
General Revenue - Other: $942,000
General Revenue - Other: $320,000
Interest Earnings: $88,000
Sale of Property: $8,000
Donations From Private Sources: $5,000
- Other Capital Outlay - Elementary and Secondary Education: $243,000
Elementary and Secondary Education: $156,000
- Other Funds - Cash and Securities: $16,680,000
- Sinking Funds - Cash and Securities: $1,290,000
- State Intergovernmental - Education: $16,683,000
Education: $16,635,000
General Local Government Support: $4,155,000
Public Welfare: $643,000
- Tax - Property: $16,442,000
Property: $14,258,000
General Sales and Gross Receipts: $881,000
General Sales and Gross Receipts: $457,000
Other Selective Sales: $428,000
Motor Vehicle License: $388,000
Motor Vehicle License: $308,000
Public Utilities Sales: $301,000
- Total Salaries and Wages: $13,093,000
: $12,515,000
Supplemental Security Income (SSI) in 2006:
- Total number of recipients: 706
- Number of aged recipients: 103
- Number of blind and disabled recipients: 603
- Number of recipients under 18: 107
- Number of recipients between 18 and 64: 405
- Number of recipients older than 64: 194
- Number of recipients also receiving OASDI: 320
- Amount of payments (thousands of dollars): 281
| Most common first names in Brunswick County, VA among deceased individuals | ||
| Name | Count | Lived (average) |
|---|---|---|
| James | 139 | 70.2 years |
| William | 131 | 72.4 years |
| Mary | 105 | 78.6 years |
| Robert | 97 | 71.7 years |
| John | 96 | 74.5 years |
| George | 69 | 74.4 years |
| Willie | 65 | 72.1 years |
| Thomas | 54 | 72.6 years |
| Annie | 48 | 80.3 years |
| Joseph | 43 | 74.0 years |
| Most common last names in Brunswick County, VA among deceased individuals | ||
| Last name | Count | Lived (average) |
|---|---|---|
| Jones | 110 | 72.6 years |
| Walker | 90 | 75.1 years |
| Clary | 73 | 75.6 years |
| Williams | 62 | 73.5 years |
| Brown | 48 | 69.7 years |
| Harrison | 47 | 72.1 years |
| Taylor | 47 | 73.4 years |
| Powell | 46 | 76.1 years |
| Coleman | 42 | 73.2 years |
| Smith | 41 | 69.8 years |
| Businesses in Brunswick County, VA | ||||
| Name | Count | Name | Count | |
|---|---|---|---|---|
| Circle K | 1 | Nike | 2 | |
| FedEx | 1 | Rite Aid | 1 | |
| Hardee's | 1 | Subway | 1 | |
| McDonald's | 1 | UPS | 1 | |