Brooks County, Texas (TX)
County owner-occupied free and clear houses and condos in 2010: 1,386
County owner-occupied houses and condos in 2000: 1,981
Renter-occupied apartments: 813 (it was 730 in 2000)
| % of renters here: | 27% |
| State: | 36% |
Land area: 943 sq. mi.
Water area: 0.3 sq. mi.
Population density: 8 people per square mile (very low).
Industries providing employment: Educational, health and social services (30.9%), Arts, entertainment, recreation, accommodation and food services (15.6%), Retail trade (12.0%).
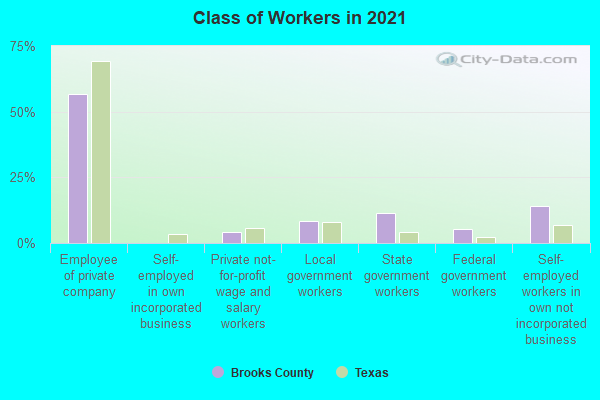
Type of workers:
- Private wage or salary: 63%
- Government: 23%
- Self-employed, not incorporated: 14%
- Unpaid family work: 0%
- OSM Map
- General Map
- Google Map
- MSN Map

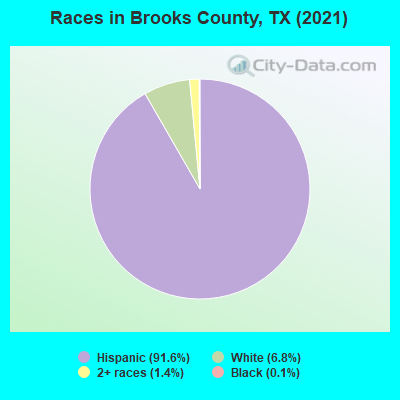
- 6,53389.4%Hispanic or Latino
- 5828.0%White Non-Hispanic Alone
- 1351.8%Two or more races
- 440.6%Black Non-Hispanic Alone
- 120.2%Native Hawaiian and Other
Pacific Islander alone
| Median resident age: | 38.7 years |
| Texas median age: | 35.6 years |
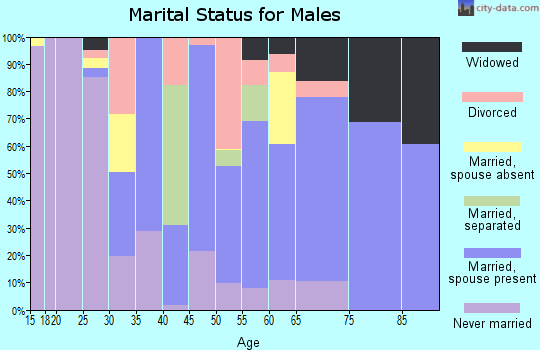
| Males: 3,476 | |
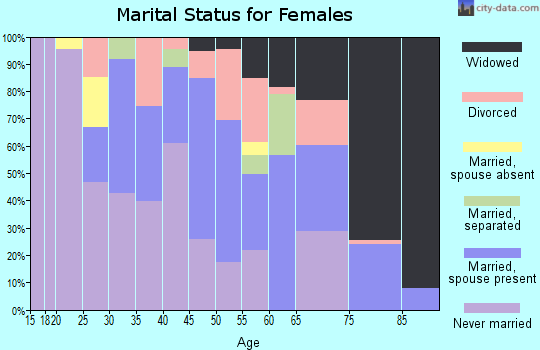
| Females: 3,772 |

 | New County Population Estimates from the Census Bureau for Jluy 1, 2016 posted this morning about 9 A. M. (13 replies) |
| Looking for Small Town Blue State Area of Texas (42 replies) |
| Hebbronville?? (6 replies) |
| Why so many El Paso singles already divorced or with kids? (58 replies) |
| Corpus Christi, TX. (48 replies) |
| Living in Michigan, thinking about relocating to Texas (13 replies) |
| Brooks County: | 2.0 people |
| Texas: | 3 people |
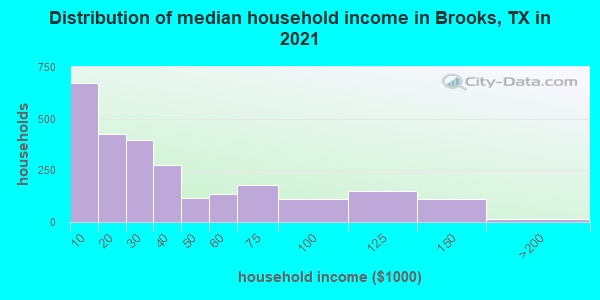
Estimated median household income in 2022: $30,251 ($18,622 in 1999)
| This county: | $30,251 |
| Texas: | $72,284 |
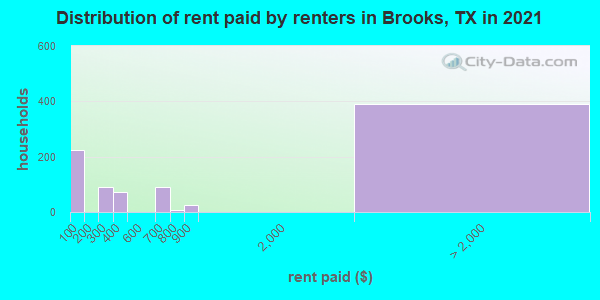
Median contract rent in 2022 for apartments: $102 (lower quartile is $100, upper quartile is $384)
| This county: | $102 |
| State: | $1117 |
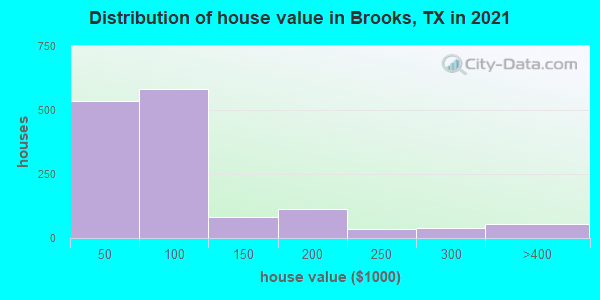
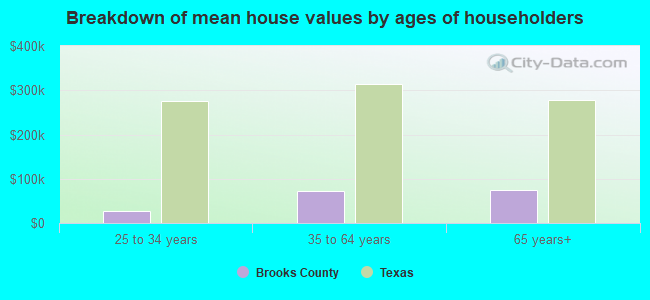
Estimated median house or condo value in 2022: $92,687 (it was $33,000 in 2000)
| Brooks: | $92,687 |
| Texas: | $275,400 |
Mean price in 2022:
Median monthly housing costs for homes and condos with a mortgage: $1,161Detached houses: $116,810
Here: $116,810 State: $369,058 Mobile homes: $39,857
Here: $39,857 State: $124,413
Median monthly housing costs for units without a mortgage: $391
Institutionalized population: 67
Crime in 2021 (reported by the sheriff's office or county police, not the county total):
- Murders: 0
- Rapes: 0
- Robberies: 0
- Assaults: 1
- Burglaries: 3
- Thefts: 0
- Auto thefts: 0
Crime in 2020 (reported by the sheriff's office or county police, not the county total):
- Murders: 0
- Rapes: 0
- Robberies: 0
- Assaults: 1
- Burglaries: 1
- Thefts: 0
- Auto thefts: 2
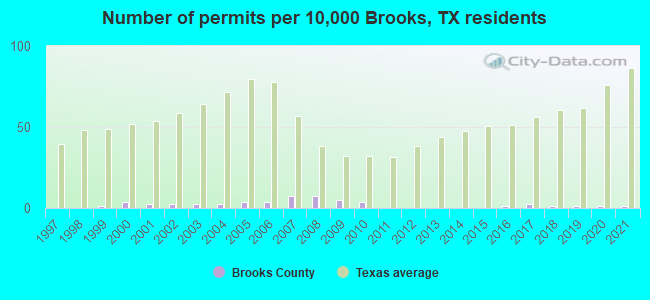
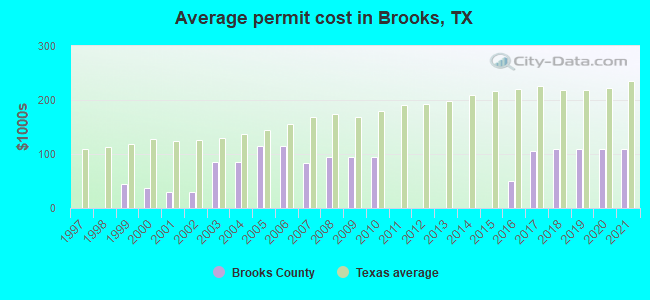
Single-family new house construction building permits:
- 2022: 0 buildings
- 2021: 1 building, cost: $110,000
- 2020: 1 building, cost: $110,000
- 2019: 1 building, cost: $110,000
- 2018: 1 building, cost: $110,000
- 2017: 2 buildings, average cost: $105,000
- 2016: 1 building, cost: $50,000
- 2015: 0 buildings
- 2014: 0 buildings
- 2013: 0 buildings
- 2012: 0 buildings
- 2011: 0 buildings
- 2010: 3 buildings, average cost: $95,100
- 2009: 4 buildings, average cost: $95,100
- 2008: 6 buildings, average cost: $95,100
- 2007: 6 buildings, average cost: $83,700
- 2006: 3 buildings, average cost: $113,800
- 2005: 3 buildings, average cost: $113,800
- 2004: 2 buildings, average cost: $85,000
- 2003: 2 buildings, average cost: $85,000
- 2002: 2 buildings, average cost: $28,900
- 2001: 2 buildings, average cost: $28,900
- 2000: 3 buildings, average cost: $37,000
- 1999: 1 building, cost: $44,000
- 1998: 0 buildings
- 1997: 0 buildings
Median real estate property taxes paid for housing units with mortgages in 2022: $1,418 (1.2%)
Median real estate property taxes paid for housing units with no mortgage in 2022: $731 (1.0%)
| Brooks County: | 33.3% |
| Texas: | 14.0% |
Median age of residents in 2022: 38.7 years old
(Males: 37.3 years old, Females: 44.6 years old)
(Median age for: White residents: 35.9 years old, Black residents: 39.5 years old, Hispanic or Latino residents: 39.2 years old, Other race residents: 32.1 years old)
Fair market rent in 2006 for a 1-bedroom apartment in Brooks County is $432 a month.
Fair market rent for a 2-bedroom apartment is $484 a month.
Fair market rent for a 3-bedroom apartment is $692 a month.
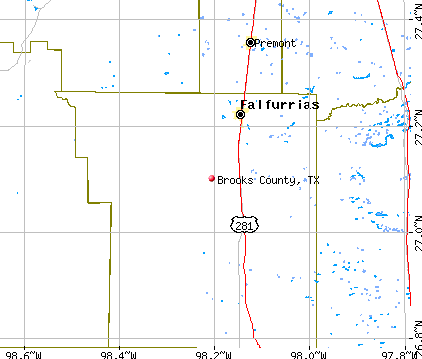
Cities in this county include: Falfurrias, Cantu Addition, Encino, Flowella, Airport Road Addition.
Neighboring counties: Charlotte County, Florida  , Hardee County, Florida , Martin County, Florida , Palm Beach County, Florida , Kleberg County
  .
.
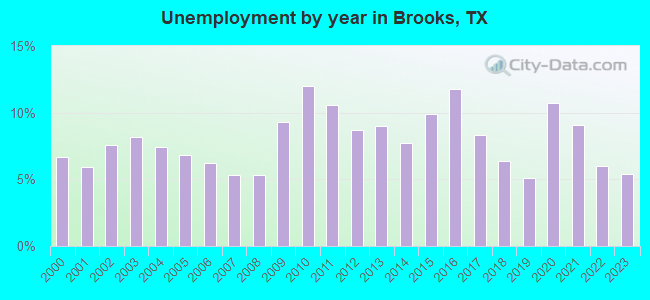
| Here: | 4.7% |
| Texas: | 3.5% |
Current college students: 280
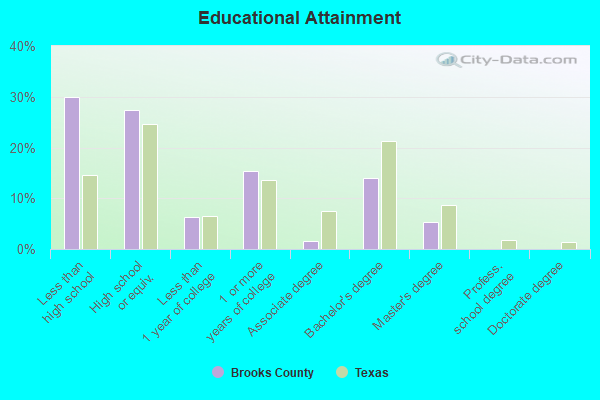
People 25 years of age or older with a high school degree or higher: 70.1%
People 25 years of age or older with a bachelor's degree or higher: 19.1%
Number of foreign born residents: 664 (34.5% naturalized citizens)
| Brooks County: | 9.2% |
| Whole state: | 17.2% |
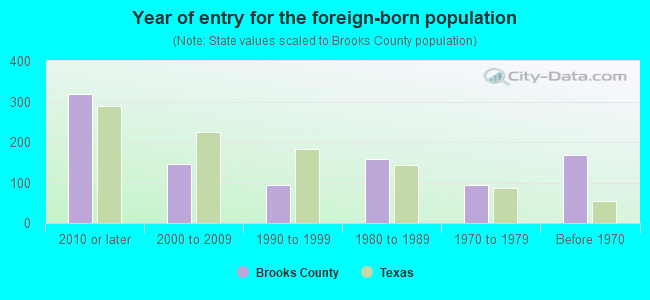
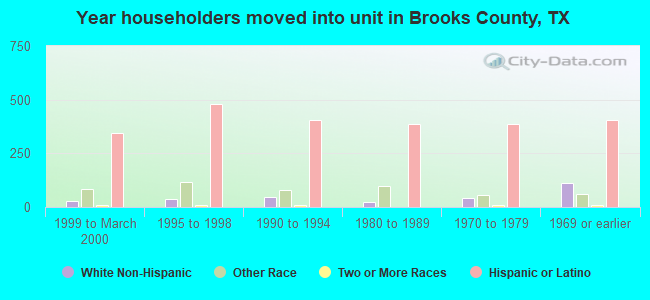
- Year of entry for the foreign-born population
- 3082010 or later
- 1012000 to 2009
- 1081990 to 1999
- 1591980 to 1989
- 941970 to 1979
- 167Before 1970
Mean travel time to work (commute): minutes
Percentage of county residents living and working in this county: 100.1%
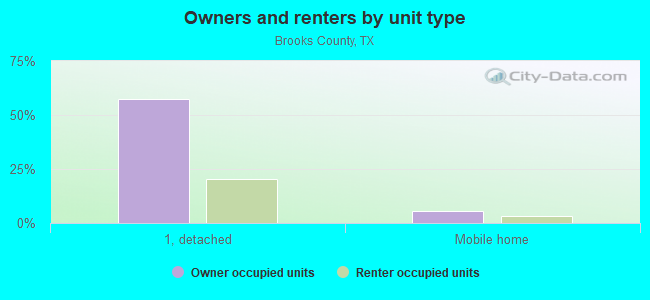
Housing units in structures:
- One, detached: 2,991
- Two: 319
- 3 or 4: 44
- 5 to 9: 10
- 20 to 49: 16
- 50 or more: 36
- Mobile homes: 362
Housing units in Brooks County with a mortgage: 332 (0 second mortgage, 0 home equity loan, 0 both second mortgage and home equity loan)
Houses without a mortgage: 0
| Here: | 100.0% with mortgage |
| State: | 98.4% with mortgage |
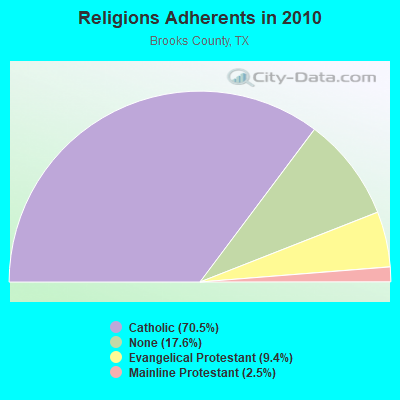
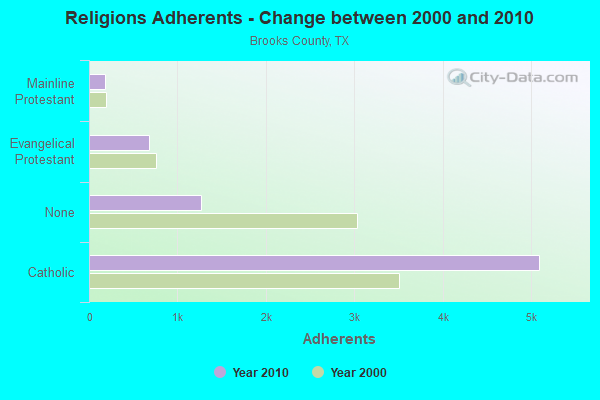
Religion statistics for Brooks County
| Religion | Adherents | Congregations |
|---|---|---|
| Catholic | 5,091 | 2 |
| Evangelical Protestant | 679 | 11 |
| Mainline Protestant | 182 | 2 |
| Other | - | 1 |
| None | 1,271 | - |
Source: Clifford Grammich, Kirk Hadaway, Richard Houseal, Dale E.Jones, Alexei Krindatch, Richie Stanley and Richard H.Taylor. 2012. 2010 U.S.Religion Census: Religious Congregations & Membership Study. Association of Statisticians of American Religious Bodies. Jones, Dale E., et al. 2002. Congregations and Membership in the United States 2000. Nashville, TN: Glenmary Research Center.
Food Environment Statistics:
| Brooks County: | 1.33 / 10,000 pop. |
| State: | 1.47 / 10,000 pop. |
| This county: | 3.98 / 10,000 pop. |
| Texas: | 1.11 / 10,000 pop. |
| Brooks County: | 5.30 / 10,000 pop. |
| Texas: | 3.95 / 10,000 pop. |
| This county: | 11.93 / 10,000 pop. |
| State: | 6.13 / 10,000 pop. |
| Brooks County: | 9.8% |
| Texas: | 8.9% |
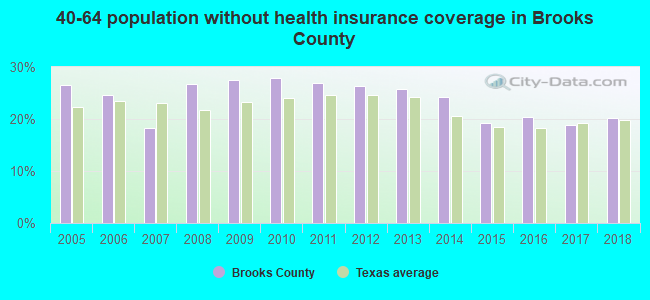
| Brooks County: | 26.2% |
| State: | 26.6% |
| Here: | 17.4% |
| State: | 15.7% |
Agriculture in Brooks County:
Average size of farms: 1253 acresAverage value of agricultural products sold per farm: $21,575
Average value of crops sold per acre for harvested cropland: $41.17
The value of nursery, greenhouse, floriculture, and sod as a percentage of the total market value of agricultural products sold: 0.00%
The value of livestock, poultry, and their products as a percentage of the total market value of agricultural products sold: 96.35%
Average total farm production expenses per farm: $27,703
Harvested cropland as a percentage of land in farms: 1.53%
Irrigated harvested cropland as a percentage of land in farms: 10.07%
Average market value of all machinery and equipment per farm: $30,620
The percentage of farms operated by a family or individual: 90.03%
Average age of principal farm operators: 61 years
Average number of cattle and calves per 100 acres of all land in farms: 6.37
Land in orchards: 154 acres
Earthquake activity:
Brooks County-area historical earthquake activity is above Texas state average. It is 50% smaller than the overall U.S. average.On 10/20/2011 at 12:24:41, a magnitude 4.8 (4.8 MW, Depth: 3.1 mi, Class: Light, Intensity: IV - V) earthquake occurred 122.4 miles away from Brooks County center
On 4/9/1993 at 12:29:19, a magnitude 4.3 (4.1 MB, 4.3 LG, Depth: 3.1 mi) earthquake occurred 118.5 miles away from the county center
On 4/14/1995 at 00:32:56, a magnitude 5.7 (5.6 MB, 5.7 MS, 5.7 MW, Depth: 11.1 mi, Class: Moderate, Intensity: VI - VII) earthquake occurred 382.5 miles away from the county center
On 4/25/2010 at 02:10:42, a magnitude 3.9 (3.9 MB, Depth: 3.1 mi, Class: Light, Intensity: II - III) earthquake occurred 47.6 miles away from the county center
On 3/24/1997 at 22:31:34, a magnitude 3.8 (3.8 LG, Depth: 3.1 mi) earthquake occurred 43.7 miles away from Brooks County center
On 5/1/2018 at 16:28:56, a magnitude 4.0 (4.0 MW, Depth: 3.1 mi) earthquake occurred 128.5 miles away from the county center
Magnitude types: regional Lg-wave magnitude (LG), body-wave magnitude (MB), surface-wave magnitude (MS), moment magnitude (MW)
Most recent natural disasters:
- Texas Covid-19 Pandemic, Incident Period: January 20, 2020, FEMA Id: 4485, Natural disaster type: Other
- Texas Tropical Storm Alex, Incident Period: June 27, 2010 to August 14, 2010, Emergency Declared EM-3313: June 29, 2010, FEMA Id: 3313, Natural disaster type: Tropical Storm
- Texas Hurricane Ike, Incident Period: September 07, 2008 to September 26, 2008, Emergency Declared EM-3294: September 10, 2008, FEMA Id: 3294, Natural disaster type: Hurricane
- Texas Hurricane Gustav, Incident Period: August 27, 2008 to September 07, 2008, Emergency Declared EM-3290: August 29, 2008, FEMA Id: 3290, Natural disaster type: Hurricane
- Texas Hurricane Dolly, Incident Period: July 22, 2008 to August 01, 2008, Major Disaster (Presidential) Declared DR-1780: July 24, 2008, FEMA Id: 1780, Natural disaster type: Hurricane
- Texas Encino Fire, Incident Period: March 19, 2008 to March 23, 2008, Fire Management Assistance Declared: March 19, 2008, FEMA Id: 2755, Natural disaster type: Fire
- Texas Burns Ranch Fire, Incident Period: March 18, 2008 to March 23, 2008, Fire Management Assistance Declared: March 19, 2008, FEMA Id: 2754, Natural disaster type: Fire
- Texas Wildfires, Incident Period: March 14, 2008 to September 01, 2008, Emergency Declared EM-3284: March 14, 2008, FEMA Id: 3284, Natural disaster type: Fire
- Texas Hurricane Dean, Incident Period: August 17, 2007 to September 05, 2007, Emergency Declared EM-3277: August 18, 2007, FEMA Id: 3277, Natural disaster type: Hurricane
- Texas Hurricane Rita, Incident Period: September 23, 2005 to October 14, 2005, Major Disaster (Presidential) Declared DR-1606: September 24, 2005, FEMA Id: 1606, Natural disaster type: Hurricane
- 6 other natural disasters have been reported since 1953.
The number of natural disasters in Brooks County (16) is near the US average (15).
Major Disasters (Presidential) Declared: 6
Emergencies Declared: 7
Causes of natural disasters: Hurricanes: 10, Fires: 3, Flood: 1, Heavy Rain: 1, Tropical Storm: 1, Wind: 1, Other: 1 (Note: some incidents may be assigned to more than one category).
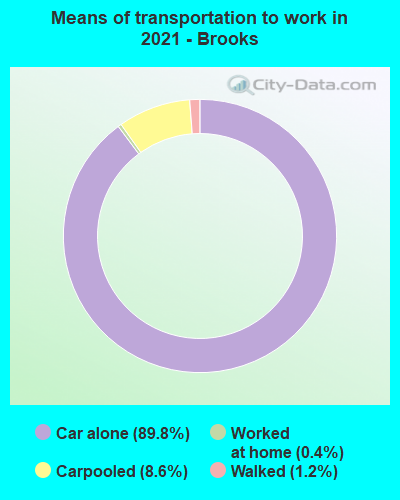
Means of transportation to work:
- Drove a car alone: 1,969 (77.2%)
- Carpooled: 389 (15.3%)
- Walked: 29 (1.1%)
- Worked at home: 85 (3.3%)

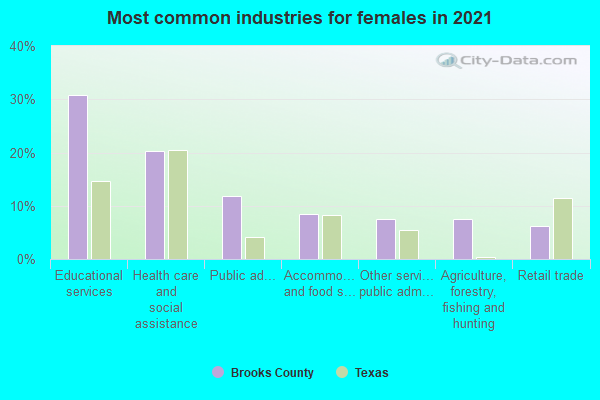
- Educational services (29%)
- Health care and social assistance (26%)
- Public administration (9%)
- Retail trade (9%)
- Accommodation and food services (9%)
- Agriculture, forestry, fishing and hunting (7%)
- Other services, except public administration (4%)
- Educational services (29%)
- Health care and social assistance (27%)
- Public administration (9%)
- Retail trade (9%)
- Accommodation and food services (9%)
- Agriculture, forestry, fishing and hunting (7%)
- Other services, except public administration (4%)
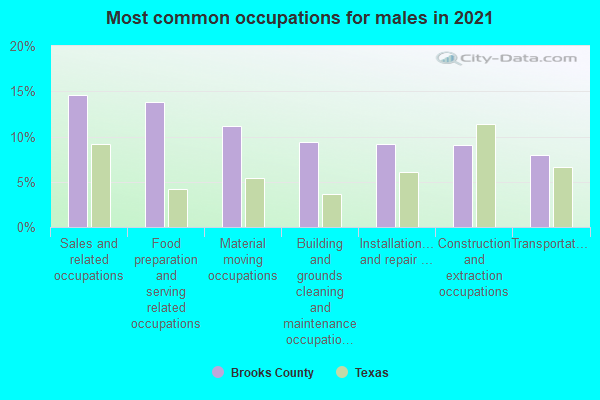
- Food preparation and serving related occupations (16%)
- Building and grounds cleaning and maintenance occupations (13%)
- Production occupations (11%)
- Construction and extraction occupations (10%)
- Transportation occupations (10%)
- Sales and related occupations (8%)
- Installation, maintenance, and repair occupations (7%)
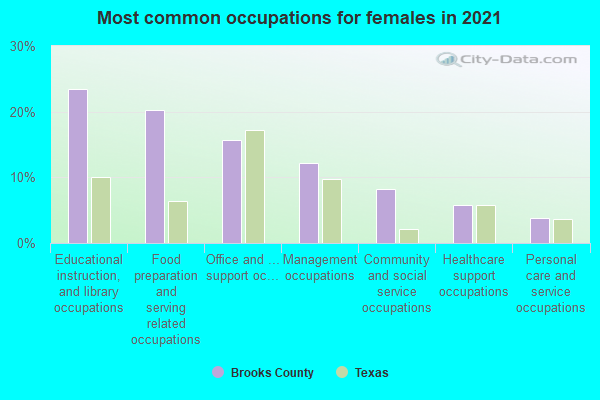
- Food preparation and serving related occupations (27%)
- Educational instruction, and library occupations (22%)
- Management occupations (17%)
- Office and administrative support occupations (16%)
- Community and social service occupations (7%)
- Healthcare support occupations (5%)
- Business and financial operations occupations (2%)
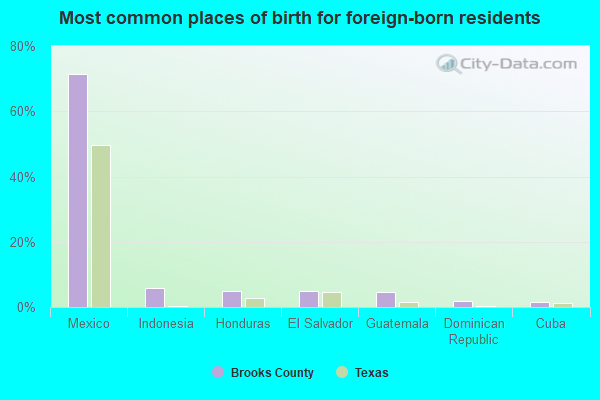
- Mexico (72%)
- Indonesia (10%)
- Guatemala (4%)
- Honduras (3%)
- Cuba (2%)
- Nicaragua (2%)
- El Salvador (2%)
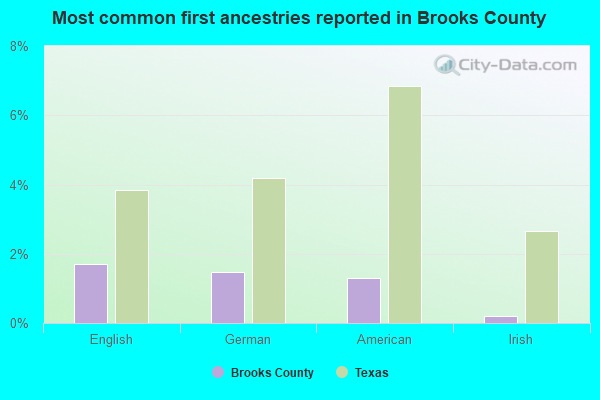
- English (2%)
- American (1%)
- German (1%)
- Irish (0%)
- Afghan (0%)
- Albanian (0%)
- Alsatian (0%)
16 people in local jails and other municipal confinement facilities
63 people in nursing homes
9 people in local jails and other confinement facilities (including police lockups)
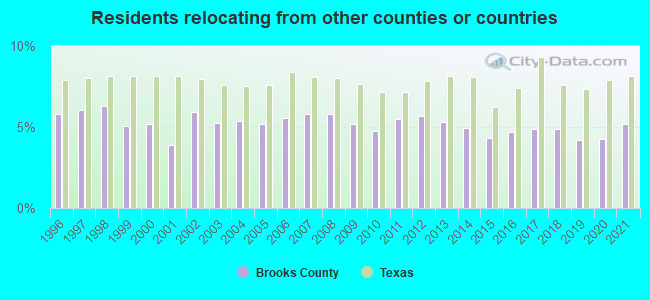
5.18% of this county's 2021 resident taxpayers lived in other counties in 2020 ($31,496 average adjusted gross income)
| Here: | 5.18% |
| Texas average: | 8.12% |
10 or fewer of this county's residents moved from foreign countries.
5.18% relocated from other counties in Texas ($31,496 average AGI)
10 or fewer of this county's residents relocated from other states.
Top counties from which taxpayers relocated into this county between 2020 and 2021:
| from Jim Wells County, TX | |
| from Hidalgo County, TX |
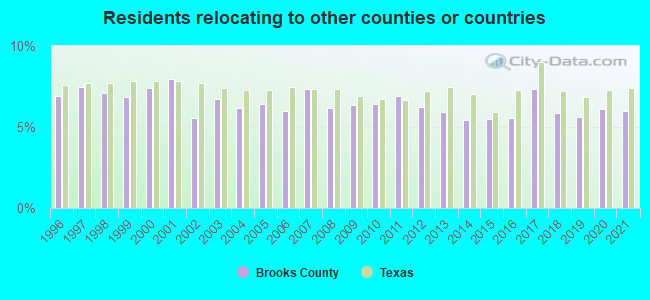
6.01% of this county's 2020 resident taxpayers moved to other counties in 2021 ($32,507 average adjusted gross income)
| Here: | 6.01% |
| Texas average: | 7.40% |
10 or fewer of this county's residents moved to foreign countries.
6.01% relocated to other counties in Texas ($32,507 average AGI)
10 or fewer of this county's residents relocated to other states.
Top counties to which taxpayers relocated from this county between 2020 and 2021:
| to Nueces County, TX | |
| to Jim Wells County, TX |
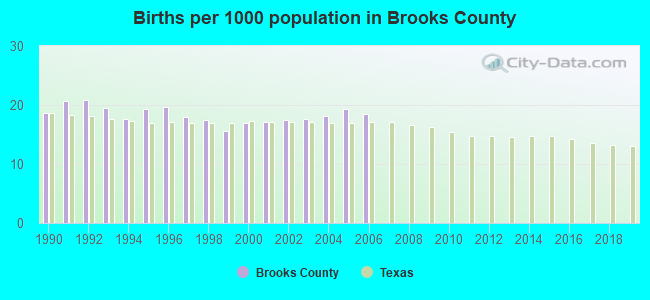
Births per 1000 population from 1990 to 1999: 18.7
Births per 1000 population from 2000 to 2006: 17.9
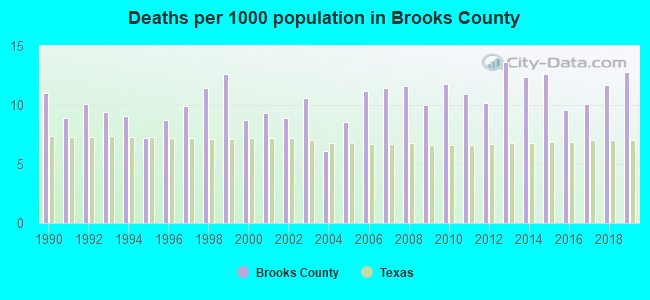
Deaths per 1000 population from 1990 to 1999: 9.8
Deaths per 1000 population from 2000 to 2009: 9.6
Deaths per 1000 population from 2010 to 2020: 12.0
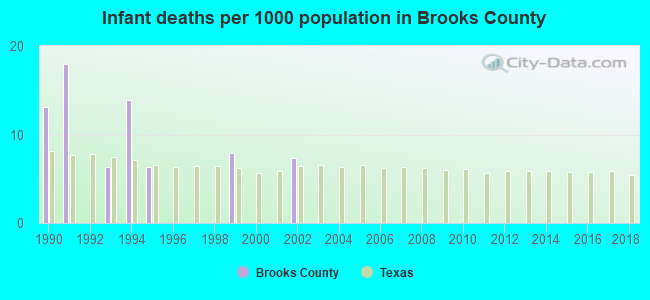
Infant deaths per 1000 live births from 1990 to 1999: 6.6
Infant deaths per 1000 live births from 2000 to 2006: 1.1
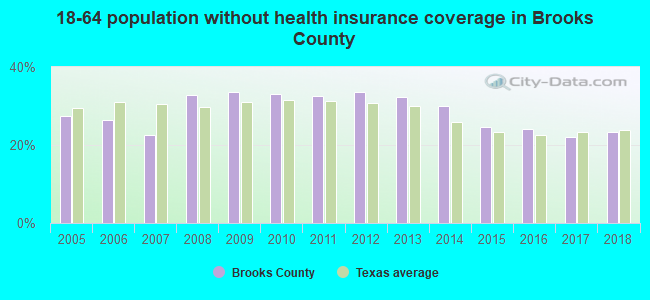
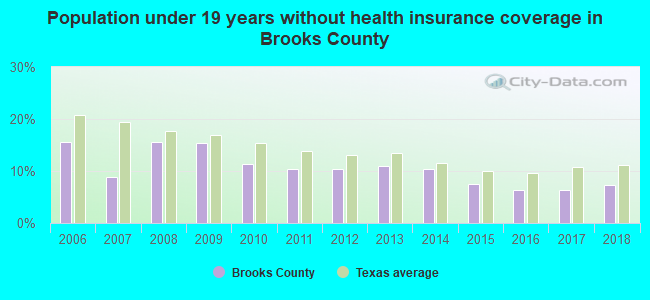
Persons under 19 years old without health insurance coverage in 2018: 7.3%
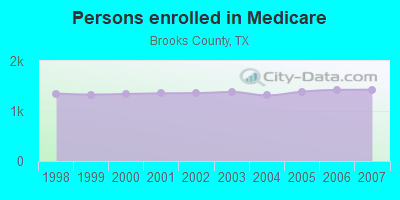
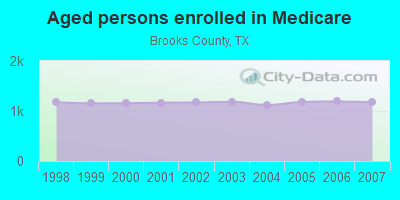
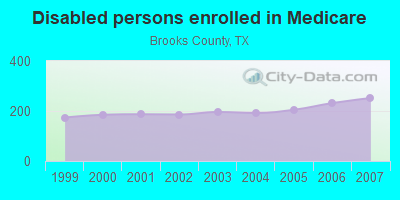
Persons enrolled in hospital insurance and/or supplemental medical insurance (Medicare) in July 1, 2007: 1,427 (1,175 aged, 252 disabled)
Children under 18 without health insurance coverage in 2007: 177 (8%)
Most common underlying causes of death in Brooks County, Texas in 1999 - 2019:
- Atherosclerotic heart disease (175)
- Acute myocardial infarction, unspecified (44)
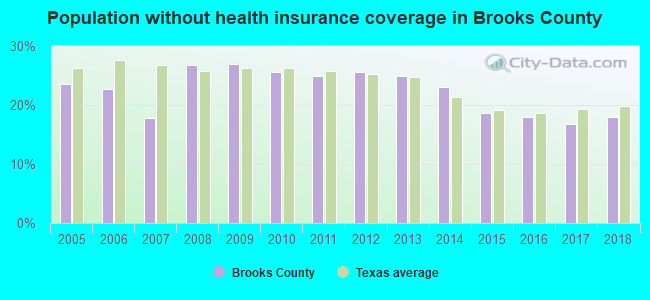
Population without health insurance coverage in 2000: 31%
Children under 18 without health insurance coverage in 2000: 32%
Medical specialist MDs per 100,000 population in 2005: 598
Total deaths per 100,000 population, July 2005 - July 2006: 117
EPA green book nonattainment status in 2004-2006: 1
Crimes per 100,000 population in 1996: 1
Household type by relationship:
Households: 7,248- Male householders: 1,430 (591 living alone), Female householders: 1,371 (510 living alone)
1,397 spouses (1,397 opposite-sex spouses), 272 unmarried partners, (272 opposite-sex unmarried partners), 1,596 children (1,520 natural, 6 adopted, 69 stepchildren), 542 grandchildren, 61 brothers or sisters, 41 parents, 0 foster children, 24 other relatives, 54 non-relatives
- In group quarters: 510
Size of family households: 770 2-persons, 282 3-persons, 351 4-persons, 166 5-persons, 20 6-persons.
Size of nonfamily households: 1,102 1-person, 122 2-persons.
761 married couples with children.
402 single-parent households (94 men, 308 women).
31.3% of residents of Brooks speak English at home.
68.8% of residents speak Spanish at home (86% speak English very well, 4% speak English well, 4% speak English not well, 6% don't speak English at all).
1.0% of residents speak Asian or Pacific Island language at home (100% speak English very well).
In fiscal year 2004:
Federal Government expenditure: $73,980,000 ($9,542 per capita)
Department of Defense expenditure: $707,000
Federal direct payments to individuals for retirement and disability: $16,600,000
Federal other direct payments to individuals: $14,609,000
Federal direct payments not to individuals: $934,000
Federal grants: $34,202,000
Federal procurement contracts: $388,000 ($155,000 Department of Defense)
Federal salaries and wages: $7,247,000 ($101,000 Department of Defense)
Federal Government direct loans: $383,000
Federal guaranteed/insured loans: $451,000
Federal Government insurance: $16,124,000
Population change from April 1, 2000 to July 1, 2005:
Births: 705| Here: | 92 per 1000 residents |
| State: | 85 per 1000 residents |
Deaths: 358
| Here: | 47 per 1000 residents |
| State: | 35 per 1000 residents |
Net international migration: +17
| Here: | +2 per 1000 residents |
| State: | +29 per 1000 residents |
Net internal migration: -638
| Here: | |
| State: |
Total withdrawal of fresh water for public supply: 1.49 millions of gallons per day (all from ground)
| Here: | 5.5 |
| State: | 6.3 |
| Here: | 4.5 |
| State: | 4.0 |
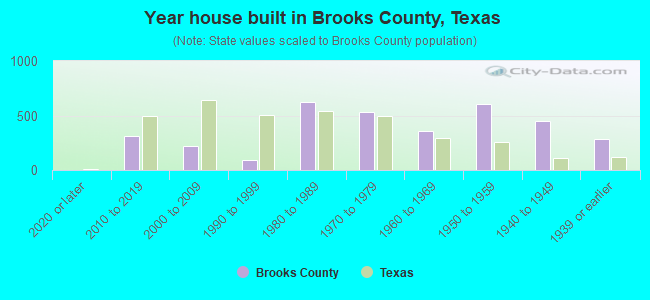
- Year house built in Brooks County, Texas
- 02020 or later
- 4102010 to 2019
- 3692000 to 2009
- 891990 to 1999
- 4001980 to 1989
- 4581970 to 1979
- 3631960 to 1969
- 7521950 to 1959
- 5831940 to 1949
- 2121939 or earlier
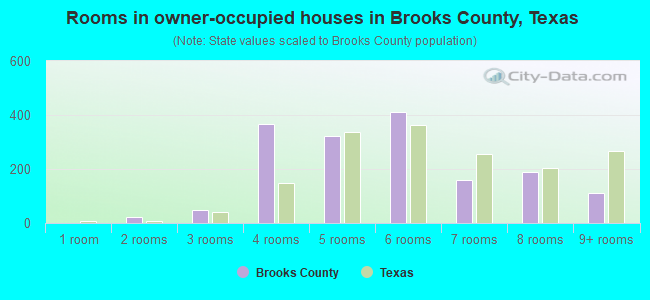
- Rooms in owner-occupied houses in Brooks County, Texas
- 01 room
- 302 rooms
- 473 rooms
- 4664 rooms
- 3445 rooms
- 4396 rooms
- 1277 rooms
- 1898 rooms
- 889+ rooms
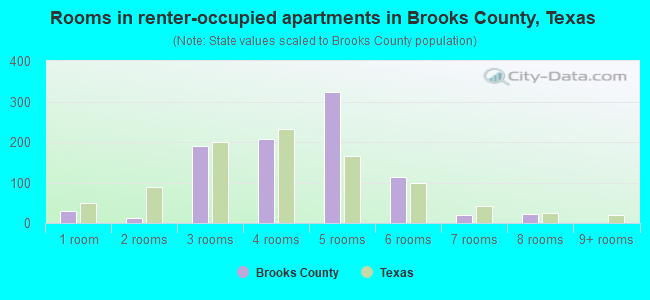
- Rooms in renter-occupied apartments in Brooks County, Texas
- 571 room
- 572 rooms
- 983 rooms
- 3024 rooms
- 3785 rooms
- 1726 rooms
- 07 rooms
- 08 rooms
- 09+ rooms

- Bedrooms in owner-occupied houses in Brooks County, Texas
- 0no bedroom
- 1241 bedroom
- 3072 bedrooms
- 1,0403 bedrooms
- 2054 bedrooms
- 315+ bedrooms

- Bedrooms in renter-occupied apartments in Brooks County, Texas
- 56no bedroom
- 921 bedroom
- 4292 bedrooms
- 2823 bedrooms
- 2274 bedrooms
- 05+ bedrooms

- Cars and other vehicles available in Brooks County in owner-occupied houses/condos
- 299no vehicle
- 4501 vehicle
- 6572 vehicles
- 2323 vehicles
- 864 vehicles
- 125+ vehicles

- Cars and other vehicles available in Brooks County in renter-occupied apartments
- 155no vehicle
- 8091 vehicle
- 1222 vehicles
- 03 vehicles
- 154 vehicles
- 05+ vehicles
84.6% of Brooks County residents lived in the same house 1 years ago.
Out of people who lived in different houses, 7% lived in this county.
Out of people who lived in different counties, 96% lived in Texas.
| Brooks County: | 84.6% |
| State average: | 85.7% |
Place of birth for U.S.-born residents:
- This state: 6,091
- Other state: 405
- Northeast: 10
- Midwest: 100
- South: 131
- West: 165
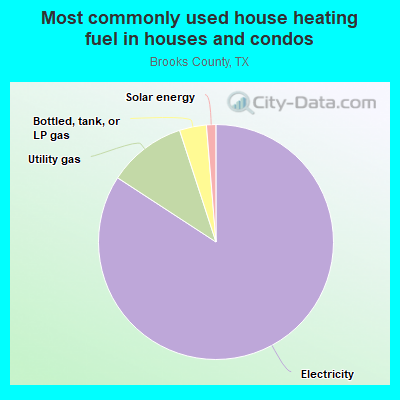
- 78.4%Electricity
- 17.3%Utility gas
- 3.4%Bottled, tank, or LP gas
- 1.0%Solar energy
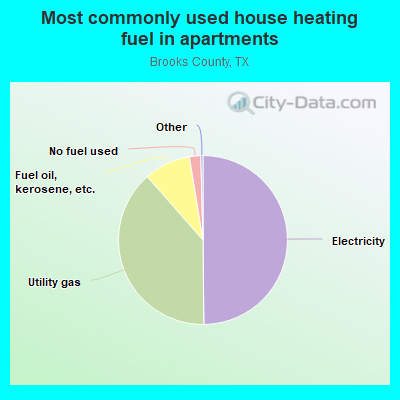
- 48.1%Utility gas
- 43.3%Electricity
- 6.2%Fuel oil, kerosene, etc.
- 2.3%No fuel used
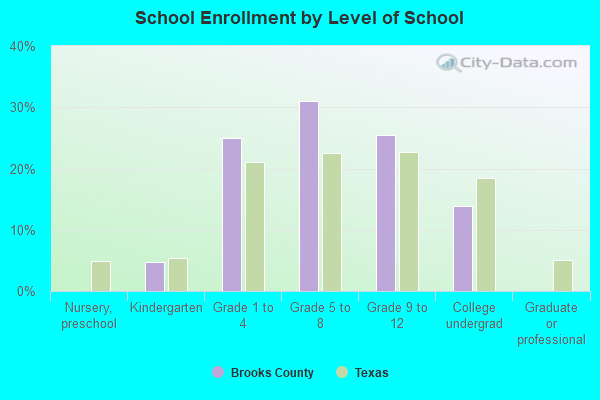
Private vs. public school enrollment:
| Here: | 2.1% |
| Texas: | 8.8% |
| Here: | 27.4% |
| Texas: | 8.0% |
| Here: | 0.0% |
| Texas: | 16.2% |

Brooks County government finances - Expenditure in 2017:
- Current Operations - Police Protection: $1,925,000
General - Other: $1,116,000
General Public Buildings: $710,000
Regular Highways: $647,000
Financial Administration: $623,000
Judicial and Legal Services: $85,000
Libraries: $43,000
Air Transportation: $42,000
Public Welfare, Vendor Payments for Medical Care: $23,000
- General - Interest on Debt: $162,000
- Long Term Debt - Beginning Outstanding - Unspecified Public Purpose: $4,054,000
Outstanding Unspecified Public Purpose: $4,054,000
- Miscellaneous - Fines and Forfeits: $858,000
Rents: $34,000
Interest Earnings: $20,000
- Other Funds - Cash and Securities: $1,580,000
- Short Term Debt Outstanding - Beginning: $420,000
End of Fiscal Year: $317,000
- Tax - Property: $5,772,000
Alcoholic Beverage License: $3,000
- Total Salaries and Wages: $3,537,000
Brooks County government finances - Revenue in 2017:
- Current Operations - Police Protection: $1,925,000
General - Other: $1,116,000
General Public Buildings: $710,000
Regular Highways: $647,000
Financial Administration: $623,000
Judicial and Legal Services: $85,000
Libraries: $43,000
Air Transportation: $42,000
Public Welfare, Vendor Payments for Medical Care: $23,000
- General - Interest on Debt: $162,000
- Long Term Debt - Beginning Outstanding - Unspecified Public Purpose: $4,054,000
Outstanding Unspecified Public Purpose: $4,054,000
- Miscellaneous - Fines and Forfeits: $858,000
Rents: $34,000
Interest Earnings: $20,000
- Other Funds - Cash and Securities: $1,580,000
- Short Term Debt Outstanding - Beginning: $420,000
End of Fiscal Year: $317,000
- Tax - Property: $5,772,000
Alcoholic Beverage License: $3,000
- Total Salaries and Wages: $3,537,000
Brooks County government finances - Debt in 2017:
- Current Operations - Police Protection: $1,925,000
General - Other: $1,116,000
General Public Buildings: $710,000
Regular Highways: $647,000
Financial Administration: $623,000
Judicial and Legal Services: $85,000
Libraries: $43,000
Air Transportation: $42,000
Public Welfare, Vendor Payments for Medical Care: $23,000
- General - Interest on Debt: $162,000
- Long Term Debt - Beginning Outstanding - Unspecified Public Purpose: $4,054,000
Outstanding Unspecified Public Purpose: $4,054,000
- Miscellaneous - Fines and Forfeits: $858,000
Rents: $34,000
Interest Earnings: $20,000
- Other Funds - Cash and Securities: $1,580,000
- Short Term Debt Outstanding - Beginning: $420,000
End of Fiscal Year: $317,000
- Tax - Property: $5,772,000
Alcoholic Beverage License: $3,000
- Total Salaries and Wages: $3,537,000
Brooks County government finances - Cash and Securities in 2017:
- Current Operations - Police Protection: $1,925,000
General - Other: $1,116,000
General Public Buildings: $710,000
Regular Highways: $647,000
Financial Administration: $623,000
Judicial and Legal Services: $85,000
Libraries: $43,000
Air Transportation: $42,000
Public Welfare, Vendor Payments for Medical Care: $23,000
- General - Interest on Debt: $162,000
- Long Term Debt - Beginning Outstanding - Unspecified Public Purpose: $4,054,000
Outstanding Unspecified Public Purpose: $4,054,000
- Miscellaneous - Fines and Forfeits: $858,000
Rents: $34,000
Interest Earnings: $20,000
- Other Funds - Cash and Securities: $1,580,000
- Short Term Debt Outstanding - Beginning: $420,000
End of Fiscal Year: $317,000
- Tax - Property: $5,772,000
Alcoholic Beverage License: $3,000
- Total Salaries and Wages: $3,537,000
Supplemental Security Income (SSI) in 2006:
- Total number of recipients: 637
- Number of aged recipients: 142
- Number of blind and disabled recipients: 495
- Number of recipients under 18: 90
- Number of recipients between 18 and 64: 304
- Number of recipients older than 64: 243
- Number of recipients also receiving OASDI: 313
- Amount of payments (thousands of dollars): 244
| Most common first names in Brooks County, TX among deceased individuals | ||
| Name | Count | Lived (average) |
|---|---|---|
| Maria | 69 | 76.9 years |
| Jose | 66 | 70.1 years |
| Guadalupe | 38 | 79.3 years |
| Manuel | 34 | 76.7 years |
| Jesus | 27 | 71.1 years |
| Juan | 23 | 69.6 years |
| Ramon | 18 | 72.9 years |
| Santos | 17 | 78.0 years |
| John | 17 | 74.4 years |
| James | 15 | 74.0 years |
| Most common last names in Brooks County, TX among deceased individuals | ||
| Last name | Count | Lived (average) |
|---|---|---|
| Garcia | 124 | 74.1 years |
| Garza | 119 | 75.0 years |
| Perez | 73 | 73.2 years |
| Gonzalez | 65 | 75.0 years |
| Lopez | 59 | 77.7 years |
| Villarreal | 56 | 77.4 years |
| Hinojosa | 37 | 75.0 years |
| Rodriguez | 35 | 72.6 years |
| Guerra | 35 | 77.7 years |
| Martinez | 34 | 75.0 years |
| Businesses in Brooks County, TX | ||||
| Name | Count | Name | Count | |
|---|---|---|---|---|
| Ace Hardware | 1 | H&R Block | 1 | |
| Best Western | 1 | Holiday Inn | 1 | |
| Burger King | 1 | McDonald's | 1 | |
| Church's Chicken | 1 | Nike | 1 | |
| Days Inn | 1 | Walmart | 1 | |
Brooks County on our top lists:
- #32 on the list of "Top 101 counties with highest percentage of residents voting for Obama (Democrat) in the 2012 Presidential Election"