Bosque County, Texas (TX)
County owner-occupied free and clear houses and condos in 2010: 2,911
County owner-occupied houses and condos in 2000: 5,216
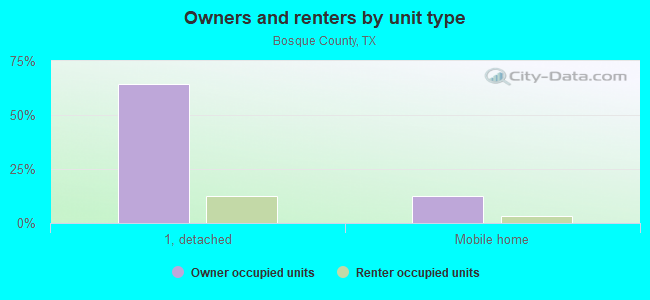
Renter-occupied apartments: 1,712 (it was 1,510 in 2000)
| % of renters here: | 22% |
| State: | 36% |
Land area: 989 sq. mi.
Water area: 13.5 sq. mi.
Population density: 19 people per square mile (low).
Industries providing employment: Educational, health and social services (19.7%), Retail trade (14.3%), Construction (12.2%).
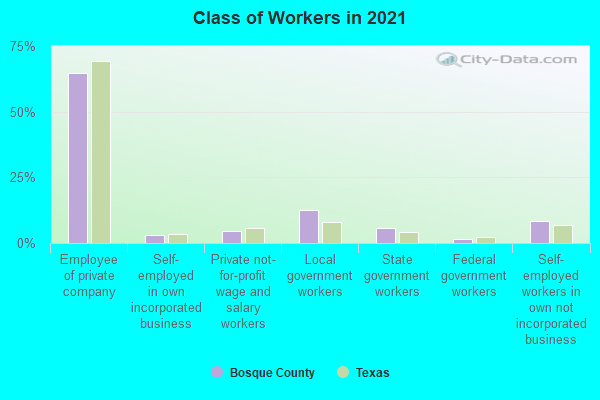
Type of workers:
- Private wage or salary: 73%
- Government: 18%
- Self-employed, not incorporated: 8%
- Unpaid family work: 0%
- OSM Map
- General Map
- Google Map
- MSN Map

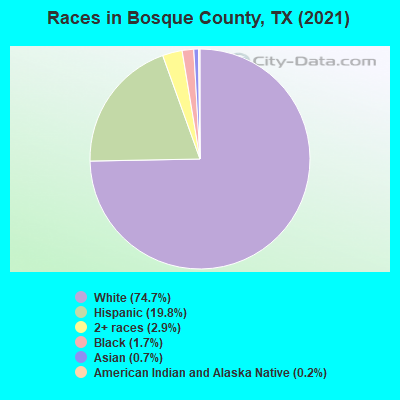
- 13,84274.4%White Non-Hispanic Alone
- 3,73820.1%Hispanic or Latino
- 4982.7%Two or more races
- 3481.9%Black Non-Hispanic Alone
- 1330.7%Asian alone
- 250.1%American Indian and Alaska Native alone
- 100.05%Some other race alone
| Median resident age: | 46.6 years |
| Texas median age: | 35.6 years |
| Males: 9,382 | |
| Females: 9,516 |

 | 10-20 Acres, 200-400K for the land, good schools (46 replies) |
| Waco and the Hill Country. (16 replies) |
| New County Population Estimates from the Census Bureau for Jluy 1, 2016 posted this morning about 9 A. M. (13 replies) |
| Pros and cons to living in Texas (181 replies) |
| How Do You Pronounce the Following -- Texas and Bowie? (91 replies) |
| Prickly Pear Cactus Tree (50 replies) |
| Bosque County: | 2.0 people |
| Texas: | 3 people |
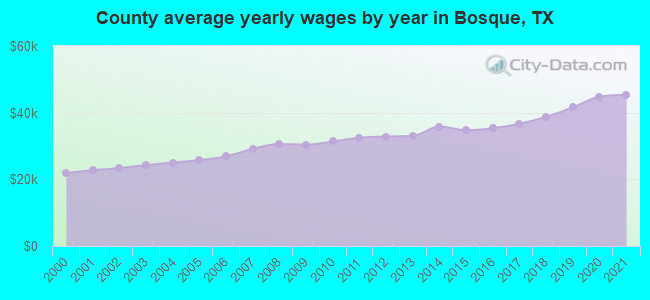
Estimated median household income in 2022: $63,211 ($34,181 in 1999)
| This county: | $63,211 |
| Texas: | $72,284 |
Median contract rent in 2022 for apartments: $594 (lower quartile is $467, upper quartile is $873)
| This county: | $594 |
| State: | $1117 |
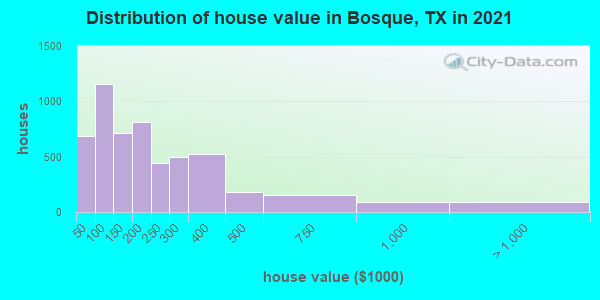
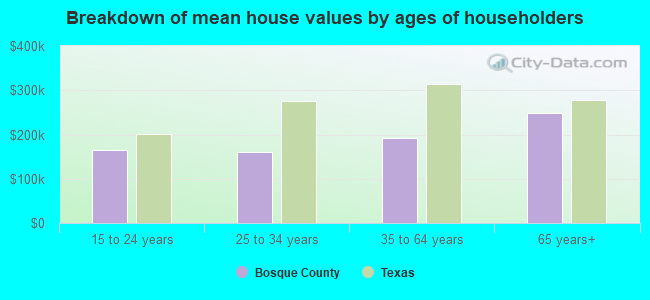
Estimated median house or condo value in 2022: $175,191 (it was $60,500 in 2000)
| Bosque: | $175,191 |
| Texas: | $275,400 |
Mean price in 2022:
Median monthly housing costs for homes and condos with a mortgage: $1,240Detached houses: $317,071
Here: $317,071 State: $369,058 Townhouses or other attached units: $1,417,062
Here: $1,417,062 State: $327,631 Mobile homes: $116,939
Here: $116,939 State: $124,413 Occupied boats, RVs, vans, etc.: $36,025
Here: $36,025 State: $73,921
Median monthly housing costs for units without a mortgage: $499
Institutionalized population: 324
Crime in 2021 (reported by the sheriff's office or county police, not the county total):
- Murders: 0
- Rapes: 2
- Robberies: 0
- Assaults: 9
- Burglaries: 26
- Thefts: 36
- Auto thefts: 6
Crime in 2020 (reported by the sheriff's office or county police, not the county total):
- Murders: 0
- Rapes: 0
- Robberies: 0
- Assaults: 6
- Burglaries: 28
- Thefts: 35
- Auto thefts: 4
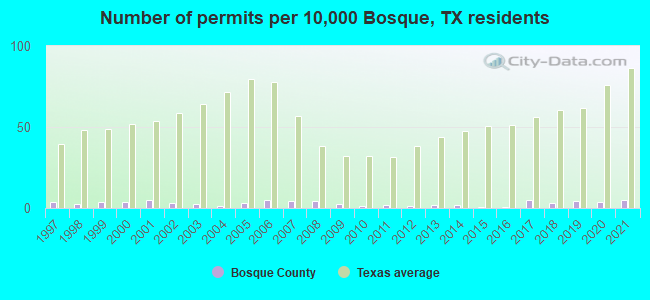
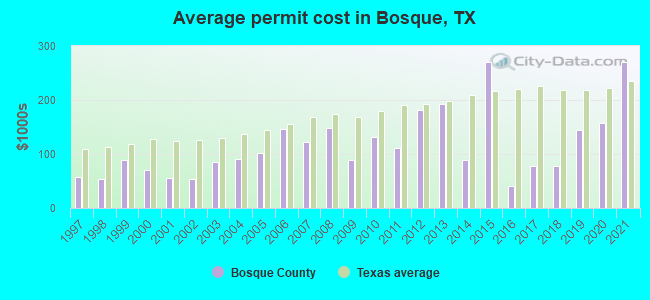
Single-family new house construction building permits:
- 2022: 8 buildings, average cost: $93,300
- 2021: 9 buildings, average cost: $270,000
- 2020: 6 buildings, average cost: $156,800
- 2019: 7 buildings, average cost: $144,000
- 2018: 5 buildings, average cost: $78,400
- 2017: 8 buildings, average cost: $77,800
- 2016: 1 building, cost: $40,000
- 2015: 1 building, cost: $270,000
- 2014: 3 buildings, average cost: $88,300
- 2013: 3 buildings, average cost: $192,600
- 2012: 2 buildings, average cost: $181,600
- 2011: 3 buildings, average cost: $111,700
- 2010: 2 buildings, average cost: $131,900
- 2009: 4 buildings, average cost: $87,600
- 2008: 7 buildings, average cost: $149,000
- 2007: 7 buildings, average cost: $122,000
- 2006: 8 buildings, average cost: $147,200
- 2005: 5 buildings, average cost: $101,600
- 2004: 2 buildings, average cost: $90,000
- 2003: 4 buildings, average cost: $84,700
- 2002: 5 buildings, average cost: $53,000
- 2001: 8 buildings, average cost: $56,300
- 2000: 6 buildings, average cost: $70,100
- 1999: 6 buildings, average cost: $89,100
- 1998: 4 buildings, average cost: $53,800
- 1997: 6 buildings, average cost: $58,200
Median real estate property taxes paid for housing units with mortgages in 2022: $2,075 (1.1%)
Median real estate property taxes paid for housing units with no mortgage in 2022: $1,553 (0.9%)


| Bosque County: | 11.6% |
| Texas: | 14.0% |
Median age of residents in 2022: 46.6 years old
(Males: 44.6 years old, Females: 48.4 years old)
(Median age for: White residents: 51.7 years old, Black residents: 42.4 years old, American Indian residents: 19.0 years old, Asian residents: 53.8 years old, Hispanic or Latino residents: 29.1 years old, Other race residents: 34.4 years old)
Fair market rent in 2006 for a 1-bedroom apartment in Bosque County is $403 a month.
Fair market rent for a 2-bedroom apartment is $484 a month.
Fair market rent for a 3-bedroom apartment is $588 a month.
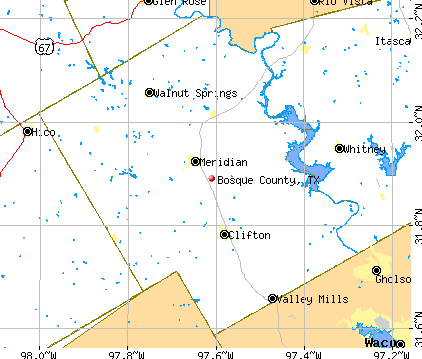
Cities in this county include: Clifton, Meridian, Laguna Park, Valley Mills, Walnut Springs, Morgan, Iredell, Cranfills Gap.
Neighboring counties: Comanche County  , Scott County, Mississippi
  .
.
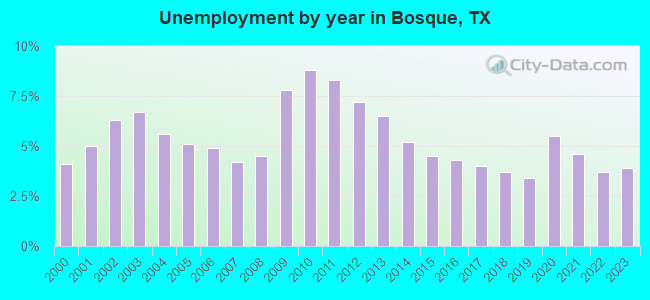
| Here: | 2.9% |
| Texas: | 3.5% |
Current college students: 456
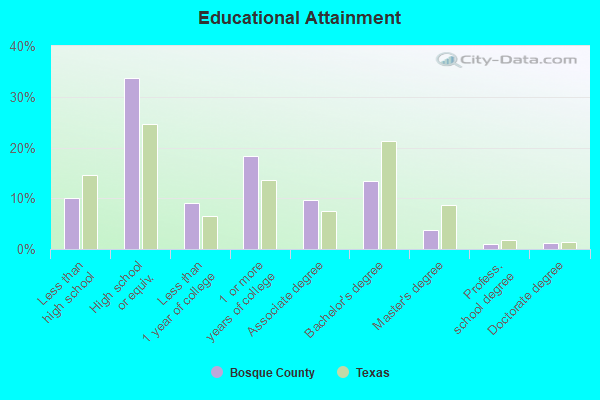
People 25 years of age or older with a high school degree or higher: 87.7%
People 25 years of age or older with a bachelor's degree or higher: 19.0%
Number of foreign born residents: 1,328 (38.6% naturalized citizens)
| Bosque County: | 7.0% |
| Whole state: | 17.2% |
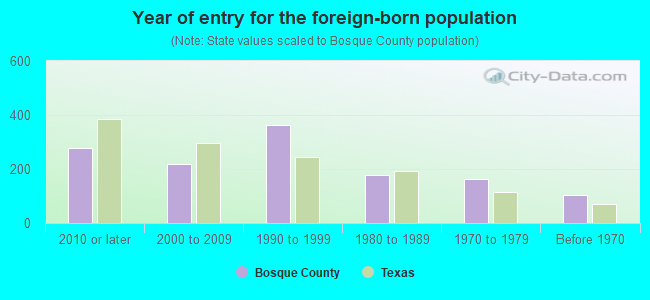
- Year of entry for the foreign-born population
- 2762010 or later
- 2742000 to 2009
- 4351990 to 1999
- 1771980 to 1989
- 1621970 to 1979
- 104Before 1970
Mean travel time to work (commute): minutes
Percentage of county residents living and working in this county: 99.1%

Housing units in structures:
- One, detached: 7,342
- One, attached: 104
- Two: 98
- 3 or 4: 149
- 10 to 19: 65
- 20 to 49: 48
- 50 or more: 15
- Mobile homes: 1,740
- Boats, RVs, vans, etc.: 28
Housing units in Bosque County with a mortgage: 2,198 (47 second mortgage, 0 home equity loan, 43 both second mortgage and home equity loan)
Houses without a mortgage: 42
| Here: | 4.5% with mortgage |
| State: | 98.4% with mortgage |
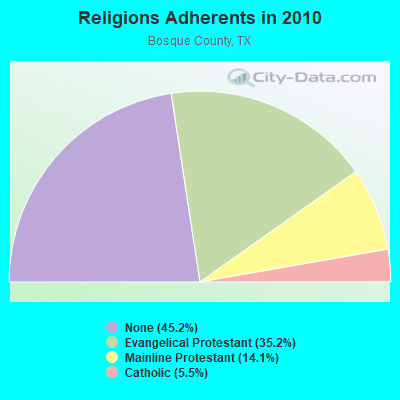
Religion statistics for Bosque County
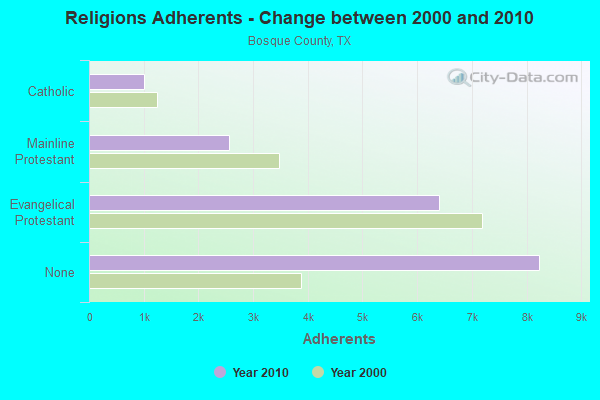
| Religion | Adherents | Congregations |
|---|---|---|
| Evangelical Protestant | 6,405 | 41 |
| Mainline Protestant | 2,567 | 14 |
| Catholic | 1,005 | 2 |
| Black Protestant | - | 2 |
| Other | - | - |
| None | 8,235 | - |
Source: Clifford Grammich, Kirk Hadaway, Richard Houseal, Dale E.Jones, Alexei Krindatch, Richie Stanley and Richard H.Taylor. 2012. 2010 U.S.Religion Census: Religious Congregations & Membership Study. Association of Statisticians of American Religious Bodies. Jones, Dale E., et al. 2002. Congregations and Membership in the United States 2000. Nashville, TN: Glenmary Research Center.
Food Environment Statistics:
| Bosque County: | 2.24 / 10,000 pop. |
| State: | 1.47 / 10,000 pop. |
| This county: | 1.68 / 10,000 pop. |
| Texas: | 1.11 / 10,000 pop. |
| Bosque County: | 5.05 / 10,000 pop. |
| Texas: | 3.95 / 10,000 pop. |
| This county: | 5.05 / 10,000 pop. |
| State: | 6.13 / 10,000 pop. |
| Bosque County: | 10.0% |
| Texas: | 8.9% |
| Bosque County: | 26.3% |
| State: | 26.6% |
| Here: | 12.4% |
| State: | 15.7% |
Agriculture in Bosque County:
Average size of farms: 438 acresAverage value of agricultural products sold per farm: $29,533
Average value of crops sold per acre for harvested cropland: $252.69
The value of livestock, poultry, and their products as a percentage of the total market value of agricultural products sold: 69.01%
Average total farm production expenses per farm: $25,491
Harvested cropland as a percentage of land in farms: 8.27%
Irrigated harvested cropland as a percentage of land in farms: 1.27%
Average market value of all machinery and equipment per farm: $22,018
The percentage of farms operated by a family or individual: 92.53%
Average age of principal farm operators: 58 years
Average number of cattle and calves per 100 acres of all land in farms: 10.65
Corn for grain: 1003 harvested acres
All wheat for grain: 3475 harvested acres
Land in orchards: 2,024 acres
Earthquake activity:
Bosque County-area historical earthquake activity is significantly above Texas state average. It is 366% greater than the overall U.S. average.On 11/6/2011 at 03:53:10, a magnitude 5.7 (5.7 MW, Depth: 3.2 mi, Class: Moderate, Intensity: VI - VII) earthquake occurred 256.6 miles away from Bosque County center
On 6/16/1978 at 11:46:54, a magnitude 5.3 (4.4 MB, 4.6 UK, 5.3 ML) earthquake occurred 200.3 miles away from the county center
On 9/3/2016 at 12:02:44, a magnitude 5.8 (5.8 MW, Depth: 3.5 mi) earthquake occurred 316.2 miles away from the county center
On 5/17/2012 at 08:12:00, a magnitude 4.8 (4.8 MW, Depth: 3.1 mi, Class: Light, Intensity: IV - V) earthquake occurred 190.4 miles away from the county center
On 4/14/1995 at 00:32:56, a magnitude 5.7 (5.6 MB, 5.7 MS, 5.7 MW, Depth: 11.1 mi) earthquake occurred 358.6 miles away from Bosque County center
On 10/20/2011 at 12:24:41, a magnitude 4.8 (4.8 MW, Depth: 3.1 mi) earthquake occurred 211.0 miles away from the county center
Magnitude types: body-wave magnitude (MB), local magnitude (ML), surface-wave magnitude (MS), moment magnitude (MW)
Most recent natural disasters:
- Texas Covid-19 Pandemic, Incident Period: January 20, 2020, FEMA Id: 4485, Natural disaster type: Other
- Texas Severe Storms and Flooding, Incident Period: May 22, 2016 to June 24, 2016, Major Disaster (Presidential) Declared DR-4272: June 11, 2016, FEMA Id: 4272, Natural disaster type: Storm, Flood
- Texas Severe Storms and Flooding, Incident Period: April 17, 2016 to April 30, 2016, Major Disaster (Presidential) Declared DR-4269: April 25, 2016, FEMA Id: 4269, Natural disaster type: Storm, Flood
- Texas Severe Storms, Tornadoes, Straight-line Winds, and Flooding, Incident Period: October 22, 2015 to October 31, 2015, Major Disaster (Presidential) Declared DR-4245: November 25, 2015, FEMA Id: 4245, Natural disaster type: Storm, Tornado, Flood, Wind
- Texas Severe Storms, Tornadoes, Straight-line Winds, and Flooding, Incident Period: May 04, 2015 to June 23, 2015, Major Disaster (Presidential) Declared DR-4223: May 29, 2015, FEMA Id: 4223, Natural disaster type: Storm, Tornado, Flood, Wind
- Texas Wildfires, Incident Period: August 30, 2011 to December 31, 2011, Major Disaster (Presidential) Declared DR-4029: September 09, 2011, FEMA Id: 4029, Natural disaster type: Fire
- Texas Big Trickle Ranch Fire, Incident Period: March 11, 2011 to March 17, 2011, Fire Management Assistance Declared: March 12, 2011, FEMA Id: 2870, Natural disaster type: Fire
- Texas Wildfires, Incident Period: March 14, 2008 to September 01, 2008, Emergency Declared EM-3284: March 14, 2008, FEMA Id: 3284, Natural disaster type: Fire
- Texas Severe Storms, Tornadoes, and Flooding, Incident Period: June 16, 2007 to August 03, 2007, Major Disaster (Presidential) Declared DR-1709: June 29, 2007, FEMA Id: 1709, Natural disaster type: Storm, Tornado, Flood
- Texas Hurricane Rita, Incident Period: September 23, 2005 to October 14, 2005, Major Disaster (Presidential) Declared DR-1606: September 24, 2005, FEMA Id: 1606, Natural disaster type: Hurricane
- 7 other natural disasters have been reported since 1953.
The number of natural disasters in Bosque County (17) is near the US average (15).
Major Disasters (Presidential) Declared: 10
Emergencies Declared: 5
Causes of natural disasters: Storms: 8, Floods: 7, Fires: 5, Tornadoes: 5, Hurricanes: 3, Winds: 2, Other: 1 (Note: some incidents may be assigned to more than one category).
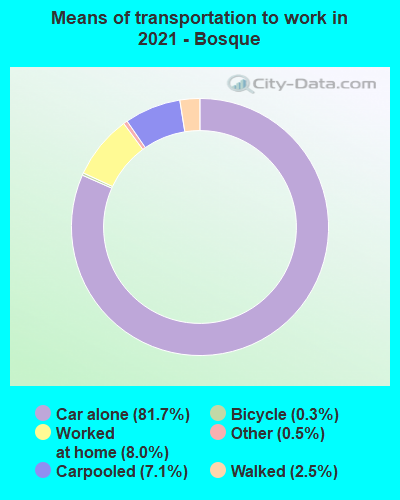
Means of transportation to work:
- Drove a car alone: 3,704 (75.5%)
- Carpooled: 352 (7.2%)
- Taxicab, motorcycle, or other means: 41 (0.8%)
- Bicycle: 7 (0.1%)
- Walked: 102 (2.1%)
- Worked at home: 671 (13.7%)

- Health care and social assistance (16%)
- Educational services (15%)
- Retail trade (12%)
- Public administration (7%)
- Manufacturing (6%)
- Professional, scientific, and technical services (6%)
- Finance and insurance (5%)
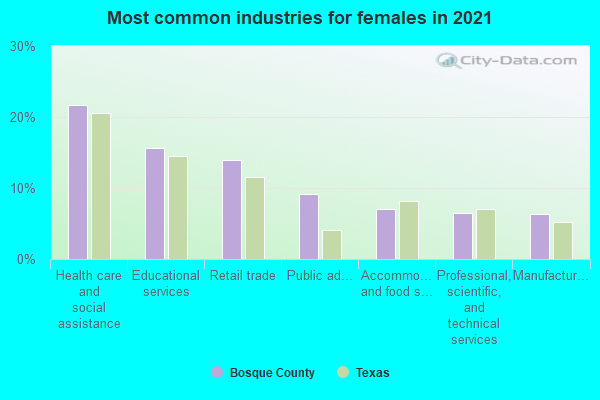
- Health care and social assistance (19%)
- Educational services (17%)
- Retail trade (15%)
- Public administration (8%)
- Manufacturing (7%)
- Professional, scientific, and technical services (7%)
- Finance and insurance (5%)
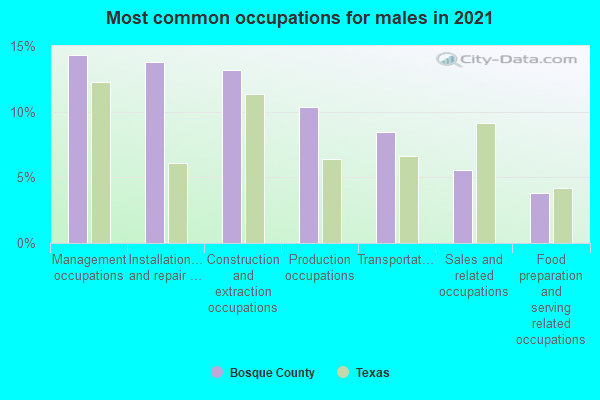
- Installation, maintenance, and repair occupations (14%)
- Management occupations (14%)
- Construction and extraction occupations (12%)
- Production occupations (9%)
- Transportation occupations (8%)
- Sales and related occupations (8%)
- Building and grounds cleaning and maintenance occupations (5%)
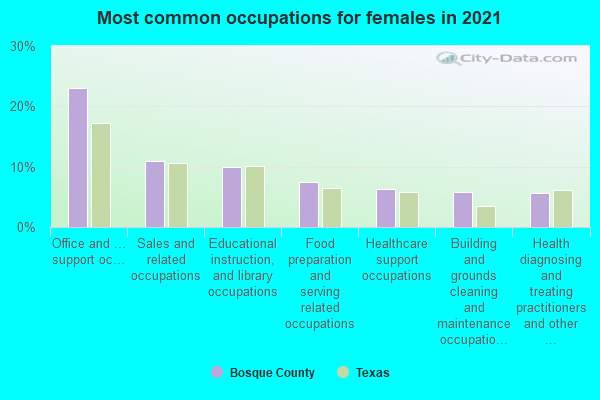
- Office and administrative support occupations (22%)
- Educational instruction, and library occupations (11%)
- Sales and related occupations (10%)
- Building and grounds cleaning and maintenance occupations (7%)
- Food preparation and serving related occupations (6%)
- Business and financial operations occupations (6%)
- Health diagnosing and treating practitioners and other technical occupations (6%)
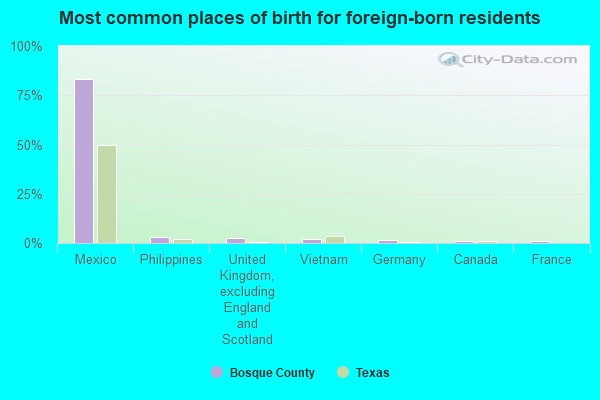
- Mexico (84%)
- Taiwan (2%)
- United Kingdom, excluding England and Scotland (2%)
- Vietnam (2%)
- Philippines (1%)
- Germany (1%)
- Canada (1%)
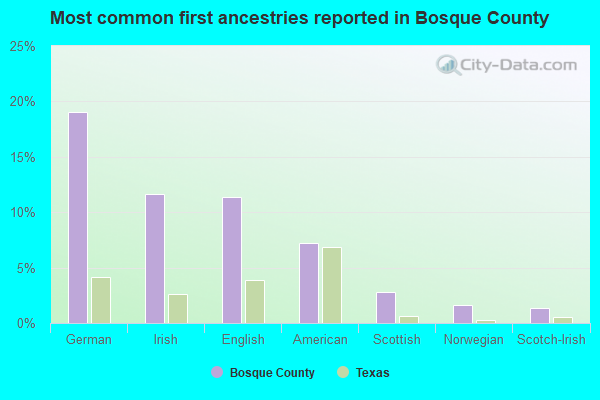
- German (22%)
- English (11%)
- Irish (10%)
- American (9%)
- Scottish (2%)
- European (2%)
- Scotch-Irish (2%)
People in group quarters in Bosque County, Texas in 2010:
- 293 people in nursing facilities/skilled-nursing facilities
- 31 people in local jails and other municipal confinement facilities
- 5 people in workers' group living quarters and job corps centers
People in group quarters in Bosque County, Texas in 2000:
- 431 people in nursing homes
- 46 people in other nonhousehold living situations
- 30 people in local jails and other confinement facilities (including police lockups)
- 21 people in other noninstitutional group quarters
- 6 people in agriculture workers' dormitories on farms
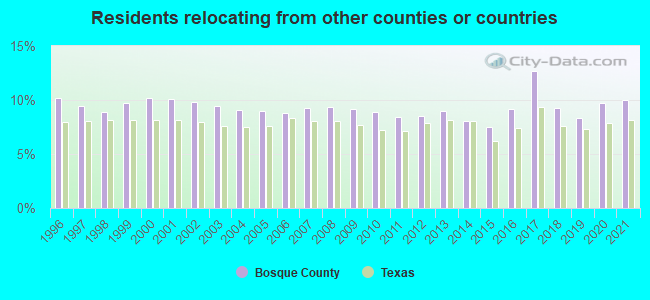
9.99% of this county's 2021 resident taxpayers lived in other counties in 2020 ($82,701 average adjusted gross income)
| Here: | 9.99% |
| Texas average: | 8.12% |
10 or fewer of this county's residents moved from foreign countries.
8.73% relocated from other counties in Texas ($75,305 average AGI)
1.26% relocated from other states ($7,396 average AGI)
Bosque County: 1.26% Texas average: 2.83%
Top counties from which taxpayers relocated into this county between 2020 and 2021:
| from McLennan County, TX | |
| from Hill County, TX | |
| from Tarrant County, TX | |
| from Johnson County, TX | |
| from Dallas County, TX |
7.54% of this county's 2020 resident taxpayers moved to other counties in 2021 ($48,942 average adjusted gross income)
| Here: | 7.54% |
| Texas average: | 7.40% |
10 or fewer of this county's residents moved to foreign countries.
6.98% relocated to other counties in Texas ($46,170 average AGI)
0.56% relocated to other states ($2,774 average AGI)
Bosque County: 0.56% Texas average: 2.08%

Top counties to which taxpayers relocated from this county between 2020 and 2021:
| to McLennan County, TX | |
| to Hill County, TX | |
| to Tarrant County, TX | |
| to Johnson County, TX |
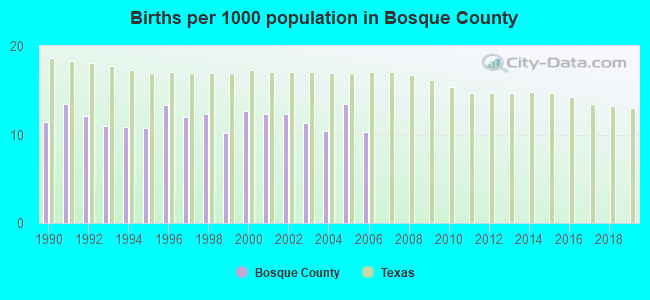
Births per 1000 population from 1990 to 1999: 11.7
Births per 1000 population from 2000 to 2006: 11.8
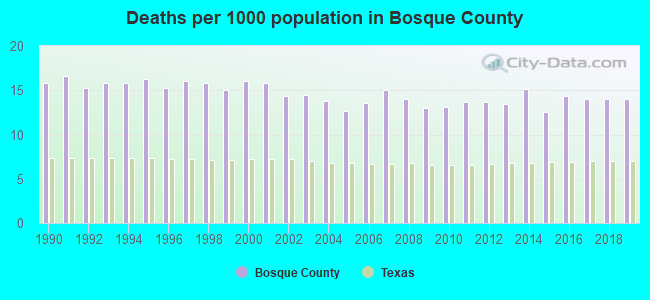
Deaths per 1000 population from 1990 to 1999: 15.8
Deaths per 1000 population from 2000 to 2009: 14.3
Deaths per 1000 population from 2010 to 2020: 14.2
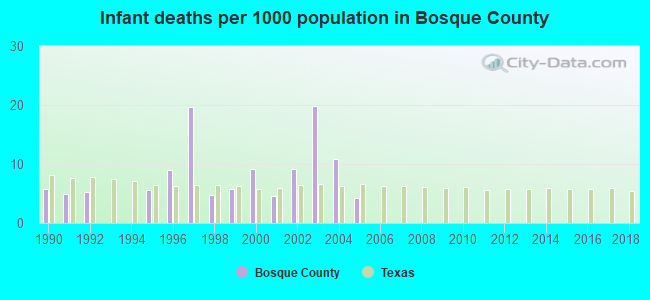
Infant deaths per 1000 live births from 1990 to 1999: 6.1
Infant deaths per 1000 live births from 2000 to 2006: 8.3
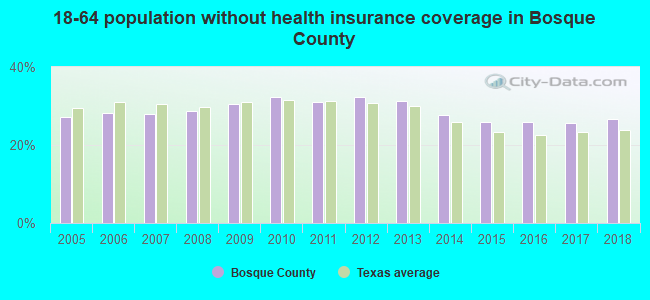
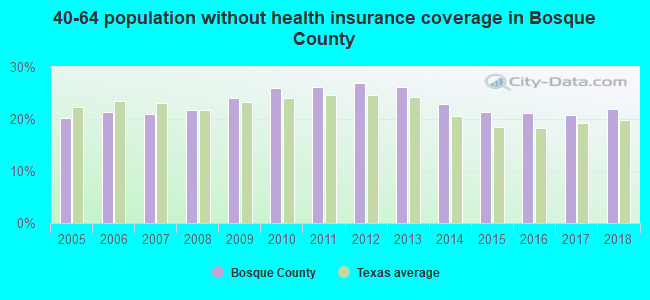
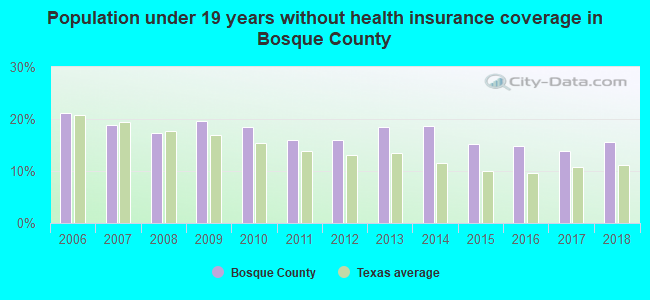
Persons under 19 years old without health insurance coverage in 2018: 15.5%
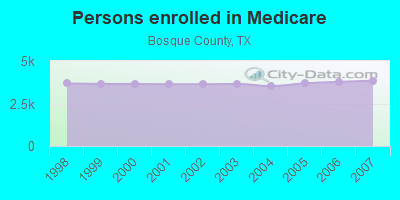
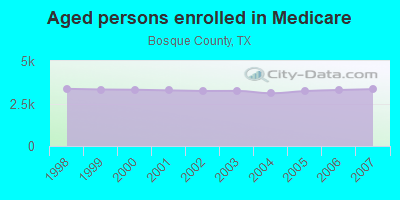
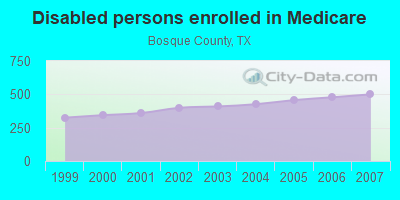
Persons enrolled in hospital insurance and/or supplemental medical insurance (Medicare) in July 1, 2007: 3,844 (3,344 aged, 500 disabled)
Children under 18 without health insurance coverage in 2007: 723 (18%)
Most common underlying causes of death in Bosque County, Texas in 1999 - 2019:
- Acute myocardial infarction, unspecified (518)
- Bronchus or lung, unspecified - Malignant neoplasms (367)
- Alzheimer disease, unspecified (250)
- Atherosclerotic heart disease (224)
- Chronic obstructive pulmonary disease, unspecified (188)
- Stroke, not specified as haemorrhage or infarction (138)
- Atherosclerotic cardiovascular disease, so described (109)
- Unspecified dementia (61)
- Congestive heart failure (58)
- Pneumonia, unspecified (22)
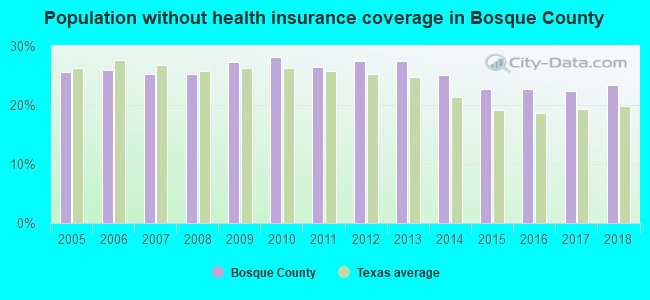
Population without health insurance coverage in 2000: 17%
Children under 18 without health insurance coverage in 2000: 17%
Short term general hospital admissions per 100,000 population in 2004: 10,043
Short term general hospital beds per 100,000 population in 2004: 222
Emergency room visits per 100,000 population in 2004: 33,585
General practice office based MDs per 100,000 population in 2005: 1,102
Medical specialist MDs per 100,000 population in 2005: 1,418
Dentists per 100,000 population in 1998: 22
Total births per 100,000 population, July 2005 - July 2006 : 18
Total deaths per 100,000 population, July 2005 - July 2006: 55
Suicides per 1,000,000 population from 2000 to 2006: 171.0. This is more than state average.
Household type by relationship:
Households: 18,898- Male householders: 4,270 (1,049 living alone), Female householders: 3,414 (1,069 living alone)
4,412 spouses (4,405 opposite-sex spouses), 311 unmarried partners, (282 opposite-sex unmarried partners), 4,594 children (4,171 natural, 185 adopted, 239 stepchildren), 812 grandchildren, 187 brothers or sisters, 168 parents, 0 foster children, 223 other relatives, 242 non-relatives
- In group quarters: 351
Size of family households: 2,812 2-persons, 954 3-persons, 903 4-persons, 453 5-persons, 197 6-persons, 67 7-or-more-persons.
Size of nonfamily households: 2,119 1-person, 179 2-persons, 9 3-persons.
2,594 married couples with children.
634 single-parent households (79 men, 555 women).
85.1% of residents of Bosque speak English at home.
14.2% of residents speak Spanish at home (74% speak English very well, 12% speak English well, 10% speak English not well, 3% don't speak English at all).
0.4% of residents speak other Indo-European language at home (90% speak English very well, 10% speak English well).
0.6% of residents speak Asian or Pacific Island language at home (42% speak English very well, 21% speak English well, 37% speak English not well).
0.1% of residents speak other language at home (89% speak English very well, 11% speak English well).
In fiscal year 2004:
Federal Government expenditure: $104,271,000 ($5,792 per capita)
Department of Defense expenditure: $4,454,000
Federal direct payments to individuals for retirement and disability: $57,177,000
Federal other direct payments to individuals: $25,785,000
Federal direct payments not to individuals: $676,000
Federal grants: $16,020,000
Federal procurement contracts: $964,000 ($141,000 Department of Defense)
Federal salaries and wages: $3,649,000 ($681,000 Department of Defense)
Federal Government direct loans: $222,000
Federal guaranteed/insured loans: $3,538,000
Federal Government insurance: $7,912,000
Population change from April 1, 2000 to July 1, 2005:
Births: 1,097| Here: | 61 per 1000 residents |
| State: | 85 per 1000 residents |
Deaths: 1,360
| Here: | 75 per 1000 residents |
| State: | 35 per 1000 residents |
Net international migration: +164
| Here: | +9 per 1000 residents |
| State: | +29 per 1000 residents |
Net internal migration: +974
| Here: | +54 per 1000 residents |
| State: | +10 per 1000 residents |
Total withdrawal of fresh water for public supply: 2.27 millions of gallons per day (all from ground)
| Here: | 5.7 |
| State: | 6.3 |
| Here: | 4.4 |
| State: | 4.0 |
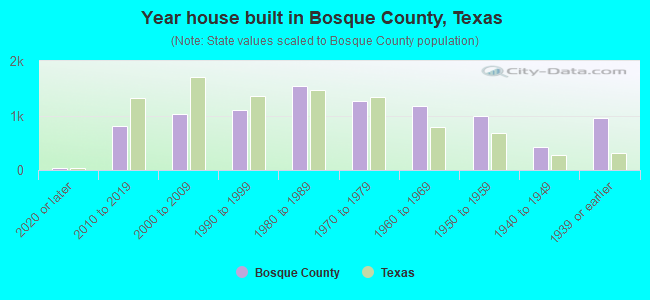
- Year house built in Bosque County, Texas
- 642020 or later
- 8912010 to 2019
- 1,0102000 to 2009
- 1,1651990 to 1999
- 1,4881980 to 1989
- 1,2621970 to 1979
- 1,0931960 to 1969
- 8981950 to 1959
- 4121940 to 1949
- 9311939 or earlier
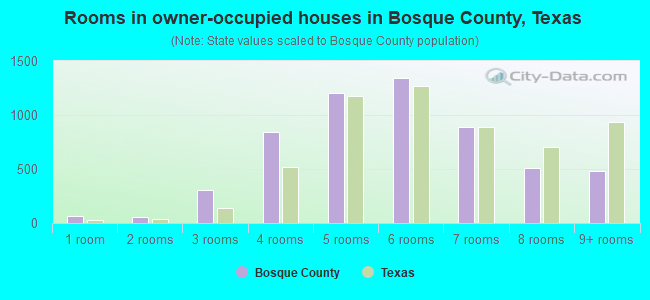
- Rooms in owner-occupied houses in Bosque County, Texas
- 671 room
- 792 rooms
- 3003 rooms
- 9084 rooms
- 1,2795 rooms
- 1,3246 rooms
- 9217 rooms
- 5328 rooms
- 4529+ rooms
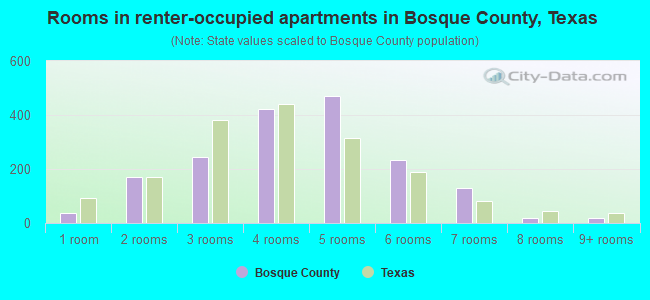
- Rooms in renter-occupied apartments in Bosque County, Texas
- 501 room
- 1832 rooms
- 2933 rooms
- 4234 rooms
- 4515 rooms
- 2486 rooms
- 1507 rooms
- 238 rooms
- 179+ rooms
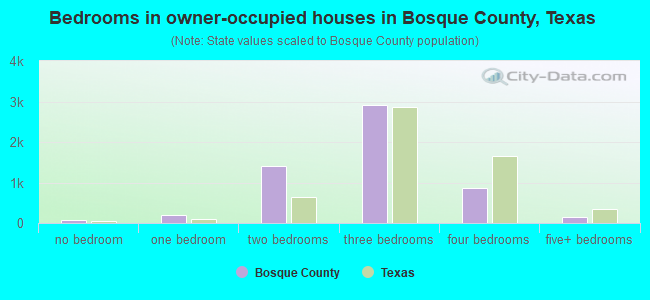
- Bedrooms in owner-occupied houses in Bosque County, Texas
- 93no bedroom
- 2411 bedroom
- 1,4772 bedrooms
- 3,0123 bedrooms
- 8264 bedrooms
- 1605+ bedrooms
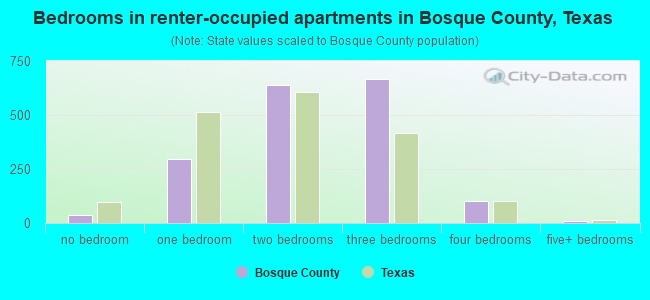
- Bedrooms in renter-occupied apartments in Bosque County, Texas
- 50no bedroom
- 3291 bedroom
- 6502 bedrooms
- 6603 bedrooms
- 1304 bedrooms
- 225+ bedrooms
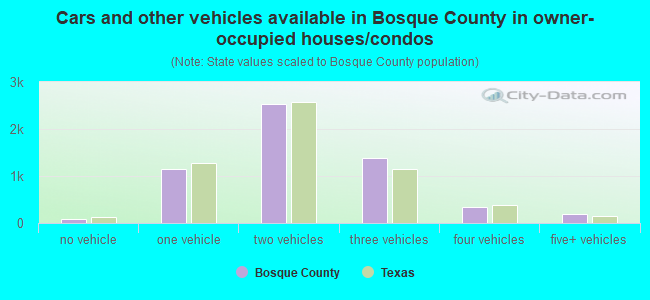
- Cars and other vehicles available in Bosque County in owner-occupied houses/condos
- 67no vehicle
- 1,2961 vehicle
- 2,5242 vehicles
- 1,3713 vehicles
- 3794 vehicles
- 1875+ vehicles
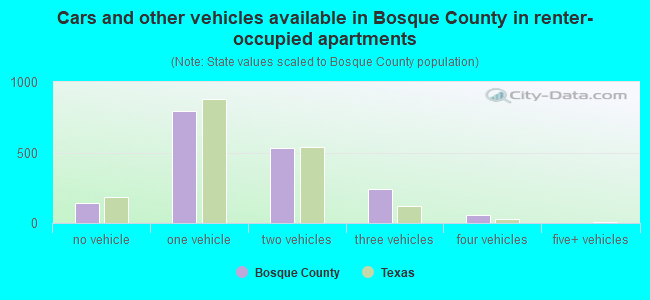
- Cars and other vehicles available in Bosque County in renter-occupied apartments
- 164no vehicle
- 7751 vehicle
- 6322 vehicles
- 2253 vehicles
- 564 vehicles
- 05+ vehicles
87.6% of Bosque County residents lived in the same house 1 years ago.
Out of people who lived in different houses, 29% lived in this county.
Out of people who lived in different counties, 59% lived in Texas.
| Bosque County: | 87.6% |
| State average: | 85.7% |
Place of birth for U.S.-born residents:
- This state: 13,730
- Other state: 3,649
- Northeast: 234
- Midwest: 1,071
- South: 1,295
- West: 1,050

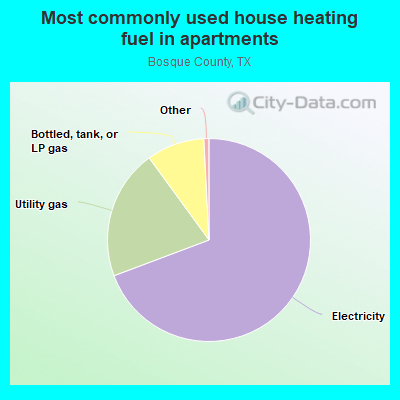
- 65.8%Electricity
- 16.7%Utility gas
- 13.7%Bottled, tank, or LP gas
- 2.6%Wood
- 0.6%No fuel used
- 0.3%Other fuel
- 66.5%Electricity
- 23.3%Utility gas
- 9.3%Bottled, tank, or LP gas
- 0.5%Coal or coke
- 0.5%Wood
Private vs. public school enrollment:
| Here: | 10.3% |
| Texas: | 8.8% |
| Here: | 4.3% |
| Texas: | 8.0% |
| Here: | 6.0% |
| Texas: | 16.2% |

Bosque County government finances - Expenditure in 2017:
- Charges - Other: $3,920,000
- Construction - Police Protection: $3,289,000
Judicial and Legal Services: $1,887,000
- Current Operations - General - Other: $15,721,000
Central Staff Services: $3,310,000
Regular Highways: $2,659,000
Judicial and Legal Services: $2,414,000
Police Protection: $2,372,000
Correctional Institutions: $2,175,000
Central Staff Services: $2,027,000
Regular Highways: $1,485,000
General Public Buildings: $962,000
Libraries: $866,000
Financial Administration: $809,000
Financial Administration: $807,000
Local Fire Protection: $185,000
Corrections - Other: $131,000
Public Welfare - Other: $66,000
- Federal Intergovernmental - Other: $157,000
General Local Government Support: $42,000
- General - Interest on Debt: $5,644,000
- Miscellaneous - General Revenue - Other: $320,000
Interest Earnings: $48,000
- Other Capital Outlay - Regular Highways: $1,476,000
Local Fire Protection: $466,000
Police Protection: $299,000
Police Protection: $33,000
- Other Funds - Cash and Securities: $7,385,000
Cash and Securities: $7,220,000
- State Intergovernmental - Highways: $388,000
Other: $293,000
General Local Government Support: $40,000
- Tax - Property: $20,178,000
Property: $13,044,000
General Sales and Gross Receipts: $1,312,000
- Total Salaries and Wages: $15,721,000
: $4,372,000
Bosque County government finances - Revenue in 2017:
- Charges - Other: $3,920,000
- Construction - Police Protection: $3,289,000
Judicial and Legal Services: $1,887,000
- Current Operations - General - Other: $15,721,000
Central Staff Services: $3,310,000
Regular Highways: $2,659,000
Judicial and Legal Services: $2,414,000
Police Protection: $2,372,000
Correctional Institutions: $2,175,000
Central Staff Services: $2,027,000
Regular Highways: $1,485,000
General Public Buildings: $962,000
Libraries: $866,000
Financial Administration: $809,000
Financial Administration: $807,000
Local Fire Protection: $185,000
Corrections - Other: $131,000
Public Welfare - Other: $66,000
- Federal Intergovernmental - Other: $157,000
General Local Government Support: $42,000
- General - Interest on Debt: $5,644,000
- Miscellaneous - General Revenue - Other: $320,000
Interest Earnings: $48,000
- Other Capital Outlay - Regular Highways: $1,476,000
Local Fire Protection: $466,000
Police Protection: $299,000
Police Protection: $33,000
- Other Funds - Cash and Securities: $7,385,000
Cash and Securities: $7,220,000
- State Intergovernmental - Highways: $388,000
Other: $293,000
General Local Government Support: $40,000
- Tax - Property: $20,178,000
Property: $13,044,000
General Sales and Gross Receipts: $1,312,000
- Total Salaries and Wages: $15,721,000
: $4,372,000
Bosque County government finances - Debt in 2017:
- Charges - Other: $3,920,000
- Construction - Police Protection: $3,289,000
Judicial and Legal Services: $1,887,000
- Current Operations - General - Other: $15,721,000
Central Staff Services: $3,310,000
Regular Highways: $2,659,000
Judicial and Legal Services: $2,414,000
Police Protection: $2,372,000
Correctional Institutions: $2,175,000
Central Staff Services: $2,027,000
Regular Highways: $1,485,000
General Public Buildings: $962,000
Libraries: $866,000
Financial Administration: $809,000
Financial Administration: $807,000
Local Fire Protection: $185,000
Corrections - Other: $131,000
Public Welfare - Other: $66,000
- Federal Intergovernmental - Other: $157,000
General Local Government Support: $42,000
- General - Interest on Debt: $5,644,000
- Miscellaneous - General Revenue - Other: $320,000
Interest Earnings: $48,000
- Other Capital Outlay - Regular Highways: $1,476,000
Local Fire Protection: $466,000
Police Protection: $299,000
Police Protection: $33,000
- Other Funds - Cash and Securities: $7,385,000
Cash and Securities: $7,220,000
- State Intergovernmental - Highways: $388,000
Other: $293,000
General Local Government Support: $40,000
- Tax - Property: $20,178,000
Property: $13,044,000
General Sales and Gross Receipts: $1,312,000
- Total Salaries and Wages: $15,721,000
: $4,372,000
Bosque County government finances - Cash and Securities in 2017:
- Charges - Other: $3,920,000
- Construction - Police Protection: $3,289,000
Judicial and Legal Services: $1,887,000
- Current Operations - General - Other: $15,721,000
Central Staff Services: $3,310,000
Regular Highways: $2,659,000
Judicial and Legal Services: $2,414,000
Police Protection: $2,372,000
Correctional Institutions: $2,175,000
Central Staff Services: $2,027,000
Regular Highways: $1,485,000
General Public Buildings: $962,000
Libraries: $866,000
Financial Administration: $809,000
Financial Administration: $807,000
Local Fire Protection: $185,000
Corrections - Other: $131,000
Public Welfare - Other: $66,000
- Federal Intergovernmental - Other: $157,000
General Local Government Support: $42,000
- General - Interest on Debt: $5,644,000
- Miscellaneous - General Revenue - Other: $320,000
Interest Earnings: $48,000
- Other Capital Outlay - Regular Highways: $1,476,000
Local Fire Protection: $466,000
Police Protection: $299,000
Police Protection: $33,000
- Other Funds - Cash and Securities: $7,385,000
Cash and Securities: $7,220,000
- State Intergovernmental - Highways: $388,000
Other: $293,000
General Local Government Support: $40,000
- Tax - Property: $20,178,000
Property: $13,044,000
General Sales and Gross Receipts: $1,312,000
- Total Salaries and Wages: $15,721,000
: $4,372,000
Supplemental Security Income (SSI) in 2006:
- Total number of recipients: 341
- Number of aged recipients: 64
- Number of blind and disabled recipients: 277
- Number of recipients under 18: 41
- Number of recipients between 18 and 64: 202
- Number of recipients older than 64: 98
- Number of recipients also receiving OASDI: 158
- Amount of payments (thousands of dollars): 121
| Most common first names in Bosque County, TX among deceased individuals | ||
| Name | Count | Lived (average) |
|---|---|---|
| John | 184 | 76.7 years |
| William | 170 | 76.8 years |
| James | 150 | 73.5 years |
| Mary | 128 | 79.8 years |
| Robert | 91 | 73.3 years |
| George | 72 | 78.1 years |
| Charles | 72 | 74.8 years |
| Willie | 68 | 81.1 years |
| Henry | 57 | 78.5 years |
| Thomas | 54 | 75.4 years |
| Most common last names in Bosque County, TX among deceased individuals | ||
| Last name | Count | Lived (average) |
|---|---|---|
| Smith | 89 | 77.1 years |
| Johnson | 86 | 78.2 years |
| Jones | 66 | 78.6 years |
| Williams | 57 | 75.1 years |
| Davis | 50 | 77.2 years |
| Anderson | 42 | 78.9 years |
| Brown | 42 | 78.3 years |
| White | 42 | 79.3 years |
| Olson | 41 | 81.0 years |
| Moore | 39 | 76.6 years |
| Businesses in Bosque County, TX | ||||
| Name | Count | Name | Count | |
|---|---|---|---|---|
| Ace Hardware | 2 | Ford | 1 | |
| Alco Stores | 1 | H&R Block | 1 | |
| Best Western | 1 | SONIC Drive-In | 1 | |
| Burger King | 1 | Subway | 3 | |
| Chevrolet | 1 | U-Haul | 2 | |
| FedEx | 2 | UPS | 2 | |