Yorba Linda, California
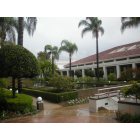
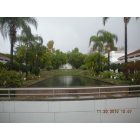
Yorba Linda: Richard M Nixon Presidential Museum - who says it never rains in southern California
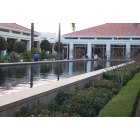
Yorba Linda: Richard Nixon Library - Reflection Pool
Yorba Linda: Nixon Libaray
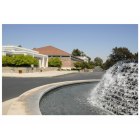
Yorba Linda: Richard Nixon Library Fountain
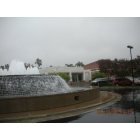
Yorba Linda: Richard M Nixon Presidential Museum - 18001 Yorba Linda Boulevard - Nice way to spend a rainy day in So. Cal
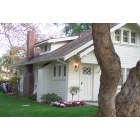
Yorba Linda: Richard Nixon Library - Richard Nixon's childhood home
Yorba Linda: Richard Nixon Library - Richard Nixon's childhood home
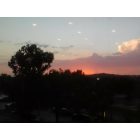
Yorba Linda: beautiful sunset from above y.l.
Yorba Linda: Richard M Nixon Presidential Museum - Nixon's childhood home & reflecting pool

Yorba Linda: Richard M Nixon Presidential Museum
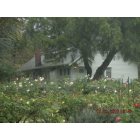
Yorba Linda: Richard M Nixon Presidential Museum - Nixon's childhood home
- see
13
more - add
your
Submit your own pictures of this city and show them to the world
- OSM Map
- General Map
- Google Map
- MSN Map
Population change since 2000: +13.9%
 |
| Males: 33,205 | |
| Females: 33,884 |
| Median resident age: | 47.8 years |
| California median age: | 37.9 years |
Zip codes: 92886.
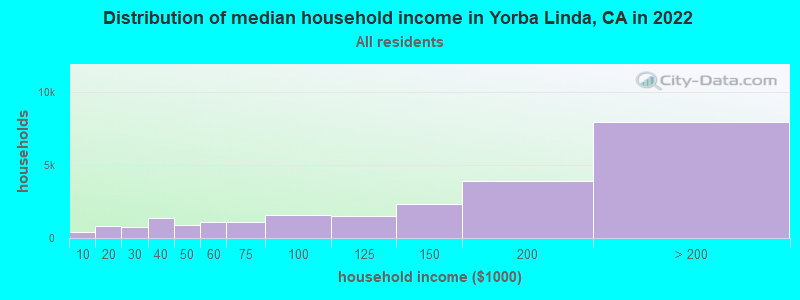
| Yorba Linda: | $151,534 |
| CA: | $91,551 |
Estimated per capita income in 2022: $64,896 (it was $36,173 in 2000)
Yorba Linda city income, earnings, and wages data
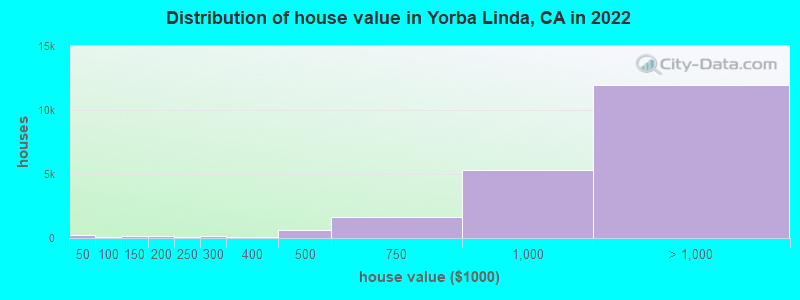
Estimated median house or condo value in 2022: over $1,000,000 (it was $340,600 in 2000)
| Yorba Linda: | over $1,000,000 |
| CA: | $715,900 |
Mean prices in 2022: all housing units: over $1,000,000; detached houses: over $1,000,000; townhouses or other attached units: $852,135; in 2-unit structures: over $1,000,000; in 3-to-4-unit structures: $607,055; in 5-or-more-unit structures: $638,083; mobile homes: $610,618
Median gross rent in 2022: $2,644.
(3.1% for White Non-Hispanic residents, 4.6% for Black residents, 5.3% for Hispanic or Latino residents, 5.5% for American Indian residents, 2.2% for Native Hawaiian and other Pacific Islander residents, 13.8% for other race residents, 3.1% for two or more races residents)
Detailed information about poverty and poor residents in Yorba Linda, CA


Compare current foreclosures near Yorba Linda, CA:
| Photo | Address | Area | Beds / Baths | Price | Details |
|---|---|---|---|---|---|

|
#1
Orange Dr
Yorba Linda, CA 92886
|
1,695 sq. feet
|
2 baths 4 beds |
show details | |

|
#2
Calle Sonora
Yorba Linda, CA 92887
|
1,960 sq. feet
|
2 baths 3 beds |
show details | |

|
#3
Via Mariano
Yorba Linda, CA 92887
|
1,562 sq. feet
|
2 baths 3 beds |
show details | |

|
#4
Orange Dr
Yorba Linda, CA 92886
|
1,550 sq. feet
|
2 baths 4 beds |
show details | |

|
#5
Via Maria
Yorba Linda, CA 92886
|
1,864 sq. feet
|
3 baths 3 beds |
show details | |

|
#6
Chateau Ave
Yorba Linda, CA 92886
|
1,586 sq. feet
|
2 baths 3 beds |
show details | |

|
#7
Via Santiago
Yorba Linda, CA 92887
|
1,123 sq. feet
|
2 baths 3 beds |
show details | |

|
#8
Avocado Ave
Yorba Linda, CA 92886
|
1,590 sq. feet
|
2 baths 4 beds |
show details | |

|
#9
Olana Plz
Yorba Linda, CA 92886
|
1,375 sq. feet
|
3 baths 3 beds |
show details | |

|
#10
Mimosa Dr
Yorba Linda, CA 92886
|
1,308 sq. feet
|
1 baths 3 beds |
show details |
| Photo | Address | Area | Beds / Baths | Price | Details |
|---|---|---|---|---|---|

|
#11
Cambridge Rd
Yorba Linda, CA 92887
|
- sq. feet
|
2 baths 2 beds |
show details | |

|
#12
Via Fonte
Yorba Linda, CA 92886
|
2,403 sq. feet
|
- baths 3 beds |
show details | |

|
#13
Via Espana
Yorba Linda, CA 92886
|
1,950 sq. feet
|
- baths 3 beds |
show details | |

|
#14
Portsmouth Rd
Yorba Linda, CA 92887
|
- sq. feet
|
2 baths 2 beds |
show details | |

|
#15
Calle Mirador
Yorba Linda, CA 92886
|
- sq. feet
|
- baths - beds |
show details | |

|
#16
Babbling Brook Way # 32f
Yorba Linda, CA 92887
|
- sq. feet
|
- baths - beds |
show details | |

|
#17
Oakcrest Cir # 1206
Yorba Linda, CA 92887
|
- sq. feet
|
- baths - beds |
show details | |

|
#18
Lake Knoll Ln
Yorba Linda, CA 92886
|
- sq. feet
|
- baths - beds |
show details | |

|
#19
Amberwood Ln
Yorba Linda, CA 92886
|
- sq. feet
|
- baths - beds |
show details | |

|
#20
Alamo Ln
Yorba Linda, CA 92886
|
- sq. feet
|
- baths - beds |
show details |
| Photo | Address | Area | Beds / Baths | Price | Details |
|---|---|---|---|---|---|

|
#21
River Bend Dr Apt A
Yorba Linda, CA 92887
|
- sq. feet
|
- baths - beds |
show details | |

|
#22
Hidden Hills Rd
Yorba Linda, CA 92887
|
- sq. feet
|
- baths - beds |
show details | |

|
#23
Hidden Oaks Dr
Yorba Linda, CA 92886
|
- sq. feet
|
- baths 5 beds |
show details | |

|
#24
Via Lenardo
Yorba Linda, CA 92887
|
- sq. feet
|
- baths - beds |
show details | |

|
#25
E G St
Ontario, CA 91764
|
1,036 sq. feet
|
1 baths 3 beds |
$577,200
|
show details |

|
#26
E Norma Ave
West Covina, CA 91791
|
1,134 sq. feet
|
2 baths 3 beds |
$599,000
|
show details |

|
#27
Hawkstone Ave
Whittier, CA 90605
|
1,444 sq. feet
|
2 baths 4 beds |
$674,900
|
show details |

|
#28
Millbury Ave
Baldwin Park, CA 91706
|
1,632 sq. feet
|
2 baths 4 beds |
$895,000
|
show details |

|
#29
Maple Leaf Ln
Yorba Linda, CA 92886
|
- sq. feet
|
- baths - beds |
show details | |

|
#30
E Tudor St
Covina, CA 91724
|
1,776 sq. feet
|
3 baths 4 beds |
$8,266
|
show details |
| Photo | Address | Area | Beds / Baths | Price | Details |
|---|---|---|---|---|---|

|
#31
Arvid St
La Puente, CA 91744
|
1,437 sq. feet
|
2 baths 4 beds |
$18,566
|
show details |

|
#32
E Holton St
West Covina, CA 91791
|
- sq. feet
|
2 baths 3 beds |
$450,000
|
show details |

|
#33
Belle River Dr
Hacienda Heights, CA 91745
|
2,028 sq. feet
|
3 baths 3 beds |
$38,273
|
show details |

|
#34
Burton Rd
Glendora, CA 91740
|
1,302 sq. feet
|
2 baths 4 beds |
$21,523
|
show details |

|
#35
Elaine Ave
Norwalk, CA 90650
|
1,230 sq. feet
|
2 baths 2 beds |
$65,742
|
show details |

|
#36
Armley Ave
Whittier, CA 90603
|
1,461 sq. feet
|
2 baths 2 beds |
$102,885
|
show details |

|
#37
Calle Parral
West Covina, CA 91792
|
1,325 sq. feet
|
2 baths 2 beds |
$6,341
|
show details |

|
#38
Donner Dr
Walnut, CA 91789
|
1,643 sq. feet
|
2 baths 4 beds |
$145,237
|
show details |

|
#39
View Ln
Corona, CA 92881
|
2,420 sq. feet
|
3 baths 3 beds |
$30,425
|
show details |

|
#40
E Jackson Ave Unit C
Anaheim, CA 92806
|
1,266 sq. feet
|
2 baths 3 beds |
show details |
| Photo | Address | Area | Beds / Baths | Price | Details |
|---|---|---|---|---|---|

|
#41
Celebration St
Chino, CA 91708
|
1,644 sq. feet
|
2 baths 3 beds |
show details | |

|
#42
Norwalk Blvd Apt
Hawaiian Gardens, CA 90716
|
800 sq. feet
|
2 baths 1 beds |
show details | |

|
#43
Apple Court
Upland, CA 91786
|
1,655 sq. feet
|
2 baths 2 beds |
show details | |

|
#44
Centralia St Unit 206
Lakewood, CA 90715
|
1,231 sq. feet
|
1 baths 1 beds |
show details | |

|
#45
Scholarship
Irvine, CA 92612
|
1,349 sq. feet
|
1 baths 1 beds |
show details | |

|
#46
S Dancove Dr
West Covina, CA 91791
|
1,956 sq. feet
|
3 baths 3 beds |
show details | |

|
#47
N Traymore Ave
Covina, CA 91722
|
1,755 sq. feet
|
2 baths 4 beds |
show details | |

|
#48
Clarissa St
Garden Grove, CA 92840
|
1,098 sq. feet
|
2 baths 3 beds |
show details | |

|
#49
Parise Dr
Whittier, CA 90604
|
1,198 sq. feet
|
2 baths 3 beds |
show details | |

|
Check over 1 million property listings on Foreclosure.com!
|
browse all offers | |||


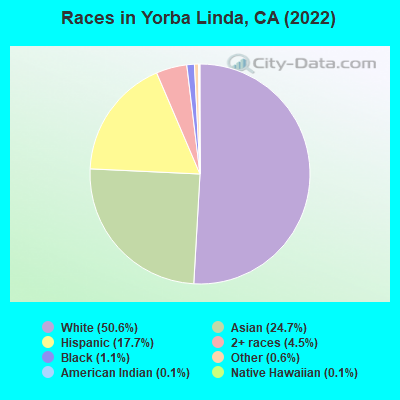
- 34,19850.6%White alone
- 16,70524.7%Asian alone
- 11,95117.7%Hispanic
- 3,0634.5%Two or more races
- 7191.1%Black alone
- 4360.6%Other race alone
- 1000.1%American Indian alone
- 940.1%Native Hawaiian and Other
Pacific Islander alone
According to our research of California and other state lists, there were 28 registered sex offenders living in Yorba Linda, California as of April 16, 2024.
The ratio of all residents to sex offenders in Yorba Linda is 2,437 to 1.
The ratio of registered sex offenders to all residents in this city is much lower than the state average.
The City-Data.com crime index weighs serious crimes and violent crimes more heavily. Higher means more crime, U.S. average is 246.1. It adjusts for the number of visitors and daily workers commuting into cities.
- means the value is smaller than the state average.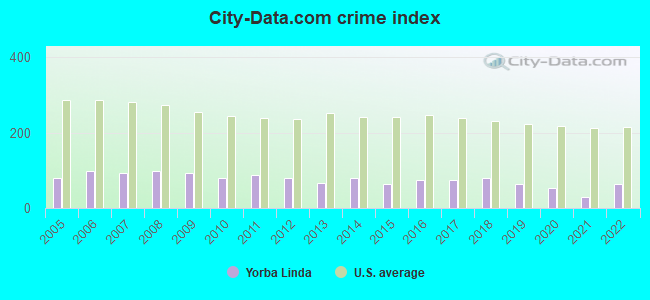
Crime rate in Yorba Linda detailed stats: murders, rapes, robberies, assaults, burglaries, thefts, arson
Full-time law enforcement employees in 2015, including police officers: 1 (1 officers - 1 male; 0 female).
| Officers per 1,000 residents here: | 0.01 |
| California average: | 1.98 |
 Recent articles from our blog. Our writers, many of them Ph.D. graduates or candidates, create easy-to-read articles on a wide variety of topics.

 | Yorba Linda, Anaheim Hills, Villa Park (14 replies) |
| Fullerton vs Yorba Linda? (4 replies) |
| Yorba Linda: Good place for my family to plant roots? (8 replies) |
| Commute from Yorba Linda to Long Beach? (28 replies) |
| Brea, Yorba Linda? (6 replies) |
| Yorba Linda-like areas of LA County? (19 replies) |
Latest news from Yorba Linda, CA collected exclusively by city-data.com from local newspapers, TV, and radio stations
Yorba Linda, CA City Guides:
Ancestries: English (6.0%), American (5.3%), German (5.2%), Italian (3.7%), Irish (3.7%), European (3.4%).
Current Local Time: PST time zone
Elevation: 397 feet
Land area: 19.4 square miles.
Population density: 3,464 people per square mile (average).
14,978 residents are foreign born (15.2% Asia, 2.9% Latin America).
| This city: | 22.2% |
| California: | 26.5% |
Median real estate property taxes paid for housing units with mortgages in 2022: $8,628 (0.8%)
Median real estate property taxes paid for housing units with no mortgage in 2022: $7,560 (0.7%)
Nearest city with pop. 200,000+: Anaheim, CA  (6.7 miles , pop. 328,014).
Nearest city with pop. 1,000,000+: Los Angeles, CA (36.4 miles , pop. 3,694,820).
Nearest cities:
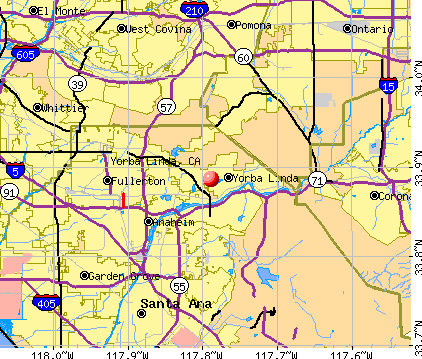
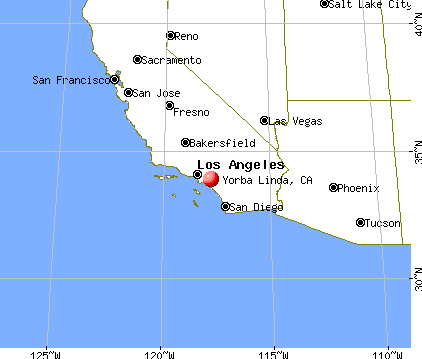
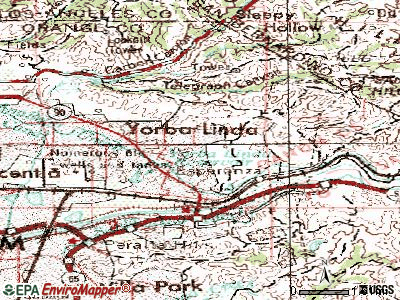
), Latitude: 33.89 N, Longitude: 117.79 W
Daytime population change due to commuting: -10,634 (-15.9%)
Workers who live and work in this city: 9,347 (29.5%)
Area code: 714
Yorba Linda, California accommodation & food services, waste management - Economy and Business Data
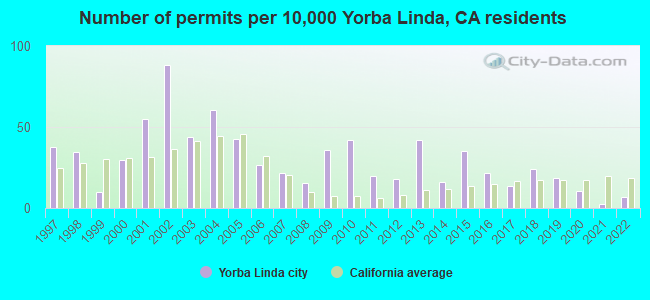
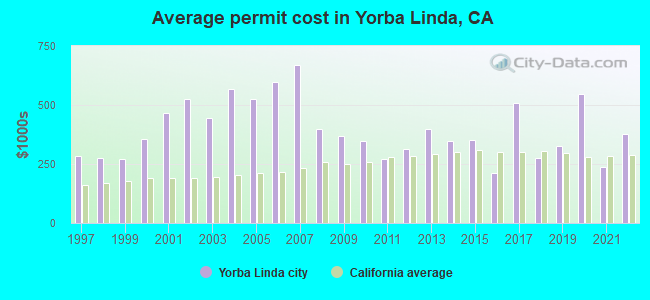
Single-family new house construction building permits:
- 2022: 39 buildings, average cost: $377,300
- 2021: 14 buildings, average cost: $239,200
- 2020: 63 buildings, average cost: $547,600
- 2019: 108 buildings, average cost: $328,300
- 2018: 142 buildings, average cost: $273,700
- 2017: 79 buildings, average cost: $508,000
- 2016: 126 buildings, average cost: $209,600
- 2015: 206 buildings, average cost: $351,700
- 2014: 94 buildings, average cost: $346,900
- 2013: 248 buildings, average cost: $397,900
- 2012: 104 buildings, average cost: $312,900
- 2011: 118 buildings, average cost: $272,300
- 2010: 247 buildings, average cost: $347,700
- 2009: 211 buildings, average cost: $367,900
- 2008: 90 buildings, average cost: $398,300
- 2007: 126 buildings, average cost: $670,700
- 2006: 155 buildings, average cost: $596,700
- 2005: 250 buildings, average cost: $524,300
- 2004: 356 buildings, average cost: $565,900
- 2003: 260 buildings, average cost: $444,800
- 2002: 520 buildings, average cost: $523,500
- 2001: 323 buildings, average cost: $468,400
- 2000: 175 buildings, average cost: $356,400
- 1999: 59 buildings, average cost: $272,100
- 1998: 203 buildings, average cost: $275,000
- 1997: 223 buildings, average cost: $284,400
| Here: | 3.3% |
| California: | 5.1% |
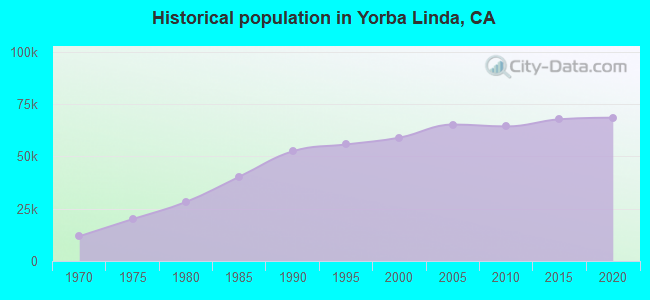
Population change in the 1990s: +6,229 (+11.8%).
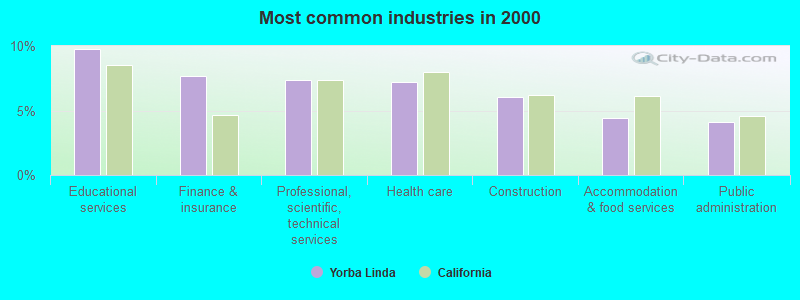
- Educational services (9.7%)
- Finance & insurance (7.7%)
- Professional, scientific, technical services (7.4%)
- Health care (7.2%)
- Construction (6.1%)
- Accommodation & food services (4.4%)
- Public administration (4.1%)
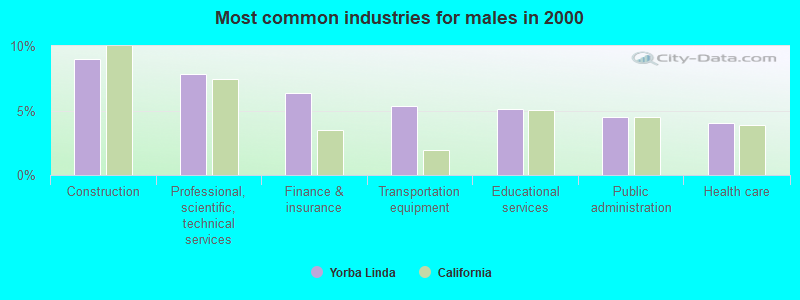
- Construction (9.0%)
- Professional, scientific, technical services (7.8%)
- Finance & insurance (6.4%)
- Transportation equipment (5.4%)
- Educational services (5.1%)
- Public administration (4.5%)
- Health care (4.1%)
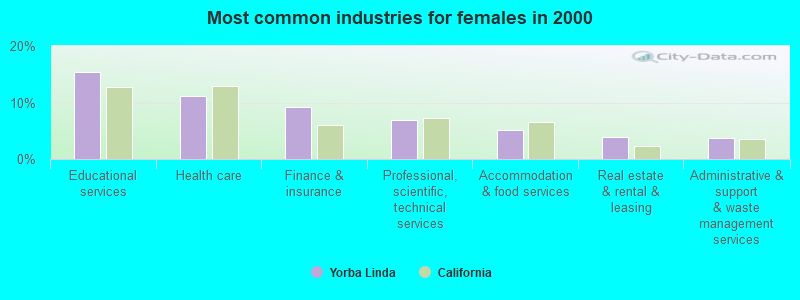
- Educational services (15.4%)
- Health care (11.1%)
- Finance & insurance (9.3%)
- Professional, scientific, technical services (6.8%)
- Accommodation & food services (5.2%)
- Real estate & rental & leasing (3.8%)
- Administrative & support & waste management services (3.7%)
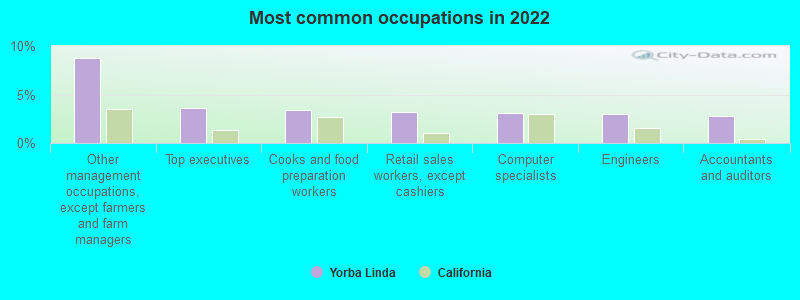
- Other management occupations, except farmers and farm managers (8.8%)
- Top executives (3.6%)
- Cooks and food preparation workers (3.4%)
- Retail sales workers, except cashiers (3.2%)
- Computer specialists (3.1%)
- Engineers (3.0%)
- Accountants and auditors (2.8%)
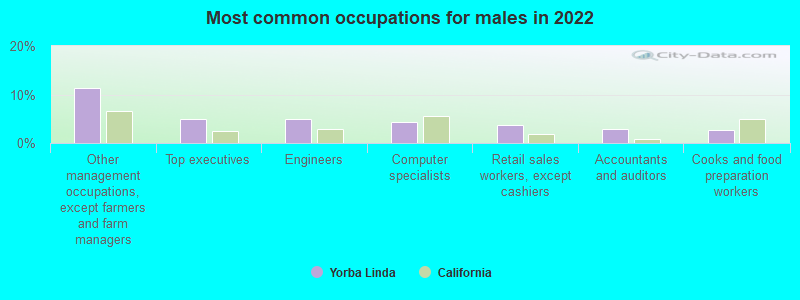
- Other management occupations, except farmers and farm managers (11.3%)
- Top executives (5.0%)
- Engineers (4.9%)
- Computer specialists (4.3%)
- Retail sales workers, except cashiers (3.8%)
- Accountants and auditors (2.9%)
- Cooks and food preparation workers (2.8%)
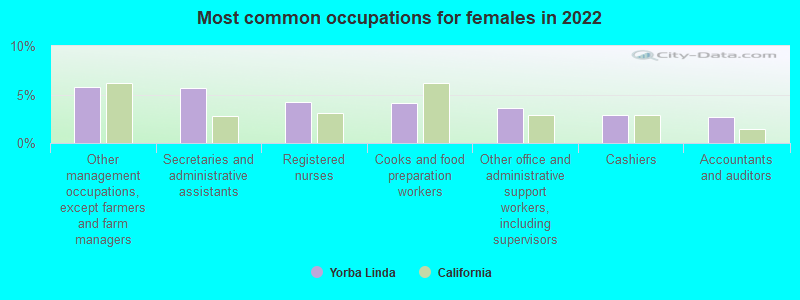
- Other management occupations, except farmers and farm managers (5.7%)
- Secretaries and administrative assistants (5.7%)
- Registered nurses (4.2%)
- Cooks and food preparation workers (4.1%)
- Other office and administrative support workers, including supervisors (3.6%)
- Cashiers (2.9%)
- Accountants and auditors (2.7%)
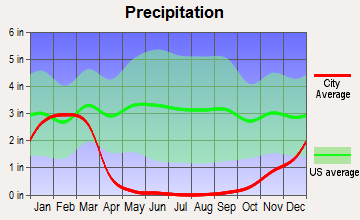
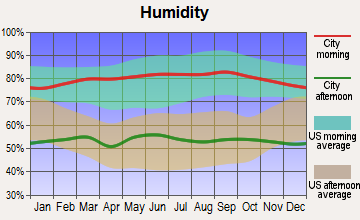
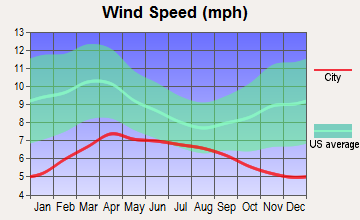
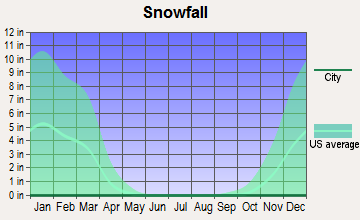
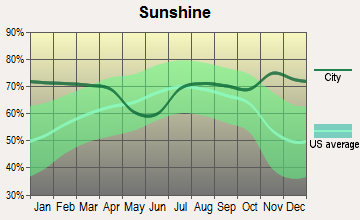
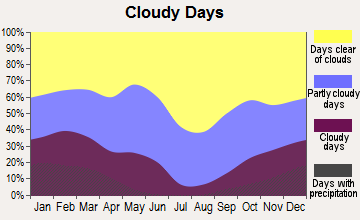
Average climate in Yorba Linda, California
Based on data reported by over 4,000 weather stations

|
|

(lower is better)
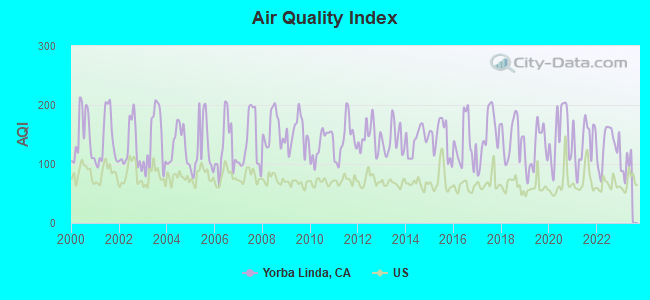
Air Quality Index (AQI) level in 2022 was 131. This is significantly worse than average.
| City: | 131 |
| U.S.: | 73 |
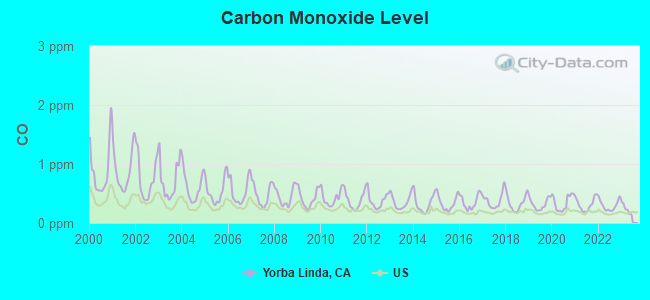
Carbon Monoxide (CO) [ppm] level in 2022 was 0.298. This is about average. Closest monitor was 5.9 miles away from the city center.
| City: | 0.298 |
| U.S.: | 0.251 |
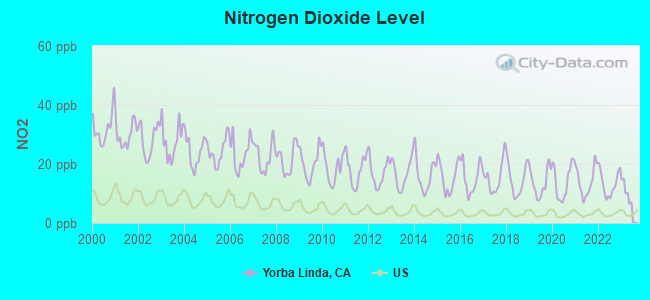
Nitrogen Dioxide (NO2) [ppb] level in 2022 was 13.3. This is significantly worse than average. Closest monitor was 5.9 miles away from the city center.
| City: | 13.3 |
| U.S.: | 5.1 |
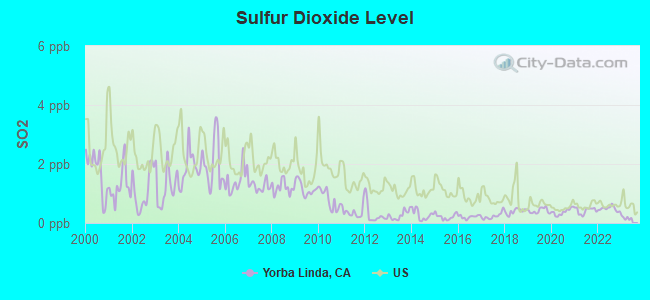
Sulfur Dioxide (SO2) [ppb] level in 2022 was 0.487. This is significantly better than average. Closest monitor was 8.5 miles away from the city center.
| City: | 0.487 |
| U.S.: | 1.515 |
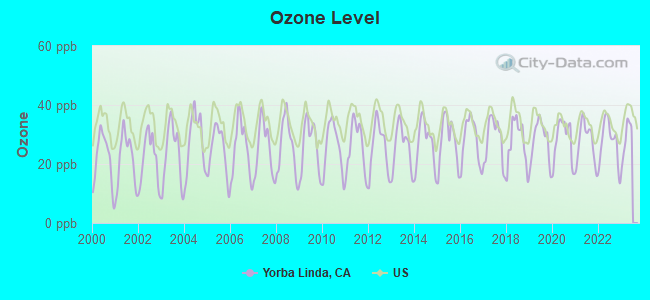
Ozone [ppb] level in 2022 was 27.5. This is better than average. Closest monitor was 5.9 miles away from the city center.
| City: | 27.5 |
| U.S.: | 33.3 |
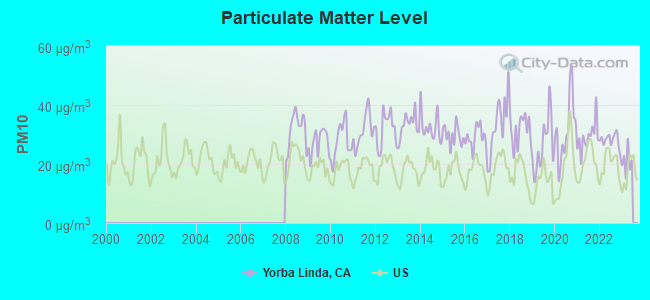
Particulate Matter (PM10) [µg/m3] level in 2022 was 28.0. This is significantly worse than average. Closest monitor was 8.5 miles away from the city center.
| City: | 28.0 |
| U.S.: | 19.2 |
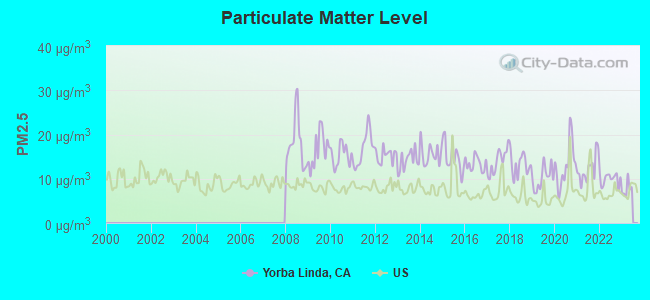
Particulate Matter (PM2.5) [µg/m3] level in 2022 was 9.95. This is worse than average. Closest monitor was 8.5 miles away from the city center.
| City: | 9.95 |
| U.S.: | 8.11 |
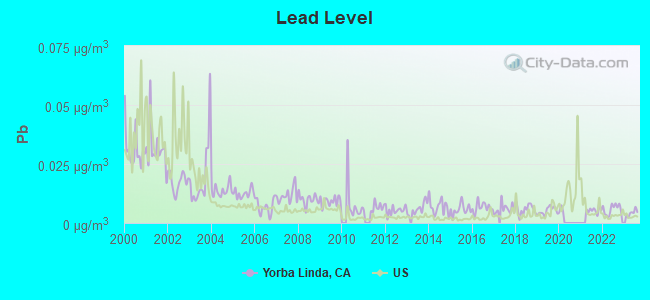
Lead (Pb) [µg/m3] level in 2023 was 0.00426. This is significantly better than average. Closest monitor was 5.9 miles away from the city center.
| City: | 0.00426 |
| U.S.: | 0.00931 |
Earthquake activity:
Yorba Linda-area historical earthquake activity is significantly above California state average. It is 7038% greater than the overall U.S. average.On 6/28/1992 at 11:57:34, a magnitude 7.6 (6.2 MB, 7.6 MS, 7.3 MW, Depth: 0.7 mi, Class: Major, Intensity: VIII - XII) earthquake occurred 74.9 miles away from Yorba Linda center, causing 3 deaths (1 shaking deaths, 2 other deaths) and 400 injuries, causing $100,000,000 total damage and $40,000,000 insured losses
On 7/21/1952 at 11:52:14, a magnitude 7.7 (7.7 UK) earthquake occurred 103.5 miles away from the city center, causing $50,000,000 total damage
On 10/16/1999 at 09:46:44, a magnitude 7.4 (6.3 MB, 7.4 MS, 7.2 MW, 7.3 ML) earthquake occurred 88.8 miles away from the city center
On 4/21/1918 at 22:32:30, a magnitude 6.8 (6.8 UK, Class: Strong, Intensity: VII - IX) earthquake occurred 20.7 miles away from the city center
On 11/4/1927 at 13:51:53, a magnitude 7.5 (7.5 UK) earthquake occurred 198.2 miles away from Yorba Linda center
On 5/19/1940 at 04:36:40, a magnitude 7.2 (7.2 UK) earthquake occurred 129.0 miles away from the city center, causing $33,000,000 total damage
Magnitude types: body-wave magnitude (MB), local magnitude (ML), surface-wave magnitude (MS), moment magnitude (MW)
Natural disasters:
The number of natural disasters in Orange County (32) is a lot greater than the US average (15).Major Disasters (Presidential) Declared: 22
Emergencies Declared: 2
Causes of natural disasters: Floods: 15, Fires: 13, Storms: 9, Landslides: 6, Winter Storms: 6, Mudslides: 5, Earthquakes: 2, Heavy Rain: 1, Hurricane: 1, Snow: 1, Tornado: 1, Wind: 1, Other: 1 (Note: some incidents may be assigned to more than one category).
Hospitals and medical centers in Yorba Linda:
- CASA DE YORBA LINDA (4742 VIA DEL RANCHO)
- CHARTER BEHAVIORAL HEALTH SYSTEM (provides emergency services, 16850 E BASTANCHURY)
- LIGHTHOUSE ICF-DDN (17001 SAGA DRIVE)
- ROSE LU ANN HOME - REGULUS (17231 REGULUS DRIVE)
- ST JUDE HOSPITAL YORBA LINDA (16850 EAST BASTENCHURY ROAD)
- ST ROSE OF LIMA HEALTHCARE PROVIDER, INC (4901 LAKEVIEW AVENUE)
- EMERITUS AT YORBA LINDA (17803 IMPERIAL HIGHWAY)
Amtrak stations near Yorba Linda:
- 8 miles: FULLERTON (120 E. SANTA FE AVE.) . Services: ticket office, fully wheelchair accessible, enclosed waiting area, public restrooms, public payphones, full-service food facilities, free short-term parking, paid long-term parking, taxi stand, public transit connection.
- 8 miles: ANAHEIM (2150 KATELLA AVE.) . Services: ticket office, fully wheelchair accessible, enclosed waiting area, public restrooms, public payphones, vending machines, free short-term parking, free long-term parking, call for car rental service, call for taxi service.
- 10 miles: SANTA ANA (1000 E. SANTA ANA BLVD.) . Services: ticket office, fully wheelchair accessible, enclosed waiting area, public restrooms, public payphones, snack bar, free short-term parking, free long-term parking, call for car rental service, taxi stand, intercity bus service, public transit connection.
Colleges/universities with over 2000 students nearest to Yorba Linda:
- California State University-Fullerton (about 6 miles; Fullerton, CA; Full-time enrollment: 28,947)
- Santiago Canyon College (about 7 miles; Orange, CA; FT enrollment: 6,050)
- Chapman University (about 8 miles; Orange, CA; FT enrollment: 7,089)
- Fullerton College (about 8 miles; Fullerton, CA; FT enrollment: 11,124)
- West Coast University-Orange County (about 9 miles; Anaheim, CA; FT enrollment: 2,464)
- Santa Ana College (about 11 miles; Santa Ana, CA; FT enrollment: 11,756)
- Mt San Antonio College (about 12 miles; Walnut, CA; FT enrollment: 19,891)
Public high school in Yorba Linda:
- YORBA LINDA HIGH (Students: 425, Location: 19900 BASTANCHURY RD., Grades: 9-12)
Biggest public elementary/middle schools in Yorba Linda:
- BRYANT RANCH ELEMENTARY (Students: 523, Location: 24695 PASEO DE TORONTO, Grades: KG-5)
- FAIRMONT ELEMENTARY (Location: 5241 FAIRMONT BLVD., Grades: KG-6)
- GLENKNOLL ELEMENTARY (Location: 6361 GLENKNOLL DR., Grades: KG-6)
- BERNARDO YORBA MIDDLE (Location: 5350 FAIRMONT BLVD., Grades: 7-8)
- TRAVIS RANCH (Location: 5200 VIA DE LA ESCUELA, Grades: KG-8)
- MABEL M. PAINE ELEMENTARY (Location: 4444 PLUMOSA DR., Grades: KG-5)
- ROSE DRIVE ELEMENTARY (Location: 4700 ROSE DR., Grades: KG-5)
- YORBA LINDA MIDDLE (Location: 4777 CASA LOMA AVE., Grades: 6-8)
- LINDA VISTA ELEMENTARY (Location: 5600 S. OHIO ST., Grades: KG-5)
- LAKEVIEW ELEMENTARY (Location: 17510 LAKEVIEW AVE., Grades: KG-5)
Private elementary/middle schools in Yorba Linda:
- HERITAGE OAK PRIVATE EDUCATION (Students: 552, Location: 16971 IMPERIAL HWY, Grades: PK-8)
- FRIENDS CHRISTIAN SCHOOL (Students: 429, Location: 4231 ROSE DR, Grades: 5-8)
- ST FRANCIS OF ASSISI SCHOOL (Students: 414, Location: 5330 EASTSIDE CIR, Grades: PK-8)
- CALVARY CHAPEL ACADEMY (Students: 247, Location: 5401 FAIRMONT BLVD, Grades: PK-8)
User-submitted facts and corrections:
- Cal State Fullerton is also a well known college close to Yorba Linda
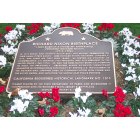
- Yorba Linda, CA is home to the Richard Nixon Library and Birthplace. Along with many other attractions, including the restored house in which President Nixon was born, both Nixon and his wife, Pat, are buried there. For more information, visit http://www.nixonfoundation.org/
Points of interest:
Notable locations in Yorba Linda: Knoll Professional Center (A), Yorba Linda Golf Course (B), Yorba Linda City Hall (C), Yorba Linda Public Library (D), Orange County Fire Authority Station 10 (E), Orange County Fire Authority Station 53 (F), Orange County Fire Authority Station 32 (G). Display/hide their locations on the map
Shopping Centers: Yorba Linda Station Plaza Shopping Center (1), Village Green Shopping Center (2), Villa Yorba Shopping Center (3), Valley View Shopping Center (4), The Court Yard Shopping Center (5), The Country Club Shopping Center (6), Remax Shopping Center (7), Post Office Plaza Shopping Center (8), Packing House Square Shopping Center (9). Display/hide their locations on the map
Church in Yorba Linda: First Baptist Church of Yorba Linda (A). Display/hide its location on the map
Reservoir: Yorba Linda Reservoir (A). Display/hide its location on the map
Creeks: Coal Creek (A), Gypsum Creek (B). Display/hide their locations on the map
Parks in Yorba Linda include: Buena Vista Equestrian Park (1), Fairmont Knolls Park (2), Hurless Barton Park (3), Jessamyn West Park (4), Kingsbriar Park (5), R M Nixon Park (6), Valley View Sports Park (7), Brush Canyon Park (8), Sycamore Park (9). Display/hide their locations on the map
Tourist attraction: Cartwright Public Relations (Cultural Attractions- Events- & Facilities; 18001 Yorba Linda Boulevard) (1). Display/hide its approximate location on the map
Birthplace of: Richard Nixon - Politician, Sabrina Bryan - Child singer, Ashley Force Hood - Racing driver, Chris Pontius (soccer) - Soccer player, Yuri Moscevsky - NHL player (San Jose Sharks, born: Oct 20, 1978), Eric Friedman - Rock guitarist, Marc Tyler - Football player, Doug Saunders (baseball) - Baseball player, Mitzi Kapture - Television actor.
Drinking water stations with addresses in Yorba Linda that have no violations reported:
- BLUE SKIES MOBILE HOME PARK (Population served: 200, Primary Water Source Type: Groundwater)
| This city: | 3.0 people |
| California: | 2.9 people |
| This city: | 82.1% |
| Whole state: | 68.7% |
| This city: | 3.0% |
| Whole state: | 7.2% |
Likely homosexual households (counted as self-reported same-sex unmarried-partner households)
- Lesbian couples: 0.3% of all households
- Gay men: 0.2% of all households
People in group quarters in Yorba Linda in 2010:
- 93 people in nursing facilities/skilled-nursing facilities
- 48 people in other noninstitutional facilities
- 37 people in group homes intended for adults
- 7 people in workers' group living quarters and job corps centers
- 5 people in residential treatment centers for adults
People in group quarters in Yorba Linda in 2000:
- 87 people in other noninstitutional group quarters
- 33 people in homes for the mentally retarded
- 9 people in religious group quarters
- 6 people in hospitals/wards and hospices for chronically ill
- 6 people in hospices or homes for chronically ill
Banks with branches in Yorba Linda (2011 data):
- U.S. Bank National Association: Yorba Linda Branch at 19750 Yorba Linda Blvd, branch established on 1892/01/01; Yorba Linda Albertsons Branch at 21500 Yorba Linda Blvd, branch established on 2001/10/12. Info updated 2012/01/30: Bank assets: $330,470.8 mil, Deposits: $236,091.5 mil, headquarters in Cincinnati, OH, positive income, 3121 total offices, Holding Company: U.S. Bancorp
- Wells Fargo Bank, National Association: Lakeview at 18529 Yorba Linda Boulevard, branch established on 1996/06/26; Yorba Linda Branch at 20375 Yorba Linda Boulevard, branch established on 1991/07/08. Info updated 2011/04/05: Bank assets: $1,161,490.0 mil, Deposits: $905,653.0 mil, headquarters in Sioux Falls, SD, positive income, 6395 total offices, Holding Company: Wells Fargo & Company
- JPMorgan Chase Bank, National Association: Yorba Linda Blvd And Valley View Bra at 17490 Yorba Linda Blvd, branch established on 2011/06/28; Yorba Linda Branch at 20385 Yorba Linda Blvd, branch established on 1987/06/30. Info updated 2011/11/10: Bank assets: $1,811,678.0 mil, Deposits: $1,190,738.0 mil, headquarters in Columbus, OH, positive income, International Specialization, 5577 total offices, Holding Company: Jpmorgan Chase & Co.
- Bank of America, National Association: East Yorba Linda at 19601 Yorba Linda Boulevard, branch established on 1971/07/19; Yorba Linda Branch at 4802 South Main Street, branch established on 1945/06/04. Info updated 2009/11/18: Bank assets: $1,451,969.3 mil, Deposits: $1,077,176.8 mil, headquarters in Charlotte, NC, positive income, 5782 total offices, Holding Company: Bank Of America Corporation
- Citibank, National Association: Yorba Linda Branch at 21530 Yorba Linda Blvd, branch established on 1990/05/01. Info updated 2012/01/10: Bank assets: $1,288,658.0 mil, Deposits: $882,541.0 mil, headquarters in Sioux Falls, SD, positive income, International Specialization, 1048 total offices, Holding Company: Citigroup Inc.
- Union Bank, National Association: Yorba Linda Branch at 20655 Yorba Linda Blvd, branch established on 2003/05/12. Info updated 2011/09/01: Bank assets: $88,967.5 mil, Deposits: $65,286.4 mil, headquarters in San Francisco, CA, positive income, Commercial Lending Specialization, 403 total offices, Holding Company: Mitsubishi Ufj Financial Group, Inc.
- First Bank: Yorba Linda Branch at 18206 Imperial Highway, branch established on 1998/07/01. Info updated 2007/12/04: Bank assets: $6,579.8 mil, Deposits: $5,800.6 mil, headquarters in Creve Coeur, MO, negative income in the last year, Commercial Lending Specialization, 148 total offices, Holding Company: First Banks, Inc.
For population 15 years and over in Yorba Linda:
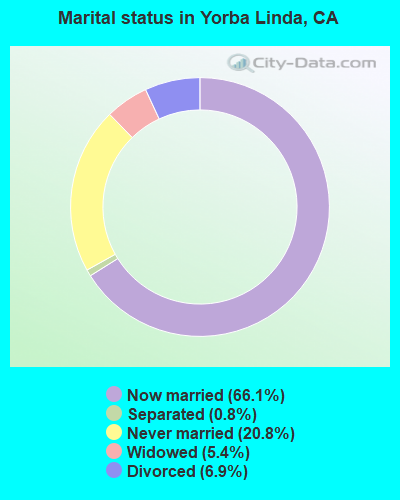
- Never married: 20.8%
- Now married: 66.1%
- Separated: 0.8%
- Widowed: 5.4%
- Divorced: 6.9%
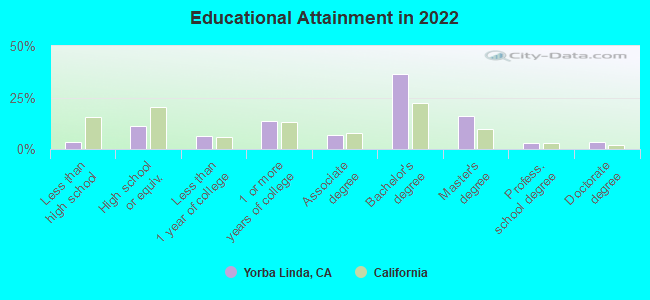
For population 25 years and over in Yorba Linda:
- High school or higher: 96.5%
- Bachelor's degree or higher: 58.5%
- Graduate or professional degree: 22.3%
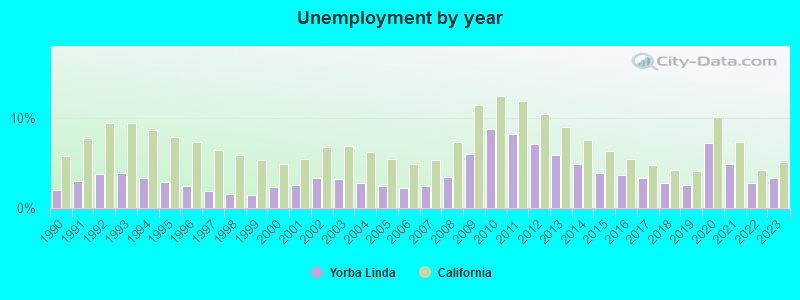
- Unemployed: 3.1%
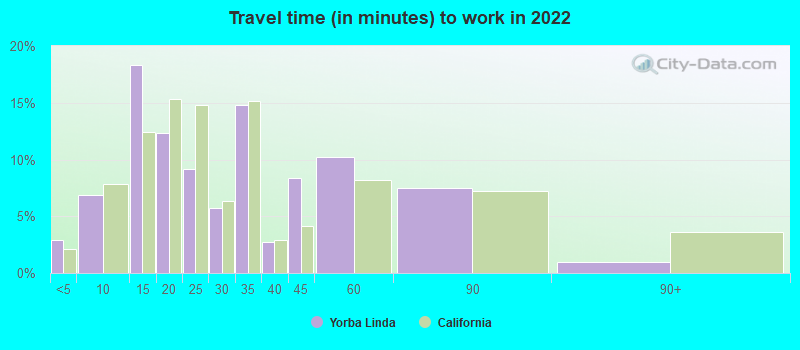
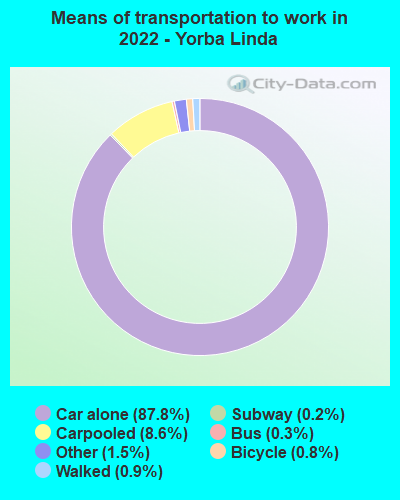
- Mean travel time to work (commute): 24.9 minutes
| Here: | 9.7 |
| California average: | 15.5 |


Graphs represent county-level data. Detailed 2008 Election Results
Religion statistics for Yorba Linda, CA (based on Orange County data)


| Religion | Adherents | Congregations |
|---|---|---|
| Catholic | 797,473 | 67 |
| Evangelical Protestant | 345,893 | 894 |
| Other | 141,815 | 329 |
| Mainline Protestant | 76,574 | 202 |
| Orthodox | 13,406 | 19 |
| Black Protestant | 2,424 | 8 |
| None | 1,632,647 | - |
Food Environment Statistics:
| This county: | 1.78 / 10,000 pop. |
| California: | 2.14 / 10,000 pop. |
| Here: | 0.06 / 10,000 pop. |
| California: | 0.04 / 10,000 pop. |
| Orange County: | 0.49 / 10,000 pop. |
| California: | 0.62 / 10,000 pop. |
| This county: | 1.46 / 10,000 pop. |
| State: | 1.49 / 10,000 pop. |
| This county: | 8.19 / 10,000 pop. |
| State: | 7.42 / 10,000 pop. |
| This county: | 6.3% |
| California: | 7.3% |
| Orange County: | 18.5% |
| California: | 21.3% |
| Here: | 16.4% |
| State: | 17.9% |
Health and Nutrition:
| Yorba Linda: | 54.7% |
| California: | 49.4% |
| Here: | 54.5% |
| State: | 48.0% |
| Here: | 27.8 |
| California: | 28.1 |
| Yorba Linda: | 19.2% |
| California: | 20.2% |
| This city: | 9.5% |
| California: | 11.2% |
| Yorba Linda: | 6.9 |
| California: | 6.8 |
| Here: | 33.3% |
| California: | 31.5% |
| This city: | 61.1% |
| California: | 56.4% |
| Yorba Linda: | 81.8% |
| California: | 80.9% |
More about Health and Nutrition of Yorba Linda, CA Residents
| Local government employment and payroll (March 2022) | |||||
| Function | Full-time employees | Monthly full-time payroll | Average yearly full-time wage | Part-time employees | Monthly part-time payroll |
|---|---|---|---|---|---|
| Parks and Recreation | 25 | $213,196 | $102,334 | 46 | $60,222 |
| Streets and Highways | 24 | $201,941 | $100,971 | 0 | $0 |
| Local Libraries | 19 | $157,792 | $99,658 | 31 | $49,279 |
| Housing and Community Development (Local) | 15 | $153,131 | $122,505 | 0 | $0 |
| Other Government Administration | 11 | $142,607 | $155,571 | 13 | $14,617 |
| Financial Administration | 10 | $97,978 | $117,574 | 4 | $11,561 |
| Other and Unallocable | 8 | $83,629 | $125,444 | 0 | $0 |
| Totals for Government | 112 | $1,050,274 | $112,529 | 94 | $135,678 |
Yorba Linda government finances - Expenditure in 2017 (per resident):
- Construction - Regular Highways: $12,715,000 ($189.52)
Parks and Recreation: $1,120,000 ($16.69)
Housing and Community Development: $488,000 ($7.27)
Libraries: $125,000 ($1.86)
- Current Operations - Parks and Recreation: $11,695,000 ($174.32)
Police Protection: $10,666,000 ($158.98)
Regular Highways: $9,873,000 ($147.16)
Central Staff Services: $6,865,000 ($102.33)
Libraries: $3,777,000 ($56.30)
Protective Inspection and Regulation - Other: $3,355,000 ($50.01)
Financial Administration: $874,000 ($13.03)
General - Other: $348,000 ($5.19)
Housing and Community Development: $162,000 ($2.41)
- General - Interest on Debt: $804,000 ($11.98)
- Other Capital Outlay - General - Other: $4,516,000 ($67.31)
Parks and Recreation: $84,000 ($1.25)
Central Staff Services: $81,000 ($1.21)
Protective Inspection and Regulation - Other: $69,000 ($1.03)
Police Protection: $54,000 ($0.80)
Housing and Community Development: $18,000 ($0.27)
Yorba Linda government finances - Revenue in 2017 (per resident):
- Charges - Other: $7,827,000 ($116.67)
Regular Highways: $6,681,000 ($99.58)
Parks and Recreation: $1,156,000 ($17.23)
- Federal Intergovernmental - Housing and Community Development: $182,000 ($2.71)
- Local Intergovernmental - Highways: $2,109,000 ($31.44)
Other: $1,020,000 ($15.20)
- Miscellaneous - Donations From Private Sources: $2,865,000 ($42.70)
Interest Earnings: $684,000 ($10.20)
General Revenue - Other: $633,000 ($9.44)
Rents: $584,000 ($8.70)
Fines and Forfeits: $194,000 ($2.89)
- State Intergovernmental - Highways: $1,118,000 ($16.66)
Other: $325,000 ($4.84)
General Local Government Support: $92,000 ($1.37)
- Tax - Property: $23,136,000 ($344.86)
General Sales and Gross Receipts: $7,667,000 ($114.28)
Other License: $2,118,000 ($31.57)
Public Utilities Sales: $1,950,000 ($29.07)
Other: $1,285,000 ($19.15)
Documentary and Stock Transfer: $733,000 ($10.93)
Other Selective Sales: $483,000 ($7.20)
Occupation and Business License - Other: $418,000 ($6.23)
Yorba Linda government finances - Debt in 2017 (per resident):
- Long Term Debt - Beginning Outstanding - Unspecified Public Purpose: $20,087,000 ($299.41)
Outstanding Unspecified Public Purpose: $19,973,000 ($297.71)
Retired Unspecified Public Purpose: $260,000 ($3.88)
Issue, Unspecified Public Purpose: $146,000 ($2.18)
Yorba Linda government finances - Cash and Securities in 2017 (per resident):
- Bond Funds - Cash and Securities: $8,192,000 ($122.11)
- Other Funds - Cash and Securities: $104,558,000 ($1558.50)
4.86% of this county's 2021 resident taxpayers lived in other counties in 2020 ($95,983 average adjusted gross income)
| Here: | 4.86% |
| California average: | 5.19% |
0.01% of residents moved from foreign countries ($132 average AGI)
Orange County: 0.01% California average: 0.03%
Top counties from which taxpayers relocated into this county between 2020 and 2021:
| from Los Angeles County, CA | |
| from Riverside County, CA | |
| from San Diego County, CA |
5.71% of this county's 2020 resident taxpayers moved to other counties in 2021 ($106,828 average adjusted gross income)
| Here: | 5.71% |
| California average: | 6.14% |
0.01% of residents moved to foreign countries ($180 average AGI)
Orange County: 0.01% California average: 0.02%
Top counties to which taxpayers relocated from this county between 2020 and 2021:
| to Los Angeles County, CA | |
| to Riverside County, CA | |
| to San Diego County, CA |
| Businesses in Yorba Linda, CA | ||||
| Name | Count | Name | Count | |
|---|---|---|---|---|
| 24 Hour Fitness | 1 | Kincaid | 1 | |
| 7-Eleven | 3 | Kohl's | 1 | |
| AT&T | 1 | LA Fitness | 1 | |
| Ace Hardware | 1 | La-Z-Boy | 1 | |
| Albertsons | 1 | MasterBrand Cabinets | 2 | |
| Ashley Furniture | 1 | McDonald's | 2 | |
| AutoZone | 1 | Nike | 5 | |
| Baskin-Robbins | 1 | Olive Garden | 1 | |
| Bed Bath & Beyond | 1 | Panda Express | 1 | |
| Big O Tires | 1 | Papa John's Pizza | 1 | |
| Blockbuster | 1 | PetSmart | 1 | |
| CVS | 1 | Pizza Hut | 1 | |
| Carl\s Jr. | 1 | Quiznos | 1 | |
| Chick-Fil-A | 1 | RadioShack | 1 | |
| Circle K | 1 | Rite Aid | 1 | |
| Costco | 1 | Safeway | 2 | |
| Dennys | 1 | Staples | 1 | |
| Domino's Pizza | 1 | Starbucks | 3 | |
| El Pollo Loco | 1 | Subway | 2 | |
| Extended Stay America | 1 | T-Mobile | 2 | |
| FedEx | 9 | T.G.I. Driday's | 1 | |
| Firestone Complete Auto Care | 1 | Taco Bell | 1 | |
| GNC | 1 | Trader Joe's | 1 | |
| GameStop | 1 | U-Haul | 2 | |
| H&R Block | 1 | UPS | 7 | |
| Jones New York | 1 | Vons | 2 | |
| Just Tires | 1 | YMCA | 1 | |
| KFC | 1 | |||
Strongest AM radio stations in Yorba Linda:
- KPLS (830 AM; 50 kW; ORANGE, CA; Owner: CRN LICENSES, LLC)
- KFI (640 AM; 50 kW; LOS ANGELES, CA; Owner: CAPSTAR TX LIMITED PARTNERSHIP)
- KTNQ (1020 AM; 50 kW; LOS ANGELES, CA; Owner: KTNQ-AM LICENSE CORP.)
- KLAC (570 AM; 50 kW; LOS ANGELES, CA; Owner: AMFM RADIO LICENSES, L.L.C.)
- KXTA (1150 AM; 50 kW; LOS ANGELES, CA; Owner: CITICASTERS LICENSES, L.P.)
- KDIS (1110 AM; 50 kW; PASADENA, CA; Owner: ABC,INC.)
- KFWB (980 AM; 50 kW; LOS ANGELES, CA; Owner: INFINITY BROADCASTING OPERATIONS, INC.)
- KMPC (1540 AM; 50 kW; LOS ANGELES, CA; Owner: ROSE CITY RADIO CORPORATION)
- KNX (1070 AM; 50 kW; LOS ANGELES, CA; Owner: INFINITY BROADCASTING OPERATIONS, INC.)
- KSPN (710 AM; 50 kW; LOS ANGELES, CA; Owner: KABC-AM RADIO, INC.)
- KALI (900 AM; 6 kW; WEST COVINA, CA; Owner: MULTICULTURAL RADIO BROADCASTING, INC.)
- KBLA (1580 AM; 50 kW; SANTA MONICA, CA)
- KMNY (1600 AM; 5 kW; POMONA, CA; Owner: MULTICULTURAL RADIO BROADCASTING, INC.)
Strongest FM radio stations in Yorba Linda:
- KFSH-FM (95.9 FM; ANAHEIM, CA; Owner: NEW INSPIRATION BROADCASTING COMPANY)
- KCBS-FM (93.1 FM; LOS ANGELES, CA; Owner: INFINITY BROADCASTING OPERATIONS, INC.)
- KSCA (101.9 FM; GLENDALE, CA; Owner: HBC LICENSE CORPORATION)
- KLOS (95.5 FM; LOS ANGELES, CA; Owner: KLOS-FM RADIO, INC.)
- K212FA (90.3 FM; TEMPLE CITY, CA; Owner: EDUCATIONAL MEDIA FOUNDATION)
- KOST (103.5 FM; LOS ANGELES, CA; Owner: CAPSTAR TX LIMITED PARTNERSHIP)
- K264AF (100.7 FM; GUASTI, CA; Owner: EDUCATIONAL MEDIA FOUNDATION)
- KWVE (107.9 FM; SAN CLEMENTE, CA; Owner: CALVARY CHAPEL OF COSTA MESA)
- KIIS-FM (102.7 FM; LOS ANGELES, CA; Owner: CITICASTERS LICENSES, L.P.)
- KLVE (107.5 FM; LOS ANGELES, CA; Owner: KLVE-FM LICENSE CORP.)
- KPCC (89.3 FM; PASADENA, CA; Owner: PASADENA AREA COMMUNITY COLLEGE DISTRICT)
- KHHT (92.3 FM; LOS ANGELES, CA; Owner: AMFM RADIO LICENSES, L.L.C.)
- KBIG-FM (104.3 FM; LOS ANGELES, CA; Owner: AMFM RADIO LICENSES, L.L.C.)
- KZLA-FM (93.9 FM; LOS ANGELES, CA; Owner: EMMIS RADIO LICENSE CORPORATION)
- KMZT-FM (105.1 FM; LOS ANGELES, CA; Owner: MOUNT WILSON FM BROADCASTERS, INC.)
- KTWV (94.7 FM; LOS ANGELES, CA; Owner: INFINITY BROADCASTING OPERATIONS, INC.)
- KPFK (90.7 FM; LOS ANGELES, CA; Owner: PACIFICA FOUNDATION, INC)
- K216EM (91.1 FM; ARCADIA, CA; Owner: LIFE ON THE WAY COMMUNICATIONS, INC.)
- KPWR (105.9 FM; LOS ANGELES, CA; Owner: EMMIS RADIO LICENSE CORPORATION)
- KLSX (97.1 FM; LOS ANGELES, CA; Owner: INFINITY BROADCASTING OPERATIONS, INC.)
TV broadcast stations around Yorba Linda:
- KTRO-LP (Channel 50; LANCASTER, CA; Owner: ROBERT D. ADELMAN)
- KCBS-TV (Channel 2; LOS ANGELES, CA; Owner: CBS BROADCASTING INC.)
- KHIZ (Channel 64; BARSTOW, CA; Owner: SUNBELT TELEVISION, INC.)
- KTLA-TV (Channel 5; LOS ANGELES, CA; Owner: KTLA INC.)
- KABC-TV (Channel 7; LOS ANGELES, CA; Owner: ABC HOLDING COMPANY, INC.)
- KCAL-TV (Channel 9; LOS ANGELES, CA; Owner: VIACOM TELEVISION STATIONS GROUP OF LOS ANGELES LLC)
- KNBC (Channel 4; LOS ANGELES, CA; Owner: NBC SUBSIDIARY (KNBC-TV), INC.)

- National Bridge Inventory (NBI) Statistics
- 16Number of bridges
- 164ft / 50.2mTotal length
- 491,500Total average daily traffic
- 24,954Total average daily truck traffic
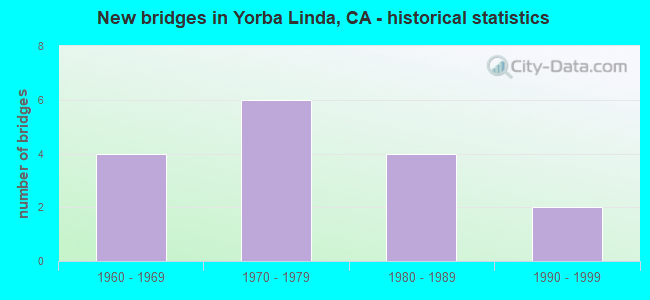
- New bridges - historical statistics
- 41960-1969
- 61970-1979
- 41980-1989
- 21990-1999
FCC Registered Broadcast Land Mobile Towers: 18 (See the full list of FCC Registered Broadcast Land Mobile Towers in Yorba Linda, CA)
FCC Registered Microwave Towers: 18 (See the full list of FCC Registered Microwave Towers in this town)
FCC Registered Amateur Radio Licenses: 682 (See the full list of FCC Registered Amateur Radio Licenses in Yorba Linda)
FAA Registered Aircraft Manufacturers and Dealers: 8 (See the full list of FAA Registered Manufacturers and Dealers in Yorba Linda)
FAA Registered Aircraft: 74 (See the full list of FAA Registered Aircraft)
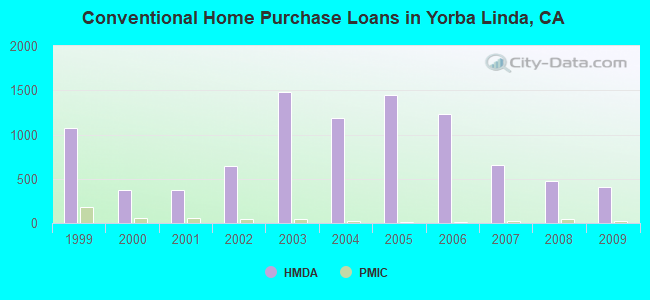
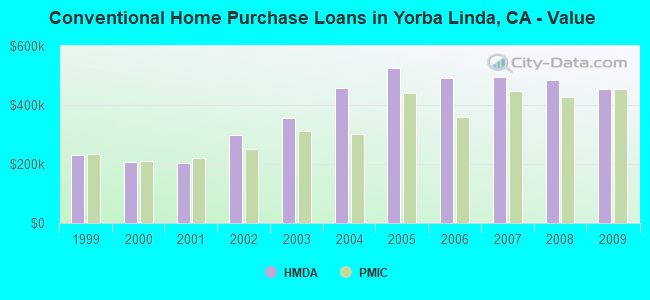
| Home Mortgage Disclosure Act Aggregated Statistics For Year 2009 (Based on 6 full and 13 partial tracts) | ||||||||||||||
| A) FHA, FSA/RHS & VA Home Purchase Loans | B) Conventional Home Purchase Loans | C) Refinancings | D) Home Improvement Loans | E) Loans on Dwellings For 5+ Families | F) Non-occupant Loans on < 5 Family Dwellings (A B C & D) | G) Loans On Manufactured Home Dwelling (A B C & D) | ||||||||
|---|---|---|---|---|---|---|---|---|---|---|---|---|---|---|
| Number | Average Value | Number | Average Value | Number | Average Value | Number | Average Value | Number | Average Value | Number | Average Value | Number | Average Value | |
| LOANS ORIGINATED | 139 | $425,958 | 408 | $453,931 | 1,982 | $361,755 | 102 | $259,817 | 1 | $4,847,000 | 80 | $280,022 | 2 | $259,085 |
| APPLICATIONS APPROVED, NOT ACCEPTED | 10 | $408,990 | 74 | $454,089 | 183 | $406,530 | 18 | $102,962 | 0 | $0 | 11 | $256,752 | 0 | $0 |
| APPLICATIONS DENIED | 25 | $427,788 | 83 | $512,969 | 479 | $442,417 | 22 | $129,182 | 0 | $0 | 26 | $325,983 | 0 | $0 |
| APPLICATIONS WITHDRAWN | 27 | $454,870 | 80 | $469,877 | 339 | $427,466 | 28 | $327,952 | 0 | $0 | 14 | $275,213 | 1 | $287,710 |
| FILES CLOSED FOR INCOMPLETENESS | 5 | $495,484 | 22 | $477,947 | 119 | $420,417 | 3 | $403,887 | 0 | $0 | 9 | $307,697 | 0 | $0 |
Detailed mortgage data for all 18 tracts in Yorba Linda, CA
| Private Mortgage Insurance Companies Aggregated Statistics For Year 2009 (Based on 6 full and 13 partial tracts) | ||||
| A) Conventional Home Purchase Loans | B) Refinancings | |||
|---|---|---|---|---|
| Number | Average Value | Number | Average Value | |
| LOANS ORIGINATED | 19 | $455,099 | 11 | $414,716 |
| APPLICATIONS APPROVED, NOT ACCEPTED | 10 | $486,098 | 4 | $477,105 |
| APPLICATIONS DENIED | 6 | $470,527 | 1 | $340,650 |
| APPLICATIONS WITHDRAWN | 0 | $0 | 0 | $0 |
| FILES CLOSED FOR INCOMPLETENESS | 1 | $277,580 | 0 | $0 |
2005 - 2018 National Fire Incident Reporting System (NFIRS) incidents
- Fire incident types reported to NFIRS in Yorba Linda, CA
- 42241.2%Structure Fires
- 33032.2%Outside Fires
- 20019.5%Mobile Property/Vehicle Fires
- 727.0%Other
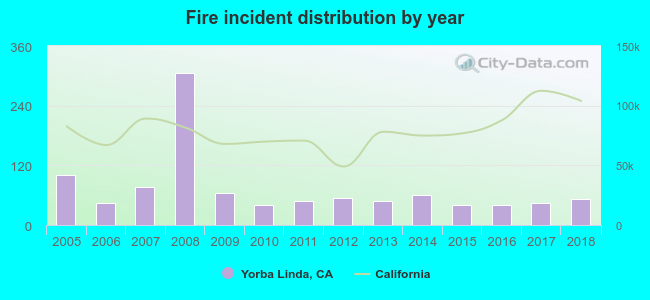 Based on the data from the years 2005 - 2018 the average number of fire incidents per year is 73. The highest number of fires - 305 took place in 2008, and the least - 40 in 2015. The data has a dropping trend.
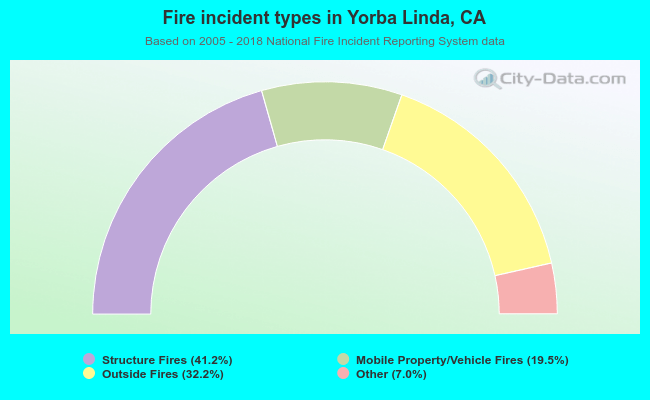 When looking into fire subcategories, the most incidents belonged to: Structure Fires (41.2%), and Outside Fires (32.2%).
Fire-safe hotels and motels in Yorba Linda, California:
- Extended Stay America - Orange County - Yorba Linda, 22711 Oakcrest Cir, Yorba Linda, California 92887 , Phone: (714) 998-9060, Fax: (714) 998-9450
- Ayres Suites Yorba Linda, 22677 Oakcrest Cir, Yorba Linda, California 92887 , Phone: (714) 921-8688, Fax: (714) 283-3927
| Most common first names in Yorba Linda, CA among deceased individuals | ||
| Name | Count | Lived (average) |
|---|---|---|
| Robert | 84 | 74.2 years |
| Mary | 80 | 82.7 years |
| John | 62 | 79.0 years |
| William | 57 | 78.7 years |
| James | 56 | 75.9 years |
| Helen | 52 | 87.0 years |
| Dorothy | 50 | 83.0 years |
| George | 41 | 80.6 years |
| Margaret | 35 | 80.3 years |
| Joseph | 32 | 80.2 years |
| Most common last names in Yorba Linda, CA among deceased individuals | ||
| Last name | Count | Lived (average) |
|---|---|---|
| Smith | 20 | 80.1 years |
| Johnson | 18 | 82.1 years |
| Miller | 16 | 83.7 years |
| Jones | 14 | 86.0 years |
| Brown | 11 | 81.2 years |
| Taylor | 11 | 74.2 years |
| Anderson | 11 | 79.1 years |
| Davis | 10 | 85.0 years |
| Wilson | 10 | 83.1 years |
| Garcia | 9 | 80.2 years |
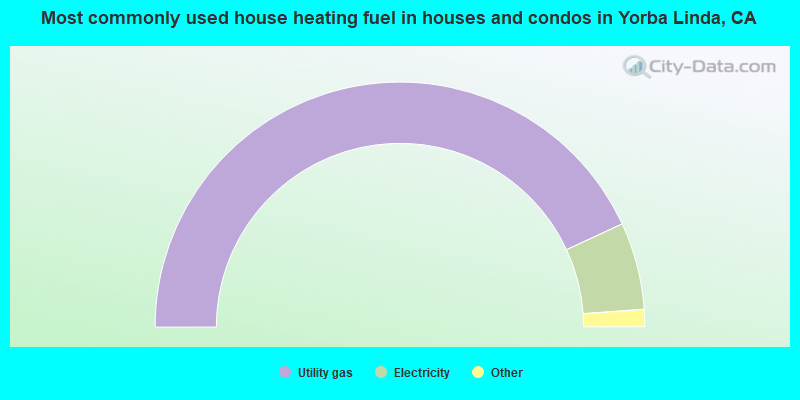
- 86.2%Utility gas
- 11.5%Electricity
- 1.0%Solar energy
- 0.7%Bottled, tank, or LP gas
- 0.4%Wood
- 0.2%No fuel used

- 71.4%Utility gas
- 22.8%Electricity
- 3.6%No fuel used
- 2.0%Bottled, tank, or LP gas
- 0.2%Solar energy
Yorba Linda compared to California state average:
- Median household income above state average.
- Median house value above state average.
- Unemployed percentage significantly below state average.
- Black race population percentage significantly below state average.
- Hispanic race population percentage below state average.
- Median age significantly above state average.
- Renting percentage significantly below state average.
- Number of rooms per house above state average.
- House age below state average.
- Percentage of population with a bachelor's degree or higher significantly above state average.
Yorba Linda on our top lists:
- #5 on the list of "Top 101 cities with largest percentage of females in industries: wholesale trade (population 50,000+)"
- #9 on the list of "Top 101 cities with largest percentage of females in industries: real estate and rental and leasing (population 50,000+)"
- #10 on the list of "Top 101 cities with largest percentage of males in occupations: management occupations (population 50,000+)"
- #10 on the list of "Top 101 cities with the most residents born in Other South Eastern Asia (population 500+)"
- #13 on the list of "Top 101 cities with the lowest number of thefts per 100,000 residents (population 50,000+)"
- #14 on the list of "Top 100 safest cities (lowest city-data.com crime index) (pop. 50,000+)"
- #16 on the list of "Top 101 cities with the smallest percentage of unmarried partner households (population 50,000+)"
- #16 on the list of "Top 101 cities with the lowest city-data.com crime index (population 50,000+)"
- #17 on the list of "Top 101 cities with the least people below the poverty level (population 50,000+)"
- #19 on the list of "Top 101 cities with largest percentage of males in occupations: business and financial operations occupations (population 50,000+)"
- #20 on the list of "Top 101 cities with the most cars per house, population 50,000+"
- #21 on the list of "Top 101 cities with largest percentage of males in occupations: sales and related occupations (population 50,000+)"
- #24 on the list of "Top 101 cities with largest percentage of females in occupations: management occupations (population 50,000+)"
- #30 on the list of "Top 101 cities with the lowest number of auto thefts per 100,000 residents (population 50,000+)"
- #30 on the list of "Top 101 cities with the lowest average snowfall in a year (population 50,000+)"
- #30 on the list of "Top 100 cities with highest median household income (pop. 50,000+)"
- #30 on the list of "Top 100 cities with highest median house value (pop. 50,000+)"
- #32 on the list of "Top 101 cities with the lowest number of rapes per 100,000 residents (population 50,000+)"
- #34 on the list of "Top 101 cities with the least people below 50% of the poverty level (population 50,000+)"
- #35 on the list of "Top 101 cities with the largest racial income disparity between any two races with at least 200 householders"
- #4 on the list of "Top 101 counties with the highest total withdrawal of fresh water for public supply"
- #5 on the list of "Top 101 counties with the most Catholic adherents"
- #6 on the list of "Top 101 counties with the highest ground withdrawal of fresh water for public supply"
- #7 on the list of "Top 101 counties with the most Evangelical Protestant adherents"
- #8 on the list of "Top 101 counties with the highest Particulate Matter (PM2.5) Annual air pollution readings in 2012 (µg/m3)"

|
|
Total of 1192 patent applications in 2008-2024.