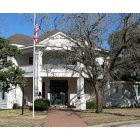
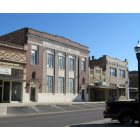
Yoakum, Texas Submit your own pictures of this city and show them to the world
OSM Map
General Map
Google Map
MSN Map
OSM Map
General Map
Google Map
MSN Map
OSM Map
General Map
Google Map
MSN Map
OSM Map
General Map
Google Map
MSN Map
Please wait while loading the map...
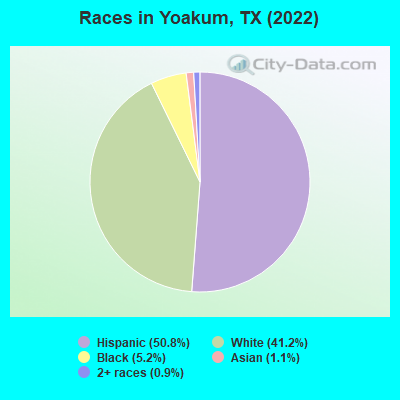
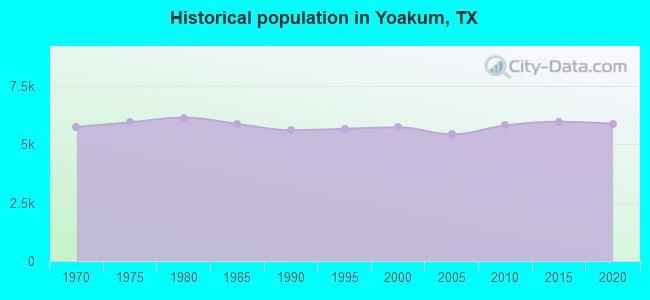
Population in 2022: 5,891 (95% urban, 5% rural). Population change since 2000: +2.8%Males: 2,923 Females: 2,968
March 2022 cost of living index in Yoakum: 79.7 (low, U.S. average is 100) Percentage of residents living in poverty in 2022: 14.2%for White Non-Hispanic residents , 13.4% for Black residents , 17.2% for Hispanic or Latino residents , 17.1% for other race residents , 5.3% for two or more races residents )Business Search - 14 Million verified businesses
Data:
Median household income ($)
Median household income (% change since 2000)
Household income diversity
Ratio of average income to average house value (%)
Ratio of average income to average rent
Median household income ($) - White
Median household income ($) - Black or African American
Median household income ($) - Asian
Median household income ($) - Hispanic or Latino
Median household income ($) - American Indian and Alaska Native
Median household income ($) - Multirace
Median household income ($) - Other Race
Median household income for houses/condos with a mortgage ($)
Median household income for apartments without a mortgage ($)
Races - White alone (%)
Races - White alone (% change since 2000)
Races - Black alone (%)
Races - Black alone (% change since 2000)
Races - American Indian alone (%)
Races - American Indian alone (% change since 2000)
Races - Asian alone (%)
Races - Asian alone (% change since 2000)
Races - Hispanic (%)
Races - Hispanic (% change since 2000)
Races - Native Hawaiian and Other Pacific Islander alone (%)
Races - Native Hawaiian and Other Pacific Islander alone (% change since 2000)
Races - Two or more races (%)
Races - Two or more races (% change since 2000)
Races - Other race alone (%)
Races - Other race alone (% change since 2000)
Racial diversity
Unemployment (%)
Unemployment (% change since 2000)
Unemployment (%) - White
Unemployment (%) - Black or African American
Unemployment (%) - Asian
Unemployment (%) - Hispanic or Latino
Unemployment (%) - American Indian and Alaska Native
Unemployment (%) - Multirace
Unemployment (%) - Other Race
Population density (people per square mile)
Population - Males (%)
Population - Females (%)
Population - Males (%) - White
Population - Males (%) - Black or African American
Population - Males (%) - Asian
Population - Males (%) - Hispanic or Latino
Population - Males (%) - American Indian and Alaska Native
Population - Males (%) - Multirace
Population - Males (%) - Other Race
Population - Females (%) - White
Population - Females (%) - Black or African American
Population - Females (%) - Asian
Population - Females (%) - Hispanic or Latino
Population - Females (%) - American Indian and Alaska Native
Population - Females (%) - Multirace
Population - Females (%) - Other Race
Coronavirus confirmed cases (May 09, 2024)
Deaths caused by coronavirus (May 09, 2024)
Coronavirus confirmed cases (per 100k population) (May 09, 2024)
Deaths caused by coronavirus (per 100k population) (May 09, 2024)
Daily increase in number of cases (May 09, 2024)
Weekly increase in number of cases (May 09, 2024)
Cases doubled (in days) (May 09, 2024)
Hospitalized patients (Apr 18, 2022)
Negative test results (Apr 18, 2022)
Total test results (Apr 18, 2022)
COVID Vaccine doses distributed (per 100k population) (Sep 19, 2023)
COVID Vaccine doses administered (per 100k population) (Sep 19, 2023)
COVID Vaccine doses distributed (Sep 19, 2023)
COVID Vaccine doses administered (Sep 19, 2023)
Likely homosexual households (%)
Likely homosexual households (% change since 2000)
Likely homosexual households - Lesbian couples (%)
Likely homosexual households - Lesbian couples (% change since 2000)
Likely homosexual households - Gay men (%)
Likely homosexual households - Gay men (% change since 2000)
Cost of living index
Median gross rent ($)
Median contract rent ($)
Median monthly housing costs ($)
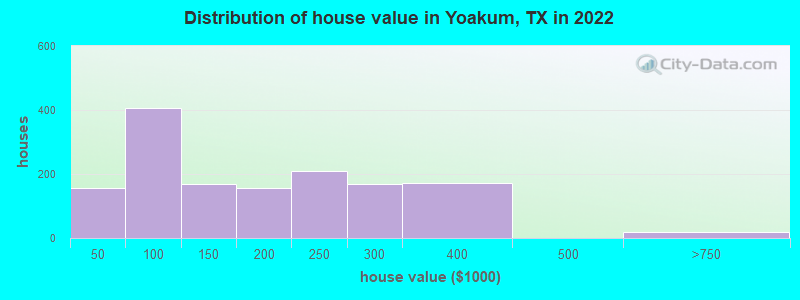
Median house or condo value ($)
Median house or condo value ($ change since 2000)
Mean house or condo value by units in structure - 1, detached ($)
Mean house or condo value by units in structure - 1, attached ($)
Mean house or condo value by units in structure - 2 ($)
Mean house or condo value by units in structure by units in structure - 3 or 4 ($)
Mean house or condo value by units in structure - 5 or more ($)
Mean house or condo value by units in structure - Boat, RV, van, etc. ($)
Mean house or condo value by units in structure - Mobile home ($)
Median house or condo value ($) - White
Median house or condo value ($) - Black or African American
Median house or condo value ($) - Asian
Median house or condo value ($) - Hispanic or Latino
Median house or condo value ($) - American Indian and Alaska Native
Median house or condo value ($) - Multirace
Median house or condo value ($) - Other Race
Median resident age
Resident age diversity
Median resident age - Males
Median resident age - Females
Median resident age - White
Median resident age - Black or African American
Median resident age - Asian
Median resident age - Hispanic or Latino
Median resident age - American Indian and Alaska Native
Median resident age - Multirace
Median resident age - Other Race
Median resident age - Males - White
Median resident age - Males - Black or African American
Median resident age - Males - Asian
Median resident age - Males - Hispanic or Latino
Median resident age - Males - American Indian and Alaska Native
Median resident age - Males - Multirace
Median resident age - Males - Other Race
Median resident age - Females - White
Median resident age - Females - Black or African American
Median resident age - Females - Asian
Median resident age - Females - Hispanic or Latino
Median resident age - Females - American Indian and Alaska Native
Median resident age - Females - Multirace
Median resident age - Females - Other Race
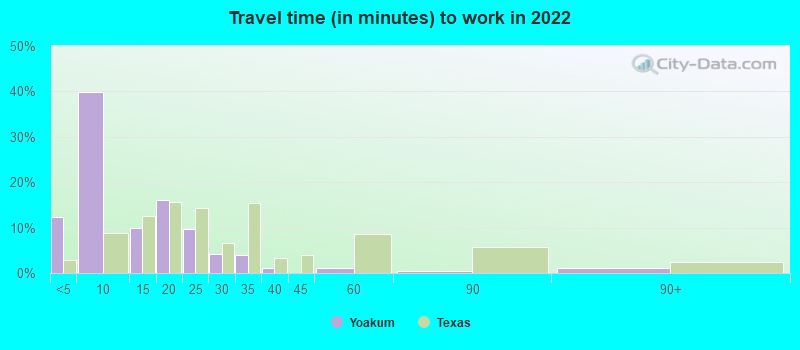
Commute - mean travel time to work (minutes)
Travel time to work - Less than 5 minutes (%)
Travel time to work - Less than 5 minutes (% change since 2000)
Travel time to work - 5 to 9 minutes (%)
Travel time to work - 5 to 9 minutes (% change since 2000)
Travel time to work - 10 to 19 minutes (%)
Travel time to work - 10 to 19 minutes (% change since 2000)
Travel time to work - 20 to 29 minutes (%)
Travel time to work - 20 to 29 minutes (% change since 2000)
Travel time to work - 30 to 39 minutes (%)
Travel time to work - 30 to 39 minutes (% change since 2000)
Travel time to work - 40 to 59 minutes (%)
Travel time to work - 40 to 59 minutes (% change since 2000)
Travel time to work - 60 to 89 minutes (%)
Travel time to work - 60 to 89 minutes (% change since 2000)
Travel time to work - 90 or more minutes (%)
Travel time to work - 90 or more minutes (% change since 2000)
Marital status - Never married (%)
Marital status - Now married (%)
Marital status - Separated (%)
Marital status - Widowed (%)
Marital status - Divorced (%)
Median family income ($)
Median family income (% change since 2000)
Median non-family income ($)
Median non-family income (% change since 2000)
Median per capita income ($)
Median per capita income (% change since 2000)
Median family income ($) - White
Median family income ($) - Black or African American
Median family income ($) - Asian
Median family income ($) - Hispanic or Latino
Median family income ($) - American Indian and Alaska Native
Median family income ($) - Multirace
Median family income ($) - Other Race
Median year house/condo built
Median year apartment built
Year house built - Built 2005 or later (%)
Year house built - Built 2000 to 2004 (%)
Year house built - Built 1990 to 1999 (%)
Year house built - Built 1980 to 1989 (%)
Year house built - Built 1970 to 1979 (%)
Year house built - Built 1960 to 1969 (%)
Year house built - Built 1950 to 1959 (%)
Year house built - Built 1940 to 1949 (%)
Year house built - Built 1939 or earlier (%)
Average household size
Household density (households per square mile)
Average household size - White
Average household size - Black or African American
Average household size - Asian
Average household size - Hispanic or Latino
Average household size - American Indian and Alaska Native
Average household size - Multirace
Average household size - Other Race
Occupied housing units (%)
Vacant housing units (%)
Owner occupied housing units (%)
Renter occupied housing units (%)
Vacancy status - For rent (%)
Vacancy status - For sale only (%)
Vacancy status - Rented or sold, not occupied (%)
Vacancy status - For seasonal, recreational, or occasional use (%)
Vacancy status - For migrant workers (%)
Vacancy status - Other vacant (%)
Residents with income below the poverty level (%)
Residents with income below 50% of the poverty level (%)
Children below poverty level (%)
Poor families by family type - Married-couple family (%)
Poor families by family type - Male, no wife present (%)
Poor families by family type - Female, no husband present (%)
Poverty status for native-born residents (%)
Poverty status for foreign-born residents (%)
Poverty among high school graduates not in families (%)
Poverty among people who did not graduate high school not in families (%)
Residents with income below the poverty level (%) - White
Residents with income below the poverty level (%) - Black or African American
Residents with income below the poverty level (%) - Asian
Residents with income below the poverty level (%) - Hispanic or Latino
Residents with income below the poverty level (%) - American Indian and Alaska Native
Residents with income below the poverty level (%) - Multirace
Residents with income below the poverty level (%) - Other Race
Air pollution - Air Quality Index (AQI)
Air pollution - CO
Air pollution - NO2
Air pollution - SO2
Air pollution - Ozone
Air pollution - PM10
Air pollution - PM25
Air pollution - Pb
Crime - Murders per 100,000 population
Crime - Rapes per 100,000 population
Crime - Robberies per 100,000 population
Crime - Assaults per 100,000 population
Crime - Burglaries per 100,000 population
Crime - Thefts per 100,000 population
Crime - Auto thefts per 100,000 population
Crime - Arson per 100,000 population
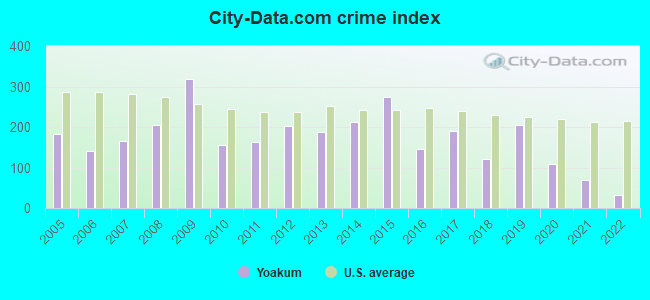
Crime - City-data.com crime index
Crime - Violent crime index
Crime - Property crime index
Crime - Murders per 100,000 population (5 year average)
Crime - Rapes per 100,000 population (5 year average)
Crime - Robberies per 100,000 population (5 year average)
Crime - Assaults per 100,000 population (5 year average)
Crime - Burglaries per 100,000 population (5 year average)
Crime - Thefts per 100,000 population (5 year average)
Crime - Auto thefts per 100,000 population (5 year average)
Crime - Arson per 100,000 population (5 year average)
Crime - City-data.com crime index (5 year average)
Crime - Violent crime index (5 year average)
Crime - Property crime index (5 year average)
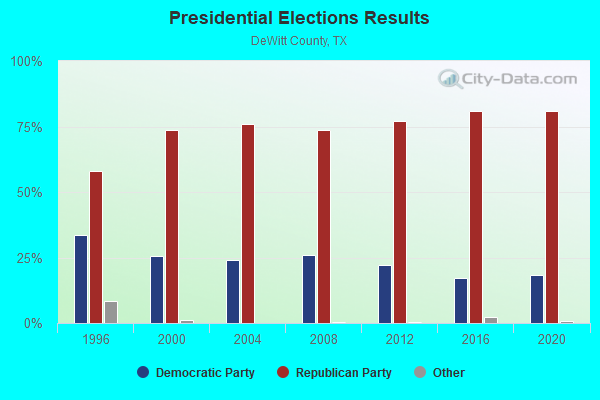
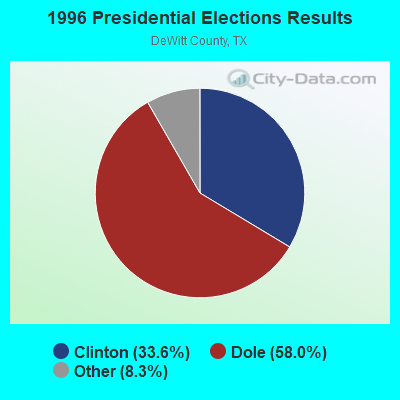
1996 Presidential Elections Results (%) - Democratic Party (Clinton)
1996 Presidential Elections Results (%) - Republican Party (Dole)
1996 Presidential Elections Results (%) - Other
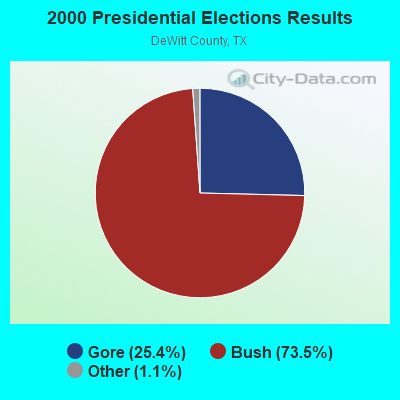
2000 Presidential Elections Results (%) - Democratic Party (Gore)
2000 Presidential Elections Results (%) - Republican Party (Bush)
2000 Presidential Elections Results (%) - Other
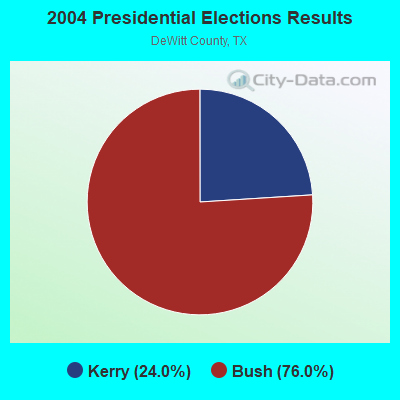
2004 Presidential Elections Results (%) - Democratic Party (Kerry)
2004 Presidential Elections Results (%) - Republican Party (Bush)
2004 Presidential Elections Results (%) - Other
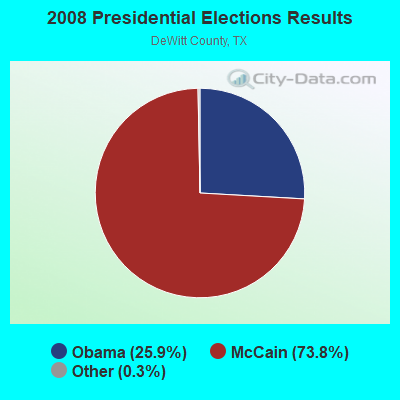
2008 Presidential Elections Results (%) - Democratic Party (Obama)
2008 Presidential Elections Results (%) - Republican Party (McCain)
2008 Presidential Elections Results (%) - Other
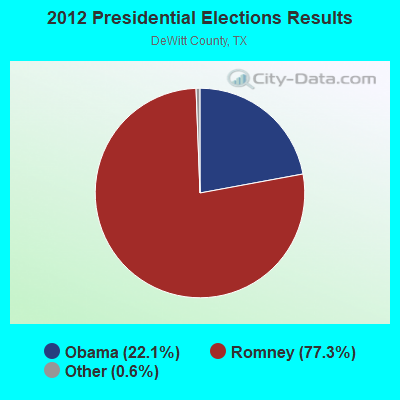
2012 Presidential Elections Results (%) - Democratic Party (Obama)
2012 Presidential Elections Results (%) - Republican Party (Romney)
2012 Presidential Elections Results (%) - Other
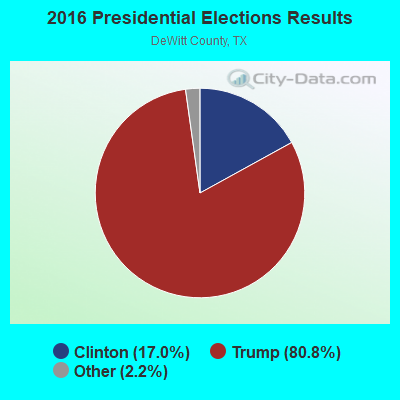
2016 Presidential Elections Results (%) - Democratic Party (Clinton)
2016 Presidential Elections Results (%) - Republican Party (Trump)
2016 Presidential Elections Results (%) - Other
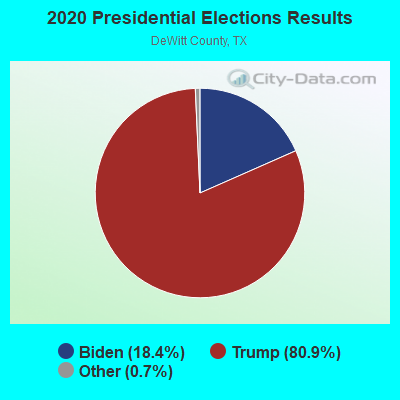
2020 Presidential Elections Results (%) - Democratic Party (Biden)
2020 Presidential Elections Results (%) - Republican Party (Trump)
2020 Presidential Elections Results (%) - Other
Ancestries Reported - Arab (%)
Ancestries Reported - Czech (%)
Ancestries Reported - Danish (%)
Ancestries Reported - Dutch (%)
Ancestries Reported - English (%)
Ancestries Reported - French (%)
Ancestries Reported - French Canadian (%)
Ancestries Reported - German (%)
Ancestries Reported - Greek (%)
Ancestries Reported - Hungarian (%)
Ancestries Reported - Irish (%)
Ancestries Reported - Italian (%)
Ancestries Reported - Lithuanian (%)
Ancestries Reported - Norwegian (%)
Ancestries Reported - Polish (%)
Ancestries Reported - Portuguese (%)
Ancestries Reported - Russian (%)
Ancestries Reported - Scotch-Irish (%)
Ancestries Reported - Scottish (%)
Ancestries Reported - Slovak (%)
Ancestries Reported - Subsaharan African (%)
Ancestries Reported - Swedish (%)
Ancestries Reported - Swiss (%)
Ancestries Reported - Ukrainian (%)
Ancestries Reported - United States (%)
Ancestries Reported - Welsh (%)
Ancestries Reported - West Indian (%)
Ancestries Reported - Other (%)
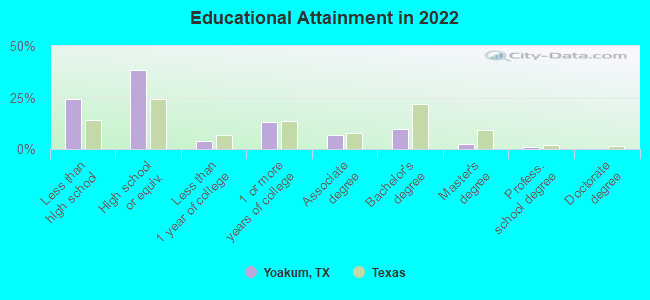
Educational Attainment - No schooling completed (%)
Educational Attainment - Less than high school (%)
Educational Attainment - High school or equivalent (%)
Educational Attainment - Less than 1 year of college (%)
Educational Attainment - 1 or more years of college (%)
Educational Attainment - Associate degree (%)
Educational Attainment - Bachelor's degree (%)
Educational Attainment - Master's degree (%)
Educational Attainment - Professional school degree (%)
Educational Attainment - Doctorate degree (%)
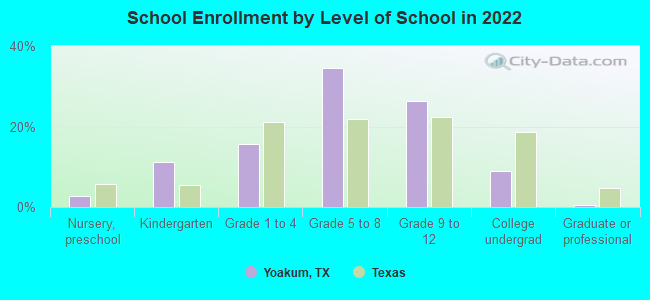
School Enrollment - Nursery, preschool (%)
School Enrollment - Kindergarten (%)
School Enrollment - Grade 1 to 4 (%)
School Enrollment - Grade 5 to 8 (%)
School Enrollment - Grade 9 to 12 (%)
School Enrollment - College undergrad (%)
School Enrollment - Graduate or professional (%)
School Enrollment - Not enrolled in school (%)
School enrollment - Public schools (%)
School enrollment - Private schools (%)
School enrollment - Not enrolled (%)
Median number of rooms in houses and condos
Median number of rooms in apartments
Housing units lacking complete plumbing facilities (%)
Housing units lacking complete kitchen facilities (%)
Density of houses
Urban houses (%)
Rural houses (%)
Households with people 60 years and over (%)
Households with people 65 years and over (%)
Households with people 75 years and over (%)
Households with one or more nonrelatives (%)
Households with no nonrelatives (%)
Population in households (%)
Family households (%)
Nonfamily households (%)
Population in families (%)
Family households with own children (%)
Median number of bedrooms in owner occupied houses
Mean number of bedrooms in owner occupied houses
Median number of bedrooms in renter occupied houses
Mean number of bedrooms in renter occupied houses
Median number of vehichles in owner occupied houses
Mean number of vehichles in owner occupied houses
Median number of vehichles in renter occupied houses
Mean number of vehichles in renter occupied houses
Mortgage status - with mortgage (%)
Mortgage status - with second mortgage (%)
Mortgage status - with home equity loan (%)
Mortgage status - with both second mortgage and home equity loan (%)
Mortgage status - without a mortgage (%)
Average family size
Average family size - White
Average family size - Black or African American
Average family size - Asian
Average family size - Hispanic or Latino
Average family size - American Indian and Alaska Native
Average family size - Multirace
Average family size - Other Race
Geographical mobility - Same house 1 year ago (%)
Geographical mobility - Moved within same county (%)
Geographical mobility - Moved from different county within same state (%)
Geographical mobility - Moved from different state (%)
Geographical mobility - Moved from abroad (%)
Place of birth - Born in state of residence (%)
Place of birth - Born in other state (%)
Place of birth - Native, outside of US (%)
Place of birth - Foreign born (%)
Housing units in structures - 1, detached (%)
Housing units in structures - 1, attached (%)
Housing units in structures - 2 (%)
Housing units in structures - 3 or 4 (%)
Housing units in structures - 5 to 9 (%)
Housing units in structures - 10 to 19 (%)
Housing units in structures - 20 to 49 (%)
Housing units in structures - 50 or more (%)
Housing units in structures - Mobile home (%)
Housing units in structures - Boat, RV, van, etc. (%)
House/condo owner moved in on average (years ago)
Renter moved in on average (years ago)
Year householder moved into unit - Moved in 1999 to March 2000 (%)
Year householder moved into unit - Moved in 1995 to 1998 (%)
Year householder moved into unit - Moved in 1990 to 1994 (%)
Year householder moved into unit - Moved in 1980 to 1989 (%)
Year householder moved into unit - Moved in 1970 to 1979 (%)
Year householder moved into unit - Moved in 1969 or earlier (%)
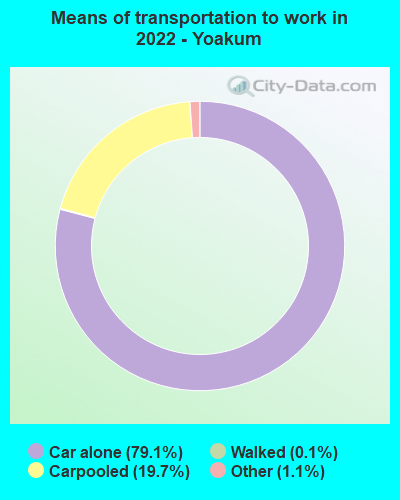
Means of transportation to work - Drove car alone (%)
Means of transportation to work - Carpooled (%)
Means of transportation to work - Public transportation (%)
Means of transportation to work - Bus or trolley bus (%)
Means of transportation to work - Streetcar or trolley car (%)
Means of transportation to work - Subway or elevated (%)
Means of transportation to work - Railroad (%)
Means of transportation to work - Ferryboat (%)
Means of transportation to work - Taxicab (%)
Means of transportation to work - Motorcycle (%)
Means of transportation to work - Bicycle (%)
Means of transportation to work - Walked (%)
Means of transportation to work - Other means (%)
Working at home (%)
Industry diversity
Most Common Industries - Agriculture, forestry, fishing and hunting, and mining (%)
Most Common Industries - Agriculture, forestry, fishing and hunting (%)
Most Common Industries - Mining, quarrying, and oil and gas extraction (%)
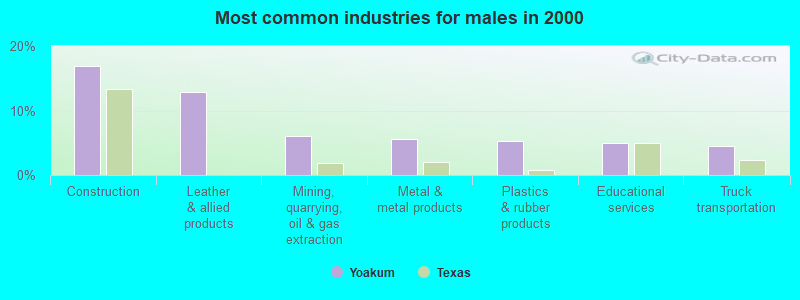
Most Common Industries - Construction (%)
Most Common Industries - Manufacturing (%)
Most Common Industries - Wholesale trade (%)
Most Common Industries - Retail trade (%)
Most Common Industries - Transportation and warehousing, and utilities (%)
Most Common Industries - Transportation and warehousing (%)
Most Common Industries - Utilities (%)
Most Common Industries - Information (%)
Most Common Industries - Finance and insurance, and real estate and rental and leasing (%)
Most Common Industries - Finance and insurance (%)
Most Common Industries - Real estate and rental and leasing (%)
Most Common Industries - Professional, scientific, and management, and administrative and waste management services (%)
Most Common Industries - Professional, scientific, and technical services (%)
Most Common Industries - Management of companies and enterprises (%)
Most Common Industries - Administrative and support and waste management services (%)
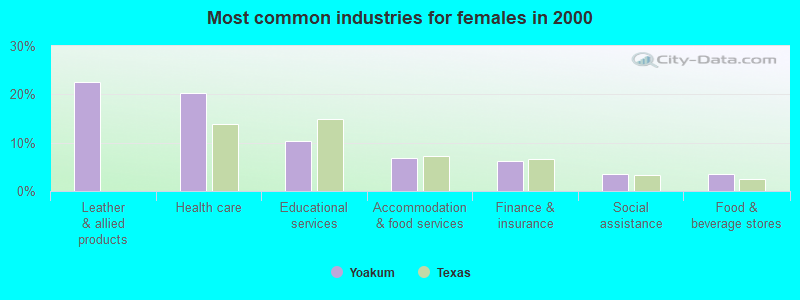
Most Common Industries - Educational services, and health care and social assistance (%)
Most Common Industries - Educational services (%)
Most Common Industries - Health care and social assistance (%)
Most Common Industries - Arts, entertainment, and recreation, and accommodation and food services (%)
Most Common Industries - Arts, entertainment, and recreation (%)
Most Common Industries - Accommodation and food services (%)
Most Common Industries - Other services, except public administration (%)
Most Common Industries - Public administration (%)
Occupation diversity
Most Common Occupations - Management, business, science, and arts occupations (%)
Most Common Occupations - Management, business, and financial occupations (%)
Most Common Occupations - Management occupations (%)
Most Common Occupations - Business and financial operations occupations (%)
Most Common Occupations - Computer, engineering, and science occupations (%)
Most Common Occupations - Computer and mathematical occupations (%)
Most Common Occupations - Architecture and engineering occupations (%)
Most Common Occupations - Life, physical, and social science occupations (%)
Most Common Occupations - Education, legal, community service, arts, and media occupations (%)
Most Common Occupations - Community and social service occupations (%)
Most Common Occupations - Legal occupations (%)
Most Common Occupations - Education, training, and library occupations (%)
Most Common Occupations - Arts, design, entertainment, sports, and media occupations (%)
Most Common Occupations - Healthcare practitioners and technical occupations (%)
Most Common Occupations - Health diagnosing and treating practitioners and other technical occupations (%)
Most Common Occupations - Health technologists and technicians (%)
Most Common Occupations - Service occupations (%)
Most Common Occupations - Healthcare support occupations (%)
Most Common Occupations - Protective service occupations (%)
Most Common Occupations - Fire fighting and prevention, and other protective service workers including supervisors (%)
Most Common Occupations - Law enforcement workers including supervisors (%)
Most Common Occupations - Food preparation and serving related occupations (%)
Most Common Occupations - Building and grounds cleaning and maintenance occupations (%)
Most Common Occupations - Personal care and service occupations (%)
Most Common Occupations - Sales and office occupations (%)
Most Common Occupations - Sales and related occupations (%)
Most Common Occupations - Office and administrative support occupations (%)
Most Common Occupations - Natural resources, construction, and maintenance occupations (%)
Most Common Occupations - Farming, fishing, and forestry occupations (%)
Most Common Occupations - Construction and extraction occupations (%)
Most Common Occupations - Installation, maintenance, and repair occupations (%)
Most Common Occupations - Production, transportation, and material moving occupations (%)
Most Common Occupations - Production occupations (%)
Most Common Occupations - Transportation occupations (%)
Most Common Occupations - Material moving occupations (%)
People in Group quarters - Institutionalized population (%)
People in Group quarters - Correctional institutions (%)
People in Group quarters - Federal prisons and detention centers (%)
People in Group quarters - Halfway houses (%)
People in Group quarters - Local jails and other confinement facilities (including police lockups) (%)
People in Group quarters - Military disciplinary barracks (%)
People in Group quarters - State prisons (%)
People in Group quarters - Other types of correctional institutions (%)
People in Group quarters - Nursing homes (%)
People in Group quarters - Hospitals/wards, hospices, and schools for the handicapped (%)
People in Group quarters - Hospitals/wards and hospices for chronically ill (%)
People in Group quarters - Hospices or homes for chronically ill (%)
People in Group quarters - Military hospitals or wards for chronically ill (%)
People in Group quarters - Other hospitals or wards for chronically ill (%)
People in Group quarters - Hospitals or wards for drug/alcohol abuse (%)
People in Group quarters - Mental (Psychiatric) hospitals or wards (%)
People in Group quarters - Schools, hospitals, or wards for the mentally retarded (%)
People in Group quarters - Schools, hospitals, or wards for the physically handicapped (%)
People in Group quarters - Institutions for the deaf (%)
People in Group quarters - Institutions for the blind (%)
People in Group quarters - Orthopedic wards and institutions for the physically handicapped (%)
People in Group quarters - Wards in general hospitals for patients who have no usual home elsewhere (%)
People in Group quarters - Wards in military hospitals for patients who have no usual home elsewhere (%)
People in Group quarters - Juvenile institutions (%)
People in Group quarters - Long-term care (%)
People in Group quarters - Homes for abused, dependent, and neglected children (%)
People in Group quarters - Residential treatment centers for emotionally disturbed children (%)
People in Group quarters - Training schools for juvenile delinquents (%)
People in Group quarters - Short-term care, detention or diagnostic centers for delinquent children (%)
People in Group quarters - Type of juvenile institution unknown (%)
People in Group quarters - Noninstitutionalized population (%)
People in Group quarters - College dormitories (includes college quarters off campus) (%)
People in Group quarters - Military quarters (%)
People in Group quarters - On base (%)
People in Group quarters - Barracks, unaccompanied personnel housing (UPH), (Enlisted/Officer), ;and similar group living quarters for military personnel (%)
People in Group quarters - Transient quarters for temporary residents (%)
People in Group quarters - Military ships (%)
People in Group quarters - Group homes (%)
People in Group quarters - Homes or halfway houses for drug/alcohol abuse (%)
People in Group quarters - Homes for the mentally ill (%)
People in Group quarters - Homes for the mentally retarded (%)
People in Group quarters - Homes for the physically handicapped (%)
People in Group quarters - Other group homes (%)
People in Group quarters - Religious group quarters (%)
People in Group quarters - Dormitories (%)
People in Group quarters - Agriculture workers' dormitories on farms (%)
People in Group quarters - Job Corps and vocational training facilities (%)
People in Group quarters - Other workers' dormitories (%)
People in Group quarters - Crews of maritime vessels (%)
People in Group quarters - Other nonhousehold living situations (%)
People in Group quarters - Other noninstitutional group quarters (%)
Residents speaking English at home (%)
Residents speaking English at home - Born in the United States (%)
Residents speaking English at home - Native, born elsewhere (%)
Residents speaking English at home - Foreign born (%)
Residents speaking Spanish at home (%)
Residents speaking Spanish at home - Born in the United States (%)
Residents speaking Spanish at home - Native, born elsewhere (%)
Residents speaking Spanish at home - Foreign born (%)
Residents speaking other language at home (%)
Residents speaking other language at home - Born in the United States (%)
Residents speaking other language at home - Native, born elsewhere (%)
Residents speaking other language at home - Foreign born (%)
Class of Workers - Employee of private company (%)
Class of Workers - Self-employed in own incorporated business (%)
Class of Workers - Private not-for-profit wage and salary workers (%)
Class of Workers - Local government workers (%)
Class of Workers - State government workers (%)
Class of Workers - Federal government workers (%)
Class of Workers - Self-employed workers in own not incorporated business and Unpaid family workers (%)
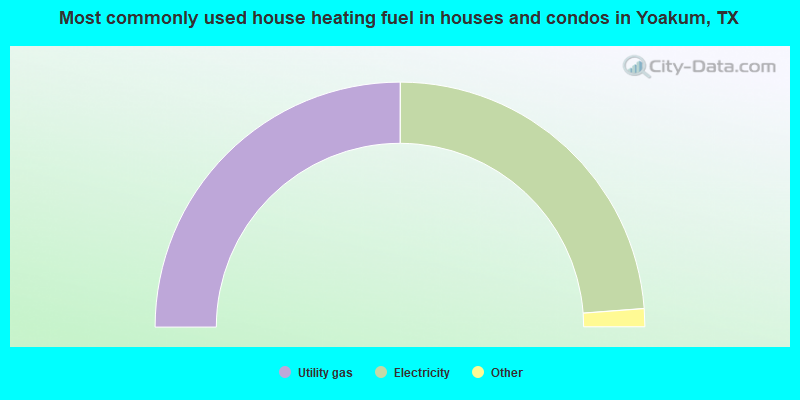
House heating fuel used in houses and condos - Utility gas (%)
House heating fuel used in houses and condos - Bottled, tank, or LP gas (%)
House heating fuel used in houses and condos - Electricity (%)
House heating fuel used in houses and condos - Fuel oil, kerosene, etc. (%)
House heating fuel used in houses and condos - Coal or coke (%)
House heating fuel used in houses and condos - Wood (%)
House heating fuel used in houses and condos - Solar energy (%)
House heating fuel used in houses and condos - Other fuel (%)
House heating fuel used in houses and condos - No fuel used (%)
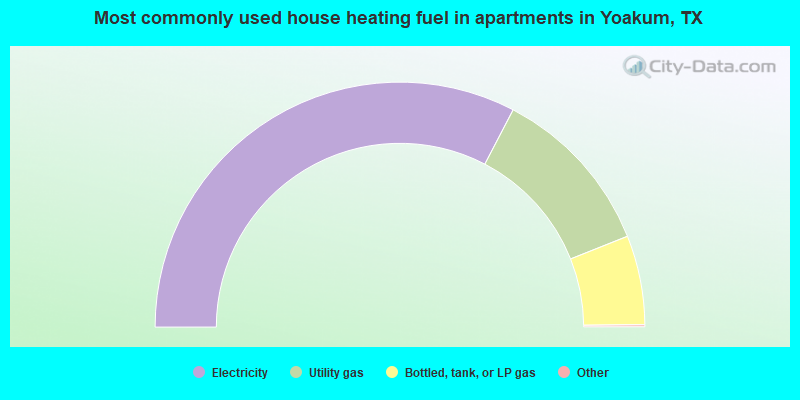
House heating fuel used in apartments - Utility gas (%)
House heating fuel used in apartments - Bottled, tank, or LP gas (%)
House heating fuel used in apartments - Electricity (%)
House heating fuel used in apartments - Fuel oil, kerosene, etc. (%)
House heating fuel used in apartments - Coal or coke (%)
House heating fuel used in apartments - Wood (%)
House heating fuel used in apartments - Solar energy (%)
House heating fuel used in apartments - Other fuel (%)
House heating fuel used in apartments - No fuel used (%)
Armed forces status - In Armed Forces (%)
Armed forces status - Civilian (%)
Armed forces status - Civilian - Veteran (%)
Armed forces status - Civilian - Nonveteran (%)
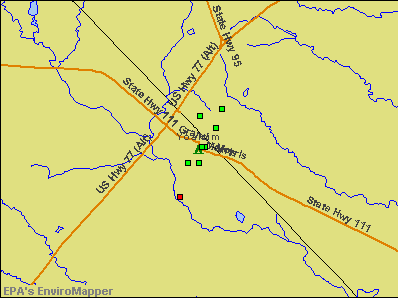
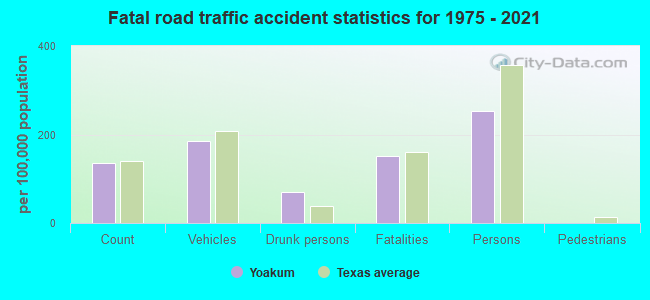
Fatal accidents locations in years 2005-2021
Fatal accidents locations in 2005
Fatal accidents locations in 2006
Fatal accidents locations in 2007
Fatal accidents locations in 2008
Fatal accidents locations in 2009
Fatal accidents locations in 2010
Fatal accidents locations in 2011
Fatal accidents locations in 2012
Fatal accidents locations in 2013
Fatal accidents locations in 2014
Fatal accidents locations in 2015
Fatal accidents locations in 2016
Fatal accidents locations in 2017
Fatal accidents locations in 2018
Fatal accidents locations in 2019
Fatal accidents locations in 2020
Fatal accidents locations in 2021
Alcohol use - People drinking some alcohol every month (%)
Alcohol use - People not drinking at all (%)
Alcohol use - Average days/month drinking alcohol
Alcohol use - Average drinks/week
Alcohol use - Average days/year people drink much
Audiometry - Average condition of hearing (%)
Audiometry - People that can hear a whisper from across a quiet room (%)
Audiometry - People that can hear normal voice from across a quiet room (%)
Audiometry - Ears ringing, roaring, buzzing (%)
Audiometry - Had a job exposure to loud noise (%)
Audiometry - Had off-work exposure to loud noise (%)
Blood Pressure & Cholesterol - Has high blood pressure (%)
Blood Pressure & Cholesterol - Checking blood pressure at home (%)
Blood Pressure & Cholesterol - Frequently checking blood cholesterol (%)
Blood Pressure & Cholesterol - Has high cholesterol level (%)
Consumer Behavior - Money monthly spent on food at supermarket/grocery store
Consumer Behavior - Money monthly spent on food at other stores
Consumer Behavior - Money monthly spent on eating out
Consumer Behavior - Money monthly spent on carryout/delivered foods
Consumer Behavior - Income spent on food at supermarket/grocery store (%)
Consumer Behavior - Income spent on food at other stores (%)
Consumer Behavior - Income spent on eating out (%)
Consumer Behavior - Income spent on carryout/delivered foods (%)
Current Health Status - General health condition (%)
Current Health Status - Blood donors (%)
Current Health Status - Has blood ever tested for HIV virus (%)
Current Health Status - Left-handed people (%)
Dermatology - People using sunscreen (%)
Diabetes - Diabetics (%)
Diabetes - Had a blood test for high blood sugar (%)
Diabetes - People taking insulin (%)
Diet Behavior & Nutrition - Diet health (%)
Diet Behavior & Nutrition - Milk product consumption (# of products/month)
Diet Behavior & Nutrition - Meals not home prepared (#/week)
Diet Behavior & Nutrition - Meals from fast food or pizza place (#/week)
Diet Behavior & Nutrition - Ready-to-eat foods (#/month)
Diet Behavior & Nutrition - Frozen meals/pizza (#/month)
Drug Use - People that ever used marijuana or hashish (%)
Drug Use - Ever used hard drugs (%)
Drug Use - Ever used any form of cocaine (%)
Drug Use - Ever used heroin (%)
Drug Use - Ever used methamphetamine (%)
Health Insurance - People covered by health insurance (%)
Kidney Conditions-Urology - Avg. # of times urinating at night
Medical Conditions - People with asthma (%)
Medical Conditions - People with anemia (%)
Medical Conditions - People with psoriasis (%)
Medical Conditions - People with overweight (%)
Medical Conditions - Elderly people having difficulties in thinking or remembering (%)
Medical Conditions - People who ever received blood transfusion (%)
Medical Conditions - People having trouble seeing even with glass/contacts (%)
Medical Conditions - People with arthritis (%)
Medical Conditions - People with gout (%)
Medical Conditions - People with congestive heart failure (%)
Medical Conditions - People with coronary heart disease (%)
Medical Conditions - People with angina pectoris (%)
Medical Conditions - People who ever had heart attack (%)
Medical Conditions - People who ever had stroke (%)
Medical Conditions - People with emphysema (%)
Medical Conditions - People with thyroid problem (%)
Medical Conditions - People with chronic bronchitis (%)
Medical Conditions - People with any liver condition (%)
Medical Conditions - People who ever had cancer or malignancy (%)
Mental Health - People who have little interest in doing things (%)
Mental Health - People feeling down, depressed, or hopeless (%)
Mental Health - People who have trouble sleeping or sleeping too much (%)
Mental Health - People feeling tired or having little energy (%)
Mental Health - People with poor appetite or overeating (%)
Mental Health - People feeling bad about themself (%)
Mental Health - People who have trouble concentrating on things (%)
Mental Health - People moving or speaking slowly or too fast (%)
Mental Health - People having thoughts they would be better off dead (%)
Oral Health - Average years since last visit a dentist
Oral Health - People embarrassed because of mouth (%)
Oral Health - People with gum disease (%)
Oral Health - General health of teeth and gums (%)
Oral Health - Average days a week using dental floss/device
Oral Health - Average days a week using mouthwash for dental problem
Oral Health - Average number of teeth
Pesticide Use - Households using pesticides to control insects (%)
Pesticide Use - Households using pesticides to kill weeds (%)
Physical Activity - People doing vigorous-intensity work activities (%)
Physical Activity - People doing moderate-intensity work activities (%)
Physical Activity - People walking or bicycling (%)
Physical Activity - People doing vigorous-intensity recreational activities (%)
Physical Activity - People doing moderate-intensity recreational activities (%)
Physical Activity - Average hours a day doing sedentary activities
Physical Activity - Average hours a day watching TV or videos
Physical Activity - Average hours a day using computer
Physical Functioning - People having limitations keeping them from working (%)
Physical Functioning - People limited in amount of work they can do (%)
Physical Functioning - People that need special equipment to walk (%)
Physical Functioning - People experiencing confusion/memory problems (%)
Physical Functioning - People requiring special healthcare equipment (%)
Prescription Medications - Average number of prescription medicines taking
Preventive Aspirin Use - Adults 40+ taking low-dose aspirin (%)
Reproductive Health - Vaginal deliveries (%)
Reproductive Health - Cesarean deliveries (%)
Reproductive Health - Deliveries resulted in a live birth (%)
Reproductive Health - Pregnancies resulted in a delivery (%)
Reproductive Health - Women breastfeeding newborns (%)
Reproductive Health - Women that had a hysterectomy (%)
Reproductive Health - Women that had both ovaries removed (%)
Reproductive Health - Women that have ever taken birth control pills (%)
Reproductive Health - Women taking birth control pills (%)
Reproductive Health - Women that have ever used Depo-Provera or injectables (%)
Reproductive Health - Women that have ever used female hormones (%)
Sexual Behavior - People 18+ that ever had sex (vaginal, anal, or oral) (%)
Sexual Behavior - Males 18+ that ever had vaginal sex with a woman (%)
Sexual Behavior - Males 18+ that ever performed oral sex on a woman (%)
Sexual Behavior - Males 18+ that ever had anal sex with a woman (%)
Sexual Behavior - Males 18+ that ever had any sex with a man (%)
Sexual Behavior - Females 18+ that ever had vaginal sex with a man (%)
Sexual Behavior - Females 18+ that ever performed oral sex on a man (%)
Sexual Behavior - Females 18+ that ever had anal sex with a man (%)
Sexual Behavior - Females 18+ that ever had any kind of sex with a woman (%)
Sexual Behavior - Average age people first had sex
Sexual Behavior - Average number of female sex partners in lifetime (males 18+)
Sexual Behavior - Average number of female vaginal sex partners in lifetime (males 18+)
Sexual Behavior - Average age people first performed oral sex on a woman (18+)
Sexual Behavior - Average number of woman performed oral sex on in lifetime (18+)
Sexual Behavior - Average number of male sex partners in lifetime (males 18+)
Sexual Behavior - Average number of male anal sex partners in lifetime (males 18+)
Sexual Behavior - Average age people first performed oral sex on a man (18+)
Sexual Behavior - Average number of male oral sex partners in lifetime (18+)
Sexual Behavior - People using protection when performing oral sex (%)
Sexual Behavior - Average number of times people have vaginal or anal sex a year
Sexual Behavior - People having sex without condom (%)
Sexual Behavior - Average number of male sex partners in lifetime (females 18+)
Sexual Behavior - Average number of male vaginal sex partners in lifetime (females 18+)
Sexual Behavior - Average number of female sex partners in lifetime (females 18+)
Sexual Behavior - Circumcised males 18+ (%)
Sleep Disorders - Average hours sleeping at night
Sleep Disorders - People that has trouble sleeping (%)
Smoking-Cigarette Use - People smoking cigarettes (%)
Taste & Smell - People 40+ having problems with smell (%)
Taste & Smell - People 40+ having problems with taste (%)
Taste & Smell - People 40+ that ever had wisdom teeth removed (%)
Taste & Smell - People 40+ that ever had tonsils teeth removed (%)
Taste & Smell - People 40+ that ever had a loss of consciousness because of a head injury (%)
Taste & Smell - People 40+ that ever had a broken nose or other serious injury to face or skull (%)
Taste & Smell - People 40+ that ever had two or more sinus infections (%)
Weight - Average height (inches)
Weight - Average weight (pounds)
Weight - Average BMI
Weight - People that are obese (%)
Weight - People that ever were obese (%)
Weight - People trying to lose weight (%)
Officers per 1,000 residents here:
1.85Texas average:
2.07
Latest news from Yoakum, TX collected exclusively by city-data.com from local newspapers, TV, and radio stations
Ancestries: Czech (9.6%), German (7.9%), American (4.3%), English (1.3%).
Current Local Time:
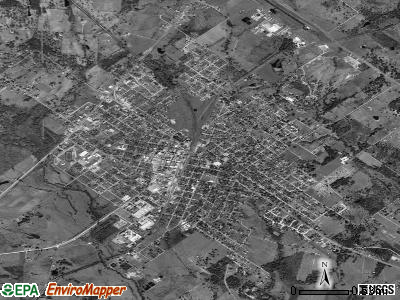
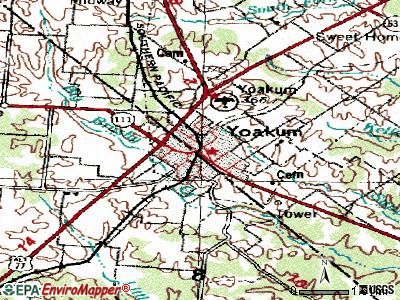
Land area: 4.56 square miles.
Population density: 1,291 people per square mile (low).
665 residents are foreign born (10.5% Latin America ).
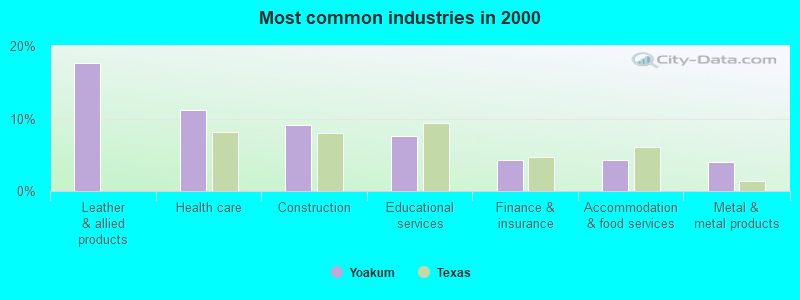
This city:
11.1%Texas:
17.1%
Median real estate property taxes paid for housing units with mortgages in 2022: $1,945 (1.0%)Median real estate property taxes paid for housing units with no mortgage in 2022: $1,532 (1.2%)
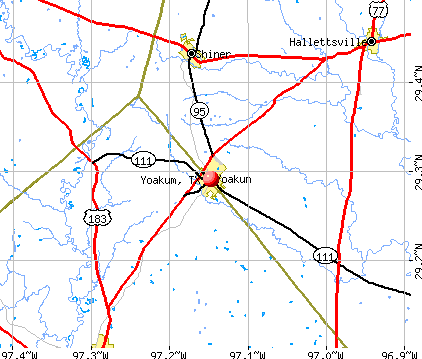
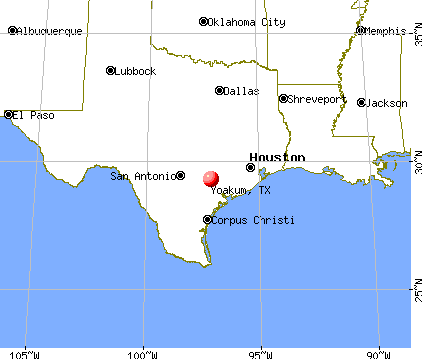
Nearest city with pop. 50,000+: Victoria, TX
Nearest city with pop. 200,000+: Austin, TX
Nearest city with pop. 1,000,000+: San Antonio, TX
Nearest cities:
Latitude: 29.29 N, Longitude: 97.15 W
Daytime population change due to commuting: +339 (+5.7%)Workers who live and work in this city: 1,689 (63.3%)
Unemployment in December 2023:
Population change in the 1990s: +84 (+1.5%).
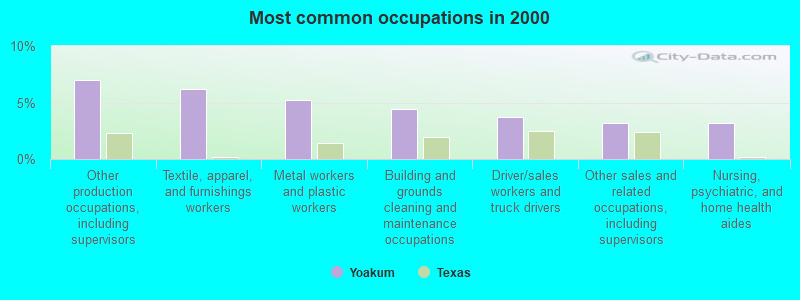
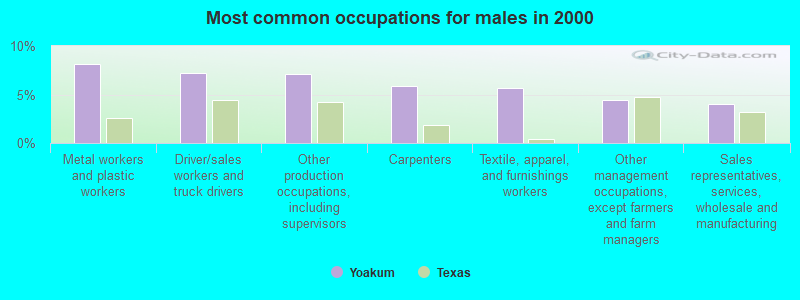
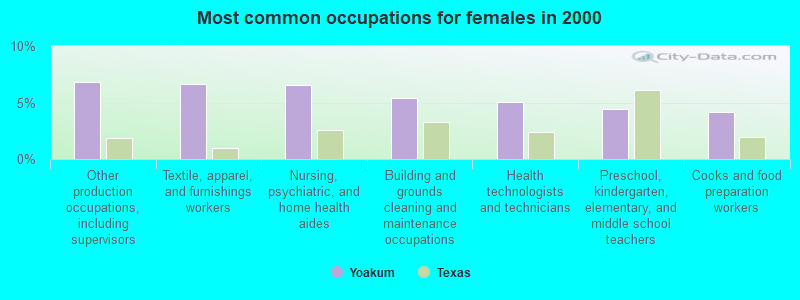
Most common occupations in Yoakum, TX (%)
Both Males Females
Other production occupations, including supervisors (7.0%)
Textile, apparel, and furnishings workers (6.2%)
Metal workers and plastic workers (5.2%)
Building and grounds cleaning and maintenance occupations (4.4%)
Driver/sales workers and truck drivers (3.7%)
Other sales and related occupations, including supervisors (3.2%)
Nursing, psychiatric, and home health aides (3.2%)
Metal workers and plastic workers (8.2%)
Driver/sales workers and truck drivers (7.2%)
Other production occupations, including supervisors (7.1%)
Carpenters (5.9%)
Textile, apparel, and furnishings workers (5.7%)
Other management occupations, except farmers and farm managers (4.4%)
Sales representatives, services, wholesale and manufacturing (4.0%)
Other production occupations, including supervisors (6.8%)
Textile, apparel, and furnishings workers (6.6%)
Nursing, psychiatric, and home health aides (6.6%)
Building and grounds cleaning and maintenance occupations (5.4%)
Health technologists and technicians (5.0%)
Preschool, kindergarten, elementary, and middle school teachers (4.5%)
Cooks and food preparation workers (4.2%)
Tornado activity:
Yoakum-area historical tornado activity is slightly below Texas state average. It is 11% greater than the overall U.S. average.
On 9/20/1967, a category F3 (max. wind speeds 158-206 mph) tornado 6.2 miles away from the Yoakum city center injured 4 people and caused between $500,000 and $5,000,000 in damages.
On 9/20/1967, a category F3 tornado 21.0 miles away from the city center injured 3 people and caused between $5000 and $50,000 in damages.
Earthquake activity:
Yoakum-area historical earthquake activity is significantly above Texas state average. It is 33% smaller than the overall U.S. average. On 10/20/2011 at 12:24:41, a magnitude 4.8 (4.8 MW, Depth: 3.1 mi, Class: Light, Intensity: IV - V) earthquake occurred 63.6 miles away from Yoakum center On 4/9/1993 at 12:29:19, a magnitude 4.3 (4.1 MB, 4.3 LG, Depth: 3.1 mi) earthquake occurred 67.7 miles away from the city center On 4/14/1995 at 00:32:56, a magnitude 5.7 (5.6 MB, 5.7 MS, 5.7 MW, Depth: 11.1 mi, Class: Moderate, Intensity: VI - VII) earthquake occurred 379.5 miles away from the city center On 5/1/2018 at 16:28:56, a magnitude 4.0 (4.0 MW, Depth: 3.1 mi) earthquake occurred 56.8 miles away from the city center On 4/7/2008 at 09:51:12, a magnitude 3.9 (3.9 MW, Depth: 3.1 mi, Class: Light, Intensity: II - III) earthquake occurred 59.5 miles away from the city center On 6/16/1978 at 11:46:54, a magnitude 5.3 (4.4 MB, 4.6 UK, 5.3 ML) earthquake occurred 335.7 miles away from Yoakum center Magnitude types: regional Lg-wave magnitude (LG), body-wave magnitude (MB), local magnitude (ML), surface-wave magnitude (MS), moment magnitude (MW) Natural disasters: The number of natural disasters in DeWitt County (16) is near the US average (15).Major Disasters (Presidential) Declared: 8Emergencies Declared: 6Hurricanes: 8, Storms: 5, Floods: 4, Fires: 2, Tornadoes: 2, Wind: 1, Other: 1 (Note: some incidents may be assigned to more than one category). Hospitals and medical centers in Yoakum: ACCOLADE HOSPICE (222 W GRAND AVE) YOAKUM COMMUNITY HOSPITAL (Government - Hospital District or Authority, 1200 CARL RAMERT DRIVE) ACCOLADE HOME CARE (318 E MORRIS)
ADVANCED HOME HEALTH SERVICES (202 WEST GRAND AVENUE)
STEVENS HEALTH CARE AND REHAB CENTER (204 WALTER ST)
YOAKUM MEMORIAL NURSING HOME INC (HWY 77A BUSINESS RT)
YOAKUM NURSING AND REHABILITATION CENTER (1300 CARL RAMERT DR)
Colleges/universities with over 2000 students nearest to Yoakum:
Victoria College (about 35 miles; Victoria, TX ; Full-time enrollment: 2,730)
University of Houston-Victoria (about 35 miles; Victoria, TX ; FT enrollment: 3,110)
Texas State University (about 63 miles; San Marcos, TX ; FT enrollment: 29,202)
Wharton County Junior College (about 65 miles; Wharton, TX ; FT enrollment: 5,009)
Coastal Bend College (about 70 miles; Beeville, TX ; FT enrollment: 2,880)
Saint Edward's University (about 75 miles; Austin, TX ; FT enrollment: 4,308)
Blinn College (about 75 miles; Brenham, TX ; FT enrollment: 8,959)
Public high schools in Yoakum: YOAKUM H S Students: 453, Location: 104 POTH ST, Grades: 9-12)G O A L S PROGRAM Location: 315 E GONZALES ST, Grades: 1-12)
Public elementary/middle schools in Yoakum: YOAKUM PRI Students: 424, Location: 701 W GRAND AVE, Grades: PK-2)YOAKUM INT Students: 345, Location: 208 AUBREY ST, Grades: 3-5)YOAKUM J H Location: 103 MCKINNON, Grades: 6-8)
Private elementary/middle school in Yoakum: ST JOSEPH ELEMENTARY SCHOOL Students: 114, Location: 310 ORTH ST, Grades: PK-8)
See full list of schools located in Yoakum Library in Yoakum: CARL & MARY WELHAUSEN LIBRARY Operating income: $98,334; Location: 810 FRONT ST; 19,436 books ; 1,125 audio materials ; 2,200 video materials ; 1 local licensed databases ; 50 state licensed databases ; 3 print serial subscriptions )
Notable locations in Yoakum: (A) , Yoakum Police Department (B) , Baker House (C) , Municipal Power Plant (D) . Display/hide their locations on the map
Churches in Yoakum include: (A) , First Presbyterian Church (B) , Holy Communion Episcopal Church (C) , Forrest Street Church of God in Christ (D) , Saint Johns Baptist Church (E) , Saint Josephs Catholic Church (F) , First Baptist Church (G) , Austin Street Baptist Church (H) . Display/hide their locations on the map
Creek: (A) . Display/hide its location on the map
Parks in Yoakum include: (1) , Yoakum Municipal Park (2) . Display/hide their locations on the map
Hotel:
Birthplace of: Ryan Wagner - 2005 Major League Baseball player (Cincinnati Reds, born : Jul 15, 1982), Jim Marquis - Baseball player, Charlie Hall (linebacker) - Football player, John Glaiser - Baseball player, Slim McGrew - Baseball player.
DeWitt County has a predicted average indoor radon screening level less than 2 pCi/L (pico curies per liter) - Low Potential Drinking water stations with addresses in Yoakum and their reported violations in the past:
HOCHHEIM PRAIRIE HERMANN SONS HALL (Population served: 400, Groundwater):
Past health violations:
MCL, Single Sample - Between JUL-2014 and SEP-2014, Contaminant: Nitrate. Follow-up actions: St AO (w/o penalty) issued (JUL-11-2014), St Public Notif requested (AUG-18-2014), St Violation/Reminder Notice (AUG-18-2014)
MCL, Single Sample - Between JAN-2014 and MAR-2014, Contaminant: Nitrate. Follow-up actions: St Public Notif requested (MAR-31-2014), St Violation/Reminder Notice (MAR-31-2014), St Public Notif received (MAY-22-2014), St AO (w/o penalty) issued (JUL-11-2014)
MCL, Single Sample - Between OCT-2013 and DEC-2013, Contaminant: Nitrate. Follow-up actions: St Public Notif requested (DEC-03-2013), St Violation/Reminder Notice (DEC-03-2013), St Formal NOV issued (JAN-17-2014), St Public Notif received (FEB-10-2014), St AO (w/o penalty) issued (JUL-11-2014)
MCL, Single Sample - Between JUL-2013 and SEP-2013, Contaminant: Nitrate. Follow-up actions: St Public Notif requested (OCT-25-2013), St Violation/Reminder Notice (OCT-25-2013), St Public Notif received (NOV-19-2013), St Formal NOV issued (JAN-17-2014), St AO (w/o penalty) issued (JUL-11-2014)
MCL, Single Sample - Between JAN-2013 and MAR-2013, Contaminant: Nitrate. Follow-up actions: St Public Notif requested (APR-02-2013), St Violation/Reminder Notice (APR-02-2013), St Public Notif received (MAY-16-2013), St Formal NOV issued (JAN-17-2014), St AO (w/o penalty) issued (JUL-11-2014)
MCL, Single Sample - Between OCT-2012 and DEC-2012, Contaminant: Nitrate. Follow-up actions: St Public Notif requested (DEC-17-2012), St Violation/Reminder Notice (DEC-17-2012), St Public Notif received (DEC-20-2012), St Formal NOV issued (JAN-17-2014), St AO (w/o penalty) issued (JUL-11-2014)
Past monitoring violations:
Monitoring, Source Water (GWR) - In SEP-01-2011, Contaminant: E. COLI. Follow-up actions: St Public Notif received (SEP-26-2011), St Public Notif requested (OCT-31-2011), St Violation/Reminder Notice (OCT-31-2011)
One minor monitoring violation
Average household size: This city:
2.7 peopleTexas:
2.8 people
Percentage of family households: This city:
68.5%Whole state:
69.9%
Percentage of households with unmarried partners: This city:
6.6%Whole state:
6.0%
Likely homosexual households (counted as self-reported same-sex unmarried-partner households)
Lesbian couples: 0.3% of all households Gay men: 0.2% of all households
173 people in nursing facilities/skilled-nursing facilities in 2010people in nursing homes in 2000people in religious group quarters in 2000
Banks with branches in Yoakum (2011 data):
First State Bank: at 406 West Grand Avenue, branch established on 1931/01/01. Info updated 2006/11/03: Bank assets: $140.2 mil, Deposits: $121.9 mil, local headquarters , positive income , 2 total offices , Holding Company: First State Bancshares Of Yoakum, Inc.
The Yoakum National Bank: at 301 West Grand Avenue, branch established on 1890/01/01. Info updated 2010/06/21: Bank assets: $180.3 mil, Deposits: $156.1 mil, local headquarters , positive income , 1 total offices , Holding Company: Yoakum National Bancshares, Inc.
Prosperity Bank: Yoakum Branch at 601 Lott Street, branch established on 1935/04/20. Info updated 2012/01/05: Bank assets: $9,816.2 mil, Deposits: $8,064.8 mil, headquarters in El Campo, TX, positive income , Mortgage Lending Specialization, 187 total offices , Holding Company: Prosperity Bancshares, Inc.
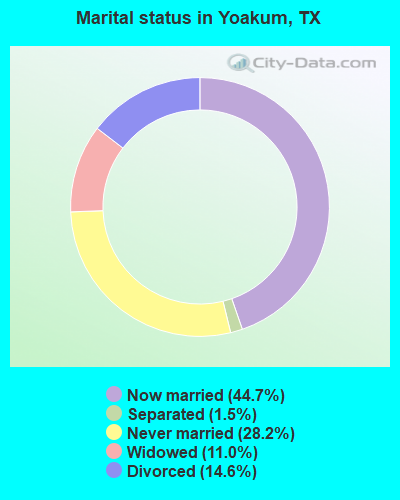
For population 15 years and over in Yoakum:
Never married: 28.2%Now married: 44.7%Separated: 1.5%Widowed: 11.0%Divorced: 14.6% For population 25 years and over in Yoakum:
High school or higher: 73.4%Bachelor's degree or higher: 12.4%Graduate or professional degree: 3.3%Unemployed: 5.3%Mean travel time to work (commute): 19.5 minutes
Education Gini index (Inequality in education) Here:
15.1Texas average:
14.0
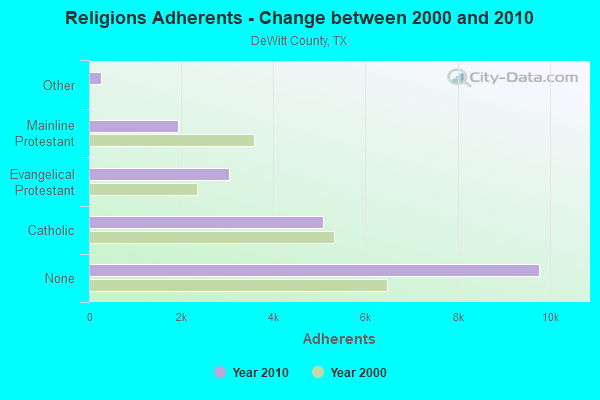
Religion statistics for Yoakum, TX (based on DeWitt County data)
Religion Adherents Congregations Catholic 5,079 8 Evangelical Protestant 3,046 25 Mainline Protestant 1,940 11 Other 254 2 None 9,778 -
Source: Clifford Grammich, Kirk Hadaway, Richard Houseal, Dale E.Jones, Alexei Krindatch, Richie Stanley and Richard H.Taylor. 2012. 2010 U.S.Religion Census: Religious Congregations & Membership Study. Association of Statisticians of American Religious Bodies. Jones, Dale E., et al. 2002. Congregations and Membership in the United States 2000. Nashville, TN: Glenmary Research Center. Graphs represent county-level data
Food Environment Statistics: Number of grocery stores : 4Here :
2.03 / 10,000 pop.Texas :
1.47 / 10,000 pop.
Number of convenience stores (no gas) : 3DeWitt County :
1.52 / 10,000 pop.Texas :
1.11 / 10,000 pop.
Number of convenience stores (with gas) : 9Here :
4.56 / 10,000 pop.State :
3.95 / 10,000 pop.
Number of full-service restaurants : 20DeWitt County :
10.14 / 10,000 pop.Texas :
6.13 / 10,000 pop.
Adult diabetes rate : This county :
10.4%State :
8.9%
Adult obesity rate : DeWitt County :
28.1%Texas :
26.6%
Low-income preschool obesity rate : DeWitt County :
17.9%Texas :
15.7%
Health and Nutrition: Healthy diet rate : This city:
47.1%Texas:
48.6%
Average overall health of teeth and gums : This city:
43.9%Texas:
47.4%
People feeling badly about themselves : People not drinking alcohol at all : This city:
12.0%State:
10.3%
Average hours sleeping at night : General health condition : Average condition of hearing : More about Health and Nutrition of Yoakum, TX Residents
Yoakum government finances - Expenditure in 2017 (per resident):
Construction - Housing and Community Development: $254,000 ($43.12)
Regular Highways: $186,000 ($31.57)Parks and Recreation: $55,000 ($9.34)Air Transportation: $45,000 ($7.64)Electric Utilities: $23,000 ($3.90)Libraries: $17,000 ($2.89)Police Protection: $4,000 ($0.68)Current Operations - Electric Utilities: $5,997,000 ($1017.99)
Solid Waste Management: $2,146,000 ($364.28)Police Protection: $1,427,000 ($242.23)Local Fire Protection: $899,000 ($152.61)Financial Administration: $781,000 ($132.58)Sewerage: $738,000 ($125.28)Water Utilities: $649,000 ($110.17)Central Staff Services: $604,000 ($102.53)Parks and Recreation: $525,000 ($89.12)Regular Highways: $483,000 ($81.99)Libraries: $149,000 ($25.29)General - Other: $115,000 ($19.52)Protective Inspection and Regulation - Other: $87,000 ($14.77)General Public Buildings: $78,000 ($13.24)Housing and Community Development: $42,000 ($7.13)Judicial and Legal Services: $18,000 ($3.06)Air Transportation: $9,000 ($1.53)General - Interest on Debt: $250,000 ($42.44)
Other Capital Outlay - Water Utilities: $57,000 ($9.68)
Police Protection: $36,000 ($6.11)Sewerage: $26,000 ($4.41)Regular Highways: $14,000 ($2.38)Total Salaries and Wages: $4,022,000 ($682.74)
Yoakum government finances - Revenue in 2017 (per resident):
Charges - Solid Waste Management: $2,653,000 ($450.35)
Sewerage: $1,117,000 ($189.61)Other: $318,000 ($53.98)Parks and Recreation: $110,000 ($18.67)Air Transportation: $5,000 ($0.85)Miscellaneous - Fines and Forfeits: $127,000 ($21.56)
Interest Earnings: $114,000 ($19.35)Donations From Private Sources: $112,000 ($19.01)General Revenue - Other: $59,000 ($10.02)Rents: $49,000 ($8.32)Sale of Property: $7,000 ($1.19)Royalties: $1,000 ($0.17)Revenue - Electric Utilities: $8,549,000 ($1451.20)
Water Utilities: $1,011,000 ($171.62)State Intergovernmental - Public Welfare: $295,000 ($50.08)
Other: $89,000 ($15.11)General Local Government Support: $2,000 ($0.34)Sewerage: $1,000 ($0.17)Tax - General Sales and Gross Receipts: $1,411,000 ($239.52)
Property: $205,000 ($34.80)Public Utilities Sales: $125,000 ($21.22)Other Selective Sales: $71,000 ($12.05)Occupation and Business License - Other: $27,000 ($4.58)Other License: $8,000 ($1.36)
Yoakum government finances - Debt in 2017 (per resident):
Long Term Debt - Beginning Outstanding - Unspecified Public Purpose: $6,260,000 ($1062.64)
Outstanding Unspecified Public Purpose: $5,800,000 ($984.55)Retired Unspecified Public Purpose: $460,000 ($78.09)
Yoakum government finances - Cash and Securities in 2017 (per resident):
Other Funds - Cash and Securities: $15,929,000 ($2703.96)
Sinking Funds - Cash and Securities: $12,000 ($2.04)
Businesses in Yoakum, TX
Name Count Name Count
AT&T 1 H&R Block 1 Alco Stores 1 Pizza Hut 1 Ashley Furniture 1 SONIC Drive-In 1 Dairy Queen 1 Subway 1 FedEx 1 U-Haul 1
Strongest AM radio stations in Yoakum:
KTKR (760 AM; 50 kW; SAN ANTONIO, TX; Owner: CCB TEXAS LICENSES, L.P.)
WOAI (1200 AM; 50 kW; SAN ANTONIO, TX; Owner: CCB TEXAS LICENSES, L.P.)
KTMR (1130 AM; daytime; 10 kW; EDNA, TX; Owner: SIGA BROADCASTING CORPORATION)
KKYX (680 AM; 50 kW; SAN ANTONIO, TX; Owner: CXR HOLDINGS, INC.)
KCTA (1030 AM; 50 kW; CORPUS CHRISTI, TX; Owner: BROADCASTING CORPORATION OF THE SOUTHWEST)
KILE (1560 AM; 50 kW; BELLAIRE, TX; Owner: THE RAFTT CORPORATION)
KTRH (740 AM; 50 kW; HOUSTON, TX; Owner: AMFM TEXAS LICENSES LIMITED PARTNERSHIP)
KSAH (720 AM; 10 kW; UNIVERSAL CITY, TX; Owner: KSAH LICENSING, INC.)
KGOL (1180 AM; 50 kW; HUMBLE, TX; Owner: ENTRAVISION HOLDINGS, LLC)
KENS (1160 AM; 25 kW; SAN ANTONIO, TX; Owner: KENS-TV, INC.)
KQQA (1530 AM; 10 kW; CREEDMOOR, TX; Owner: YELLOW ROSE COMMUNICATIONS, INC.)
KDRY (1100 AM; 11 kW; ALAMO HEIGHTS, TX; Owner: KDRY RADIO, INC.)
KSEV (700 AM; 15 kW; TOMBALL, TX; Owner: LIBERMAN BROADCASTING OF HOUSTON LICENSE CORP.)
Strongest FM radio stations in Yoakum:
KYKM (92.5 FM; YOAKUM, TX; Owner: LAGRANGE BROADCASTING CORPORATION)
KTXM (99.9 FM; HALLETTSVILLE, TX; Owner: LAGRANGE BROADCASTING CORPORATION)
KTXN-FM (98.7 FM; VICTORIA, TX; Owner: COSMOPOLITAN ENTERPRISES OF VICTORIA)
WKSQ (94.5 FM; ELLSWORTH, ME; Owner: CLEAR CHANNEL BROADCASTING LICENSES, INC.)
TV broadcast stations around Yoakum:
KAVU-TV (Channel 25; VICTORIA, TX; Owner: SAGA BROADCASTING, LLC)
KVCT (Channel 19; VICTORIA, TX; Owner: SURTSEY PRODUCTIONS, INC.)
National Bridge Inventory (NBI) Statistics 36 Number of bridges236ft / 71.7m Total length $40,000 Total costs66,866 Total average daily traffic11,166 Total average daily truck traffic
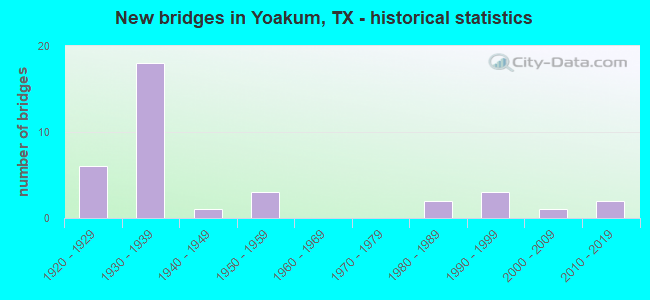
New bridges - historical statistics
6 1920-1929 18 1930-1939 1 1940-1949 3 1950-1959 2 1980-1989 3 1990-1999 1 2000-2009 2 2010-2019
See full National Bridge Inventory statistics for Yoakum, TX
FCC Registered Cell Phone Towers: 5 (
See the full list of FCC Registered Cell Phone Towers in Yoakum )
FCC Registered Antenna Towers: 108 (
See the full list of FCC Registered Antenna Towers )
FCC Registered Broadcast Land Mobile Towers: 5
Sh51 Loop & Tozik St (Lat: 29.281917 Lon: -97.155833), Type: Pipe, Structure height: 12 m, Call Sign: WPPG599, Licensee ID: L00003043, Assigned Frequencies: 2.32740 MHz, 2.42040 MHz, 2.42040 MHz, 2.42340 MHz, 2.42340 MHz, 2.58840 MHz, 2.58840 MHz, 2.80240 MHz, 2.80240 MHz, 2.80540 MHz... (+17 more), Grant Date: 10/29/2014, Expiration Date: 12/09/2024, Certifier: Richard Herndon, Registrant: State Of, Texas Dept. Of Transportation Texas, 125 E. 11th St., Austin, TX 78701-2483, Phone: (512) 506-5131, Fax: (512) 506-5136, Email:
9.5 Mi Sw Hallettsville 9 Mi S Hwy 77 (Lat: 29.361361 Lon: -97.066639), Call Sign: KNDU456, Licensee ID: L00100480, Assigned Frequencies: 461.500 MHz, Grant Date: 07/08/1997, Expiration Date: 09/14/2002, Cancellation Date: 02/22/2002, Registrant: K Kaiser, 1310 W Grand Ave, Yoakum, TX 77995, Phone: (512) 293-2040 9 Mi S Hwy 77 9.5 Mi Sw Hallettsville (Lat: 29.361361 Lon: -97.066917), Call Sign: KNGL431, Assigned Frequencies: 461.500 MHz, Grant Date: 06/16/1998, Expiration Date: 06/01/2003, Cancellation Date: 02/28/2002, Registrant: Leroy Janak, Rr 4 Box 261e, Hallettsville, TX 77964 Hwy 682 5 Mi Se (Lat: 29.217194 Lon: -97.103028), Call Sign: KQB885, Assigned Frequencies: 451.975 MHz, 451.975 MHz, 456.975 MHz, 456.975 MHz, Grant Date: 02/05/1998, Expiration Date: 03/23/2003, Cancellation Date: 05/13/2002, Registrant: W H Kuester, Rt 3 Box 200, Yoakum, TX 77995 Lat: 29.328806 Lon: -97.147917, Call Sign: WRDS774, Assigned Frequencies: 151.497 MHz, 151.535 MHz, 151.685 MHz, 151.730 MHz, 151.910 MHz, Grant Date: 07/12/2019, Expiration Date: 07/12/2029, Certifier: Bobby Walters, Registrant: Air Comm, 3366 W 1820 S, Salt Lake City, UT 84104, Phone: (801) 901-8888, Email:
FCC Registered Microwave Towers: 77 (
See the full list of FCC Registered Microwave Towers in this town )
FCC Registered Paging Towers: 1 (
See the full list of FCC Registered Paging Towers )
FCC Registered Maritime Coast & Aviation Ground Towers: 1 (
See the full list of FCC Registered Maritime Coast & Aviation Ground Towers )
FCC Registered Amateur Radio Licenses: 31 (
See the full list of FCC Registered Amateur Radio Licenses in Yoakum )
FAA Registered Aircraft Manufacturers and Dealers: 1 (
See the full list of FAA Registered Manufacturers and Dealers in Yoakum )
FAA Registered Aircraft: 10 (
See the full list of FAA Registered Aircraft )
Most common first names in Yoakum, TX among deceased individuals Name Count Lived (average)
Mary 118 82.8 years William 84 76.1 years John 79 76.9 years Annie 58 84.5 years James 56 71.2 years Joe 56 76.0 years Frank 54 79.4 years Willie 50 77.6 years Charles 39 75.9 years Robert 39 73.1 years
Most common last names in Yoakum, TX among deceased individuals Last name Count Lived (average)
Williams 48 79.0 years Johnson 41 75.3 years Brown 27 75.4 years Smith 25 71.5 years Green 22 75.8 years Garrett 21 78.7 years Garcia 20 77.9 years Adams 19 78.2 years Hagan 18 85.0 years Rodriguez 16 74.0 years
Yoakum compared to Texas state average:
Median household income below state average. Median house value below state average. Unemployed percentage below state average. Black race population percentage below state average. Median age above state average. Length of stay since moving in significantly above state average. House age above state average. Number of college students below state average. Percentage of population with a bachelor's degree or higher below state average.
#25 on the list of "Top 101 cities with largest percentage of females in occupations: production occupations (population 5,000+)"
#27 on the list of "Top 101 cities with the lowest cost per building permit(population 5,000+)"
#42 on the list of "Top 101 cities with largest percentage of males in industries: wholesale trade (population 5,000+)"
#51 on the list of "Top 101 cities with largest percentage of females in occupations: healthcare support occupations (population 5,000+)"
#10 (77995) on the list of "Top 101 zip codes with the largest percentage of Czech first ancestries (pop 5,000+)"
Top Patent Applicants
John C. Caton (5)
Jay B. Sullivan (2)
Mickey Rauch (1)
Denis Wauson (1)
Tony Payne (1)
Total of 10 patent applications in 2008-2024.


 Recent articles from our blog. Our writers, many of them Ph.D. graduates or candidates, create easy-to-read articles on a wide variety of topics.

 (34.1 miles
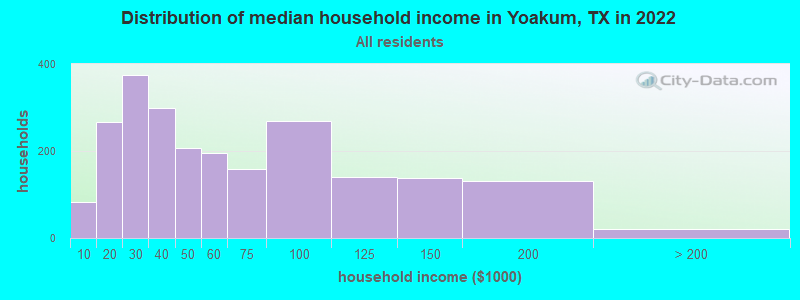


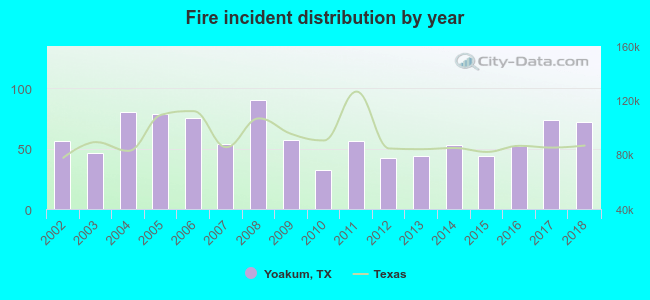 According to the data from the years 2002 - 2018 the average number of fires per year is 59. The highest number of fire incidents - 90 took place in 2008, and the least - 32 in 2010. The data has an increasing trend.
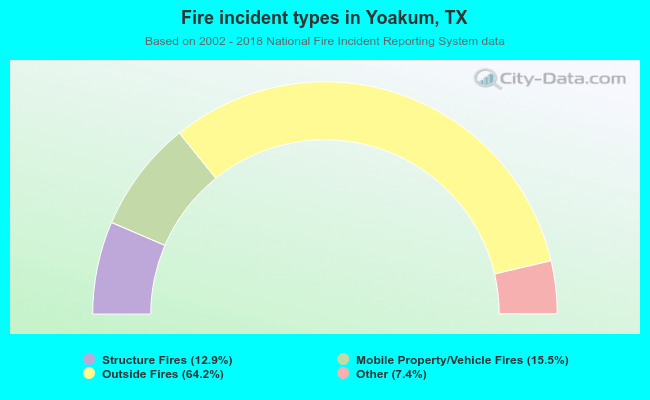 When looking into fire subcategories, the most reports belonged to: Outside Fires (64.2%), and Mobile Property/Vehicle Fires (15.5%).