West Tom Green, Texas
Submit your own pictures of this place and show them to the world
- OSM Map
- General Map
- Google Map
- MSN Map

| Males: 11,225 | |
| Females: 11,700 |
| Median resident age: | 39.9 years |
| Texas median age: | 32.3 years |
Zip code: 76901
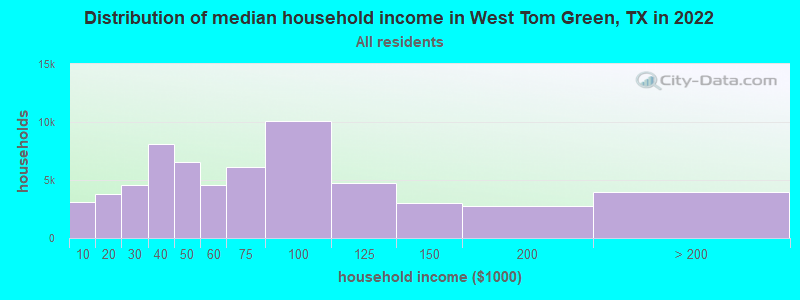
| West Tom Green: | $78,348 |
| TX: | $72,284 |
Estimated per capita income in 2022: $45,897 (it was $23,182 in 2000)
West Tom Green CCD income, earnings, and wages data
Estimated median house or condo value in 2022: $284,673 (it was $92,100 in 2000)
| West Tom Green: | $284,673 |
| TX: | $275,400 |
Mean prices in 2022: all housing units: $243,628; detached houses: $254,357; townhouses or other attached units: $187,757; in 5-or-more-unit structures: $501,290; mobile homes: $78,601; occupied boats, rvs, vans, etc.: $95,654
West Tom Green, TX residents, houses, and apartments details
Detailed information about poverty and poor residents in West Tom Green, TX


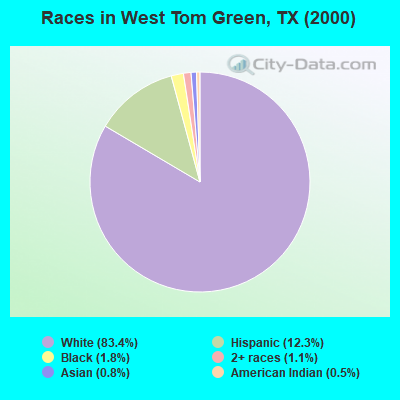
- 18,67483.4%White alone
- 2,75512.3%Hispanic
- 4131.8%Black alone
- 2361.1%Two or more races
- 1830.8%Asian alone
- 1010.5%American Indian alone
- 200.09%Native Hawaiian and Other
Pacific Islander alone - 110.05%Other race alone
Races in West Tom Green detailed stats: ancestries, foreign born residents, place of birth
 Recent articles from our blog. Our writers, many of them Ph.D. graduates or candidates, create easy-to-read articles on a wide variety of topics.
Current Local Time: CST time zone
Land area: 806.9 square miles.
Population density: 28 people per square mile (very low).

| West Tom Green CCD: | 1.5% ($1,411) |
| Texas: | 1.8% ($1,393) |
Nearest city with pop. 50,000+: San Angelo, TX  (10.2 miles , pop. 88,439).
Nearest city with pop. 200,000+: San Antonio, TX (185.4 miles , pop. 1,144,646).
Nearest cities:
), ), ), ), ), Latitude: 31.42 N, Longitude: 100.62 W
Area code commonly used in this area: 325

| Here: | 2.9% |
| Texas: | 3.5% |
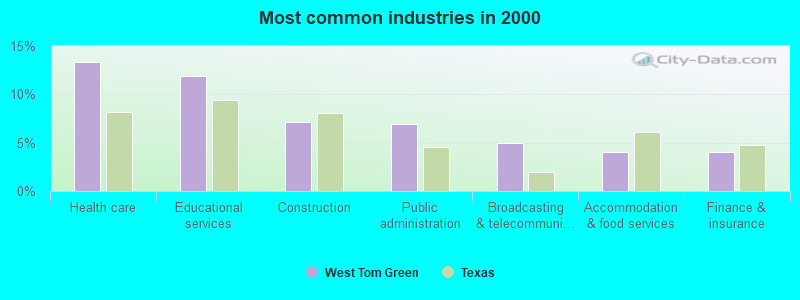
- Health care (13.3%)
- Educational services (11.9%)
- Construction (7.1%)
- Public administration (6.9%)
- Broadcasting & telecommunications (4.9%)
- Accommodation & food services (4.1%)
- Finance & insurance (4.0%)
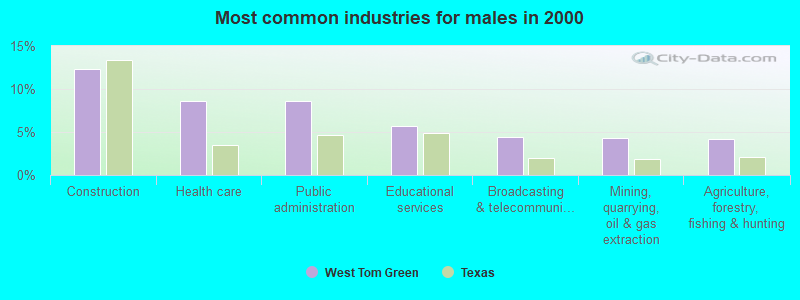
- Construction (12.3%)
- Health care (8.6%)
- Public administration (8.6%)
- Educational services (5.7%)
- Broadcasting & telecommunications (4.4%)
- Mining, quarrying, oil & gas extraction (4.3%)
- Agriculture, forestry, fishing & hunting (4.2%)
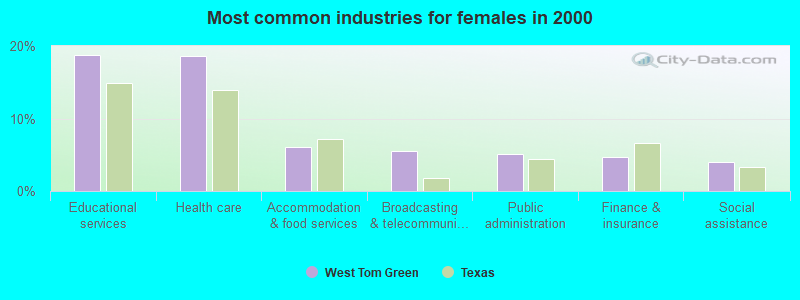
- Educational services (18.8%)
- Health care (18.7%)
- Accommodation & food services (6.0%)
- Broadcasting & telecommunications (5.5%)
- Public administration (5.1%)
- Finance & insurance (4.7%)
- Social assistance (4.0%)
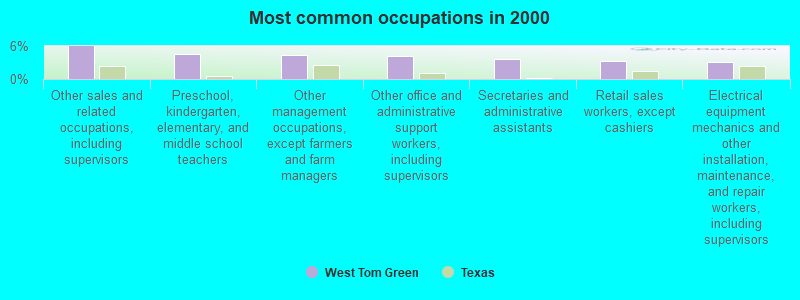
- Other sales and related occupations, including supervisors (6.0%)
- Preschool, kindergarten, elementary, and middle school teachers (4.6%)
- Other management occupations, except farmers and farm managers (4.3%)
- Other office and administrative support workers, including supervisors (4.3%)
- Secretaries and administrative assistants (3.7%)
- Retail sales workers, except cashiers (3.2%)
- Electrical equipment mechanics and other installation, maintenance, and repair workers, including supervisors (3.2%)
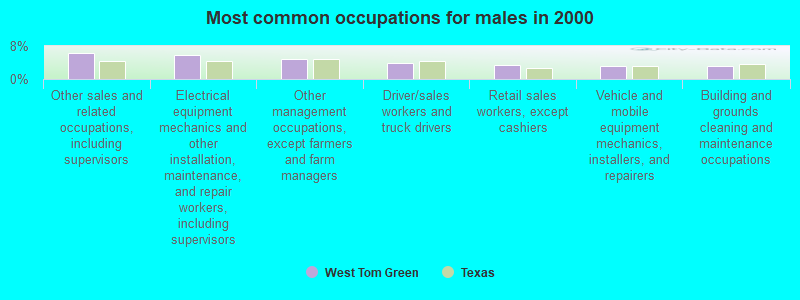
- Other sales and related occupations, including supervisors (6.2%)
- Electrical equipment mechanics and other installation, maintenance, and repair workers, including supervisors (5.8%)
- Other management occupations, except farmers and farm managers (4.8%)
- Driver/sales workers and truck drivers (3.8%)
- Retail sales workers, except cashiers (3.3%)
- Vehicle and mobile equipment mechanics, installers, and repairers (3.2%)
- Building and grounds cleaning and maintenance occupations (3.0%)
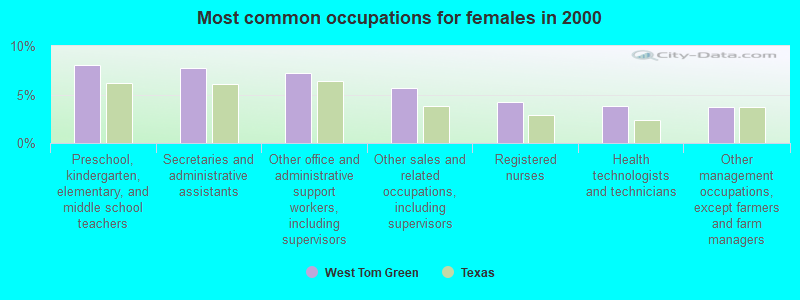
- Preschool, kindergarten, elementary, and middle school teachers (8.0%)
- Secretaries and administrative assistants (7.8%)
- Other office and administrative support workers, including supervisors (7.2%)
- Other sales and related occupations, including supervisors (5.7%)
- Registered nurses (4.2%)
- Health technologists and technicians (3.8%)
- Other management occupations, except farmers and farm managers (3.7%)
Average climate in West Tom Green, Texas
Based on data reported by over 4,000 weather stations


Tornado activity:
West Tom Green-area historical tornado activity is significantly below Texas state average. It is 33% smaller than the overall U.S. average.
On 5/11/1953, a category F4 (max. wind speeds 207-260 mph) tornado 7.9 miles away from the West Tom Green place center killed 13 people and injured 159 people and caused between $500,000 and $5,000,000 in damages.
On 4/30/1952, a category F3 (max. wind speeds 158-206 mph) tornado 9.2 miles away from the place center injured 6 people and caused between $50,000 and $500,000 in damages.
Earthquake activity:
West Tom Green-area historical earthquake activity is significantly above Texas state average. It is 285% greater than the overall U.S. average.On 4/14/1995 at 00:32:56, a magnitude 5.7 (5.6 MB, 5.7 MS, 5.7 MW, Depth: 11.1 mi, Class: Moderate, Intensity: VI - VII) earthquake occurred 181.1 miles away from the city center
On 6/16/1978 at 11:46:54, a magnitude 5.3 (4.4 MB, 4.6 UK, 5.3 ML) earthquake occurred 111.6 miles away from the city center
On 1/2/1992 at 11:45:35, a magnitude 5.0 (4.6 MB, 5.0 LG, Depth: 3.1 mi) earthquake occurred 158.8 miles away from the city center
On 3/26/2020 at 15:16:27, a magnitude 5.0 (5.0 MW, Depth: 5.9 mi) earthquake occurred 202.6 miles away from the city center
On 11/6/2011 at 03:53:10, a magnitude 5.7 (5.7 MW, Depth: 3.2 mi) earthquake occurred 361.0 miles away from West Tom Green center
On 9/11/2011 at 12:27:44, a magnitude 4.3 (4.3 MW, Depth: 3.1 mi, Class: Light, Intensity: IV - V) earthquake occurred 99.1 miles away from West Tom Green center
Magnitude types: regional Lg-wave magnitude (LG), body-wave magnitude (MB), local magnitude (ML), surface-wave magnitude (MS), moment magnitude (MW)
Natural disasters:
The number of natural disasters in Tom Green County (14) is near the US average (15).Major Disasters (Presidential) Declared: 4
Emergencies Declared: 8
Causes of natural disasters: Fires: 5, Hurricanes: 5, Floods: 3, Storms: 3, Tornadoes: 3, Wind: 1, Other: 1 (Note: some incidents may be assigned to more than one category).
Hospitals and medical centers near West Tom Green:
- TRISUN CARE CENTER REGENCY HOUSE (Nursing Home, about 7 miles away; SAN ANGELO, TX)
- RIVER CREST HOSP (Hospital, about 7 miles away; SAN ANGELO, TX)
- MEADOW CREEK NURSING CENTER (Nursing Home, about 8 miles away; SAN ANGELO, TX)
- TRISUN CARE CENTER MEADOW CREEK (Nursing Home, about 8 miles away; SAN ANGELO, TX)
- INTREPID USA HEALTHCARE SERVICES (Home Health Center, about 8 miles away; SAN ANGELO, TX)
- CONCHO VALLEY HOME HEALTH CARE (Home Health Center, about 8 miles away; SAN ANGELO, TX)
- MOSAIC (Hospital, about 8 miles away; SAN ANGELO, TX)
Colleges/universities with over 2000 students nearest to West Tom Green:
- Angelo State University (about 10 miles; San Angelo, TX; Full-time enrollment: 6,019)
- Howard College (about 76 miles; Big Spring, TX; FT enrollment: 2,587)
- Abilene Christian University (about 91 miles; Abilene, TX; FT enrollment: 4,025)
- Midland College (about 97 miles; Midland, TX; FT enrollment: 3,650)
- The University of Texas of the Permian Basin (about 106 miles; Odessa, TX; FT enrollment: 2,982)
- Odessa College (about 109 miles; Odessa, TX; FT enrollment: 3,107)
- Cisco College (about 118 miles; Cisco, TX; FT enrollment: 2,687)
Points of interest:
Notable locations in West Tom Green: Coon Dive Windmill (A), Duff Ranch (B), Duncan Ranch (C), Headquarters Windmill (D), Holiman Ranch (E), Kelly Ranch (F), Little Windmill (G), Pecan Station (H), Probandt Ranch (I), Steel Windmill (J), Sulphur Windmill (K), Turkey Windmill (L), Turner Ranch Headquarters (M), Tweedy Ranch (N), Wardlaw Ranch (O), XQZ Ranch (P), San Angelo Country Club (Q), San Angelo Gun Club (R), State Fish Hatchery Number 2 (S), Munn Ranch (T). Display/hide their locations on the map
Churches in West Tom Green include: Chapel-on-the-Hill (A), Green Meadow Church of Christ (B), Sierra Vista United Methodist Church (C), The Church of Jesus Christ of Latter Day Saints (D), Southland Baptist Church (E), Glen Meadows Baptist Church (F). Display/hide their locations on the map
Cemeteries: DeLong Cemetery (1), Midway Cemetery (2), Grape Creek Cemetery (3). Display/hide their locations on the map
Lakes and reservoirs: Panther Bluff Waterhole (A), Lake Nasworthy (B), XQZ Lake (C), Twin Buttes Reservoir (D), Lake Nasworthy (E), Rust Reservoir (F), O C Fisher Lake (G), Fry Reservoir (H). Display/hide their locations on the map
Streams, rivers, and creeks: Shin Oak Creek (A), Bald Eagle Creek (B), Sulpher Draw (C), Spring Creek (D), Mule Creek (E), Mulberry Creek (F), Middle Concho River (G), Grape Creek (H), Coyote Creek (I). Display/hide their locations on the map
Parks in West Tom Green include: Lincoln Park (1), Harper Park (2), San Angelo State Park - North Shore (3), San Angelo State Park - South Shore (4), Red Bluff Park (5). Display/hide their locations on the map
| This place: | 2.4 people |
| Texas: | 2.8 people |
| This place: | 70.5% |
| Whole state: | 69.9% |
| This place: | 4.3% |
| Whole state: | 6.0% |
Likely homosexual households (counted as self-reported same-sex unmarried-partner households)
- Lesbian couples: 0.3% of all households
- Gay men: 0.2% of all households
| This place: | 8.5% |
| Whole state: | 15.4% |
| This place: | 3.5% |
| Whole state: | 6.7% |
People in group quarters in West Tom Green in 2010:
- 160 people in workers' group living quarters and job corps centers
- 157 people in nursing facilities/skilled-nursing facilities
- 134 people in group homes intended for adults
- 60 people in residential schools for people with disabilities
- 31 people in correctional residential facilities
- 20 people in group homes for juveniles (non-correctional)
- 16 people in residential treatment centers for adults
- 6 people in other noninstitutional facilities
People in group quarters in West Tom Green in 2000:
- 309 people in homes for the mentally retarded
- 147 people in nursing homes
- 3 people in religious group quarters
For population 15 years and over in West Tom Green:
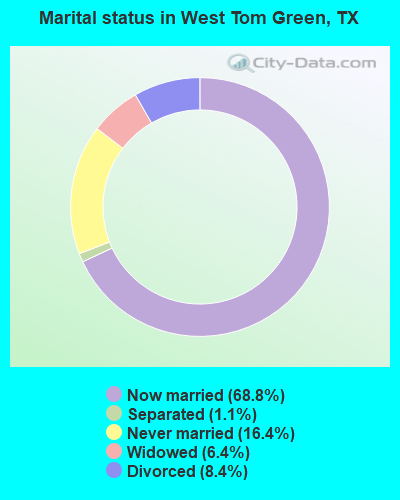
- Never married: 16.4%
- Now married: 68.8%
- Separated: 1.1%
- Widowed: 6.4%
- Divorced: 8.4%
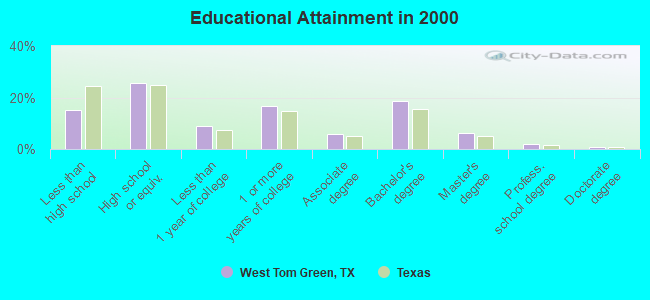
For population 25 years and over in West Tom Green:
- High school or higher: 85.0%
- Bachelor's degree or higher: 27.6%
- Graduate or professional degree: 8.9%
- Unemployed: 7.9%
- Mean travel time to work (commute): 20.2 minutes
| Here: | 12.2 |
| Texas average: | 15.6 |
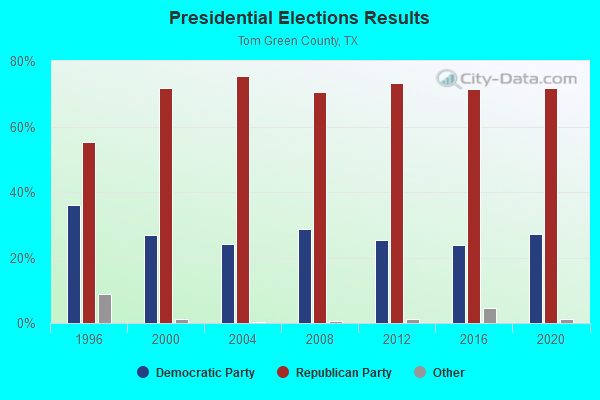
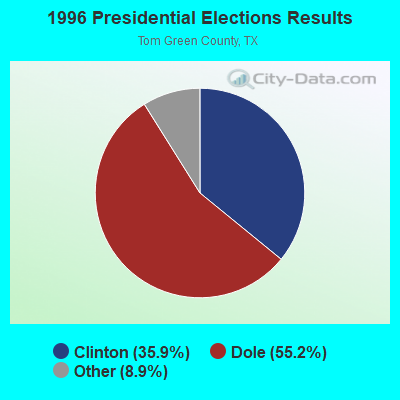


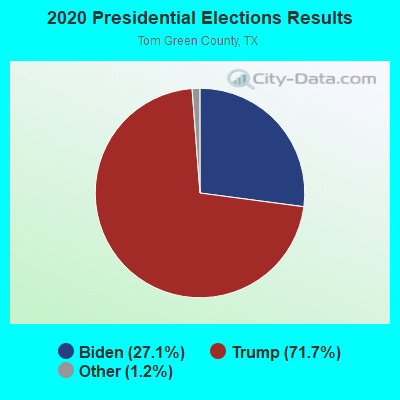
Graphs represent county-level data. Detailed 2008 Election Results
Religion statistics for West Tom Green, TX (based on Tom Green County data)
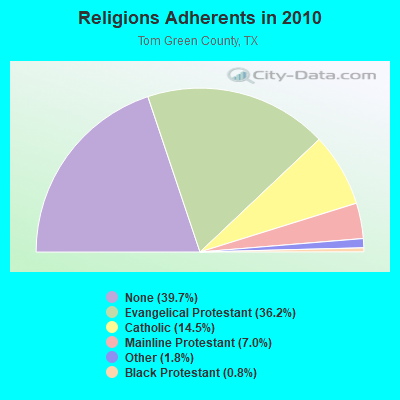
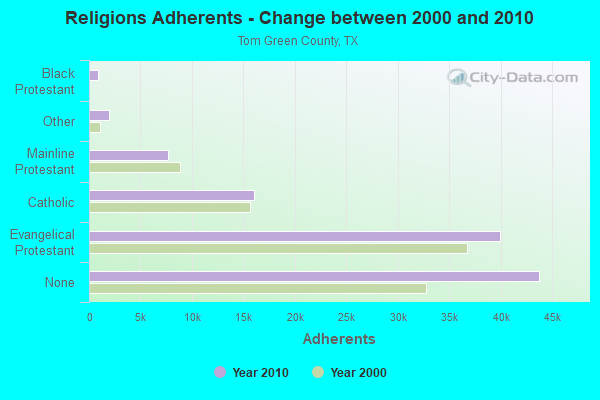
| Religion | Adherents | Congregations |
|---|---|---|
| Evangelical Protestant | 39,916 | 100 |
| Catholic | 16,000 | 9 |
| Mainline Protestant | 7,675 | 21 |
| Other | 1,957 | 7 |
| Black Protestant | 848 | 6 |
| Orthodox | 77 | 1 |
| None | 43,751 | - |
Food Environment Statistics:
| This county: | 1.31 / 10,000 pop. |
| Texas: | 1.47 / 10,000 pop. |
| This county: | 0.19 / 10,000 pop. |
| Texas: | 0.14 / 10,000 pop. |
| Tom Green County: | 1.13 / 10,000 pop. |
| Texas: | 1.11 / 10,000 pop. |
| Tom Green County: | 6.38 / 10,000 pop. |
| Texas: | 3.95 / 10,000 pop. |
| This county: | 7.32 / 10,000 pop. |
| Texas: | 6.13 / 10,000 pop. |
| Tom Green County: | 9.7% |
| Texas: | 8.9% |
| Tom Green County: | 26.6% |
| State: | 26.6% |
| Tom Green County: | 12.8% |
| Texas: | 15.7% |
7.07% of this county's 2021 resident taxpayers lived in other counties in 2020 ($51,968 average adjusted gross income)
| Here: | 7.07% |
| Texas average: | 8.12% |
0.10% of residents moved from foreign countries ($710 average AGI)
Tom Green County: 0.10% Texas average: 0.04%
Top counties from which taxpayers relocated into this county between 2020 and 2021:
| from Midland County, TX | |
| from Bexar County, TX | |
| from Taylor County, TX |
8.20% of this county's 2020 resident taxpayers moved to other counties in 2021 ($47,126 average adjusted gross income)
| Here: | 8.20% |
| Texas average: | 7.40% |
0.18% of residents moved to foreign countries ($964 average AGI)
Tom Green County: 0.18% Texas average: 0.03%
Top counties to which taxpayers relocated from this county between 2020 and 2021:
| to Bexar County, TX | |
| to Midland County, TX | |
| to Tarrant County, TX |
Strongest AM radio stations in West Tom Green:
- KGKL (960 AM; 5 kW; SAN ANGELO, TX; Owner: KGKL, INC.)
- KCRN (1340 AM; 1 kW; SAN ANGELO, TX; Owner: CRISWELL CENTER OF BIBLICAL STUDIES)
- KKSA (1260 AM; 1 kW; SAN ANGELO, TX; Owner: FOSTER COMMUNICATIONS COMPANY, INC.)
- KKYX (680 AM; 50 kW; SAN ANTONIO, TX; Owner: CXR HOLDINGS, INC.)
- KTKR (760 AM; 50 kW; SAN ANTONIO, TX; Owner: CCB TEXAS LICENSES, L.P.)
- WBAP (820 AM; 50 kW; FORT WORTH, TX; Owner: WBAP-KSCS OPERATING, LTD.)
- WOAI (1200 AM; 50 kW; SAN ANTONIO, TX; Owner: CCB TEXAS LICENSES, L.P.)
- KCRS (550 AM; 5 kW; MIDLAND, TX; Owner: CCB TEXAS LICENSES, L.P.)
- KAHZ (1360 AM; 50 kW; HURST, TX)
- KESS (1270 AM; 50 kW; FORT WORTH, TX; Owner: KESS-AM LICENSE CORP.)
- KICA (980 AM; 50 kW; CLOVIS, NM; Owner: BROADCAST ENTERTAINMENT CORPORATION)
- KRLD (1080 AM; 50 kW; DALLAS, TX; Owner: TEXAS INFINITY BROADCASTING L.P.)
- KENS (1160 AM; 25 kW; SAN ANTONIO, TX; Owner: KENS-TV, INC.)
Strongest FM radio stations in West Tom Green:
- KSJT-FM (107.5 FM; SAN ANGELO, TX; Owner: LA UNICA B/CNG CO.)
- KDCD (92.9 FM; SAN ANGELO, TX; Owner: REGENCY BROADCASTING)
- KMDX (106.1 FM; SAN ANGELO, TX; Owner: REGENCY BROADCASTING, INC.)
- KUTX (90.1 FM; SAN ANGELO, TX; Owner: THE UNIVERSITY OF TEXAS AT AUSTIN)
- KWFR (101.9 FM; SAN ANGELO, TX; Owner: FOSTER COMMUNICATIONS, INC.)
- KYZZ (100.1 FM; SAN ANGELO, TX; Owner: AUDREY EILEEN CARVER LUNA)
- KIXY-FM (94.7 FM; SAN ANGELO, TX; Owner: FOSTER COMMUNICATIONS COMPANY, INC.)
- KGKL-FM (97.5 FM; SAN ANGELO, TX; Owner: KGKL, INC.)
- KELI (98.7 FM; SAN ANGELO, TX; Owner: KGKL, INC.)
- KCSE (96.5 FM; STERLING CITY, TX; Owner: GRAHAM BROTHERS COMM., L.L.C..)
- KCRN-FM (93.9 FM; SAN ANGELO, TX; Owner: CRISWELL CENTER FOR BIBLICAL STUDIES)
- K215BH (90.9 FM; SAN ANGELO, TX; Owner: CHRISTIAN BROADCASTING COMPANY, INC.)
TV broadcast stations around West Tom Green:
- KIDY (Channel 6; SAN ANGELO, TX; Owner: SAGE BROADCASTING CORPORATION)
- KANG-CA (Channel 41; SAN ANGELO, TX; Owner: ENTRAVISION HOLDINGS, LLC)
- K44FJ (Channel 44; SAN ANGELO, TX; Owner: TRINITY BROADCASTING NETWORK)
- KEUS-LP (Channel 31; SAN ANGELO, TX; Owner: ENTRAVISION HOLDINGS, LLC)
- KTXE-LP (Channel 38; SAN ANGELO, TX; Owner: ABILENE-SWEETWATER BROADCASTING COMPANY)
- KPKS-LP (Channel 51; SAN ANGELO, TX; Owner: PRIME TIME CHRISTIAN BROADCASTING, INC)
- KLST (Channel 8; SAN ANGELO, TX; Owner: JEWELL TELEVISION CORPORATION)
- KACB-TV (Channel 3; SAN ANGELO, TX; Owner: MISSION BROADCASTING, INC.)
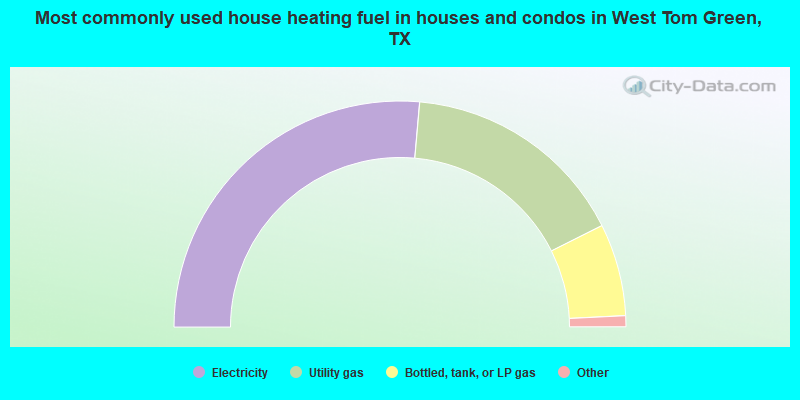
- 52.8%Electricity
- 32.4%Utility gas
- 13.2%Bottled, tank, or LP gas
- 0.8%Other fuel
- 0.6%Wood
- 0.2%Fuel oil, kerosene, etc.
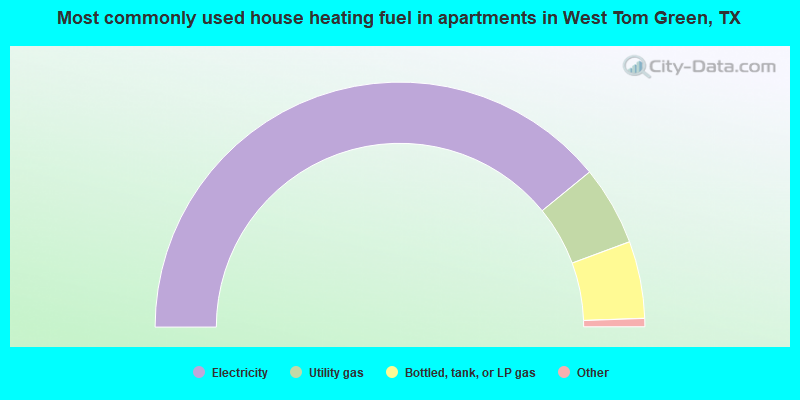
- 78.2%Electricity
- 10.5%Utility gas
- 10.2%Bottled, tank, or LP gas
- 0.6%Wood
- 0.5%Other fuel
West Tom Green compared to Texas state average:
- Unemployed percentage below state average.
- Black race population percentage significantly below state average.
- Hispanic race population percentage significantly below state average.
- Median age significantly above state average.
- Foreign-born population percentage significantly below state average.
- Renting percentage below state average.
- Length of stay since moving in significantly above state average.
- Number of rooms per house significantly below state average.
- House age significantly below state average.
West Tom Green on our top lists:
- #4 on the list of "Top 101 cities with largest percentage of females in industries: broadcasting and telecommunications (population 5,000+)"
- #27 on the list of "Top 101 cities with largest percentage of males in industries: broadcasting and telecommunications (population 5,000+)"
- #34 on the list of "Top 101 cities with largest percentage of males in occupations: extraction workers (population 5,000+)"
- #43 on the list of "Top 101 cities with largest percentage of males in industries: health care (population 5,000+)"
- #52 on the list of "Top 101 cities with largest percentage of females in industries: water transportation (population 5,000+)"
- #58 on the list of "Top 101 cities with largest percentage of females in industries: farm product raw materials merchant wholesalers (population 5,000+)"
- #66 on the list of "Top 100 cities with largest land areas (pop. 5,000+)"
- #70 on the list of "Top 101 cities with largest percentage of females in occupations: painters and paperhangers (population 5,000+)"
- #80 on the list of "Top 101 cities with largest percentage of males in industries: health and personal care, except drug, stores (population 5,000+)"
- #82 on the list of "Top 101 cities with largest percentage of males in industries: motor vehicle and parts dealers (population 5,000+)"
- #84 on the list of "Top 101 cities with largest percentage of females in industries: recyclable material merchant wholesalers (population 5,000+)"
- #90 on the list of "Top 101 cities with largest percentage of males in industries: leather and allied products (population 5,000+)"
- #92 on the list of "Top 101 cities with largest percentage of males in occupations: physicians and surgeons (population 5,000+)"
- #100 on the list of "Top 101 cities with the largest percentage of people in homes for the mentally retarded (population 1,000+)"
- #36 on the list of "Top 101 counties with the highest percentage of residents relocating to foreign countries in 2011"
- #56 on the list of "Top 101 counties with highest percentage of residents voting for Romney (Republican) in the 2012 Presidential Election (pop. 50,000+)"
- #82 on the list of "Top 101 counties with the highest percentage of residents relocating from foreign countries between 2010 and 2011 (pop. 50,000+)"