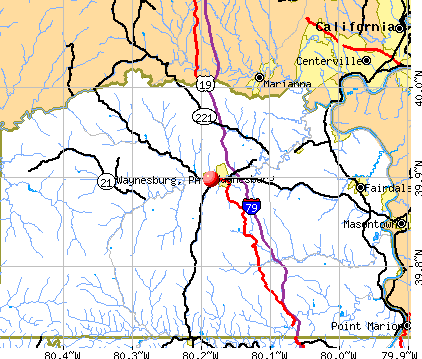
Waynesburg, Pennsylvania
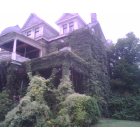
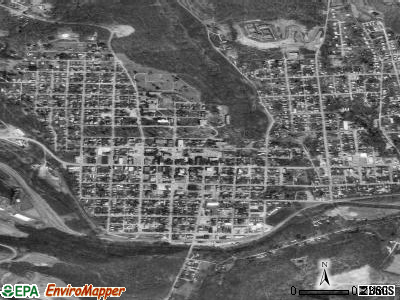
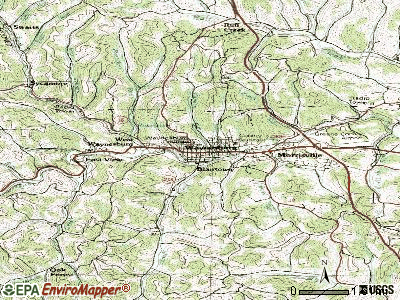
Waynesburg: Neighborhoods of Waynesburg,PA
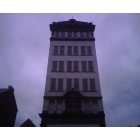
Waynesburg: Interesting tall lone standing building Waynesburg,PA
- add
your
Submit your own pictures of this borough and show them to the world
- OSM Map
- General Map
- Google Map
- MSN Map
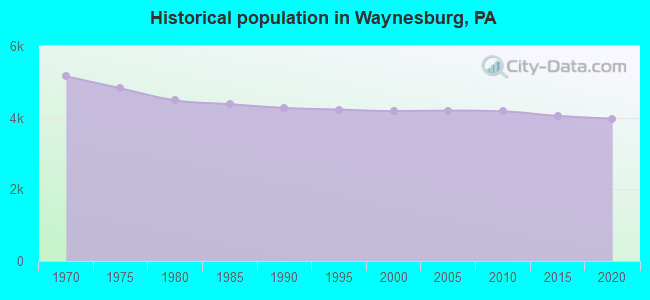
Population change since 2000: -9.0%
 |
| Males: 1,754 | |
| Females: 2,055 |
| Median resident age: | 24.3 years |
| Pennsylvania median age: | 40.9 years |
Zip codes: 15370.
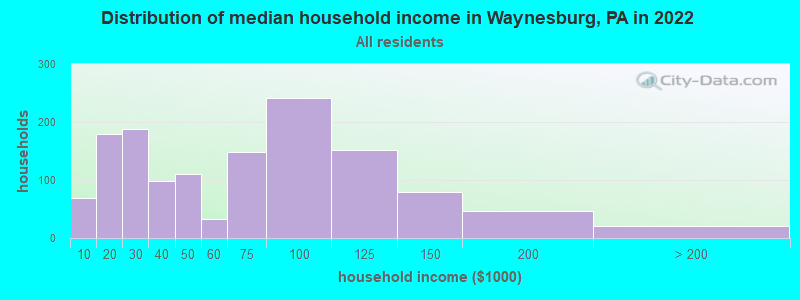
| Waynesburg: | $59,401 |
| PA: | $71,798 |
Estimated per capita income in 2022: $23,740 (it was $15,333 in 2000)
Waynesburg borough income, earnings, and wages data
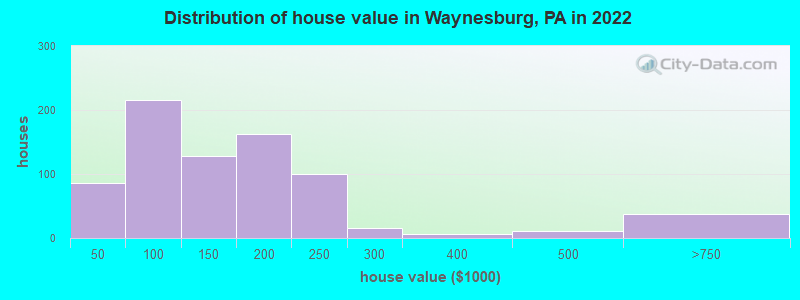
Estimated median house or condo value in 2022: $141,092 (it was $62,200 in 2000)
| Waynesburg: | $141,092 |
| PA: | $245,500 |
Mean prices in 2022: all housing units: $154,335; detached houses: $157,656; mobile homes: $14,407
Median gross rent in 2022: $812.
(14.2% for White Non-Hispanic residents, 50.0% for Black residents, 39.4% for two or more races residents)
Detailed information about poverty and poor residents in Waynesburg, PA


Compare current foreclosures near Waynesburg, PA:
| Photo | Address | Area | Beds / Baths | Price | Details |
|---|---|---|---|---|---|

|
#1
Homeville Rd
Waynesburg, PA 15370
|
- sq. feet
|
- baths - beds |
show details | |

|
#2
Colonial Dr
Waynesburg, PA 15370
|
- sq. feet
|
- baths - beds |
show details | |

|
#3
Cedar Ridge Rd
Waynesburg, PA 15370
|
- sq. feet
|
- baths - beds |
show details | |

|
#4
Happy Valley Rd
Waynesburg, PA 15370
|
- sq. feet
|
- baths - beds |
show details | |

|
#5
Greene Plz
Waynesburg, PA 15370
|
- sq. feet
|
- baths - beds |
show details | |

|
#6
S Church St # B
Waynesburg, PA 15370
|
- sq. feet
|
- baths - beds |
show details | |

|
#7
Sugar Run Rd
Waynesburg, PA 15370
|
- sq. feet
|
- baths - beds |
show details | |

|
#8
E Greene St
Waynesburg, PA 15370
|
- sq. feet
|
- baths - beds |
show details | |

|
#9
Homeville Rd
Waynesburg, PA 15370
|
- sq. feet
|
- baths - beds |
show details | |

|
#10
5th Ave
Waynesburg, PA 15370
|
- sq. feet
|
- baths - beds |
show details |
| Photo | Address | Area | Beds / Baths | Price | Details |
|---|---|---|---|---|---|

|
#11
Jefferson Ests
Waynesburg, PA 15370
|
- sq. feet
|
- baths - beds |
show details | |

|
#12
Race St
Waynesburg, PA 15370
|
- sq. feet
|
- baths - beds |
show details | |

|
#13
Stevenson St
Ronco, PA 15476
|
- sq. feet
|
2 baths 4 beds |
$16,500
|
show details |

|
#14
Single St
Carmichaels, PA 15320
|
1,178 sq. feet
|
1 baths 3 beds |
show details | |

|
#15
Old Mcclellandtown Rd
Mc Clellandtown, PA 15458
|
- sq. feet
|
1 baths 3 beds |
show details | |

|
#16
3rd St
Hiller, PA 17956
|
560 sq. feet
|
1 baths 2 beds |
show details | |

|
#17
Chapel Hill Rd
Claysville, PA 15323
|
2,438 sq. feet
|
2 baths 3 beds |
show details | |

|
#18
Ridgewood Dr
Fredericktown, PA 15333
|
2,077 sq. feet
|
2 baths 3 beds |
show details | |

|
#19
3rd Street
Isabella, PA 15447
|
854 sq. feet
|
1 baths 2 beds |
show details | |

|
#20
S Bridge Rd
Prosperity, PA 15329
|
1,370 sq. feet
|
1 baths 3 beds |
show details |
| Photo | Address | Area | Beds / Baths | Price | Details |
|---|---|---|---|---|---|

|
#21
Bethlehem Street
Fredericktown, PA 15333
|
- sq. feet
|
2 baths 3 beds |
show details | |

|
#22
Newton Ave
Fredericktown, PA 15333
|
1,739 sq. feet
|
2 baths 3 beds |
show details | |

|
#23
Low Hill Rd
Brownsville, PA 15417
|
1,239 sq. feet
|
1 baths 3 beds |
show details | |

|
#24
905 Oak St
Marianna, PA 15345
|
1,680 sq. feet
|
1 baths 4 beds |
show details | |

|
#25
N Eighty Eight Rd
Clarksville, PA 15322
|
1,691 sq. feet
|
1 baths 4 beds |
show details | |

|
#26
River St
Adah, PA 15410
|
1,792 sq. feet
|
1 baths 4 beds |
show details | |

|
#27
Firehouse Rd
Adah, PA 15410
|
1,826 sq. feet
|
1 baths 4 beds |
show details | |

|
#28
Gilmore Ave
Masontown, PA 15461
|
1,294 sq. feet
|
2 baths 3 beds |
show details | |

|
#29
Long St
Mc Clellandtown, PA 15458
|
952 sq. feet
|
1 baths 2 beds |
show details | |

|
#30
Heistersburg Rd
East Millsboro, PA 15433
|
2,270 sq. feet
|
2 baths 5 beds |
show details |
| Photo | Address | Area | Beds / Baths | Price | Details |
|---|---|---|---|---|---|

|
#31
Lagonda Rd
Washington, PA 15301
|
1,144 sq. feet
|
1 baths 3 beds |
show details | |

|
#32
Route 481
Fredericktown, PA 15333
|
1,350 sq. feet
|
1 baths 3 beds |
show details | |

|
#33
Peaceful Rd
Morgantown, WV 26501
|
1,440 sq. feet
|
2 baths 3 beds |
show details | |

|
#34
River Ave
Masontown, PA 15461
|
900 sq. feet
|
1 baths 2 beds |
show details | |

|
#35
Riverside Dr
La Belle, PA 15450
|
1,034 sq. feet
|
1 baths 2 beds |
show details | |

|
#36
Ball Hill Rd
Adah, PA 15410
|
2,192 sq. feet
|
1 baths 2 beds |
show details | |

|
#37
Ash St
Brownsville, PA 15417
|
1,258 sq. feet
|
1 baths 2 beds |
show details | |

|
#38
Mapletown Rd
Greensboro, PA 15338
|
- sq. feet
|
1 baths 3 beds |
show details | |

|
#39
S Ross St
Masontown, PA 15461
|
1,288 sq. feet
|
1 baths 3 beds |
show details | |

|
#40
Jefferson Ave
Masontown, PA 15461
|
1,188 sq. feet
|
1 baths 3 beds |
show details |
| Photo | Address | Area | Beds / Baths | Price | Details |
|---|---|---|---|---|---|

|
#41
High Ave
Masontown, PA 15461
|
1,757 sq. feet
|
2 baths 3 beds |
show details | |

|
#42
S Ross St
Masontown, PA 15461
|
1,524 sq. feet
|
2 baths 5 beds |
show details | |

|
#43
Jacobs Ferry Rd
Rices Landing, PA 15357
|
- sq. feet
|
2 baths 3 beds |
show details | |

|
#44
Low Hill Rd
Brownsville, PA 15417
|
1,700 sq. feet
|
1 baths 3 beds |
show details | |

|
#45
Pleasant Grove Rd
Claysville, PA 15323
|
1,620 sq. feet
|
1 baths 1 beds |
show details | |

|
#46
Weir Cole Rd
Prosperity, PA 15329
|
1,568 sq. feet
|
1 baths 3 beds |
show details | |

|
#47
Spring Rd
Brownsville, PA 15417
|
2,190 sq. feet
|
1 baths 3 beds |
show details | |

|
#48
Whitehall Rd
Daisytown, PA 15427
|
1,935 sq. feet
|
1 baths 4 beds |
show details | |

|
#49
Moninger Rd
Washington, PA 15301
|
980 sq. feet
|
1 baths 2 beds |
show details | |

|
Check over 1 million property listings on Foreclosure.com!
|
browse all offers | |||


- 3,61791.6%White alone
- 1313.3%Two or more races
- 711.8%Black alone
- 340.9%Asian alone
- 330.8%Other race alone
- 330.8%Hispanic
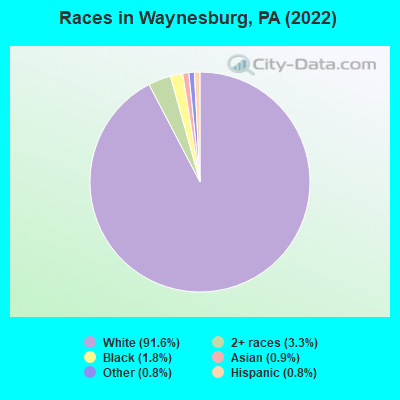
Races in Waynesburg detailed stats: ancestries, foreign born residents, place of birth
According to our research of Pennsylvania and other state lists, there were 199 registered sex offenders living in Waynesburg, Pennsylvania as of May 12, 2024.
The ratio of all residents to sex offenders in Waynesburg is 20 to 1.
Type |
2009 |
2010 |
2011 |
2012 |
2013 |
2014 |
2015 |
2016 |
2017 |
2018 |
2019 |
2020 |
2022 |
|---|---|---|---|---|---|---|---|---|---|---|---|---|---|
| Murders (per 100,000) | 0 (0.0) | 0 (0.0) | 0 (0.0) | 0 (0.0) | 0 (0.0) | 0 (0.0) | 0 (0.0) | 0 (0.0) | 0 (0.0) | 0 (0.0) | 0 (0.0) | 0 (0.0) | 0 (0.0) |
| Rapes (per 100,000) | 0 (0.0) | 0 (0.0) | 0 (0.0) | 0 (0.0) | 0 (0.0) | 1 (24.4) | 0 (0.0) | 0 (0.0) | 5 (126.1) | 3 (75.8) | 6 (150.2) | 1 (25.4) | 0 (0.0) |
| Robberies (per 100,000) | 1 (24.1) | 1 (23.9) | 0 (0.0) | 2 (46.2) | 1 (24.4) | 2 (48.7) | 0 (0.0) | 2 (49.7) | 2 (50.4) | 3 (75.8) | 1 (25.0) | 0 (0.0) | 0 (0.0) |
| Assaults (per 100,000) | 4 (96.5) | 6 (143.7) | 12 (286.5) | 12 (276.9) | 8 (194.8) | 12 (292.3) | 14 (339.6) | 7 (174.1) | 9 (227.0) | 8 (202.0) | 9 (225.2) | 12 (304.5) | 2 (51.7) |
| Burglaries (per 100,000) | 28 (675.7) | 30 (718.4) | 22 (525.2) | 11 (253.9) | 14 (341.0) | 40 (974.4) | 13 (315.4) | 10 (248.7) | 19 (479.2) | 7 (176.8) | 7 (175.2) | 6 (152.2) | 1 (25.8) |
| Thefts (per 100,000) | 96 (2,317) | 71 (1,700) | 55 (1,313) | 80 (1,846) | 71 (1,729) | 79 (1,924) | 119 (2,887) | 66 (1,641) | 61 (1,538) | 67 (1,692) | 57 (1,426) | 46 (1,167) | 6 (155.0) |
| Auto thefts (per 100,000) | 5 (120.7) | 1 (23.9) | 2 (47.7) | 3 (69.2) | 5 (121.8) | 2 (48.7) | 2 (48.5) | 1 (24.9) | 3 (75.7) | 5 (126.3) | 1 (25.0) | 2 (50.7) | 1 (25.8) |
| Arson (per 100,000) | 1 (24.1) | 0 (0.0) | 1 (23.9) | 0 (0.0) | 0 (0.0) | 0 (0.0) | 1 (24.3) | 0 (0.0) | 0 (0.0) | 0 (0.0) | 2 (50.1) | 0 (0.0) | 0 (0.0) |
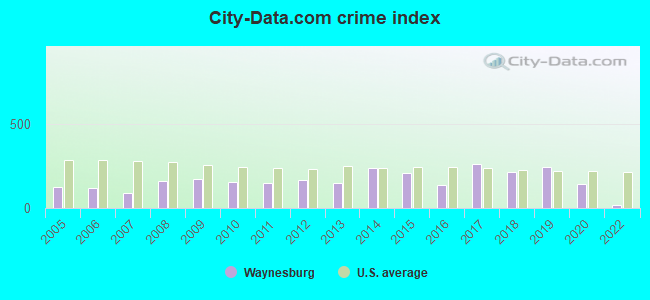
| City-Data.com crime index | 176.2 | 156.1 | 150.4 | 166.4 | 149.1 | 241.7 | 209.4 | 134.8 | 262.5 | 213.9 | 244.0 | 142.6 | 20.4 |
The City-Data.com crime index weighs serious crimes and violent crimes more heavily. Higher means more crime, U.S. average is 246.1. It adjusts for the number of visitors and daily workers commuting into cities.
Crime rate in Waynesburg detailed stats: murders, rapes, robberies, assaults, burglaries, thefts, arson
Full-time law enforcement employees in 2021, including police officers: 8 (8 officers - 6 male; 2 female).
| Officers per 1,000 residents here: | 2.09 |
| Pennsylvania average: | 2.55 |
 Recent articles from our blog. Our writers, many of them Ph.D. graduates or candidates, create easy-to-read articles on a wide variety of topics.

 | Pittsburgh or Paris (325 replies) |
| Pittsburgh MSA gains 86,000+ people overnight! (27 replies) |
| COVID 19 stats - ALLEGHENY COUNTY and beyond (1112 replies) |
| Local Universities and COVID-19 (92 replies) |
| Best place to live in PA that is close enough to Cleveland, OH and Charleston, WV (15 replies) |
| Why are Pittsburghers so rude? (179 replies) |
Latest news from Waynesburg, PA collected exclusively by city-data.com from local newspapers, TV, and radio stations
Ancestries: English (17.9%), German (16.4%), Irish (15.3%), American (14.6%), Polish (6.9%), Italian (5.6%).
Current Local Time: EST time zone
Incorporated on 01/20/1816
Elevation: 1034 feet
Land area: 0.83 square miles.
Population density: 4,587 people per square mile (average).
73 residents are foreign born
| This borough: | 1.8% |
| Pennsylvania: | 7.3% |
Median real estate property taxes paid for housing units with mortgages in 2022: $1,901 (1.2%)
Median real estate property taxes paid for housing units with no mortgage in 2022: $2,478 (2.0%)
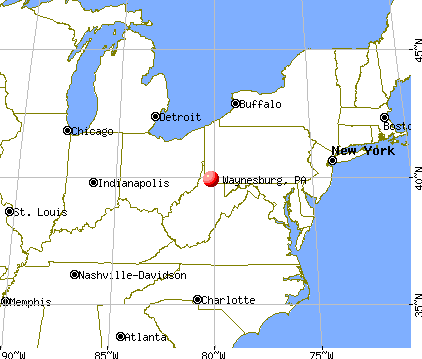
Nearest city with pop. 50,000+: Pittsburgh, PA  (39.2 miles , pop. 334,563).
Nearest city with pop. 1,000,000+: Philadelphia, PA (267.3 miles , pop. 1,517,550).
Nearest cities:
), ), ), ), ), Latitude: 39.90 N, Longitude: 80.19 W
Daytime population change due to commuting: +1,815 (+46.0%)
Workers who live and work in this borough: 490 (30.0%)
Area code: 724
Waynesburg, Pennsylvania accommodation & food services, waste management - Economy and Business Data
| Here: | 3.0% |
| Pennsylvania: | 2.9% |
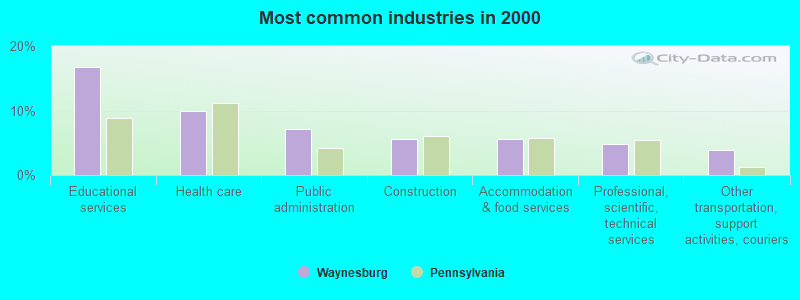
- Educational services (16.7%)
- Health care (10.0%)
- Public administration (7.2%)
- Construction (5.6%)
- Accommodation & food services (5.6%)
- Professional, scientific, technical services (4.8%)
- Other transportation, support activities, couriers (3.9%)
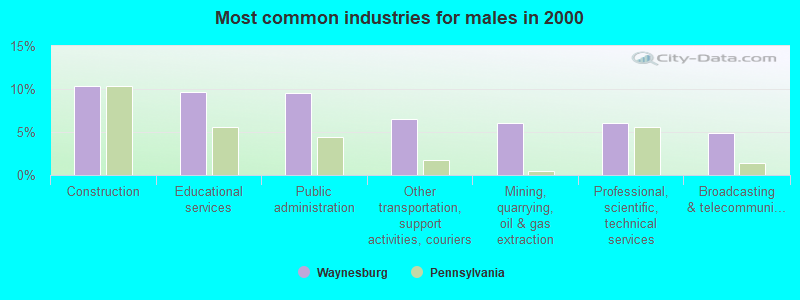
- Construction (10.3%)
- Educational services (9.7%)
- Public administration (9.6%)
- Other transportation, support activities, couriers (6.5%)
- Mining, quarrying, oil & gas extraction (6.1%)
- Professional, scientific, technical services (6.1%)
- Broadcasting & telecommunications (4.8%)
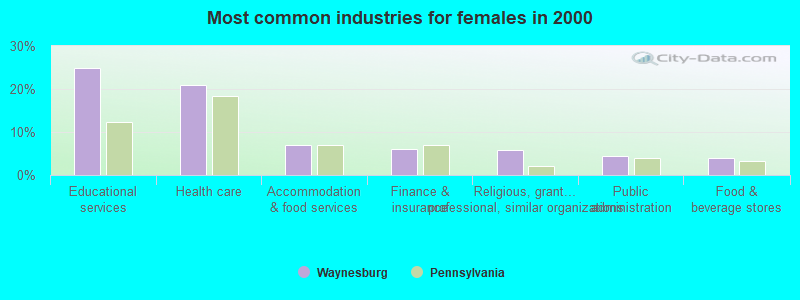
- Educational services (25.0%)
- Health care (20.9%)
- Accommodation & food services (7.1%)
- Finance & insurance (6.2%)
- Religious, grantmaking, civic, professional, similar organizations (5.9%)
- Public administration (4.3%)
- Food & beverage stores (3.9%)
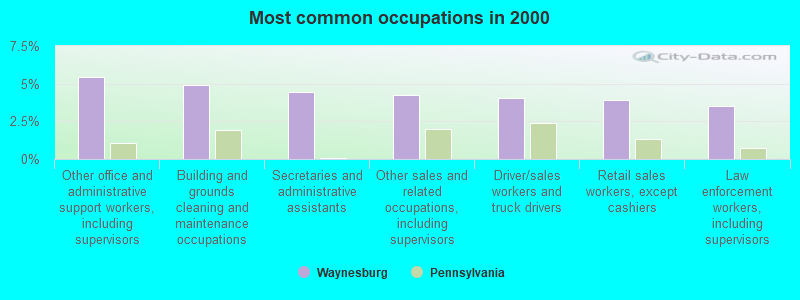
- Other office and administrative support workers, including supervisors (5.4%)
- Building and grounds cleaning and maintenance occupations (4.9%)
- Secretaries and administrative assistants (4.4%)
- Other sales and related occupations, including supervisors (4.2%)
- Driver/sales workers and truck drivers (4.1%)
- Retail sales workers, except cashiers (3.9%)
- Law enforcement workers, including supervisors (3.5%)
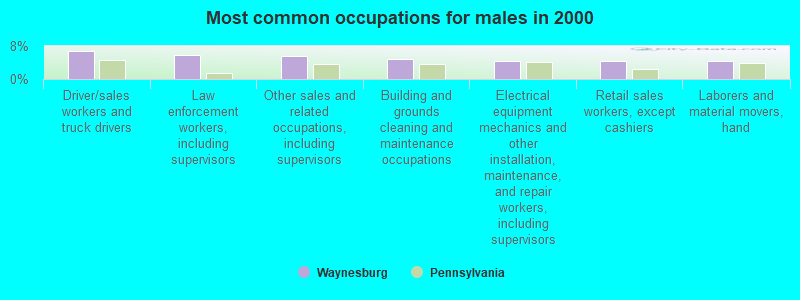
- Driver/sales workers and truck drivers (6.8%)
- Law enforcement workers, including supervisors (5.8%)
- Other sales and related occupations, including supervisors (5.5%)
- Building and grounds cleaning and maintenance occupations (5.0%)
- Electrical equipment mechanics and other installation, maintenance, and repair workers, including supervisors (4.4%)
- Retail sales workers, except cashiers (4.3%)
- Laborers and material movers, hand (4.3%)
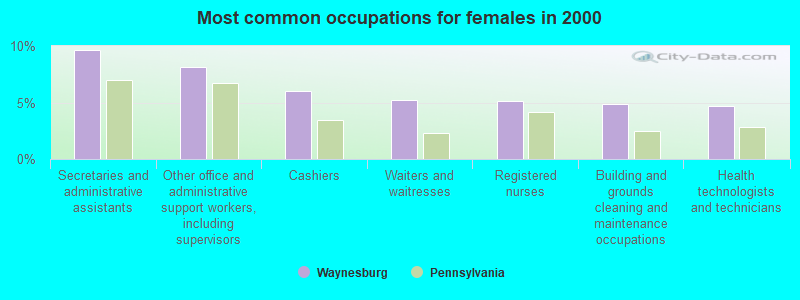
- Secretaries and administrative assistants (9.7%)
- Other office and administrative support workers, including supervisors (8.1%)
- Cashiers (6.0%)
- Waiters and waitresses (5.2%)
- Registered nurses (5.1%)
- Building and grounds cleaning and maintenance occupations (4.8%)
- Health technologists and technicians (4.7%)
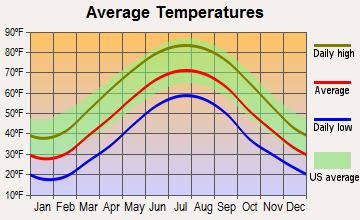
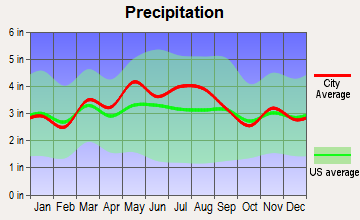
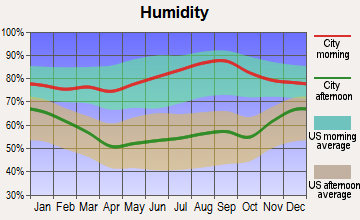
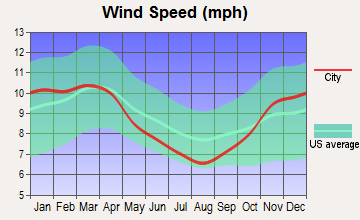
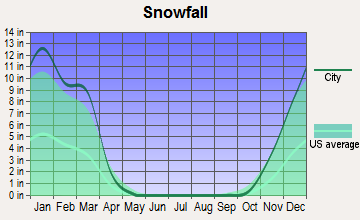
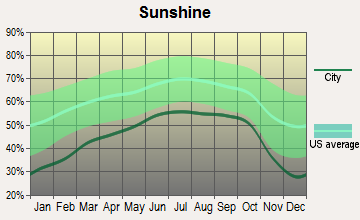
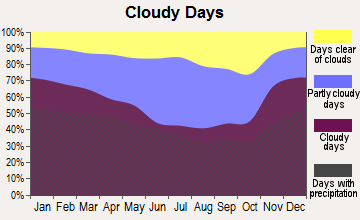
Average climate in Waynesburg, Pennsylvania
Based on data reported by over 4,000 weather stations
|
|


(lower is better)
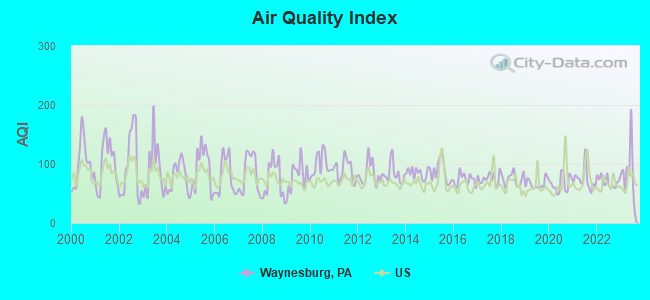
Air Quality Index (AQI) level in 2023 was 85.0. This is about average.
| City: | 85.0 |
| U.S.: | 72.6 |
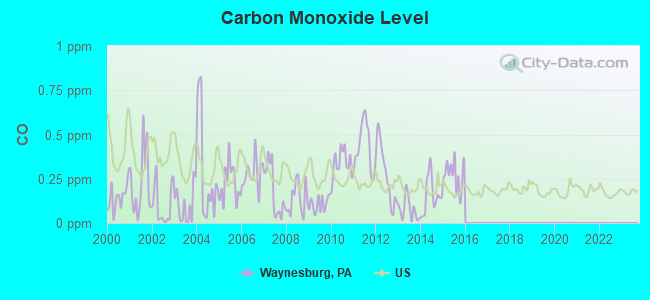
Carbon Monoxide (CO) [ppm] level in 2015 was 0.273. This is about average. Closest monitor was 7.4 miles away from the city center.
| City: | 0.273 |
| U.S.: | 0.251 |
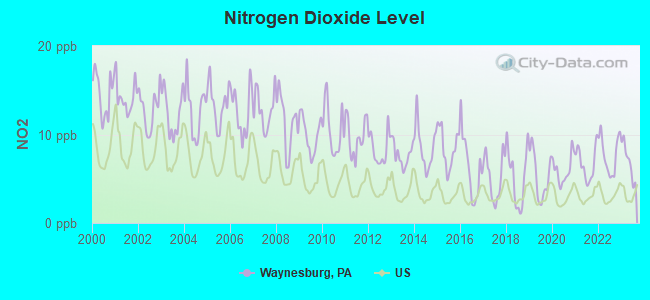
Nitrogen Dioxide (NO2) [ppb] level in 2023 was 7.00. This is worse than average. Closest monitor was 7.4 miles away from the city center.
| City: | 7.00 |
| U.S.: | 5.11 |
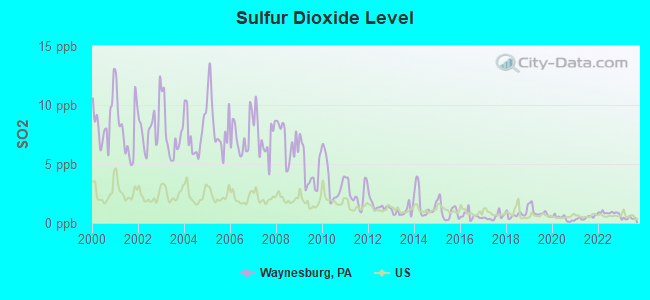
Sulfur Dioxide (SO2) [ppb] level in 2023 was 0.394. This is significantly better than average. Closest monitor was 7.4 miles away from the city center.
| City: | 0.394 |
| U.S.: | 1.515 |
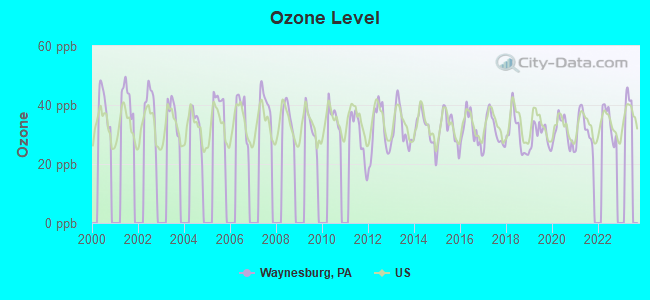
Ozone [ppb] level in 2022 was 34.2. This is about average. Closest monitor was 7.4 miles away from the city center.
| City: | 34.2 |
| U.S.: | 33.3 |
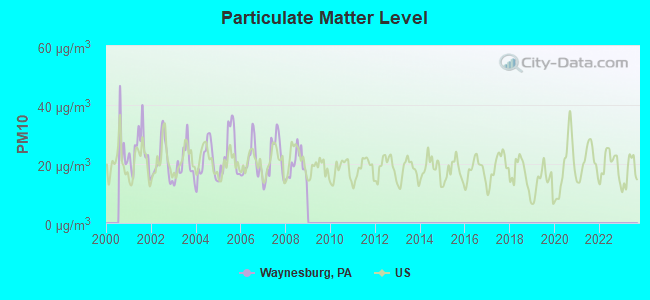
Particulate Matter (PM10) [µg/m3] level in 2008 was 19.6. This is about average. Closest monitor was 22.2 miles away from the city center.
| City: | 19.6 |
| U.S.: | 19.2 |
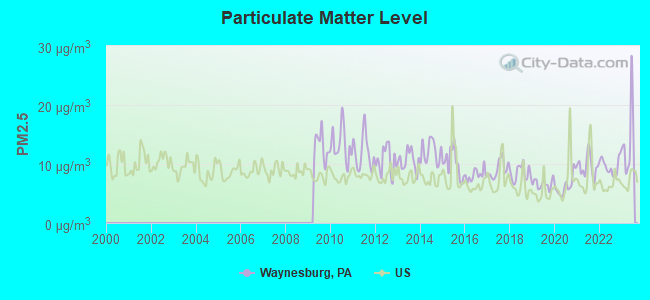
Particulate Matter (PM2.5) [µg/m3] level in 2023 was 13.9. This is significantly worse than average. Closest monitor was 19.3 miles away from the city center.
| City: | 13.9 |
| U.S.: | 8.1 |
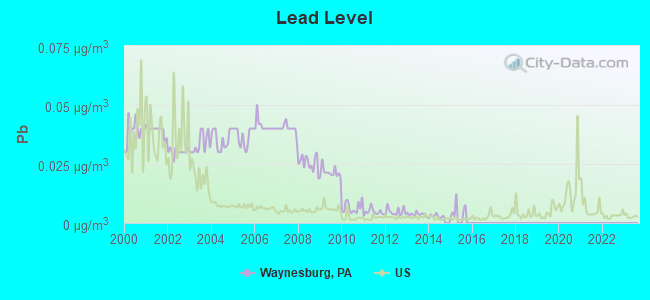
Lead (Pb) [µg/m3] level in 2014 was 0.00291. This is significantly better than average. Closest monitor was 17.8 miles away from the city center.
| City: | 0.00291 |
| U.S.: | 0.00931 |
Tornado activity:
Waynesburg-area historical tornado activity is below Pennsylvania state average. It is 43% smaller than the overall U.S. average.
On 6/3/1980, a category F3 (max. wind speeds 158-206 mph) tornado 29.6 miles away from the Waynesburg borough center injured 19 people and caused between $500,000 and $5,000,000 in damages.
On 8/3/1963, a category F3 tornado 33.4 miles away from the borough center killed 2 people and injured 70 people and caused between $5,000,000 and $50,000,000 in damages.
Earthquake activity:
Waynesburg-area historical earthquake activity is significantly above Pennsylvania state average. It is 43% smaller than the overall U.S. average.On 8/23/2011 at 17:51:04, a magnitude 5.8 (5.8 MW, Depth: 3.7 mi, Class: Moderate, Intensity: VI - VII) earthquake occurred 183.2 miles away from the city center
On 9/25/1998 at 19:52:52, a magnitude 5.2 (4.8 MB, 4.3 MS, 5.2 LG, 4.5 MW, Depth: 3.1 mi) earthquake occurred 110.8 miles away from the city center
On 1/31/1986 at 16:46:43, a magnitude 5.0 (5.0 MB) earthquake occurred 128.5 miles away from the city center
On 7/27/1980 at 18:52:21, a magnitude 5.2 (5.1 MB, 4.7 MS, 5.0 UK, 5.2 UK) earthquake occurred 233.3 miles away from Waynesburg center
On 8/9/2020 at 12:07:37, a magnitude 5.1 (5.1 MW, Depth: 4.7 mi) earthquake occurred 241.8 miles away from Waynesburg center
On 8/25/2011 at 05:07:52, a magnitude 4.5 (4.5 ML, Depth: 4.2 mi, Class: Light, Intensity: IV - V) earthquake occurred 180.1 miles away from the city center
Magnitude types: regional Lg-wave magnitude (LG), body-wave magnitude (MB), local magnitude (ML), surface-wave magnitude (MS), moment magnitude (MW)
Natural disasters:
The number of natural disasters in Greene County (13) is near the US average (15).Major Disasters (Presidential) Declared: 9
Emergencies Declared: 4
Causes of natural disasters: Floods: 3, Winter Storms: 3, Hurricanes: 2, Snowstorms: 2, Storms: 2, Blizzard: 1, Snowfall: 1, Tropical Depression: 1, Tropical Storm: 1, Other: 1 (Note: some incidents may be assigned to more than one category).
Hospitals and medical centers in Waynesburg:
- SOUTHWEST REGIONAL MEDICAL CENTER (Proprietary, provides emergency services, 350 BONAR AVENUE)
- GOLDEN LIVINGCENTER-WAYNESBURG (300 CENTER AVENUE)
- GREENE CNTY HOME/CURRY MEMORIAL (RD 2 BOX 60)
- GREENE HEALTH CARE CNTR (300 CENTER AVE)
- ROLLING MEADOWS (107 CURRY ROAD)
- DAVITA - WAYNESBURG DIALYSIS (248 ELM DRIVE)
- SOUTHWESTERN HOME CARE (265 ELM DRIVE SUITE 2)
Airports located in Waynesburg:
- Greene County Airport (WAY) (Runways: 1, Air Taxi Ops: 148, Itinerant Ops: 2,970, Local Ops: 9,900, Military Ops: 12)
Colleges/Universities in Waynesburg:
Other colleges/universities with over 2000 students near Waynesburg:
- California University of Pennsylvania (about 20 miles; California, PA; Full-time enrollment: 7,773)
- West Virginia University (about 22 miles; Morgantown, WV; FT enrollment: 27,429)
- Fairmont State University (about 29 miles; Fairmont, WV; FT enrollment: 3,714)
- West Liberty University (about 29 miles; West Liberty, WV; FT enrollment: 2,728)
- Pittsburgh Technical Institute (about 37 miles; Oakdale, PA; FT enrollment: 2,805)
- Point Park University (about 39 miles; Pittsburgh, PA; FT enrollment: 3,525)
- Duquesne University (about 39 miles; Pittsburgh, PA; FT enrollment: 8,211)
Public high schools in Waynesburg:
- WAYNESBURG CENTRAL HS (Students: 708, Location: 30 ZIMMERMAN DR, Grades: 9-12)
- GREENE COUNTY CTC (Students: 380, Location: 60 ZIMMERMAN DRIVE, Grades: 9-12)
- WEST GREENE HS (Students: 296, Location: 1352 HARGUS CREEK RD, Grades: 9-12)
Private high school in Waynesburg:
Public elementary/middle schools in Waynesburg:
- WAYNESBURG CENTRAL EL SCHOOL (Students: 812, Location: 90 ZIMMERMAN DR, Grades: KG-5)
- MILLER MS (Students: 520, Location: 126 E LINCOLN ST, Grades: 6-8)
- WEST GREENE MS (Students: 241, Location: 1352 HARGUS CREEK RD, Grades: 6-8)
Points of interest:
Notable locations in Waynesburg: Carl D Johnson Commons (A), Alumni Conference Building (B), Behl Humanites Building (C), Burns Hall (D), Denny Hall (E), Eberty Library (F), Goodwin House (G), Marisa Fieldhouse (H), Paul R Stewart Museum (I), Paul R Stewart Science Center (J), Pollock Hall (K), President's Home - Waynesburg College (L), Ray Hall (M), Stover Campus Center (N), Waynesburg Franklin Township Volunteer Fire Company (O). Display/hide their locations on the map
Cemetery: Green Mount Cemetery (1). Display/hide its location on the map
Streams, rivers, and creeks: Toll Gate Run (A), Purman Run (B). Display/hide their locations on the map
Parks in Waynesburg include: Veterans Memorial Plaza (1), College Field (2). Display/hide their locations on the map
Tourist attractions: Greene County Historical Society Museum (Cultural Attractions- Events- & Facilities; 918 Rolling Meadows Road), Cornerstone Genealogical Society (Cultural Attractions- Events- & Facilities; 144 East Greene Street).
Hotels: Comfort Inn Waynesburg (100 Comfort Lane), Econo Lodge Waynesburg (350 Miller Lane), Comfort Inn (100 Comfort Lane).
Birthplace of: Josh Koscheck - Martial artist, Arthur I. Boreman - Politician, Edward Shimborske, Jr. - Graphic designer, Bill George (American football player) - Football player, Dave Palone - Harness racer, Leon Pettit - Major League Baseball pitcher, Pete Knisely - Baseball player.
Drinking water stations with addresses in Waynesburg and their reported violations in the past:
LONE PINE STOP #1 (Population served: 100, Groundwater):Past monitoring violations:
- Monitoring, Source Water (GWR) - Between MAY-23-2011 and JUN-23-2011, Contaminant: E. COLI. Follow-up actions: St Violation/Reminder Notice (JUL-07-2011), St Compliance achieved (AUG-10-2011)
- 3 routine major monitoring violations
| This borough: | 2.2 people |
| Pennsylvania: | 2.5 people |
| This borough: | 51.2% |
| Whole state: | 65.0% |
| This borough: | 8.7% |
| Whole state: | 6.6% |
Likely homosexual households (counted as self-reported same-sex unmarried-partner households)
- Lesbian couples: 0.4% of all households
- Gay men: 0.0% of all households
People in group quarters in Waynesburg in 2010:
- 837 people in college/university student housing
- 16 people in other noninstitutional facilities
- 10 people in group homes intended for adults
People in group quarters in Waynesburg in 2000:
- 515 people in college dormitories (includes college quarters off campus)
- 18 people in homes for the mentally retarded
- 14 people in other noninstitutional group quarters
- 9 people in nursing homes
- 2 people in religious group quarters
Banks with branches in Waynesburg (2011 data):
- First Federal Savings and Loan Association of Greene Co: First Federal Savings And Loan Assoc at 25 East High St, branch established on 1924/01/01. Info updated 2011/07/21: Bank assets: $839.5 mil, Deposits: $723.9 mil, local headquarters, positive income, Mortgage Lending Specialization, 5 total offices
- PNC Bank, National Association: Waynesburg Branch at 77 West High Street, branch established on 1962/11/05. Info updated 2012/03/20: Bank assets: $263,309.6 mil, Deposits: $197,343.0 mil, headquarters in Wilmington, DE, positive income, Commercial Lending Specialization, 3085 total offices, Holding Company: Pnc Financial Services Group, Inc., The
- Woodforest National Bank: Waynesburg Pa Walmart Branch at 405 Murtha Drive, branch established on 2009/03/18. Info updated 2011/05/10: Bank assets: $3,488.9 mil, Deposits: $3,097.6 mil, headquarters in Houston, TX, positive income, Commercial Lending Specialization, 766 total offices, Holding Company: Woodforest Financial Group Employee Stock Ownership Plan (With 401(K) Provisions)
- Community Bank: Waynesburg Branch at 30 West Greene Street, branch established on 1980/07/01. Info updated 2009/11/19: Bank assets: $533.5 mil, Deposits: $450.9 mil, headquarters in Carmichaels, PA, positive income, Commercial Lending Specialization, 11 total offices, Holding Company: Cb Financial Services, Inc.
- First National Bank of Pennsylvania: Waynesburg Branch at 1 West High Street, branch established on 1968/11/18. Info updated 2012/01/10: Bank assets: $9,581.0 mil, Deposits: $7,462.2 mil, headquarters in Greenville, PA, positive income, Commercial Lending Specialization, 291 total offices, Holding Company: F.N.b. Corporation
For population 15 years and over in Waynesburg:
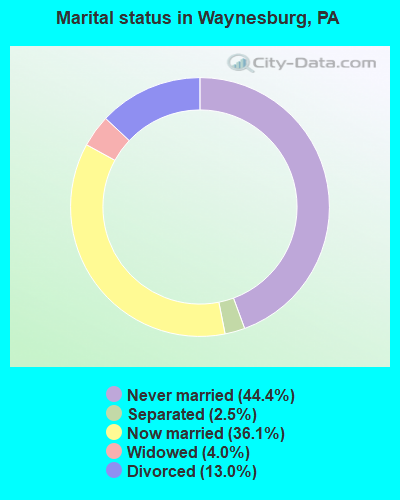
- Never married: 44.4%
- Now married: 36.1%
- Separated: 2.5%
- Widowed: 4.0%
- Divorced: 13.0%
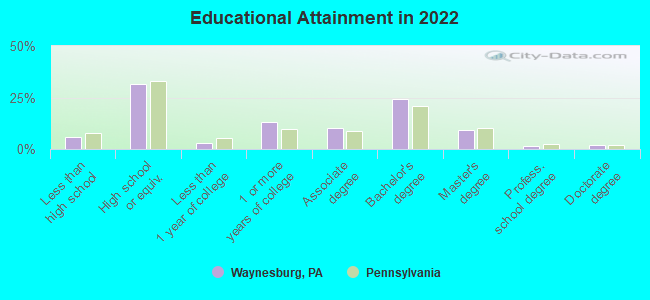
For population 25 years and over in Waynesburg:
- High school or higher: 93.8%
- Bachelor's degree or higher: 35.5%
- Graduate or professional degree: 12.2%
- Unemployed: 20.0%
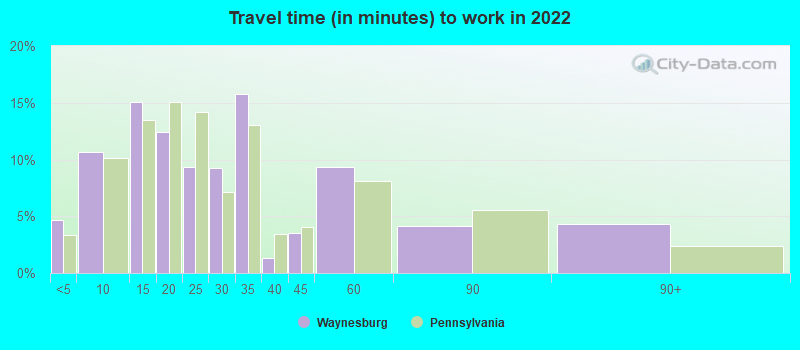
- Mean travel time to work (commute): 21.0 minutes
| Here: | 10.8 |
| Pennsylvania average: | 11.4 |
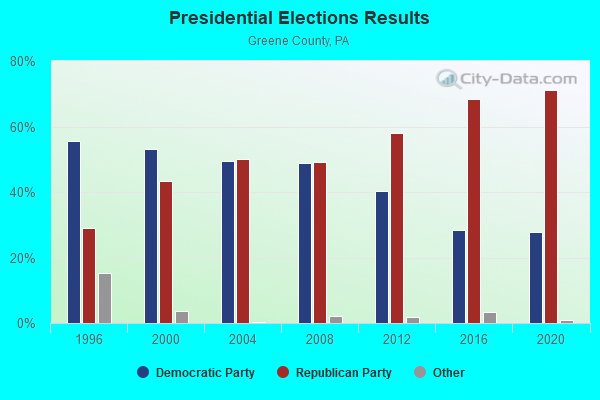
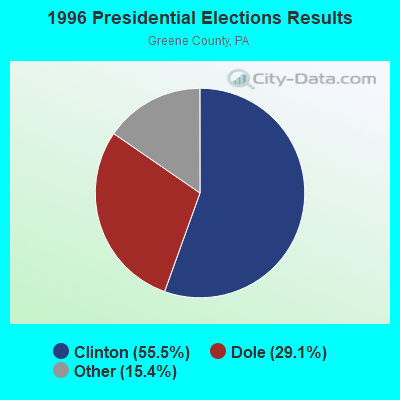
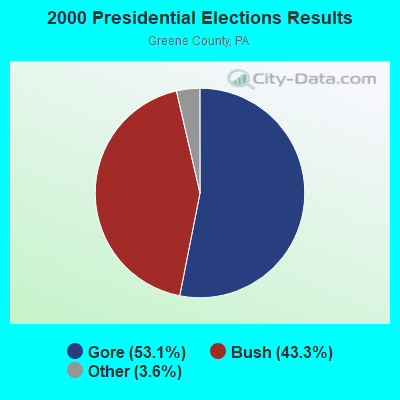

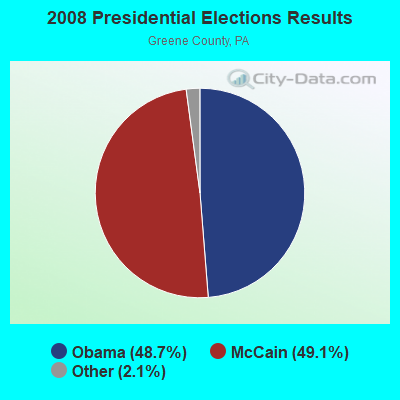
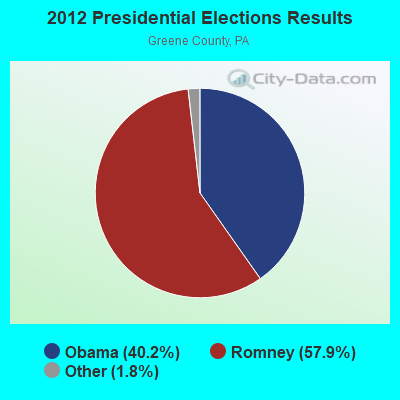
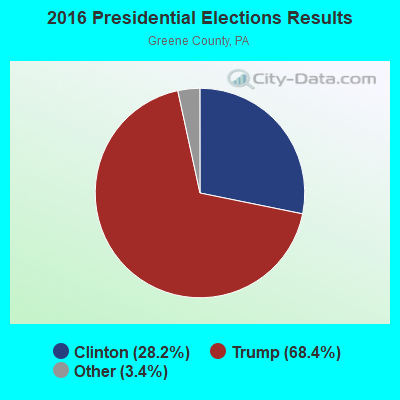
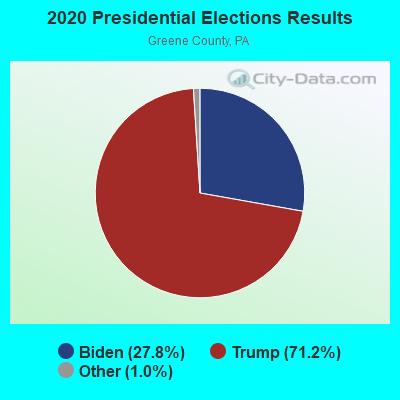
Graphs represent county-level data. Detailed 2008 Election Results
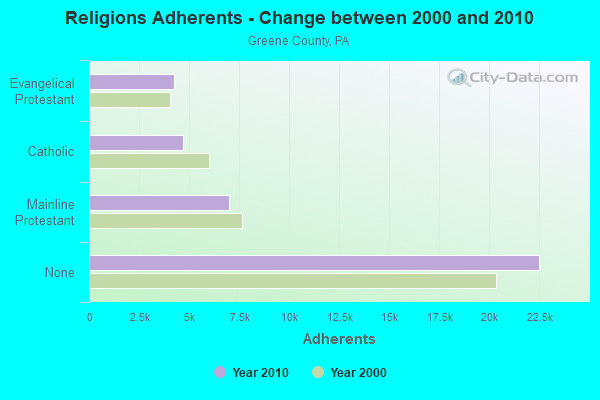
Religion statistics for Waynesburg, PA (based on Greene County data)
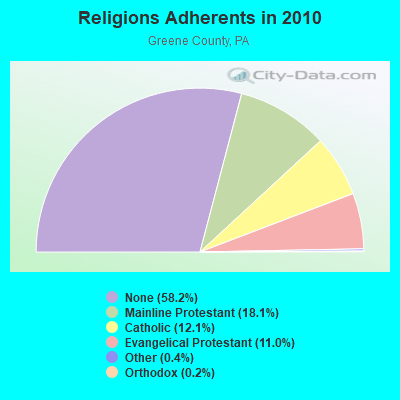
| Religion | Adherents | Congregations |
|---|---|---|
| Mainline Protestant | 7,006 | 51 |
| Catholic | 4,680 | 8 |
| Evangelical Protestant | 4,260 | 32 |
| Other | 167 | 4 |
| Orthodox | 73 | 1 |
| None | 22,500 | - |
Food Environment Statistics:
| This county: | 1.78 / 10,000 pop. |
| State: | 2.04 / 10,000 pop. |
| This county: | 1.02 / 10,000 pop. |
| Pennsylvania: | 0.88 / 10,000 pop. |
| Here: | 4.06 / 10,000 pop. |
| State: | 2.52 / 10,000 pop. |
| Here: | 5.33 / 10,000 pop. |
| State: | 7.12 / 10,000 pop. |
| Greene County: | 10.2% |
| Pennsylvania: | 9.1% |
| Greene County: | 29.4% |
| State: | 27.2% |
| Greene County: | 12.2% |
| Pennsylvania: | 11.5% |
Health and Nutrition:
| Waynesburg: | 47.1% |
| State: | 50.2% |
| Waynesburg: | 40.6% |
| Pennsylvania: | 47.1% |
| Waynesburg: | 27.2 |
| State: | 28.7 |
| Here: | 20.4% |
| Pennsylvania: | 20.8% |
| Here: | 14.6% |
| Pennsylvania: | 10.9% |
| Here: | 6.6 |
| State: | 6.8 |
| This city: | 27.4% |
| Pennsylvania: | 34.3% |
| Waynesburg: | 51.6% |
| Pennsylvania: | 56.2% |
| Here: | 82.5% |
| Pennsylvania: | 78.3% |
More about Health and Nutrition of Waynesburg, PA Residents
| Local government employment and payroll (March 2022) | |||||
| Function | Full-time employees | Monthly full-time payroll | Average yearly full-time wage | Part-time employees | Monthly part-time payroll |
|---|---|---|---|---|---|
| Police Protection - Officers | 8 | $37,915 | $56,873 | 5 | $4,743 |
| Sewerage | 4 | $27,337 | $82,011 | 0 | $0 |
| Streets and Highways | 4 | $13,998 | $41,994 | 1 | $221 |
| Other Government Administration | 0 | $0 | 12 | $2,889 | |
| Police - Other | 0 | $0 | 3 | $2,584 | |
| Totals for Government | 16 | $79,251 | $59,438 | 21 | $10,438 |
Waynesburg government finances - Expenditure in 2017 (per resident):
- Current Operations - Police Protection: $554,000 ($145.44)
General - Other: $521,000 ($136.78)
Sewerage: $500,000 ($131.27)
Regular Highways: $281,000 ($73.77)
Central Staff Services: $238,000 ($62.48)
Housing and Community Development: $94,000 ($24.68)
Local Fire Protection: $65,000 ($17.06)
Parks and Recreation: $41,000 ($10.76)
Libraries: $1,000 ($0.26)
Waynesburg government finances - Revenue in 2017 (per resident):
- Charges - Sewerage: $653,000 ($171.44)
Other: $74,000 ($19.43)
Parking Facilities: $73,000 ($19.17)
Parks and Recreation: $31,000 ($8.14)
- Federal Intergovernmental - Other: $3,000 ($0.79)
- Local Intergovernmental - Other: $5,000 ($1.31)
- Miscellaneous - Fines and Forfeits: $102,000 ($26.78)
Interest Earnings: $76,000 ($19.95)
Donations From Private Sources: $18,000 ($4.73)
General Revenue - Other: $6,000 ($1.58)
- State Intergovernmental - Other: $462,000 ($121.29)
- Tax - Property: $594,000 ($155.95)
Individual Income: $351,000 ($92.15)
Occupation and Business License - Other: $118,000 ($30.98)
Public Utility License: $31,000 ($8.14)
Documentary and Stock Transfer: $25,000 ($6.56)
Waynesburg government finances - Cash and Securities in 2017 (per resident):
- Other Funds - Cash and Securities: $2,072,000 ($543.97)
| Businesses in Waynesburg, PA | ||||
| Name | Count | Name | Count | |
|---|---|---|---|---|
| 7-Eleven | 1 | KFC | 1 | |
| ALDI | 1 | Lane Furniture | 1 | |
| AT&T | 1 | Little Caesars Pizza | 1 | |
| Ace Hardware | 2 | MasterBrand Cabinets | 1 | |
| Advance Auto Parts | 1 | McDonald's | 2 | |
| AutoZone | 1 | Microtel | 1 | |
| Burger King | 1 | Nike | 1 | |
| CVS | 1 | Pizza Hut | 1 | |
| Chevrolet | 1 | RadioShack | 1 | |
| Circle K | 1 | Rite Aid | 1 | |
| Comfort Inn | 1 | Subaru | 1 | |
| Dairy Queen | 1 | Subway | 2 | |
| Domino's Pizza | 1 | Super 8 | 1 | |
| Econo Lodge | 1 | U-Haul | 2 | |
| Fashion Bug | 1 | UPS | 2 | |
| FedEx | 3 | Walgreens | 1 | |
| GNC | 1 | Walmart | 1 | |
| H&R Block | 1 | Wendy's | 1 | |
| Hardee's | 1 | |||
Strongest AM radio stations in Waynesburg:
- WANB (1580 AM; daytime; 1 kW; WAYNESBURG, PA; Owner: BROADCAST COMMUNICATIONS, INC.)
- WWVA (1170 AM; 53 kW; WHEELING, WV; Owner: CAPSTAR TX LIMITED PARTNERSHIP)
- KDKA (1020 AM; 50 kW; PITTSBURGH, PA; Owner: INFINITY BROADCASTING OPERATIONS, INC.)
- WASP (1130 AM; daytime; 5 kW; BROWNSVILLE, PA; Owner: KEYMARKET LICENSES, LLC)
- WWCS (540 AM; 5 kW; CANONSBURG, PA; Owner: BIRACH BROADCASTING CORPORATION)
- WAJR (1440 AM; 5 kW; MORGANTOWN, WV; Owner: WEST VIRGINIA RADIO CORPORATION)
- WMMN (920 AM; 5 kW; FAIRMONT, WV; Owner: FANTASIA BROADCASTING, INC.)
- WKHB (620 AM; 6 kW; IRWIN, PA; Owner: BROADCAST COMMUNICATIONS, INC.)
- WCLG (1300 AM; 2 kW; MORGANTOWN, WV; Owner: BOWERS BROADCASTING CORP.)
- WPIT (730 AM; 5 kW; PITTSBURGH, PA; Owner: PENNSYLVANIA MEDIA ASSOCIATES, INC.)
- WVLY (1370 AM; 5 kW; MOUNDSVILLE, WV; Owner: SCOTT RADIO GROUP, LLC)
- WTVN (610 AM; 50 kW; COLUMBUS, OH; Owner: CITICASTERS LICENSES, L.P.)
- WKNR (850 AM; 50 kW; CLEVELAND, OH; Owner: CARON BROADCASTING, INC.)
Strongest FM radio stations in Waynesburg:
- WCYJ-FM (88.7 FM; WAYNESBURG, PA; Owner: THE WAYNESBURG COLLEGE)
- WANB-FM (103.1 FM; WAYNESBURG, PA; Owner: BROADCAST COMMUNICATIONS, INC.)
- WVPM (90.9 FM; MORGANTOWN, WV; Owner: WEST VIRGINIA EDUCATIONAL BROADCASTING AUTHORITY)
- WOGG (94.9 FM; OLIVER, PA; Owner: KEYMARKET LICENSES, LLC)
- WYFU (88.5 FM; MASONTOWN, PA; Owner: BIBLE BROADCASTING NETORK, INC.)
- WRIJ (106.9 FM; MASONTOWN, PA; Owner: HE'S ALIVE INC.)
- WOVK (98.7 FM; WHEELING, WV; Owner: CAPSTAR TX LIMITED PARTNERSHIP)
- WEGW (107.5 FM; WHEELING, WV; Owner: CAPSTAR TX LIMITED PARTNERSHIP)
- WVAQ (101.9 FM; MORGANTOWN, WV; Owner: WEST VIRGINIA RADIO CORPORATION)
- WJPA-FM (95.3 FM; WASHINGTON, PA; Owner: WASHINGTON BROADCASTING COMPANY)
- WRKP (96.5 FM; MOUNDSVILLE, WV; Owner: RKP INTERNATIONAL CORP.)
- WOGH (103.5 FM; BURGETTSTOWN, PA; Owner: KEYMARKET LICENSES, LLC)
- WSHH (99.7 FM; PITTSBURGH, PA; Owner: RENDA B/CING CORP. OF NEVADA)
- WLSW (103.9 FM; SCOTTDALE, PA; Owner: L. STANLEY WALL)
- WBVQ (93.1 FM; BARRACKVILLE, WV; Owner: CAT RADIO, INC.)
- WEEL (95.7 FM; SHADYSIDE, OH; Owner: OHIO VALLEY COMMUNICATIONS, INC.)
- WLTJ (92.9 FM; PITTSBURGH, PA; Owner: WPNT, INC.)
- WKKW (97.9 FM; FAIRMONT, WV; Owner: DESCENDANTS TRUST, LAUREN M.KELLEY, TRUSTEE)
- WVNP (89.9 FM; WHEELING, WV; Owner: WEST VIRGINIA EDUCATIONAL BROADCASTING AUTHORITY)
- WGYE (102.7 FM; MANNINGTON, WV; Owner: BURBACH OF DE, LLC)
TV broadcast stations around Waynesburg:
- WTOV-TV (Channel 9; STEUBENVILLE, OH; Owner: WTOV-TV HOLDINGS, INC.)
- WTAE-TV (Channel 4; PITTSBURGH, PA; Owner: WTAE HEARST-ARGYLE TV, INC. (CA CORP.))
- WTRF-TV (Channel 7; WHEELING, WV; Owner: WEST VIRGINIA MEDIA HOLDINGS, LLC)
- WPXI (Channel 11; PITTSBURGH, PA; Owner: WPXI-TV HOLDINGS, INC.)
- WBGN-LP (Channel 59; PITTSBURGH, PA; Owner: BRUNO GOODWORTH NETWORK, INC.)
- WPTG-LP (Channel 69; PITTSBURGH, PA; Owner: ABACUS TELEVISION)
- W65CG (Channel 65; PITTSBURGH, PA; Owner: TRINITY BROADCASTING NETWORK)
- WNPB-TV (Channel 24; MORGANTOWN, WV; Owner: WEST VIRGINIA EDUCATIONAL BROADCASTING AUTHORITY)
- WQEX (Channel 16; PITTSBURGH, PA; Owner: WQED MULTIMEDIA)
- WPCB-TV (Channel 40; GREENSBURG, PA; Owner: CORNERSTONE TELEVISION, INC.)
- W26AV (Channel 26; CHARLEROI, PA; Owner: DEBRA GOODWORTH)
- W20AN (Channel 20; WASHINGTON, PA; Owner: TURNPIKE TELEVISION)
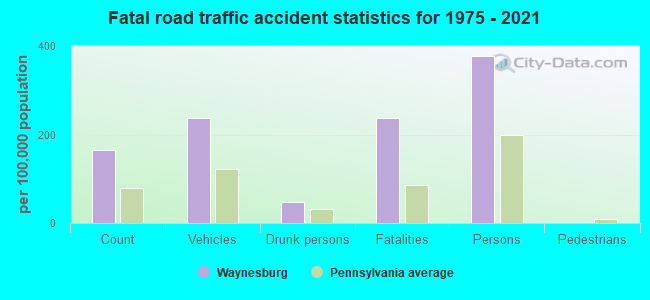
Waynesburg fatal accident list:
Sep 25, 2012 03:11 PM, 7th St, Woodland Av, Lat: 39.899717, Lon: -80.176647, Vehicles: 1, Persons: 2, Fatalities: 2
Feb 2, 2009 06:36 AM, Richhill St, First St, Lat: 39.892047, Lon: -80.190100, Vehicles: 1, Persons: 1, Fatalities: 1
Mar 11, 2001 00:51 AM, Sr-21, Vehicles: 2, Persons: 3, Fatalities: 2, Drunk persons involved: 1
Jun 15, 1992 10:35 PM, 19, Vehicles: 2, Persons: 4, Fatalities: 1
May 27, 1988 08:48 PM, 19, Vehicles: 1, Persons: 2, Fatalities: 1, Drunk persons involved: 1
May 13, 1986 01:04 PM, Strawberry, Vehicles: 1, Persons: 2, Fatalities: 2
- National Bridge Inventory (NBI) Statistics
- 8Number of bridges
- 95ft / 29.2mTotal length
- $823,000Total costs
- 7,020Total average daily traffic
- 515Total average daily truck traffic
FCC Registered Antenna Towers: 100 (See the full list of FCC Registered Antenna Towers)
FCC Registered Commercial Land Mobile Towers: 1 (See the full list of FCC Registered Commercial Land Mobile Towers in Waynesburg, PA)
FCC Registered Broadcast Land Mobile Towers: 23 (See the full list of FCC Registered Broadcast Land Mobile Towers)
FCC Registered Microwave Towers: 29 (See the full list of FCC Registered Microwave Towers in this town)
FCC Registered Paging Towers: 2 (See the full list of FCC Registered Paging Towers)
FCC Registered Amateur Radio Licenses: 48 (See the full list of FCC Registered Amateur Radio Licenses in Waynesburg)
FAA Registered Aircraft: 8 (See the full list of FAA Registered Aircraft in Waynesburg)
2003 - 2018 National Fire Incident Reporting System (NFIRS) incidents
- Fire incident types reported to NFIRS in Waynesburg, PA
- 27445.4%Structure Fires
- 18029.8%Outside Fires
- 14223.5%Mobile Property/Vehicle Fires
- 81.3%Other
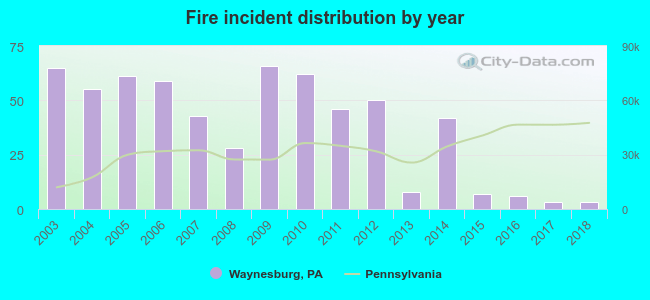 Based on the data from the years 2003 - 2018 the average number of fires per year is 38. The highest number of reported fire incidents - 66 took place in 2009, and the least - 3 in 2017. The data has a declining trend.
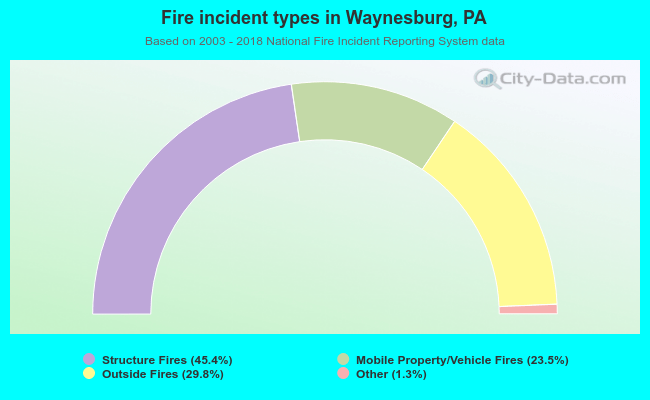 When looking into fire subcategories, the most reports belonged to: Structure Fires (45.4%), and Outside Fires (29.8%).
Fire-safe hotels and motels in Waynesburg, Pennsylvania:
- Hampton Inn Waynesburg, 227 Greene Plz, Waynesburg, Pennsylvania 15370 , Phone: (724) 802-1010
- Microtel Inn & Suites By Wyndham Waynesburg, 300 Comfort Ln, Waynesburg, Pennsylvania 15370 , Phone: (724) 627-0310, Fax: (724) 627-5102
| Most common first names in Waynesburg, PA among deceased individuals | ||
| Name | Count | Lived (average) |
|---|---|---|
| Mary | 179 | 80.8 years |
| John | 166 | 76.6 years |
| William | 158 | 74.4 years |
| Charles | 139 | 75.3 years |
| James | 120 | 76.5 years |
| Ruth | 86 | 78.5 years |
| Margaret | 84 | 81.8 years |
| Robert | 79 | 69.8 years |
| George | 75 | 76.5 years |
| Helen | 63 | 78.3 years |
| Most common last names in Waynesburg, PA among deceased individuals | ||
| Last name | Count | Lived (average) |
|---|---|---|
| Morris | 68 | 76.2 years |
| Phillips | 62 | 78.9 years |
| Kiger | 54 | 73.9 years |
| Moore | 49 | 79.9 years |
| Wilson | 46 | 77.3 years |
| Smith | 46 | 78.5 years |
| Patterson | 43 | 81.5 years |
| Fox | 41 | 76.5 years |
| Miller | 40 | 74.6 years |
| Thomas | 39 | 76.1 years |
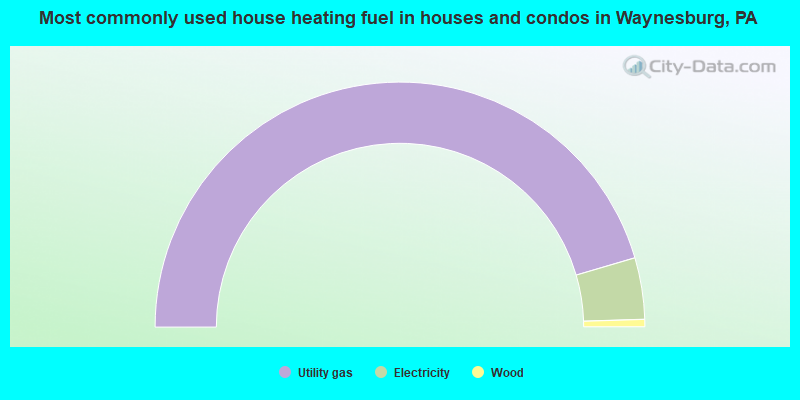
- 90.9%Utility gas
- 8.1%Electricity
- 1.0%Wood
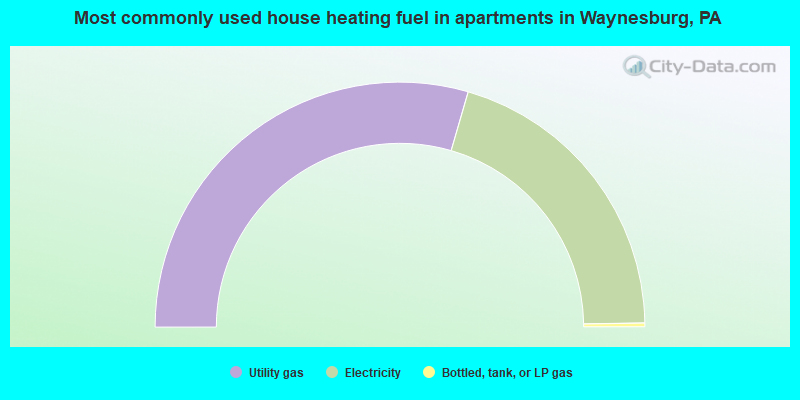
- 59.0%Utility gas
- 40.5%Electricity
- 0.5%Bottled, tank, or LP gas
Waynesburg compared to Pennsylvania state average:
- Median house value below state average.
- Black race population percentage significantly below state average.
- Hispanic race population percentage significantly below state average.
- Median age significantly below state average.
- Foreign-born population percentage significantly below state average.
- Renting percentage above state average.
- Length of stay since moving in above state average.
- Number of college students significantly above state average.

|
|
Total of 21 patent applications in 2008-2024.