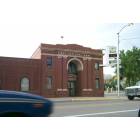
Walsenburg, Colorado Submit your own pictures of this city and show them to the world
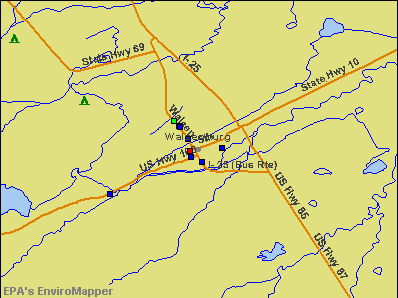
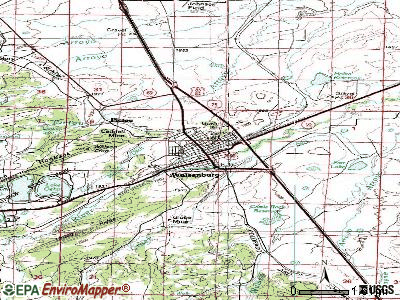
OSM Map
General Map
Google Map
MSN Map
OSM Map
General Map
Google Map
MSN Map
OSM Map
General Map
Google Map
MSN Map
OSM Map
General Map
Google Map
MSN Map
Please wait while loading the map...
Population in 2022: 3,111 (95% urban, 5% rural). Population change since 2000: -25.6%Males: 1,682 Females: 1,429
March 2022 cost of living index in Walsenburg: 81.8 (low, U.S. average is 100) Percentage of residents living in poverty in 2022: 28.2%for White Non-Hispanic residents , 28.7% for Hispanic or Latino residents , 22.2% for American Indian residents , 36.2% for other race residents , 26.9% for two or more races residents )Business Search - 14 Million verified businesses
Data:
Median household income ($)
Median household income (% change since 2000)
Household income diversity
Ratio of average income to average house value (%)
Ratio of average income to average rent
Median household income ($) - White
Median household income ($) - Black or African American
Median household income ($) - Asian
Median household income ($) - Hispanic or Latino
Median household income ($) - American Indian and Alaska Native
Median household income ($) - Multirace
Median household income ($) - Other Race
Median household income for houses/condos with a mortgage ($)
Median household income for apartments without a mortgage ($)
Races - White alone (%)
Races - White alone (% change since 2000)
Races - Black alone (%)
Races - Black alone (% change since 2000)
Races - American Indian alone (%)
Races - American Indian alone (% change since 2000)
Races - Asian alone (%)
Races - Asian alone (% change since 2000)
Races - Hispanic (%)
Races - Hispanic (% change since 2000)
Races - Native Hawaiian and Other Pacific Islander alone (%)
Races - Native Hawaiian and Other Pacific Islander alone (% change since 2000)
Races - Two or more races (%)
Races - Two or more races (% change since 2000)
Races - Other race alone (%)
Races - Other race alone (% change since 2000)
Racial diversity
Unemployment (%)
Unemployment (% change since 2000)
Unemployment (%) - White
Unemployment (%) - Black or African American
Unemployment (%) - Asian
Unemployment (%) - Hispanic or Latino
Unemployment (%) - American Indian and Alaska Native
Unemployment (%) - Multirace
Unemployment (%) - Other Race
Population density (people per square mile)
Population - Males (%)
Population - Females (%)
Population - Males (%) - White
Population - Males (%) - Black or African American
Population - Males (%) - Asian
Population - Males (%) - Hispanic or Latino
Population - Males (%) - American Indian and Alaska Native
Population - Males (%) - Multirace
Population - Males (%) - Other Race
Population - Females (%) - White
Population - Females (%) - Black or African American
Population - Females (%) - Asian
Population - Females (%) - Hispanic or Latino
Population - Females (%) - American Indian and Alaska Native
Population - Females (%) - Multirace
Population - Females (%) - Other Race
Coronavirus confirmed cases (May 24, 2024)
Deaths caused by coronavirus (May 24, 2024)
Coronavirus confirmed cases (per 100k population) (May 24, 2024)
Deaths caused by coronavirus (per 100k population) (May 24, 2024)
Daily increase in number of cases (May 24, 2024)
Weekly increase in number of cases (May 24, 2024)
Cases doubled (in days) (May 24, 2024)
Hospitalized patients (Apr 18, 2022)
Negative test results (Apr 18, 2022)
Total test results (Apr 18, 2022)
COVID Vaccine doses distributed (per 100k population) (Sep 19, 2023)
COVID Vaccine doses administered (per 100k population) (Sep 19, 2023)
COVID Vaccine doses distributed (Sep 19, 2023)
COVID Vaccine doses administered (Sep 19, 2023)
Likely homosexual households (%)
Likely homosexual households (% change since 2000)
Likely homosexual households - Lesbian couples (%)
Likely homosexual households - Lesbian couples (% change since 2000)
Likely homosexual households - Gay men (%)
Likely homosexual households - Gay men (% change since 2000)
Cost of living index
Median gross rent ($)
Median contract rent ($)
Median monthly housing costs ($)
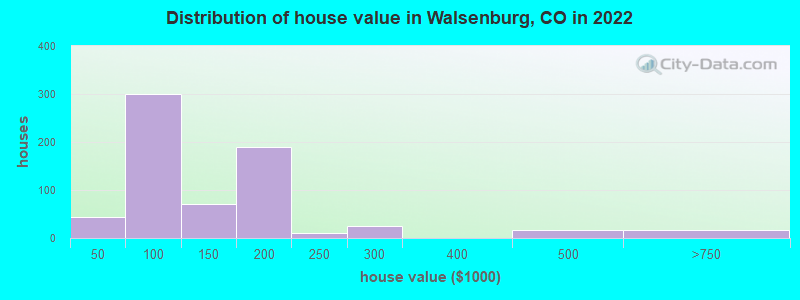
Median house or condo value ($)
Median house or condo value ($ change since 2000)
Mean house or condo value by units in structure - 1, detached ($)
Mean house or condo value by units in structure - 1, attached ($)
Mean house or condo value by units in structure - 2 ($)
Mean house or condo value by units in structure by units in structure - 3 or 4 ($)
Mean house or condo value by units in structure - 5 or more ($)
Mean house or condo value by units in structure - Boat, RV, van, etc. ($)
Mean house or condo value by units in structure - Mobile home ($)
Median house or condo value ($) - White
Median house or condo value ($) - Black or African American
Median house or condo value ($) - Asian
Median house or condo value ($) - Hispanic or Latino
Median house or condo value ($) - American Indian and Alaska Native
Median house or condo value ($) - Multirace
Median house or condo value ($) - Other Race
Median resident age
Resident age diversity
Median resident age - Males
Median resident age - Females
Median resident age - White
Median resident age - Black or African American
Median resident age - Asian
Median resident age - Hispanic or Latino
Median resident age - American Indian and Alaska Native
Median resident age - Multirace
Median resident age - Other Race
Median resident age - Males - White
Median resident age - Males - Black or African American
Median resident age - Males - Asian
Median resident age - Males - Hispanic or Latino
Median resident age - Males - American Indian and Alaska Native
Median resident age - Males - Multirace
Median resident age - Males - Other Race
Median resident age - Females - White
Median resident age - Females - Black or African American
Median resident age - Females - Asian
Median resident age - Females - Hispanic or Latino
Median resident age - Females - American Indian and Alaska Native
Median resident age - Females - Multirace
Median resident age - Females - Other Race
Commute - mean travel time to work (minutes)
Travel time to work - Less than 5 minutes (%)
Travel time to work - Less than 5 minutes (% change since 2000)
Travel time to work - 5 to 9 minutes (%)
Travel time to work - 5 to 9 minutes (% change since 2000)
Travel time to work - 10 to 19 minutes (%)
Travel time to work - 10 to 19 minutes (% change since 2000)
Travel time to work - 20 to 29 minutes (%)
Travel time to work - 20 to 29 minutes (% change since 2000)
Travel time to work - 30 to 39 minutes (%)
Travel time to work - 30 to 39 minutes (% change since 2000)
Travel time to work - 40 to 59 minutes (%)
Travel time to work - 40 to 59 minutes (% change since 2000)
Travel time to work - 60 to 89 minutes (%)
Travel time to work - 60 to 89 minutes (% change since 2000)
Travel time to work - 90 or more minutes (%)
Travel time to work - 90 or more minutes (% change since 2000)
Marital status - Never married (%)
Marital status - Now married (%)
Marital status - Separated (%)
Marital status - Widowed (%)
Marital status - Divorced (%)
Median family income ($)
Median family income (% change since 2000)
Median non-family income ($)
Median non-family income (% change since 2000)
Median per capita income ($)
Median per capita income (% change since 2000)
Median family income ($) - White
Median family income ($) - Black or African American
Median family income ($) - Asian
Median family income ($) - Hispanic or Latino
Median family income ($) - American Indian and Alaska Native
Median family income ($) - Multirace
Median family income ($) - Other Race
Median year house/condo built
Median year apartment built
Year house built - Built 2005 or later (%)
Year house built - Built 2000 to 2004 (%)
Year house built - Built 1990 to 1999 (%)
Year house built - Built 1980 to 1989 (%)
Year house built - Built 1970 to 1979 (%)
Year house built - Built 1960 to 1969 (%)
Year house built - Built 1950 to 1959 (%)
Year house built - Built 1940 to 1949 (%)
Year house built - Built 1939 or earlier (%)
Average household size
Household density (households per square mile)
Average household size - White
Average household size - Black or African American
Average household size - Asian
Average household size - Hispanic or Latino
Average household size - American Indian and Alaska Native
Average household size - Multirace
Average household size - Other Race
Occupied housing units (%)
Vacant housing units (%)
Owner occupied housing units (%)
Renter occupied housing units (%)
Vacancy status - For rent (%)
Vacancy status - For sale only (%)
Vacancy status - Rented or sold, not occupied (%)
Vacancy status - For seasonal, recreational, or occasional use (%)
Vacancy status - For migrant workers (%)
Vacancy status - Other vacant (%)
Residents with income below the poverty level (%)
Residents with income below 50% of the poverty level (%)
Children below poverty level (%)
Poor families by family type - Married-couple family (%)
Poor families by family type - Male, no wife present (%)
Poor families by family type - Female, no husband present (%)
Poverty status for native-born residents (%)
Poverty status for foreign-born residents (%)
Poverty among high school graduates not in families (%)
Poverty among people who did not graduate high school not in families (%)
Residents with income below the poverty level (%) - White
Residents with income below the poverty level (%) - Black or African American
Residents with income below the poverty level (%) - Asian
Residents with income below the poverty level (%) - Hispanic or Latino
Residents with income below the poverty level (%) - American Indian and Alaska Native
Residents with income below the poverty level (%) - Multirace
Residents with income below the poverty level (%) - Other Race
Air pollution - Air Quality Index (AQI)
Air pollution - CO
Air pollution - NO2
Air pollution - SO2
Air pollution - Ozone
Air pollution - PM10
Air pollution - PM25
Air pollution - Pb
Crime - Murders per 100,000 population
Crime - Rapes per 100,000 population
Crime - Robberies per 100,000 population
Crime - Assaults per 100,000 population
Crime - Burglaries per 100,000 population
Crime - Thefts per 100,000 population
Crime - Auto thefts per 100,000 population
Crime - Arson per 100,000 population
Crime - City-data.com crime index
Crime - Violent crime index
Crime - Property crime index
Crime - Murders per 100,000 population (5 year average)
Crime - Rapes per 100,000 population (5 year average)
Crime - Robberies per 100,000 population (5 year average)
Crime - Assaults per 100,000 population (5 year average)
Crime - Burglaries per 100,000 population (5 year average)
Crime - Thefts per 100,000 population (5 year average)
Crime - Auto thefts per 100,000 population (5 year average)
Crime - Arson per 100,000 population (5 year average)
Crime - City-data.com crime index (5 year average)
Crime - Violent crime index (5 year average)
Crime - Property crime index (5 year average)
1996 Presidential Elections Results (%) - Democratic Party (Clinton)
1996 Presidential Elections Results (%) - Republican Party (Dole)
1996 Presidential Elections Results (%) - Other
2000 Presidential Elections Results (%) - Democratic Party (Gore)
2000 Presidential Elections Results (%) - Republican Party (Bush)
2000 Presidential Elections Results (%) - Other
2004 Presidential Elections Results (%) - Democratic Party (Kerry)
2004 Presidential Elections Results (%) - Republican Party (Bush)
2004 Presidential Elections Results (%) - Other
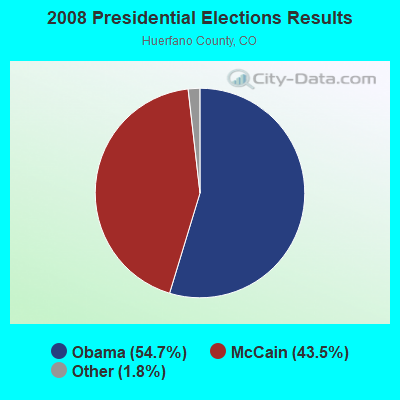
2008 Presidential Elections Results (%) - Democratic Party (Obama)
2008 Presidential Elections Results (%) - Republican Party (McCain)
2008 Presidential Elections Results (%) - Other
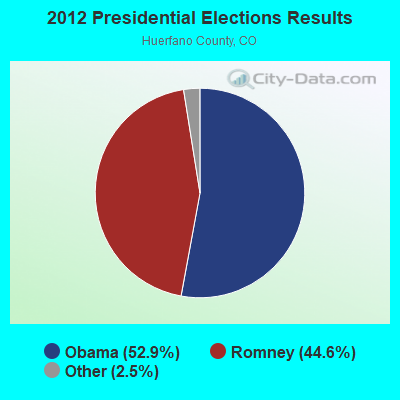
2012 Presidential Elections Results (%) - Democratic Party (Obama)
2012 Presidential Elections Results (%) - Republican Party (Romney)
2012 Presidential Elections Results (%) - Other
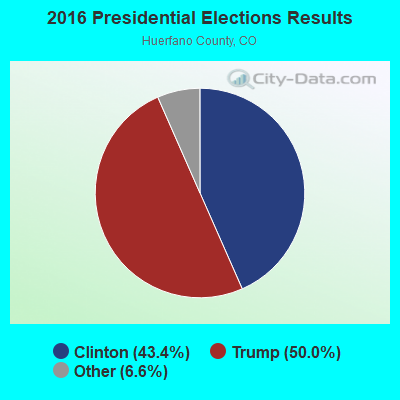
2016 Presidential Elections Results (%) - Democratic Party (Clinton)
2016 Presidential Elections Results (%) - Republican Party (Trump)
2016 Presidential Elections Results (%) - Other
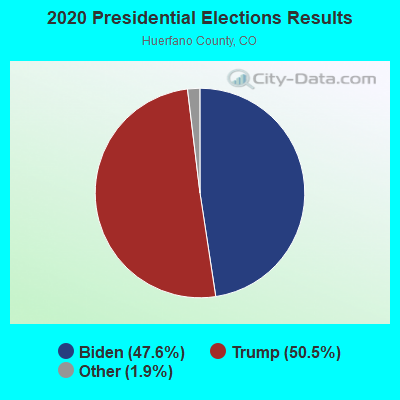
2020 Presidential Elections Results (%) - Democratic Party (Biden)
2020 Presidential Elections Results (%) - Republican Party (Trump)
2020 Presidential Elections Results (%) - Other
Ancestries Reported - Arab (%)
Ancestries Reported - Czech (%)
Ancestries Reported - Danish (%)
Ancestries Reported - Dutch (%)
Ancestries Reported - English (%)
Ancestries Reported - French (%)
Ancestries Reported - French Canadian (%)
Ancestries Reported - German (%)
Ancestries Reported - Greek (%)
Ancestries Reported - Hungarian (%)
Ancestries Reported - Irish (%)
Ancestries Reported - Italian (%)
Ancestries Reported - Lithuanian (%)
Ancestries Reported - Norwegian (%)
Ancestries Reported - Polish (%)
Ancestries Reported - Portuguese (%)
Ancestries Reported - Russian (%)
Ancestries Reported - Scotch-Irish (%)
Ancestries Reported - Scottish (%)
Ancestries Reported - Slovak (%)
Ancestries Reported - Subsaharan African (%)
Ancestries Reported - Swedish (%)
Ancestries Reported - Swiss (%)
Ancestries Reported - Ukrainian (%)
Ancestries Reported - United States (%)
Ancestries Reported - Welsh (%)
Ancestries Reported - West Indian (%)
Ancestries Reported - Other (%)
Educational Attainment - No schooling completed (%)
Educational Attainment - Less than high school (%)
Educational Attainment - High school or equivalent (%)
Educational Attainment - Less than 1 year of college (%)
Educational Attainment - 1 or more years of college (%)
Educational Attainment - Associate degree (%)
Educational Attainment - Bachelor's degree (%)
Educational Attainment - Master's degree (%)
Educational Attainment - Professional school degree (%)
Educational Attainment - Doctorate degree (%)
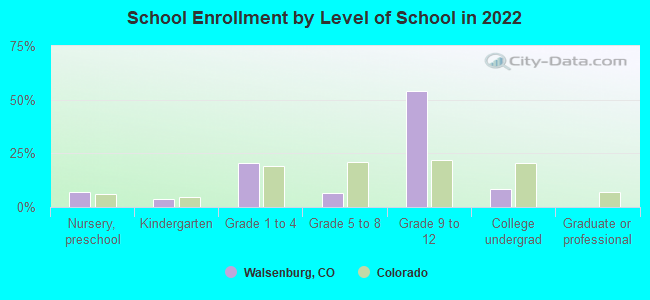
School Enrollment - Nursery, preschool (%)
School Enrollment - Kindergarten (%)
School Enrollment - Grade 1 to 4 (%)
School Enrollment - Grade 5 to 8 (%)
School Enrollment - Grade 9 to 12 (%)
School Enrollment - College undergrad (%)
School Enrollment - Graduate or professional (%)
School Enrollment - Not enrolled in school (%)
School enrollment - Public schools (%)
School enrollment - Private schools (%)
School enrollment - Not enrolled (%)
Median number of rooms in houses and condos
Median number of rooms in apartments
Housing units lacking complete plumbing facilities (%)
Housing units lacking complete kitchen facilities (%)
Density of houses
Urban houses (%)
Rural houses (%)
Households with people 60 years and over (%)
Households with people 65 years and over (%)
Households with people 75 years and over (%)
Households with one or more nonrelatives (%)
Households with no nonrelatives (%)
Population in households (%)
Family households (%)
Nonfamily households (%)
Population in families (%)
Family households with own children (%)
Median number of bedrooms in owner occupied houses
Mean number of bedrooms in owner occupied houses
Median number of bedrooms in renter occupied houses
Mean number of bedrooms in renter occupied houses
Median number of vehichles in owner occupied houses
Mean number of vehichles in owner occupied houses
Median number of vehichles in renter occupied houses
Mean number of vehichles in renter occupied houses
Mortgage status - with mortgage (%)
Mortgage status - with second mortgage (%)
Mortgage status - with home equity loan (%)
Mortgage status - with both second mortgage and home equity loan (%)
Mortgage status - without a mortgage (%)
Average family size
Average family size - White
Average family size - Black or African American
Average family size - Asian
Average family size - Hispanic or Latino
Average family size - American Indian and Alaska Native
Average family size - Multirace
Average family size - Other Race
Geographical mobility - Same house 1 year ago (%)
Geographical mobility - Moved within same county (%)
Geographical mobility - Moved from different county within same state (%)
Geographical mobility - Moved from different state (%)
Geographical mobility - Moved from abroad (%)
Place of birth - Born in state of residence (%)
Place of birth - Born in other state (%)
Place of birth - Native, outside of US (%)
Place of birth - Foreign born (%)
Housing units in structures - 1, detached (%)
Housing units in structures - 1, attached (%)
Housing units in structures - 2 (%)
Housing units in structures - 3 or 4 (%)
Housing units in structures - 5 to 9 (%)
Housing units in structures - 10 to 19 (%)
Housing units in structures - 20 to 49 (%)
Housing units in structures - 50 or more (%)
Housing units in structures - Mobile home (%)
Housing units in structures - Boat, RV, van, etc. (%)
House/condo owner moved in on average (years ago)
Renter moved in on average (years ago)
Year householder moved into unit - Moved in 1999 to March 2000 (%)
Year householder moved into unit - Moved in 1995 to 1998 (%)
Year householder moved into unit - Moved in 1990 to 1994 (%)
Year householder moved into unit - Moved in 1980 to 1989 (%)
Year householder moved into unit - Moved in 1970 to 1979 (%)
Year householder moved into unit - Moved in 1969 or earlier (%)
Means of transportation to work - Drove car alone (%)
Means of transportation to work - Carpooled (%)
Means of transportation to work - Public transportation (%)
Means of transportation to work - Bus or trolley bus (%)
Means of transportation to work - Streetcar or trolley car (%)
Means of transportation to work - Subway or elevated (%)
Means of transportation to work - Railroad (%)
Means of transportation to work - Ferryboat (%)
Means of transportation to work - Taxicab (%)
Means of transportation to work - Motorcycle (%)
Means of transportation to work - Bicycle (%)
Means of transportation to work - Walked (%)
Means of transportation to work - Other means (%)
Working at home (%)
Industry diversity
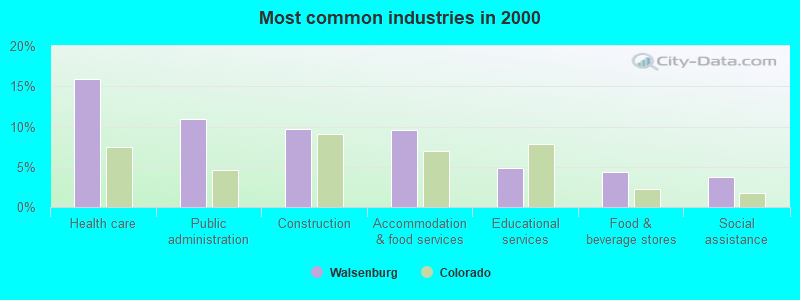
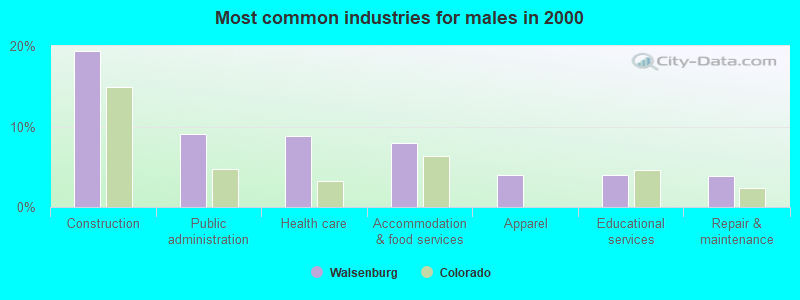
Most Common Industries - Agriculture, forestry, fishing and hunting, and mining (%)
Most Common Industries - Agriculture, forestry, fishing and hunting (%)
Most Common Industries - Mining, quarrying, and oil and gas extraction (%)
Most Common Industries - Construction (%)
Most Common Industries - Manufacturing (%)
Most Common Industries - Wholesale trade (%)
Most Common Industries - Retail trade (%)
Most Common Industries - Transportation and warehousing, and utilities (%)
Most Common Industries - Transportation and warehousing (%)
Most Common Industries - Utilities (%)
Most Common Industries - Information (%)
Most Common Industries - Finance and insurance, and real estate and rental and leasing (%)
Most Common Industries - Finance and insurance (%)
Most Common Industries - Real estate and rental and leasing (%)
Most Common Industries - Professional, scientific, and management, and administrative and waste management services (%)
Most Common Industries - Professional, scientific, and technical services (%)
Most Common Industries - Management of companies and enterprises (%)
Most Common Industries - Administrative and support and waste management services (%)
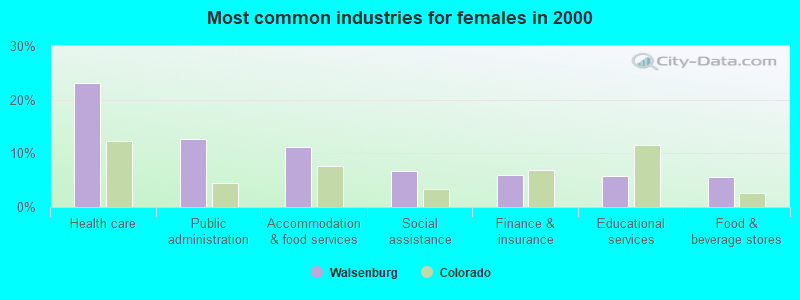
Most Common Industries - Educational services, and health care and social assistance (%)
Most Common Industries - Educational services (%)
Most Common Industries - Health care and social assistance (%)
Most Common Industries - Arts, entertainment, and recreation, and accommodation and food services (%)
Most Common Industries - Arts, entertainment, and recreation (%)
Most Common Industries - Accommodation and food services (%)
Most Common Industries - Other services, except public administration (%)
Most Common Industries - Public administration (%)
Occupation diversity
Most Common Occupations - Management, business, science, and arts occupations (%)
Most Common Occupations - Management, business, and financial occupations (%)
Most Common Occupations - Management occupations (%)
Most Common Occupations - Business and financial operations occupations (%)
Most Common Occupations - Computer, engineering, and science occupations (%)
Most Common Occupations - Computer and mathematical occupations (%)
Most Common Occupations - Architecture and engineering occupations (%)
Most Common Occupations - Life, physical, and social science occupations (%)
Most Common Occupations - Education, legal, community service, arts, and media occupations (%)
Most Common Occupations - Community and social service occupations (%)
Most Common Occupations - Legal occupations (%)
Most Common Occupations - Education, training, and library occupations (%)
Most Common Occupations - Arts, design, entertainment, sports, and media occupations (%)
Most Common Occupations - Healthcare practitioners and technical occupations (%)
Most Common Occupations - Health diagnosing and treating practitioners and other technical occupations (%)
Most Common Occupations - Health technologists and technicians (%)
Most Common Occupations - Service occupations (%)
Most Common Occupations - Healthcare support occupations (%)
Most Common Occupations - Protective service occupations (%)
Most Common Occupations - Fire fighting and prevention, and other protective service workers including supervisors (%)
Most Common Occupations - Law enforcement workers including supervisors (%)
Most Common Occupations - Food preparation and serving related occupations (%)
Most Common Occupations - Building and grounds cleaning and maintenance occupations (%)
Most Common Occupations - Personal care and service occupations (%)
Most Common Occupations - Sales and office occupations (%)
Most Common Occupations - Sales and related occupations (%)
Most Common Occupations - Office and administrative support occupations (%)
Most Common Occupations - Natural resources, construction, and maintenance occupations (%)
Most Common Occupations - Farming, fishing, and forestry occupations (%)
Most Common Occupations - Construction and extraction occupations (%)
Most Common Occupations - Installation, maintenance, and repair occupations (%)
Most Common Occupations - Production, transportation, and material moving occupations (%)
Most Common Occupations - Production occupations (%)
Most Common Occupations - Transportation occupations (%)
Most Common Occupations - Material moving occupations (%)
People in Group quarters - Institutionalized population (%)
People in Group quarters - Correctional institutions (%)
People in Group quarters - Federal prisons and detention centers (%)
People in Group quarters - Halfway houses (%)
People in Group quarters - Local jails and other confinement facilities (including police lockups) (%)
People in Group quarters - Military disciplinary barracks (%)
People in Group quarters - State prisons (%)
People in Group quarters - Other types of correctional institutions (%)
People in Group quarters - Nursing homes (%)
People in Group quarters - Hospitals/wards, hospices, and schools for the handicapped (%)
People in Group quarters - Hospitals/wards and hospices for chronically ill (%)
People in Group quarters - Hospices or homes for chronically ill (%)
People in Group quarters - Military hospitals or wards for chronically ill (%)
People in Group quarters - Other hospitals or wards for chronically ill (%)
People in Group quarters - Hospitals or wards for drug/alcohol abuse (%)
People in Group quarters - Mental (Psychiatric) hospitals or wards (%)
People in Group quarters - Schools, hospitals, or wards for the mentally retarded (%)
People in Group quarters - Schools, hospitals, or wards for the physically handicapped (%)
People in Group quarters - Institutions for the deaf (%)
People in Group quarters - Institutions for the blind (%)
People in Group quarters - Orthopedic wards and institutions for the physically handicapped (%)
People in Group quarters - Wards in general hospitals for patients who have no usual home elsewhere (%)
People in Group quarters - Wards in military hospitals for patients who have no usual home elsewhere (%)
People in Group quarters - Juvenile institutions (%)
People in Group quarters - Long-term care (%)
People in Group quarters - Homes for abused, dependent, and neglected children (%)
People in Group quarters - Residential treatment centers for emotionally disturbed children (%)
People in Group quarters - Training schools for juvenile delinquents (%)
People in Group quarters - Short-term care, detention or diagnostic centers for delinquent children (%)
People in Group quarters - Type of juvenile institution unknown (%)
People in Group quarters - Noninstitutionalized population (%)
People in Group quarters - College dormitories (includes college quarters off campus) (%)
People in Group quarters - Military quarters (%)
People in Group quarters - On base (%)
People in Group quarters - Barracks, unaccompanied personnel housing (UPH), (Enlisted/Officer), ;and similar group living quarters for military personnel (%)
People in Group quarters - Transient quarters for temporary residents (%)
People in Group quarters - Military ships (%)
People in Group quarters - Group homes (%)
People in Group quarters - Homes or halfway houses for drug/alcohol abuse (%)
People in Group quarters - Homes for the mentally ill (%)
People in Group quarters - Homes for the mentally retarded (%)
People in Group quarters - Homes for the physically handicapped (%)
People in Group quarters - Other group homes (%)
People in Group quarters - Religious group quarters (%)
People in Group quarters - Dormitories (%)
People in Group quarters - Agriculture workers' dormitories on farms (%)
People in Group quarters - Job Corps and vocational training facilities (%)
People in Group quarters - Other workers' dormitories (%)
People in Group quarters - Crews of maritime vessels (%)
People in Group quarters - Other nonhousehold living situations (%)
People in Group quarters - Other noninstitutional group quarters (%)
Residents speaking English at home (%)
Residents speaking English at home - Born in the United States (%)
Residents speaking English at home - Native, born elsewhere (%)
Residents speaking English at home - Foreign born (%)
Residents speaking Spanish at home (%)
Residents speaking Spanish at home - Born in the United States (%)
Residents speaking Spanish at home - Native, born elsewhere (%)
Residents speaking Spanish at home - Foreign born (%)
Residents speaking other language at home (%)
Residents speaking other language at home - Born in the United States (%)
Residents speaking other language at home - Native, born elsewhere (%)
Residents speaking other language at home - Foreign born (%)
Class of Workers - Employee of private company (%)
Class of Workers - Self-employed in own incorporated business (%)
Class of Workers - Private not-for-profit wage and salary workers (%)
Class of Workers - Local government workers (%)
Class of Workers - State government workers (%)
Class of Workers - Federal government workers (%)
Class of Workers - Self-employed workers in own not incorporated business and Unpaid family workers (%)
House heating fuel used in houses and condos - Utility gas (%)
House heating fuel used in houses and condos - Bottled, tank, or LP gas (%)
House heating fuel used in houses and condos - Electricity (%)
House heating fuel used in houses and condos - Fuel oil, kerosene, etc. (%)
House heating fuel used in houses and condos - Coal or coke (%)
House heating fuel used in houses and condos - Wood (%)
House heating fuel used in houses and condos - Solar energy (%)
House heating fuel used in houses and condos - Other fuel (%)
House heating fuel used in houses and condos - No fuel used (%)
House heating fuel used in apartments - Utility gas (%)
House heating fuel used in apartments - Bottled, tank, or LP gas (%)
House heating fuel used in apartments - Electricity (%)
House heating fuel used in apartments - Fuel oil, kerosene, etc. (%)
House heating fuel used in apartments - Coal or coke (%)
House heating fuel used in apartments - Wood (%)
House heating fuel used in apartments - Solar energy (%)
House heating fuel used in apartments - Other fuel (%)
House heating fuel used in apartments - No fuel used (%)
Armed forces status - In Armed Forces (%)
Armed forces status - Civilian (%)
Armed forces status - Civilian - Veteran (%)
Armed forces status - Civilian - Nonveteran (%)
Fatal accidents locations in years 2005-2021
Fatal accidents locations in 2005
Fatal accidents locations in 2006
Fatal accidents locations in 2007
Fatal accidents locations in 2008
Fatal accidents locations in 2009
Fatal accidents locations in 2010
Fatal accidents locations in 2011
Fatal accidents locations in 2012
Fatal accidents locations in 2013
Fatal accidents locations in 2014
Fatal accidents locations in 2015
Fatal accidents locations in 2016
Fatal accidents locations in 2017
Fatal accidents locations in 2018
Fatal accidents locations in 2019
Fatal accidents locations in 2020
Fatal accidents locations in 2021
Alcohol use - People drinking some alcohol every month (%)
Alcohol use - People not drinking at all (%)
Alcohol use - Average days/month drinking alcohol
Alcohol use - Average drinks/week
Alcohol use - Average days/year people drink much
Audiometry - Average condition of hearing (%)
Audiometry - People that can hear a whisper from across a quiet room (%)
Audiometry - People that can hear normal voice from across a quiet room (%)
Audiometry - Ears ringing, roaring, buzzing (%)
Audiometry - Had a job exposure to loud noise (%)
Audiometry - Had off-work exposure to loud noise (%)
Blood Pressure & Cholesterol - Has high blood pressure (%)
Blood Pressure & Cholesterol - Checking blood pressure at home (%)
Blood Pressure & Cholesterol - Frequently checking blood cholesterol (%)
Blood Pressure & Cholesterol - Has high cholesterol level (%)
Consumer Behavior - Money monthly spent on food at supermarket/grocery store
Consumer Behavior - Money monthly spent on food at other stores
Consumer Behavior - Money monthly spent on eating out
Consumer Behavior - Money monthly spent on carryout/delivered foods
Consumer Behavior - Income spent on food at supermarket/grocery store (%)
Consumer Behavior - Income spent on food at other stores (%)
Consumer Behavior - Income spent on eating out (%)
Consumer Behavior - Income spent on carryout/delivered foods (%)
Current Health Status - General health condition (%)
Current Health Status - Blood donors (%)
Current Health Status - Has blood ever tested for HIV virus (%)
Current Health Status - Left-handed people (%)
Dermatology - People using sunscreen (%)
Diabetes - Diabetics (%)
Diabetes - Had a blood test for high blood sugar (%)
Diabetes - People taking insulin (%)
Diet Behavior & Nutrition - Diet health (%)
Diet Behavior & Nutrition - Milk product consumption (# of products/month)
Diet Behavior & Nutrition - Meals not home prepared (#/week)
Diet Behavior & Nutrition - Meals from fast food or pizza place (#/week)
Diet Behavior & Nutrition - Ready-to-eat foods (#/month)
Diet Behavior & Nutrition - Frozen meals/pizza (#/month)
Drug Use - People that ever used marijuana or hashish (%)
Drug Use - Ever used hard drugs (%)
Drug Use - Ever used any form of cocaine (%)
Drug Use - Ever used heroin (%)
Drug Use - Ever used methamphetamine (%)
Health Insurance - People covered by health insurance (%)
Kidney Conditions-Urology - Avg. # of times urinating at night
Medical Conditions - People with asthma (%)
Medical Conditions - People with anemia (%)
Medical Conditions - People with psoriasis (%)
Medical Conditions - People with overweight (%)
Medical Conditions - Elderly people having difficulties in thinking or remembering (%)
Medical Conditions - People who ever received blood transfusion (%)
Medical Conditions - People having trouble seeing even with glass/contacts (%)
Medical Conditions - People with arthritis (%)
Medical Conditions - People with gout (%)
Medical Conditions - People with congestive heart failure (%)
Medical Conditions - People with coronary heart disease (%)
Medical Conditions - People with angina pectoris (%)
Medical Conditions - People who ever had heart attack (%)
Medical Conditions - People who ever had stroke (%)
Medical Conditions - People with emphysema (%)
Medical Conditions - People with thyroid problem (%)
Medical Conditions - People with chronic bronchitis (%)
Medical Conditions - People with any liver condition (%)
Medical Conditions - People who ever had cancer or malignancy (%)
Mental Health - People who have little interest in doing things (%)
Mental Health - People feeling down, depressed, or hopeless (%)
Mental Health - People who have trouble sleeping or sleeping too much (%)
Mental Health - People feeling tired or having little energy (%)
Mental Health - People with poor appetite or overeating (%)
Mental Health - People feeling bad about themself (%)
Mental Health - People who have trouble concentrating on things (%)
Mental Health - People moving or speaking slowly or too fast (%)
Mental Health - People having thoughts they would be better off dead (%)
Oral Health - Average years since last visit a dentist
Oral Health - People embarrassed because of mouth (%)
Oral Health - People with gum disease (%)
Oral Health - General health of teeth and gums (%)
Oral Health - Average days a week using dental floss/device
Oral Health - Average days a week using mouthwash for dental problem
Oral Health - Average number of teeth
Pesticide Use - Households using pesticides to control insects (%)
Pesticide Use - Households using pesticides to kill weeds (%)
Physical Activity - People doing vigorous-intensity work activities (%)
Physical Activity - People doing moderate-intensity work activities (%)
Physical Activity - People walking or bicycling (%)
Physical Activity - People doing vigorous-intensity recreational activities (%)
Physical Activity - People doing moderate-intensity recreational activities (%)
Physical Activity - Average hours a day doing sedentary activities
Physical Activity - Average hours a day watching TV or videos
Physical Activity - Average hours a day using computer
Physical Functioning - People having limitations keeping them from working (%)
Physical Functioning - People limited in amount of work they can do (%)
Physical Functioning - People that need special equipment to walk (%)
Physical Functioning - People experiencing confusion/memory problems (%)
Physical Functioning - People requiring special healthcare equipment (%)
Prescription Medications - Average number of prescription medicines taking
Preventive Aspirin Use - Adults 40+ taking low-dose aspirin (%)
Reproductive Health - Vaginal deliveries (%)
Reproductive Health - Cesarean deliveries (%)
Reproductive Health - Deliveries resulted in a live birth (%)
Reproductive Health - Pregnancies resulted in a delivery (%)
Reproductive Health - Women breastfeeding newborns (%)
Reproductive Health - Women that had a hysterectomy (%)
Reproductive Health - Women that had both ovaries removed (%)
Reproductive Health - Women that have ever taken birth control pills (%)
Reproductive Health - Women taking birth control pills (%)
Reproductive Health - Women that have ever used Depo-Provera or injectables (%)
Reproductive Health - Women that have ever used female hormones (%)
Sexual Behavior - People 18+ that ever had sex (vaginal, anal, or oral) (%)
Sexual Behavior - Males 18+ that ever had vaginal sex with a woman (%)
Sexual Behavior - Males 18+ that ever performed oral sex on a woman (%)
Sexual Behavior - Males 18+ that ever had anal sex with a woman (%)
Sexual Behavior - Males 18+ that ever had any sex with a man (%)
Sexual Behavior - Females 18+ that ever had vaginal sex with a man (%)
Sexual Behavior - Females 18+ that ever performed oral sex on a man (%)
Sexual Behavior - Females 18+ that ever had anal sex with a man (%)
Sexual Behavior - Females 18+ that ever had any kind of sex with a woman (%)
Sexual Behavior - Average age people first had sex
Sexual Behavior - Average number of female sex partners in lifetime (males 18+)
Sexual Behavior - Average number of female vaginal sex partners in lifetime (males 18+)
Sexual Behavior - Average age people first performed oral sex on a woman (18+)
Sexual Behavior - Average number of woman performed oral sex on in lifetime (18+)
Sexual Behavior - Average number of male sex partners in lifetime (males 18+)
Sexual Behavior - Average number of male anal sex partners in lifetime (males 18+)
Sexual Behavior - Average age people first performed oral sex on a man (18+)
Sexual Behavior - Average number of male oral sex partners in lifetime (18+)
Sexual Behavior - People using protection when performing oral sex (%)
Sexual Behavior - Average number of times people have vaginal or anal sex a year
Sexual Behavior - People having sex without condom (%)
Sexual Behavior - Average number of male sex partners in lifetime (females 18+)
Sexual Behavior - Average number of male vaginal sex partners in lifetime (females 18+)
Sexual Behavior - Average number of female sex partners in lifetime (females 18+)
Sexual Behavior - Circumcised males 18+ (%)
Sleep Disorders - Average hours sleeping at night
Sleep Disorders - People that has trouble sleeping (%)
Smoking-Cigarette Use - People smoking cigarettes (%)
Taste & Smell - People 40+ having problems with smell (%)
Taste & Smell - People 40+ having problems with taste (%)
Taste & Smell - People 40+ that ever had wisdom teeth removed (%)
Taste & Smell - People 40+ that ever had tonsils teeth removed (%)
Taste & Smell - People 40+ that ever had a loss of consciousness because of a head injury (%)
Taste & Smell - People 40+ that ever had a broken nose or other serious injury to face or skull (%)
Taste & Smell - People 40+ that ever had two or more sinus infections (%)
Weight - Average height (inches)
Weight - Average weight (pounds)
Weight - Average BMI
Weight - People that are obese (%)
Weight - People that ever were obese (%)
Weight - People trying to lose weight (%)
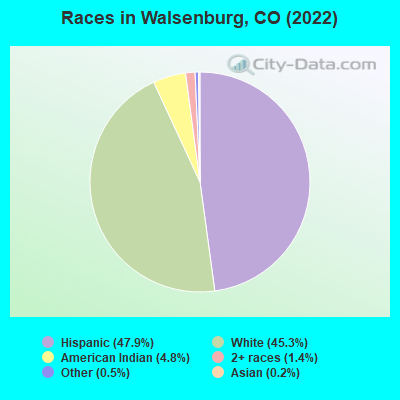
1,489 47.9% Hispanic 1,407 45.3% White alone 149 4.8% American Indian alone 44 1.4% Two or more races 16 0.5% Other race alone 5 0.2% Asian alone
Latest news from Walsenburg, CO collected exclusively by city-data.com from local newspapers, TV, and radio stations
Ancestries: German (11.8%), American (6.1%), Italian (5.5%), Canadian (1.7%), English (1.6%), Yugoslavian (1.0%).
Current Local Time:
Incorporated on 6/16/1873
Land area: 2.33 square miles.
Population density: 1,335 people per square mile (low).
20 residents are foreign born
This city:
0.6%Colorado:
9.5%
Median real estate property taxes paid for housing units with mortgages in 2022: $654 (0.4%)Median real estate property taxes paid for housing units with no mortgage in 2022: $393 (0.4%)
Nearest city with pop. 50,000+: Pueblo, CO
Nearest city with pop. 200,000+: Colorado Springs, CO
Nearest city with pop. 1,000,000+: Phoenix, AZ
Nearest cities:
Lynn, CO (4.0 miles),
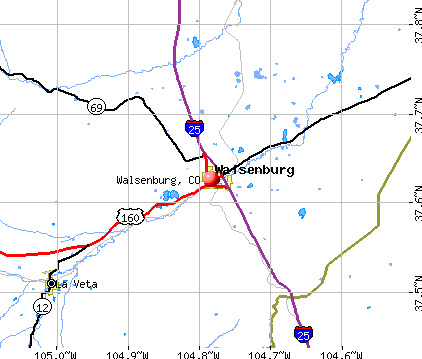
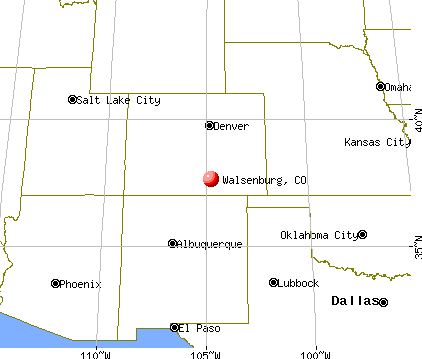
Latitude: 37.63 N, Longitude: 104.78 W
Single-family new house construction building permits:
2015: 1 building , cost: $93,0002006: 2 buildings , average cost: $133,1002001: 1 building , cost: $130,0001999: 1 building , cost: $60,0001998: 1 building , cost: $60,0001997: 3 buildings , average cost: $51,700Unemployment in December 2023:
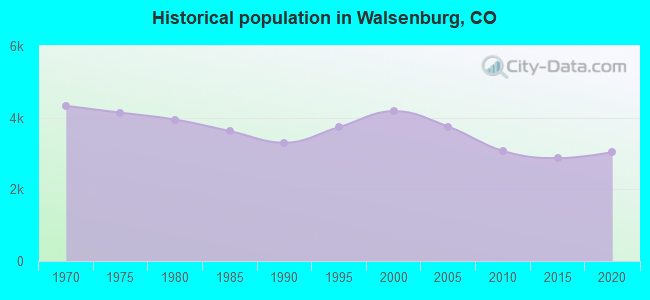
Population change in the 1990s: +889 (+27.0%).
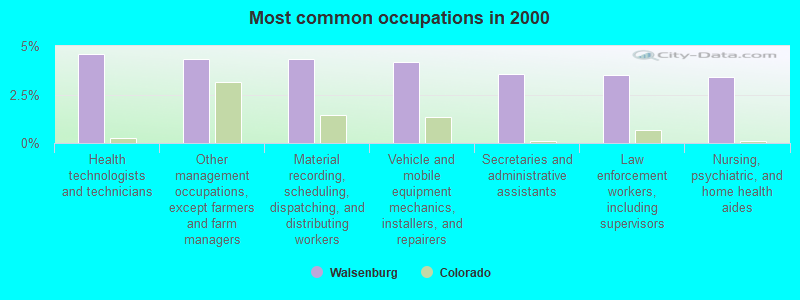
Most common occupations in Walsenburg, CO (%)
Both Males Females
Health technologists and technicians (4.6%)
Other management occupations, except farmers and farm managers (4.3%)
Material recording, scheduling, dispatching, and distributing workers (4.3%)
Vehicle and mobile equipment mechanics, installers, and repairers (4.2%)
Secretaries and administrative assistants (3.6%)
Law enforcement workers, including supervisors (3.5%)
Nursing, psychiatric, and home health aides (3.4%)
Vehicle and mobile equipment mechanics, installers, and repairers (8.3%)
Driver/sales workers and truck drivers (5.1%)
Law enforcement workers, including supervisors (4.8%)
Construction laborers (4.8%)
Construction traders workers except carpenters, electricians, painters, plumbers, and construction laborers (4.5%)
Laborers and material movers, hand (4.1%)
Material recording, scheduling, dispatching, and distributing workers (4.1%)
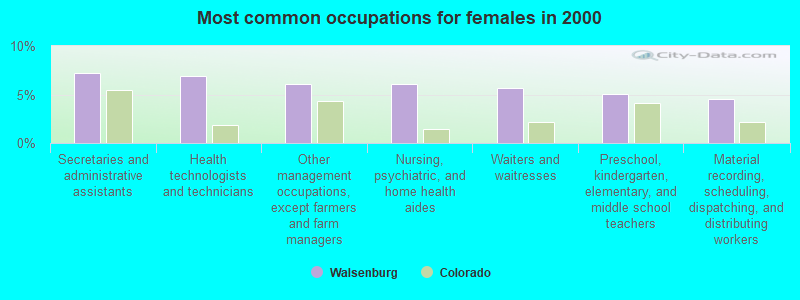
Secretaries and administrative assistants (7.2%)
Health technologists and technicians (6.9%)
Other management occupations, except farmers and farm managers (6.0%)
Nursing, psychiatric, and home health aides (6.0%)
Waiters and waitresses (5.7%)
Preschool, kindergarten, elementary, and middle school teachers (5.0%)
Material recording, scheduling, dispatching, and distributing workers (4.5%)
Earthquake activity:
Walsenburg-area historical earthquake activity is significantly above Colorado state average. It is 718% greater than the overall U.S. average. On 8/23/2011 at 05:46:18, a magnitude 5.3 (5.3 MW, Depth: 2.5 mi, Class: Moderate, Intensity: VI - VII) earthquake occurred 39.3 miles away from Walsenburg center On 8/10/2005 at 22:08:22, a magnitude 5.0 (5.0 MW, Depth: 3.1 mi) earthquake occurred 47.1 miles away from Walsenburg center On 8/10/2005 at 22:08:22, a magnitude 5.0 (5.0 MB, 4.7 MS, 5.0 MW) earthquake occurred 48.9 miles away from the city center On 8/18/1959 at 06:37:13, a magnitude 7.7 (7.7 UK, Class: Major, Intensity: VIII - XII) earthquake occurred 568.9 miles away from Walsenburg center, causing $26,000,000 total damage On 8/22/2011 at 23:30:19, a magnitude 4.7 (4.7 MW, Depth: 3.1 mi, Class: Light, Intensity: IV - V) earthquake occurred 43.0 miles away from the city center On 9/5/2001 at 10:52:07, a magnitude 4.5 (4.5 MB, Depth: 3.1 mi) earthquake occurred 34.7 miles away from the city center Magnitude types: body-wave magnitude (MB), surface-wave magnitude (MS), moment magnitude (MW) Natural disasters: The number of natural disasters in Huerfano County (7) is smaller than the US average (15).Major Disasters (Presidential) Declared: 1Emergencies Declared: 4Fires: 2, Drought: 1, Hurricane: 1, Snow: 1, Snowstorm: 1, Other: 1 (Note: some incidents may be assigned to more than one category). Hospitals and medical centers in Walsenburg: SPANISH PEAKS REGIONAL HEALTH CENTER (Government - Hospital District or Authority, provides emergency services, 23500 US HWY 160) COLORADO STATE VETERANS NURSING HOME-WALSENBURG (23500 U S HIGHWAY 160)
WALSENBURG CARE CTR (135 W 7TH ST)
WALSENBURG DIALYSIS (FMC) (23450 HIGHWAY 160)
MOUNTAIN CREEK HOME HEALTH (601 S ALBERT STREET, SUITE A)
Colleges/universities with over 2000 students nearest to Walsenburg:
Pueblo Community College (about 45 miles; Pueblo, CO ; Full-time enrollment: 5,329)
Colorado State University-Pueblo (about 49 miles; Pueblo, CO ; FT enrollment: 5,993)
Adams State University (about 62 miles; Alamosa, CO ; FT enrollment: 2,805)
Pikes Peak Community College (about 79 miles; Colorado Springs, CO ; FT enrollment: 10,395)
Colorado College (about 85 miles; Colorado Springs, CO ; FT enrollment: 2,199)
University of Colorado Colorado Springs (about 88 miles; Colorado Springs, CO ; FT enrollment: 8,700)
Colorado Technical University-Online (about 88 miles; Colorado Springs, CO ; FT enrollment: 22,771)
Public high school in Walsenburg: JOHN MALL HIGH SCHOOL Location: 355 WEST PINE STREET, Grades: 9-12)
Public elementary/middle school in Walsenburg: PEAKVIEW SCHOOL Students: 211, Location: 375 WEST PINE STREET, Grades: PK-8)See full list of schools located in Walsenburg Library in Walsenburg: SPANISH PEAKS LIBRARY DISTRICT Operating income: $199,270; Location: 323 N MAIN STREET; 20,303 books ; 1,964 audio materials ; 2,066 video materials ; 44 local licensed databases ; 62 print serial subscriptions )
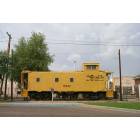
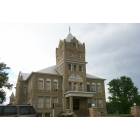
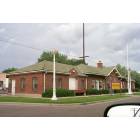
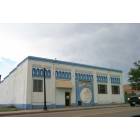
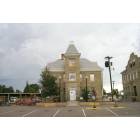
Notable locations in Walsenburg: (A) , Huerfano County Detention Center (B) , Huerfano County Courthouse (C) , Saint Charles Hotel (D) , Kirkpatrick Hotel (E) , Klein Hotel (F) , Walsenburg City Hall (G) , Huerfano Ambulance Service (H) , Huerfano County Fire Protection District / Walsenburg Fire Department (I) , Huerfano County Sheriff's Office (J) , Walsenburg Police Department (K) . Display/hide their locations on the map
Churches in Walsenburg include: (A) , First Baptist Church (B) , Second Spanish Presbyterian Church (C) , Community Church (D) , Church of the Nazarene (E) , United Church of Walsenburg (F) . Display/hide their locations on the map
Park in Walsenburg: (1) . Display/hide its location on the map
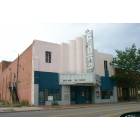
Tourist attraction:
Hotels:
Birthplace of: Matthew G. Martínez - Marine, Xavier Atencio - Animator, Debora Greger - Poet.
Huerfano County has a predicted average indoor radon screening level greater than 4 pCi/L (pico curies per liter) - Highest Potential Drinking water stations with addresses in Walsenburg and their reported violations in the past:
GARDNER WATER AND SANITATION DIST (Population served: 115, Groundwater):
Past health violations:
MCL, Monthly (TCR) - In OCT-2011, Contaminant: Coliform. Follow-up actions: St Public Notif requested (OCT-07-2011), St Violation/Reminder Notice (OCT-07-2011), St Public Notif received (OCT-14-2011), St Compliance achieved (APR-30-2012)
MCL, Monthly (TCR) - In AUG-2005, Contaminant: Coliform. Follow-up actions: St Public Notif requested (AUG-12-2005), St Violation/Reminder Notice (AUG-12-2005), St Compliance achieved (JAN-11-2007)
Past monitoring violations:
Follow-up Or Routine LCR Tap M/R - In OCT-01-2013, Contaminant: Lead and Copper Rule. Follow-up actions: St Public Notif requested (NOV-08-2013), St Violation/Reminder Notice (NOV-08-2013), St Compliance achieved (SEP-02-2014)
Monitoring, Source Water (GWR) - In OCT-2011, Contaminant: E. COLI. Follow-up actions: St Public Notif requested (DEC-16-2011), St Violation/Reminder Notice (DEC-16-2011), St Compliance achieved (DEC-19-2011)
Monitoring and Reporting (DBP) - Between APR-2009 and JUN-2009, Contaminant: Chlorine. Follow-up actions: St Public Notif requested (JUN-04-2009), St Violation/Reminder Notice (JUN-04-2009), St Compliance achieved (OCT-02-2009)
Monitoring and Reporting (DBP) - Between JAN-2009 and DEC-2009, Contaminant: TTHM. Follow-up actions: St AO (w/penalty) issued (AUG-26-2008), St Public Notif requested (NOV-06-2009), St Violation/Reminder Notice (NOV-06-2009), St Compliance achieved (AUG-16-2010)
Monitoring and Reporting (DBP) - Between JAN-2009 and MAR-2009, Contaminant: Chlorine. Follow-up actions: St AO (w/penalty) issued (FEB-27-2009), St Public Notif requested (MAY-08-2009), St Violation/Reminder Notice (MAY-08-2009), St Compliance achieved (OCT-02-2009)
2 routine major monitoring violations
83 regular monitoring violations
17 other older monitoring violations
Population served: 50, Groundwater):
Past monitoring violations:
One routine major monitoring violation
One regular monitoring violation
Average household size: This city:
2.1 peopleColorado:
2.5 people
Percentage of family households: This city:
52.9%Whole state:
63.9%
Percentage of households with unmarried partners: This city:
6.6%Whole state:
6.5%
Likely homosexual households (counted as self-reported same-sex unmarried-partner households)
Lesbian couples: 0.4% of all households Gay men: 0.3% of all households
People in group quarters in Walsenburg in 2010:
28 people in nursing facilities/skilled-nursing facilities
15 people in local jails and other municipal confinement facilities
13 people in workers' group living quarters and job corps centers
People in group quarters in Walsenburg in 2000:
735 people in state prisons
34 people in nursing homes
28 people in short-term care, detention or diagnostic centers for delinquent children
19 people in local jails and other confinement facilities (including police lockups)
4 people in other noninstitutional group quarters
Banks with branches in Walsenburg (2011 data):
The First National Bank in Trinidad: Huerfano County Branch at 135 West Sixth Street, branch established on 1993/10/18. Info updated 2006/11/03: Bank assets: $182.9 mil, Deposits: $159.9 mil, headquarters in Trinidad, CO, positive income , 5 total offices , Holding Company: Republic Trinidad Corporation
Bank Midwest, National Association: Walsenburg Branch at 501 Main Street, branch established on 1958/01/23. Info updated 2012/03/19: Bank assets: $6,237.6 mil, Deposits: $5,064.6 mil, headquarters in Kansas City, MO, positive income , 138 total offices , Holding Company: Nbh Holdings Corp.
For population 15 years and over in Walsenburg:
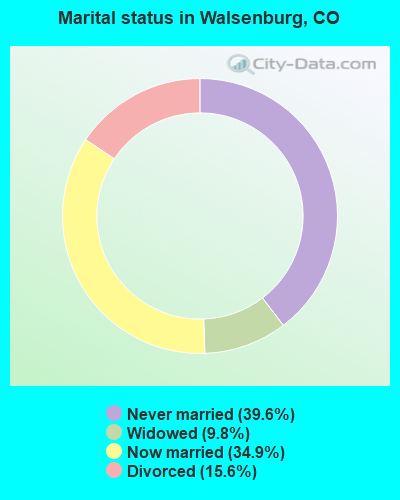
Never married: 39.6%Now married: 34.9%Separated: 0.0%Widowed: 9.8%Divorced: 15.6% For population 25 years and over in Walsenburg:
High school or higher: 84.9%Bachelor's degree or higher: 18.6%Graduate or professional degree: 4.0%Unemployed: 11.0%Mean travel time to work (commute): 17.6 minutes
Education Gini index (Inequality in education) Here:
11.1Colorado average:
11.1
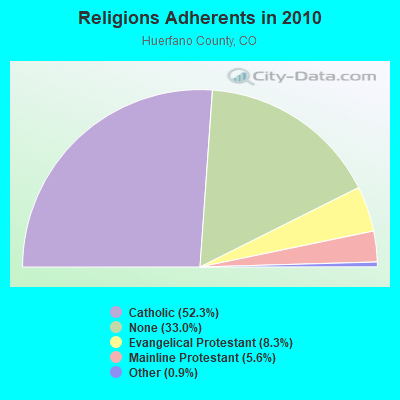
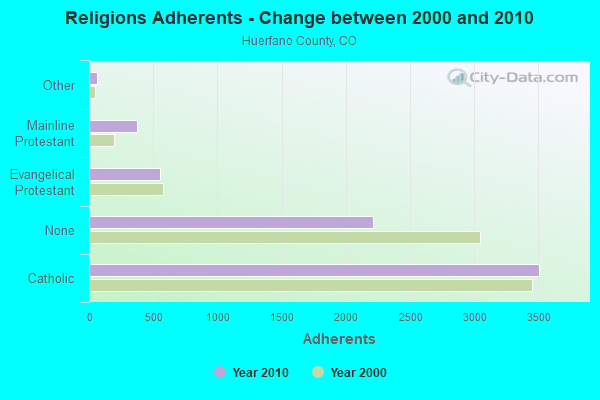
Religion statistics for Walsenburg, CO (based on Huerfano County data)
Religion Adherents Congregations Catholic 3,508 4 Evangelical Protestant 556 6 Mainline Protestant 374 4 Other 61 2 None 2,212 -
Source: Clifford Grammich, Kirk Hadaway, Richard Houseal, Dale E.Jones, Alexei Krindatch, Richie Stanley and Richard H.Taylor. 2012. 2010 U.S.Religion Census: Religious Congregations & Membership Study. Association of Statisticians of American Religious Bodies. Jones, Dale E., et al. 2002. Congregations and Membership in the United States 2000. Nashville, TN: Glenmary Research Center. Graphs represent county-level data
Food Environment Statistics: Number of grocery stores : 2This county :
2.56 / 10,000 pop.Colorado :
1.50 / 10,000 pop.
Number of convenience stores (with gas) : 7Huerfano County :
8.96 / 10,000 pop.Colorado :
3.13 / 10,000 pop.
Number of full-service restaurants : 13Huerfano County :
16.64 / 10,000 pop.Colorado :
8.99 / 10,000 pop.
Adult diabetes rate : This county :
6.7%State :
5.3%
Low-income preschool obesity rate : Huerfano County :
6.2%State :
9.6%
Health and Nutrition: Healthy diet rate : This city:
49.6%Colorado:
49.4%
Average overall health of teeth and gums : Walsenburg:
47.7%State:
47.8%
Average BMI : This city:
28.8Colorado:
28.5
People feeling badly about themselves : This city:
18.8%Colorado:
20.7%
People not drinking alcohol at all : Walsenburg:
10.2%Colorado:
9.7%
Average hours sleeping at night : Overweight people : This city:
33.9%Colorado:
33.3%
General health condition : This city:
55.5%State:
57.3%
Average condition of hearing : Walsenburg:
79.3%Colorado:
80.2%
More about Health and Nutrition of Walsenburg, CO Residents
Local government employment and payroll (March 2022)
Function
Full-time employees
Monthly full-time payroll
Average yearly full-time wage
Part-time employees
Monthly part-time payroll
Water Supply
4 $13,389 $40,167 1 $1,204 Gas Supply
4 $14,477 $43,431 0 $0 Financial Administration
4 $12,584 $37,752 0 $0 Streets and Highways
4 $12,116 $36,348 0 $0 Other Government Administration
2 $9,250 $55,500 9 $5,536 Sewerage
2 $7,043 $42,258 0 $0 Health
1 $4,154 $49,848 0 $0 Parks and Recreation
1 $3,809 $45,708 1 $783 Other and Unallocable
1 $7,412 $88,944 0 $0 Judicial and Legal
0 $0 1 $1,329
Totals for Government
23 $84,233 $43,948 12 $8,851
Walsenburg government finances - Expenditure in 2017 (per resident):
Construction - General - Other: $3,448,000 ($1108.33)
Current Operations - General - Other: $4,579,000 ($1471.87)
Water Utilities: $1,267,000 ($407.26)Sewerage: $838,000 ($269.37)Police Protection: $772,000 ($248.15)Gas Utilities: $566,000 ($181.94)Central Staff Services: $248,000 ($79.72)Parks and Recreation: $125,000 ($40.18)Protective Inspection and Regulation - Other: $58,000 ($18.64)Other Capital Outlay - General - Other: $276,000 ($88.72)
Total Salaries and Wages: $1,925,000 ($618.77)
Water Utilities - Interest on Debt: $396,000 ($127.29)
Walsenburg government finances - Revenue in 2017 (per resident):
Charges - Other: $4,008,000 ($1288.33)
Sewerage: $980,000 ($315.01)Parks and Recreation: $103,000 ($33.11)Local Intergovernmental - Other: $868,000 ($279.01)
Miscellaneous - General Revenue - Other: $103,000 ($33.11)
Fines and Forfeits: $35,000 ($11.25)Interest Earnings: $6,000 ($1.93)Revenue - Water Utilities: $1,698,000 ($545.81)
Gas Utilities: $1,317,000 ($423.34)State Intergovernmental - Other: $149,000 ($47.89)
Highways: $22,000 ($7.07)General Local Government Support: $3,000 ($0.96)Tax - Property: $1,867,000 ($600.13)
Other: $1,415,000 ($454.84)General Sales and Gross Receipts: $1,313,000 ($422.05)Public Utilities Sales: $122,000 ($39.22)Other License: $17,000 ($5.46)Occupation and Business License - Other: $5,000 ($1.61)Alcoholic Beverage License: $3,000 ($0.96)
Walsenburg government finances - Debt in 2017 (per resident):
Long Term Debt - Beginning Outstanding - Unspecified Public Purpose: $16,652,000 ($5352.62)
Outstanding Unspecified Public Purpose: $15,941,000 ($5124.08)Retired Unspecified Public Purpose: $711,000 ($228.54)Short Term Debt Outstanding - End of Fiscal Year: $1,886,000 ($606.24)
Beginning: $1,870,000 ($601.09)
Walsenburg government finances - Cash and Securities in 2017 (per resident):
Other Funds - Cash and Securities: $4,621,000 ($1485.37)
Sinking Funds - Cash and Securities: $3,996,000 ($1284.47)
Businesses in Walsenburg, CO
Name Count Name Count
7-Eleven 1 Kroger 1 Best Western 1 Safeway 1 Carl\s Jr. 1 Subway 1 FedEx 1 Taco Bell 1 H&R Block 1 U-Haul 1 KFC 1 UPS 2 Knights Inn 1 Vons 1
Strongest AM radio stations in Walsenburg:
KOA (850 AM; 50 kW; DENVER, CO; Owner: JACOR BROADCASTING OF COLORADO, INC.)
KKOB (770 AM; 50 kW; ALBUQUERQUE, NM; Owner: CITADEL BROADCASTING COMPANY)
KLTT (670 AM; 50 kW; COMMERCE CITY, CO; Owner: KLZ RADIO, INC.)
KKZN (760 AM; 50 kW; THORNTON, CO; Owner: JACOR BROADCASTING OF COLORADO, INC.)
KMXA (1090 AM; 50 kW; AURORA, CO; Owner: ENTRAVISION HOLDINGS, LLC)
KCBR (1040 AM; daytime; 15 kW; MONUMENT, CO; Owner: KLZ RADIO, INC.)
KGHF (1350 AM; 5 kW; PUEBLO, CO; Owner: CLEAR CHANNEL BROADCASTING LICENSES, INC.)
KFEL (970 AM; 3 kW; PUEBLO, CO; Owner: WELLSPRING HARVEST MINISTRIES, INC.)
KCMN (1530 AM; 15 kW; COLORADO SPRINGS, CO)
KWYD (1580 AM; 10 kW; COLORADO SPRINGS, CO; Owner: PILGRIM COMMUNICATIONS, INC.)
KGYN (1210 AM; 50 kW; GUYMON, OK; Owner: TELNS BROADCASTING COMPANY, INC.)
KTNN (660 AM; 50 kW; WINDOW ROCK, AZ; Owner: THE NAVAJO NATION)
KNZZ (1100 AM; 50 kW; GRAND JUNCTION, CO; Owner: M B C GRAND BROADCASTING, INC.)
Strongest FM radio stations in Walsenburg:
KSPK (102.3 FM; WALSENBURG, CO; Owner: MAINSTREET BROADCASTING COMPANY, INC)
K206BX (89.1 FM; WALSENBURG, CO; Owner: MAKE A DIFFERENCE FOUNDATION, INC.)
KDZA-FM (107.9 FM; PUEBLO, CO; Owner: CAPSTAR TX LIMITED PARTNERSHIP)
K203AT (88.5 FM; WESTCLIFFE, ETC., CO; Owner: THE COLORADO COLLEGE)
KKMG (98.9 FM; PUEBLO, CO; Owner: CITADEL BROADCASTING COMPANY)
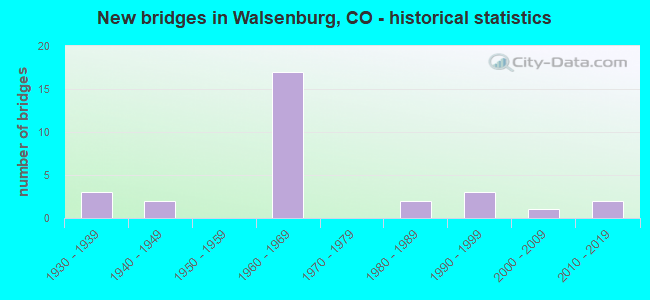
National Bridge Inventory (NBI) Statistics 30 Number of bridges466ft / 142m Total length $20,761,000 Total costs127,468 Total average daily traffic20,675 Total average daily truck traffic
New bridges - historical statistics
3 1930-1939 2 1940-1949 17 1960-1969 2 1980-1989 3 1990-1999 1 2000-2009 2 2010-2019
See full National Bridge Inventory statistics for Walsenburg, CO
Fire-safe hotels and motels in Walsenburg, Colorado:
Knights Inn, 22808 Hwy 160W, Walsenburg, Colorado 81089 Phone: (719) 738-2167
Best Western Rambler, 457 Us Hwy 85-87, Walsenburg, Colorado 81089 Phone: (719) 738-1121, Fax: (719) 738-1093
Rio Cucharas Inn, 77 Taylor Blvd, Walsenburg, Colorado 81089 Phone: (719) 738-1282, Fax: (719) 738-1295
All 3 fire-safe hotels and motels in Walsenburg, Colorado
Most common first names in Walsenburg, CO among deceased individuals Name Count Lived (average)
John 81 76.8 years Mary 64 80.1 years Joe 51 77.3 years Jose 45 79.5 years Frank 37 76.1 years Maria 36 86.4 years James 33 77.1 years Joseph 32 74.1 years Robert 29 70.3 years William 28 74.1 years
Most common last names in Walsenburg, CO among deceased individuals Last name Count Lived (average)
Martinez 85 76.3 years Vigil 57 80.1 years Garcia 36 77.6 years Sandoval 30 76.7 years Trujillo 28 80.2 years Andreatta 22 80.6 years Valdez 20 77.9 years Cordova 20 81.3 years Lucero 18 80.1 years Cruz 17 69.2 years
Walsenburg compared to Colorado state average:
Median household income significantly below state average. Median house value significantly below state average. Black race population percentage significantly below state average. Median age significantly above state average. Foreign-born population percentage significantly below state average. Length of stay since moving in significantly above state average. House age significantly above state average. Number of college students significantly below state average. Percentage of population with a bachelor's degree or higher below state average. Walsenburg on our top lists :
#43 on the list of "Top 101 cities with the largest percentage of people in short-term care, detention or diagnostic centers for delinquent children (population 1,000+)"
#47 on the list of "Top 101 counties with the highest number of deaths per 1000 residents 2007-2013"


 Recent articles from our blog. Our writers, many of them Ph.D. graduates or candidates, create easy-to-read articles on a wide variety of topics.

 (45.2 miles


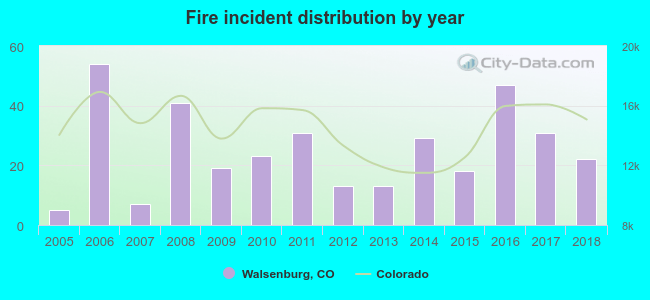 Based on the data from the years 2005 - 2018 the average number of fires per year is 25. The highest number of reported fire incidents - 54 took place in 2006, and the least - 5 in 2005. The data has an increasing trend.
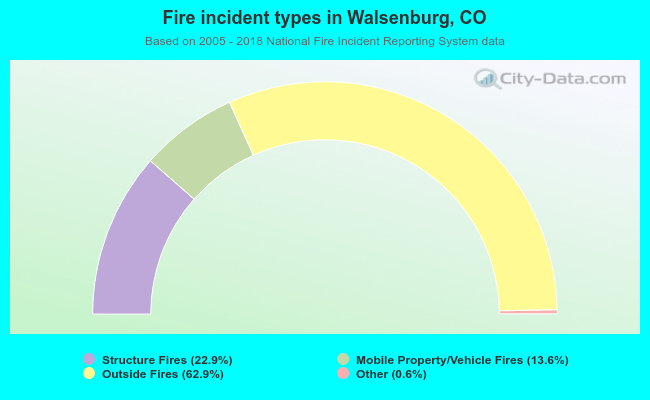 When looking into fire subcategories, the most incidents belonged to: Outside Fires (62.9%), and Structure Fires (22.9%).