Walnut Cove, North Carolina Submit your own pictures of this town and show them to the world
OSM Map
General Map
Google Map
MSN Map
OSM Map
General Map
Google Map
MSN Map
OSM Map
General Map
Google Map
MSN Map
OSM Map
General Map
Google Map
MSN Map
Please wait while loading the map...
Population in 2022: 1,596 (0% urban, 100% rural). Population change since 2000: +8.9%Males: 807 Females: 789
March 2022 cost of living index in Walnut Cove: 80.4 (low, U.S. average is 100) Percentage of residents living in poverty in 2022: 12.6%for White Non-Hispanic residents , 6.2% for Black residents , 60.0% for American Indian residents , 46.4% for two or more races residents )
Profiles of local businesses
Business Search - 14 Million verified businesses
Data:
Median household income ($)
Median household income (% change since 2000)
Household income diversity
Ratio of average income to average house value (%)
Ratio of average income to average rent
Median household income ($) - White
Median household income ($) - Black or African American
Median household income ($) - Asian
Median household income ($) - Hispanic or Latino
Median household income ($) - American Indian and Alaska Native
Median household income ($) - Multirace
Median household income ($) - Other Race
Median household income for houses/condos with a mortgage ($)
Median household income for apartments without a mortgage ($)
Races - White alone (%)
Races - White alone (% change since 2000)
Races - Black alone (%)
Races - Black alone (% change since 2000)
Races - American Indian alone (%)
Races - American Indian alone (% change since 2000)
Races - Asian alone (%)
Races - Asian alone (% change since 2000)
Races - Hispanic (%)
Races - Hispanic (% change since 2000)
Races - Native Hawaiian and Other Pacific Islander alone (%)
Races - Native Hawaiian and Other Pacific Islander alone (% change since 2000)
Races - Two or more races (%)
Races - Two or more races (% change since 2000)
Races - Other race alone (%)
Races - Other race alone (% change since 2000)
Racial diversity
Unemployment (%)
Unemployment (% change since 2000)
Unemployment (%) - White
Unemployment (%) - Black or African American
Unemployment (%) - Asian
Unemployment (%) - Hispanic or Latino
Unemployment (%) - American Indian and Alaska Native
Unemployment (%) - Multirace
Unemployment (%) - Other Race
Population density (people per square mile)
Population - Males (%)
Population - Females (%)
Population - Males (%) - White
Population - Males (%) - Black or African American
Population - Males (%) - Asian
Population - Males (%) - Hispanic or Latino
Population - Males (%) - American Indian and Alaska Native
Population - Males (%) - Multirace
Population - Males (%) - Other Race
Population - Females (%) - White
Population - Females (%) - Black or African American
Population - Females (%) - Asian
Population - Females (%) - Hispanic or Latino
Population - Females (%) - American Indian and Alaska Native
Population - Females (%) - Multirace
Population - Females (%) - Other Race
Coronavirus confirmed cases (May 21, 2024)
Deaths caused by coronavirus (May 21, 2024)
Coronavirus confirmed cases (per 100k population) (May 21, 2024)
Deaths caused by coronavirus (per 100k population) (May 21, 2024)
Daily increase in number of cases (May 21, 2024)
Weekly increase in number of cases (May 21, 2024)
Cases doubled (in days) (May 21, 2024)
Hospitalized patients (Apr 18, 2022)
Negative test results (Apr 18, 2022)
Total test results (Apr 18, 2022)
COVID Vaccine doses distributed (per 100k population) (Sep 19, 2023)
COVID Vaccine doses administered (per 100k population) (Sep 19, 2023)
COVID Vaccine doses distributed (Sep 19, 2023)
COVID Vaccine doses administered (Sep 19, 2023)
Likely homosexual households (%)
Likely homosexual households (% change since 2000)
Likely homosexual households - Lesbian couples (%)
Likely homosexual households - Lesbian couples (% change since 2000)
Likely homosexual households - Gay men (%)
Likely homosexual households - Gay men (% change since 2000)
Cost of living index
Median gross rent ($)
Median contract rent ($)
Median monthly housing costs ($)
Median house or condo value ($)
Median house or condo value ($ change since 2000)
Mean house or condo value by units in structure - 1, detached ($)
Mean house or condo value by units in structure - 1, attached ($)
Mean house or condo value by units in structure - 2 ($)
Mean house or condo value by units in structure by units in structure - 3 or 4 ($)
Mean house or condo value by units in structure - 5 or more ($)
Mean house or condo value by units in structure - Boat, RV, van, etc. ($)
Mean house or condo value by units in structure - Mobile home ($)
Median house or condo value ($) - White
Median house or condo value ($) - Black or African American
Median house or condo value ($) - Asian
Median house or condo value ($) - Hispanic or Latino
Median house or condo value ($) - American Indian and Alaska Native
Median house or condo value ($) - Multirace
Median house or condo value ($) - Other Race
Median resident age
Resident age diversity
Median resident age - Males
Median resident age - Females
Median resident age - White
Median resident age - Black or African American
Median resident age - Asian
Median resident age - Hispanic or Latino
Median resident age - American Indian and Alaska Native
Median resident age - Multirace
Median resident age - Other Race
Median resident age - Males - White
Median resident age - Males - Black or African American
Median resident age - Males - Asian
Median resident age - Males - Hispanic or Latino
Median resident age - Males - American Indian and Alaska Native
Median resident age - Males - Multirace
Median resident age - Males - Other Race
Median resident age - Females - White
Median resident age - Females - Black or African American
Median resident age - Females - Asian
Median resident age - Females - Hispanic or Latino
Median resident age - Females - American Indian and Alaska Native
Median resident age - Females - Multirace
Median resident age - Females - Other Race
Commute - mean travel time to work (minutes)
Travel time to work - Less than 5 minutes (%)
Travel time to work - Less than 5 minutes (% change since 2000)
Travel time to work - 5 to 9 minutes (%)
Travel time to work - 5 to 9 minutes (% change since 2000)
Travel time to work - 10 to 19 minutes (%)
Travel time to work - 10 to 19 minutes (% change since 2000)
Travel time to work - 20 to 29 minutes (%)
Travel time to work - 20 to 29 minutes (% change since 2000)
Travel time to work - 30 to 39 minutes (%)
Travel time to work - 30 to 39 minutes (% change since 2000)
Travel time to work - 40 to 59 minutes (%)
Travel time to work - 40 to 59 minutes (% change since 2000)
Travel time to work - 60 to 89 minutes (%)
Travel time to work - 60 to 89 minutes (% change since 2000)
Travel time to work - 90 or more minutes (%)
Travel time to work - 90 or more minutes (% change since 2000)
Marital status - Never married (%)
Marital status - Now married (%)
Marital status - Separated (%)
Marital status - Widowed (%)
Marital status - Divorced (%)
Median family income ($)
Median family income (% change since 2000)
Median non-family income ($)
Median non-family income (% change since 2000)
Median per capita income ($)
Median per capita income (% change since 2000)
Median family income ($) - White
Median family income ($) - Black or African American
Median family income ($) - Asian
Median family income ($) - Hispanic or Latino
Median family income ($) - American Indian and Alaska Native
Median family income ($) - Multirace
Median family income ($) - Other Race
Median year house/condo built
Median year apartment built
Year house built - Built 2005 or later (%)
Year house built - Built 2000 to 2004 (%)
Year house built - Built 1990 to 1999 (%)
Year house built - Built 1980 to 1989 (%)
Year house built - Built 1970 to 1979 (%)
Year house built - Built 1960 to 1969 (%)
Year house built - Built 1950 to 1959 (%)
Year house built - Built 1940 to 1949 (%)
Year house built - Built 1939 or earlier (%)
Average household size
Household density (households per square mile)
Average household size - White
Average household size - Black or African American
Average household size - Asian
Average household size - Hispanic or Latino
Average household size - American Indian and Alaska Native
Average household size - Multirace
Average household size - Other Race
Occupied housing units (%)
Vacant housing units (%)
Owner occupied housing units (%)
Renter occupied housing units (%)
Vacancy status - For rent (%)
Vacancy status - For sale only (%)
Vacancy status - Rented or sold, not occupied (%)
Vacancy status - For seasonal, recreational, or occasional use (%)
Vacancy status - For migrant workers (%)
Vacancy status - Other vacant (%)
Residents with income below the poverty level (%)
Residents with income below 50% of the poverty level (%)
Children below poverty level (%)
Poor families by family type - Married-couple family (%)
Poor families by family type - Male, no wife present (%)
Poor families by family type - Female, no husband present (%)
Poverty status for native-born residents (%)
Poverty status for foreign-born residents (%)
Poverty among high school graduates not in families (%)
Poverty among people who did not graduate high school not in families (%)
Residents with income below the poverty level (%) - White
Residents with income below the poverty level (%) - Black or African American
Residents with income below the poverty level (%) - Asian
Residents with income below the poverty level (%) - Hispanic or Latino
Residents with income below the poverty level (%) - American Indian and Alaska Native
Residents with income below the poverty level (%) - Multirace
Residents with income below the poverty level (%) - Other Race
Air pollution - Air Quality Index (AQI)
Air pollution - CO
Air pollution - NO2
Air pollution - SO2
Air pollution - Ozone
Air pollution - PM10
Air pollution - PM25
Air pollution - Pb
Crime - Murders per 100,000 population
Crime - Rapes per 100,000 population
Crime - Robberies per 100,000 population
Crime - Assaults per 100,000 population
Crime - Burglaries per 100,000 population
Crime - Thefts per 100,000 population
Crime - Auto thefts per 100,000 population
Crime - Arson per 100,000 population
Crime - City-data.com crime index
Crime - Violent crime index
Crime - Property crime index
Crime - Murders per 100,000 population (5 year average)
Crime - Rapes per 100,000 population (5 year average)
Crime - Robberies per 100,000 population (5 year average)
Crime - Assaults per 100,000 population (5 year average)
Crime - Burglaries per 100,000 population (5 year average)
Crime - Thefts per 100,000 population (5 year average)
Crime - Auto thefts per 100,000 population (5 year average)
Crime - Arson per 100,000 population (5 year average)
Crime - City-data.com crime index (5 year average)
Crime - Violent crime index (5 year average)
Crime - Property crime index (5 year average)
1996 Presidential Elections Results (%) - Democratic Party (Clinton)
1996 Presidential Elections Results (%) - Republican Party (Dole)
1996 Presidential Elections Results (%) - Other
2000 Presidential Elections Results (%) - Democratic Party (Gore)
2000 Presidential Elections Results (%) - Republican Party (Bush)
2000 Presidential Elections Results (%) - Other
2004 Presidential Elections Results (%) - Democratic Party (Kerry)
2004 Presidential Elections Results (%) - Republican Party (Bush)
2004 Presidential Elections Results (%) - Other
2008 Presidential Elections Results (%) - Democratic Party (Obama)
2008 Presidential Elections Results (%) - Republican Party (McCain)
2008 Presidential Elections Results (%) - Other
2012 Presidential Elections Results (%) - Democratic Party (Obama)
2012 Presidential Elections Results (%) - Republican Party (Romney)
2012 Presidential Elections Results (%) - Other
2016 Presidential Elections Results (%) - Democratic Party (Clinton)
2016 Presidential Elections Results (%) - Republican Party (Trump)
2016 Presidential Elections Results (%) - Other
2020 Presidential Elections Results (%) - Democratic Party (Biden)
2020 Presidential Elections Results (%) - Republican Party (Trump)
2020 Presidential Elections Results (%) - Other
Ancestries Reported - Arab (%)
Ancestries Reported - Czech (%)
Ancestries Reported - Danish (%)
Ancestries Reported - Dutch (%)
Ancestries Reported - English (%)
Ancestries Reported - French (%)
Ancestries Reported - French Canadian (%)
Ancestries Reported - German (%)
Ancestries Reported - Greek (%)
Ancestries Reported - Hungarian (%)
Ancestries Reported - Irish (%)
Ancestries Reported - Italian (%)
Ancestries Reported - Lithuanian (%)
Ancestries Reported - Norwegian (%)
Ancestries Reported - Polish (%)
Ancestries Reported - Portuguese (%)
Ancestries Reported - Russian (%)
Ancestries Reported - Scotch-Irish (%)
Ancestries Reported - Scottish (%)
Ancestries Reported - Slovak (%)
Ancestries Reported - Subsaharan African (%)
Ancestries Reported - Swedish (%)
Ancestries Reported - Swiss (%)
Ancestries Reported - Ukrainian (%)
Ancestries Reported - United States (%)
Ancestries Reported - Welsh (%)
Ancestries Reported - West Indian (%)
Ancestries Reported - Other (%)
Educational Attainment - No schooling completed (%)
Educational Attainment - Less than high school (%)
Educational Attainment - High school or equivalent (%)
Educational Attainment - Less than 1 year of college (%)
Educational Attainment - 1 or more years of college (%)
Educational Attainment - Associate degree (%)
Educational Attainment - Bachelor's degree (%)
Educational Attainment - Master's degree (%)
Educational Attainment - Professional school degree (%)
Educational Attainment - Doctorate degree (%)
School Enrollment - Nursery, preschool (%)
School Enrollment - Kindergarten (%)
School Enrollment - Grade 1 to 4 (%)
School Enrollment - Grade 5 to 8 (%)
School Enrollment - Grade 9 to 12 (%)
School Enrollment - College undergrad (%)
School Enrollment - Graduate or professional (%)
School Enrollment - Not enrolled in school (%)
School enrollment - Public schools (%)
School enrollment - Private schools (%)
School enrollment - Not enrolled (%)
Median number of rooms in houses and condos
Median number of rooms in apartments
Housing units lacking complete plumbing facilities (%)
Housing units lacking complete kitchen facilities (%)
Density of houses
Urban houses (%)
Rural houses (%)
Households with people 60 years and over (%)
Households with people 65 years and over (%)
Households with people 75 years and over (%)
Households with one or more nonrelatives (%)
Households with no nonrelatives (%)
Population in households (%)
Family households (%)
Nonfamily households (%)
Population in families (%)
Family households with own children (%)
Median number of bedrooms in owner occupied houses
Mean number of bedrooms in owner occupied houses
Median number of bedrooms in renter occupied houses
Mean number of bedrooms in renter occupied houses
Median number of vehichles in owner occupied houses
Mean number of vehichles in owner occupied houses
Median number of vehichles in renter occupied houses
Mean number of vehichles in renter occupied houses
Mortgage status - with mortgage (%)
Mortgage status - with second mortgage (%)
Mortgage status - with home equity loan (%)
Mortgage status - with both second mortgage and home equity loan (%)
Mortgage status - without a mortgage (%)
Average family size
Average family size - White
Average family size - Black or African American
Average family size - Asian
Average family size - Hispanic or Latino
Average family size - American Indian and Alaska Native
Average family size - Multirace
Average family size - Other Race
Geographical mobility - Same house 1 year ago (%)
Geographical mobility - Moved within same county (%)
Geographical mobility - Moved from different county within same state (%)
Geographical mobility - Moved from different state (%)
Geographical mobility - Moved from abroad (%)
Place of birth - Born in state of residence (%)
Place of birth - Born in other state (%)
Place of birth - Native, outside of US (%)
Place of birth - Foreign born (%)
Housing units in structures - 1, detached (%)
Housing units in structures - 1, attached (%)
Housing units in structures - 2 (%)
Housing units in structures - 3 or 4 (%)
Housing units in structures - 5 to 9 (%)
Housing units in structures - 10 to 19 (%)
Housing units in structures - 20 to 49 (%)
Housing units in structures - 50 or more (%)
Housing units in structures - Mobile home (%)
Housing units in structures - Boat, RV, van, etc. (%)
House/condo owner moved in on average (years ago)
Renter moved in on average (years ago)
Year householder moved into unit - Moved in 1999 to March 2000 (%)
Year householder moved into unit - Moved in 1995 to 1998 (%)
Year householder moved into unit - Moved in 1990 to 1994 (%)
Year householder moved into unit - Moved in 1980 to 1989 (%)
Year householder moved into unit - Moved in 1970 to 1979 (%)
Year householder moved into unit - Moved in 1969 or earlier (%)
Means of transportation to work - Drove car alone (%)
Means of transportation to work - Carpooled (%)
Means of transportation to work - Public transportation (%)
Means of transportation to work - Bus or trolley bus (%)
Means of transportation to work - Streetcar or trolley car (%)
Means of transportation to work - Subway or elevated (%)
Means of transportation to work - Railroad (%)
Means of transportation to work - Ferryboat (%)
Means of transportation to work - Taxicab (%)
Means of transportation to work - Motorcycle (%)
Means of transportation to work - Bicycle (%)
Means of transportation to work - Walked (%)
Means of transportation to work - Other means (%)
Working at home (%)
Industry diversity
Most Common Industries - Agriculture, forestry, fishing and hunting, and mining (%)
Most Common Industries - Agriculture, forestry, fishing and hunting (%)
Most Common Industries - Mining, quarrying, and oil and gas extraction (%)
Most Common Industries - Construction (%)
Most Common Industries - Manufacturing (%)
Most Common Industries - Wholesale trade (%)
Most Common Industries - Retail trade (%)
Most Common Industries - Transportation and warehousing, and utilities (%)
Most Common Industries - Transportation and warehousing (%)
Most Common Industries - Utilities (%)
Most Common Industries - Information (%)
Most Common Industries - Finance and insurance, and real estate and rental and leasing (%)
Most Common Industries - Finance and insurance (%)
Most Common Industries - Real estate and rental and leasing (%)
Most Common Industries - Professional, scientific, and management, and administrative and waste management services (%)
Most Common Industries - Professional, scientific, and technical services (%)
Most Common Industries - Management of companies and enterprises (%)
Most Common Industries - Administrative and support and waste management services (%)
Most Common Industries - Educational services, and health care and social assistance (%)
Most Common Industries - Educational services (%)
Most Common Industries - Health care and social assistance (%)
Most Common Industries - Arts, entertainment, and recreation, and accommodation and food services (%)
Most Common Industries - Arts, entertainment, and recreation (%)
Most Common Industries - Accommodation and food services (%)
Most Common Industries - Other services, except public administration (%)
Most Common Industries - Public administration (%)
Occupation diversity
Most Common Occupations - Management, business, science, and arts occupations (%)
Most Common Occupations - Management, business, and financial occupations (%)
Most Common Occupations - Management occupations (%)
Most Common Occupations - Business and financial operations occupations (%)
Most Common Occupations - Computer, engineering, and science occupations (%)
Most Common Occupations - Computer and mathematical occupations (%)
Most Common Occupations - Architecture and engineering occupations (%)
Most Common Occupations - Life, physical, and social science occupations (%)
Most Common Occupations - Education, legal, community service, arts, and media occupations (%)
Most Common Occupations - Community and social service occupations (%)
Most Common Occupations - Legal occupations (%)
Most Common Occupations - Education, training, and library occupations (%)
Most Common Occupations - Arts, design, entertainment, sports, and media occupations (%)
Most Common Occupations - Healthcare practitioners and technical occupations (%)
Most Common Occupations - Health diagnosing and treating practitioners and other technical occupations (%)
Most Common Occupations - Health technologists and technicians (%)
Most Common Occupations - Service occupations (%)
Most Common Occupations - Healthcare support occupations (%)
Most Common Occupations - Protective service occupations (%)
Most Common Occupations - Fire fighting and prevention, and other protective service workers including supervisors (%)
Most Common Occupations - Law enforcement workers including supervisors (%)
Most Common Occupations - Food preparation and serving related occupations (%)
Most Common Occupations - Building and grounds cleaning and maintenance occupations (%)
Most Common Occupations - Personal care and service occupations (%)
Most Common Occupations - Sales and office occupations (%)
Most Common Occupations - Sales and related occupations (%)
Most Common Occupations - Office and administrative support occupations (%)
Most Common Occupations - Natural resources, construction, and maintenance occupations (%)
Most Common Occupations - Farming, fishing, and forestry occupations (%)
Most Common Occupations - Construction and extraction occupations (%)
Most Common Occupations - Installation, maintenance, and repair occupations (%)
Most Common Occupations - Production, transportation, and material moving occupations (%)
Most Common Occupations - Production occupations (%)
Most Common Occupations - Transportation occupations (%)
Most Common Occupations - Material moving occupations (%)
People in Group quarters - Institutionalized population (%)
People in Group quarters - Correctional institutions (%)
People in Group quarters - Federal prisons and detention centers (%)
People in Group quarters - Halfway houses (%)
People in Group quarters - Local jails and other confinement facilities (including police lockups) (%)
People in Group quarters - Military disciplinary barracks (%)
People in Group quarters - State prisons (%)
People in Group quarters - Other types of correctional institutions (%)
People in Group quarters - Nursing homes (%)
People in Group quarters - Hospitals/wards, hospices, and schools for the handicapped (%)
People in Group quarters - Hospitals/wards and hospices for chronically ill (%)
People in Group quarters - Hospices or homes for chronically ill (%)
People in Group quarters - Military hospitals or wards for chronically ill (%)
People in Group quarters - Other hospitals or wards for chronically ill (%)
People in Group quarters - Hospitals or wards for drug/alcohol abuse (%)
People in Group quarters - Mental (Psychiatric) hospitals or wards (%)
People in Group quarters - Schools, hospitals, or wards for the mentally retarded (%)
People in Group quarters - Schools, hospitals, or wards for the physically handicapped (%)
People in Group quarters - Institutions for the deaf (%)
People in Group quarters - Institutions for the blind (%)
People in Group quarters - Orthopedic wards and institutions for the physically handicapped (%)
People in Group quarters - Wards in general hospitals for patients who have no usual home elsewhere (%)
People in Group quarters - Wards in military hospitals for patients who have no usual home elsewhere (%)
People in Group quarters - Juvenile institutions (%)
People in Group quarters - Long-term care (%)
People in Group quarters - Homes for abused, dependent, and neglected children (%)
People in Group quarters - Residential treatment centers for emotionally disturbed children (%)
People in Group quarters - Training schools for juvenile delinquents (%)
People in Group quarters - Short-term care, detention or diagnostic centers for delinquent children (%)
People in Group quarters - Type of juvenile institution unknown (%)
People in Group quarters - Noninstitutionalized population (%)
People in Group quarters - College dormitories (includes college quarters off campus) (%)
People in Group quarters - Military quarters (%)
People in Group quarters - On base (%)
People in Group quarters - Barracks, unaccompanied personnel housing (UPH), (Enlisted/Officer), ;and similar group living quarters for military personnel (%)
People in Group quarters - Transient quarters for temporary residents (%)
People in Group quarters - Military ships (%)
People in Group quarters - Group homes (%)
People in Group quarters - Homes or halfway houses for drug/alcohol abuse (%)
People in Group quarters - Homes for the mentally ill (%)
People in Group quarters - Homes for the mentally retarded (%)
People in Group quarters - Homes for the physically handicapped (%)
People in Group quarters - Other group homes (%)
People in Group quarters - Religious group quarters (%)
People in Group quarters - Dormitories (%)
People in Group quarters - Agriculture workers' dormitories on farms (%)
People in Group quarters - Job Corps and vocational training facilities (%)
People in Group quarters - Other workers' dormitories (%)
People in Group quarters - Crews of maritime vessels (%)
People in Group quarters - Other nonhousehold living situations (%)
People in Group quarters - Other noninstitutional group quarters (%)
Residents speaking English at home (%)
Residents speaking English at home - Born in the United States (%)
Residents speaking English at home - Native, born elsewhere (%)
Residents speaking English at home - Foreign born (%)
Residents speaking Spanish at home (%)
Residents speaking Spanish at home - Born in the United States (%)
Residents speaking Spanish at home - Native, born elsewhere (%)
Residents speaking Spanish at home - Foreign born (%)
Residents speaking other language at home (%)
Residents speaking other language at home - Born in the United States (%)
Residents speaking other language at home - Native, born elsewhere (%)
Residents speaking other language at home - Foreign born (%)
Class of Workers - Employee of private company (%)
Class of Workers - Self-employed in own incorporated business (%)
Class of Workers - Private not-for-profit wage and salary workers (%)
Class of Workers - Local government workers (%)
Class of Workers - State government workers (%)
Class of Workers - Federal government workers (%)
Class of Workers - Self-employed workers in own not incorporated business and Unpaid family workers (%)
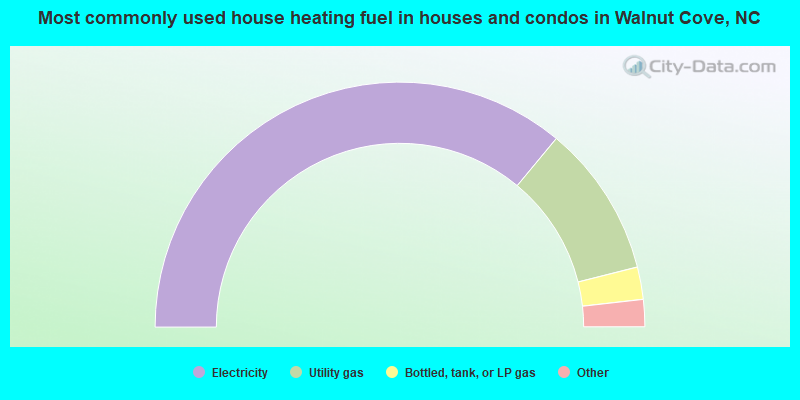
House heating fuel used in houses and condos - Utility gas (%)
House heating fuel used in houses and condos - Bottled, tank, or LP gas (%)
House heating fuel used in houses and condos - Electricity (%)
House heating fuel used in houses and condos - Fuel oil, kerosene, etc. (%)
House heating fuel used in houses and condos - Coal or coke (%)
House heating fuel used in houses and condos - Wood (%)
House heating fuel used in houses and condos - Solar energy (%)
House heating fuel used in houses and condos - Other fuel (%)
House heating fuel used in houses and condos - No fuel used (%)
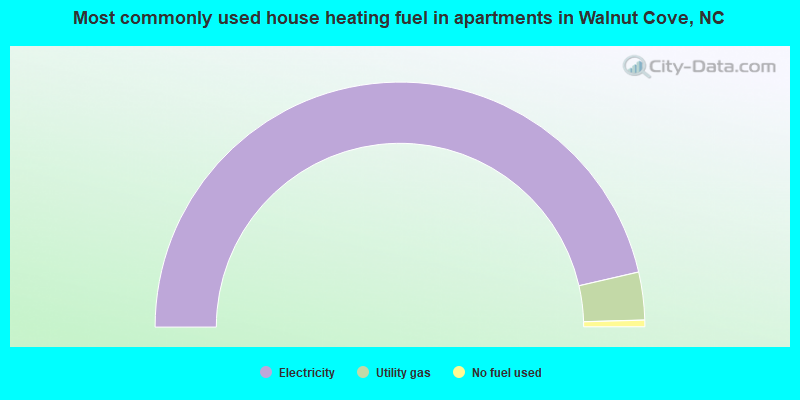
House heating fuel used in apartments - Utility gas (%)
House heating fuel used in apartments - Bottled, tank, or LP gas (%)
House heating fuel used in apartments - Electricity (%)
House heating fuel used in apartments - Fuel oil, kerosene, etc. (%)
House heating fuel used in apartments - Coal or coke (%)
House heating fuel used in apartments - Wood (%)
House heating fuel used in apartments - Solar energy (%)
House heating fuel used in apartments - Other fuel (%)
House heating fuel used in apartments - No fuel used (%)
Armed forces status - In Armed Forces (%)
Armed forces status - Civilian (%)
Armed forces status - Civilian - Veteran (%)
Armed forces status - Civilian - Nonveteran (%)
Fatal accidents locations in years 2005-2021
Fatal accidents locations in 2005
Fatal accidents locations in 2006
Fatal accidents locations in 2007
Fatal accidents locations in 2008
Fatal accidents locations in 2009
Fatal accidents locations in 2010
Fatal accidents locations in 2011
Fatal accidents locations in 2012
Fatal accidents locations in 2013
Fatal accidents locations in 2014
Fatal accidents locations in 2015
Fatal accidents locations in 2016
Fatal accidents locations in 2017
Fatal accidents locations in 2018
Fatal accidents locations in 2019
Fatal accidents locations in 2020
Fatal accidents locations in 2021
Alcohol use - People drinking some alcohol every month (%)
Alcohol use - People not drinking at all (%)
Alcohol use - Average days/month drinking alcohol
Alcohol use - Average drinks/week
Alcohol use - Average days/year people drink much
Audiometry - Average condition of hearing (%)
Audiometry - People that can hear a whisper from across a quiet room (%)
Audiometry - People that can hear normal voice from across a quiet room (%)
Audiometry - Ears ringing, roaring, buzzing (%)
Audiometry - Had a job exposure to loud noise (%)
Audiometry - Had off-work exposure to loud noise (%)
Blood Pressure & Cholesterol - Has high blood pressure (%)
Blood Pressure & Cholesterol - Checking blood pressure at home (%)
Blood Pressure & Cholesterol - Frequently checking blood cholesterol (%)
Blood Pressure & Cholesterol - Has high cholesterol level (%)
Consumer Behavior - Money monthly spent on food at supermarket/grocery store
Consumer Behavior - Money monthly spent on food at other stores
Consumer Behavior - Money monthly spent on eating out
Consumer Behavior - Money monthly spent on carryout/delivered foods
Consumer Behavior - Income spent on food at supermarket/grocery store (%)
Consumer Behavior - Income spent on food at other stores (%)
Consumer Behavior - Income spent on eating out (%)
Consumer Behavior - Income spent on carryout/delivered foods (%)
Current Health Status - General health condition (%)
Current Health Status - Blood donors (%)
Current Health Status - Has blood ever tested for HIV virus (%)
Current Health Status - Left-handed people (%)
Dermatology - People using sunscreen (%)
Diabetes - Diabetics (%)
Diabetes - Had a blood test for high blood sugar (%)
Diabetes - People taking insulin (%)
Diet Behavior & Nutrition - Diet health (%)
Diet Behavior & Nutrition - Milk product consumption (# of products/month)
Diet Behavior & Nutrition - Meals not home prepared (#/week)
Diet Behavior & Nutrition - Meals from fast food or pizza place (#/week)
Diet Behavior & Nutrition - Ready-to-eat foods (#/month)
Diet Behavior & Nutrition - Frozen meals/pizza (#/month)
Drug Use - People that ever used marijuana or hashish (%)
Drug Use - Ever used hard drugs (%)
Drug Use - Ever used any form of cocaine (%)
Drug Use - Ever used heroin (%)
Drug Use - Ever used methamphetamine (%)
Health Insurance - People covered by health insurance (%)
Kidney Conditions-Urology - Avg. # of times urinating at night
Medical Conditions - People with asthma (%)
Medical Conditions - People with anemia (%)
Medical Conditions - People with psoriasis (%)
Medical Conditions - People with overweight (%)
Medical Conditions - Elderly people having difficulties in thinking or remembering (%)
Medical Conditions - People who ever received blood transfusion (%)
Medical Conditions - People having trouble seeing even with glass/contacts (%)
Medical Conditions - People with arthritis (%)
Medical Conditions - People with gout (%)
Medical Conditions - People with congestive heart failure (%)
Medical Conditions - People with coronary heart disease (%)
Medical Conditions - People with angina pectoris (%)
Medical Conditions - People who ever had heart attack (%)
Medical Conditions - People who ever had stroke (%)
Medical Conditions - People with emphysema (%)
Medical Conditions - People with thyroid problem (%)
Medical Conditions - People with chronic bronchitis (%)
Medical Conditions - People with any liver condition (%)
Medical Conditions - People who ever had cancer or malignancy (%)
Mental Health - People who have little interest in doing things (%)
Mental Health - People feeling down, depressed, or hopeless (%)
Mental Health - People who have trouble sleeping or sleeping too much (%)
Mental Health - People feeling tired or having little energy (%)
Mental Health - People with poor appetite or overeating (%)
Mental Health - People feeling bad about themself (%)
Mental Health - People who have trouble concentrating on things (%)
Mental Health - People moving or speaking slowly or too fast (%)
Mental Health - People having thoughts they would be better off dead (%)
Oral Health - Average years since last visit a dentist
Oral Health - People embarrassed because of mouth (%)
Oral Health - People with gum disease (%)
Oral Health - General health of teeth and gums (%)
Oral Health - Average days a week using dental floss/device
Oral Health - Average days a week using mouthwash for dental problem
Oral Health - Average number of teeth
Pesticide Use - Households using pesticides to control insects (%)
Pesticide Use - Households using pesticides to kill weeds (%)
Physical Activity - People doing vigorous-intensity work activities (%)
Physical Activity - People doing moderate-intensity work activities (%)
Physical Activity - People walking or bicycling (%)
Physical Activity - People doing vigorous-intensity recreational activities (%)
Physical Activity - People doing moderate-intensity recreational activities (%)
Physical Activity - Average hours a day doing sedentary activities
Physical Activity - Average hours a day watching TV or videos
Physical Activity - Average hours a day using computer
Physical Functioning - People having limitations keeping them from working (%)
Physical Functioning - People limited in amount of work they can do (%)
Physical Functioning - People that need special equipment to walk (%)
Physical Functioning - People experiencing confusion/memory problems (%)
Physical Functioning - People requiring special healthcare equipment (%)
Prescription Medications - Average number of prescription medicines taking
Preventive Aspirin Use - Adults 40+ taking low-dose aspirin (%)
Reproductive Health - Vaginal deliveries (%)
Reproductive Health - Cesarean deliveries (%)
Reproductive Health - Deliveries resulted in a live birth (%)
Reproductive Health - Pregnancies resulted in a delivery (%)
Reproductive Health - Women breastfeeding newborns (%)
Reproductive Health - Women that had a hysterectomy (%)
Reproductive Health - Women that had both ovaries removed (%)
Reproductive Health - Women that have ever taken birth control pills (%)
Reproductive Health - Women taking birth control pills (%)
Reproductive Health - Women that have ever used Depo-Provera or injectables (%)
Reproductive Health - Women that have ever used female hormones (%)
Sexual Behavior - People 18+ that ever had sex (vaginal, anal, or oral) (%)
Sexual Behavior - Males 18+ that ever had vaginal sex with a woman (%)
Sexual Behavior - Males 18+ that ever performed oral sex on a woman (%)
Sexual Behavior - Males 18+ that ever had anal sex with a woman (%)
Sexual Behavior - Males 18+ that ever had any sex with a man (%)
Sexual Behavior - Females 18+ that ever had vaginal sex with a man (%)
Sexual Behavior - Females 18+ that ever performed oral sex on a man (%)
Sexual Behavior - Females 18+ that ever had anal sex with a man (%)
Sexual Behavior - Females 18+ that ever had any kind of sex with a woman (%)
Sexual Behavior - Average age people first had sex
Sexual Behavior - Average number of female sex partners in lifetime (males 18+)
Sexual Behavior - Average number of female vaginal sex partners in lifetime (males 18+)
Sexual Behavior - Average age people first performed oral sex on a woman (18+)
Sexual Behavior - Average number of woman performed oral sex on in lifetime (18+)
Sexual Behavior - Average number of male sex partners in lifetime (males 18+)
Sexual Behavior - Average number of male anal sex partners in lifetime (males 18+)
Sexual Behavior - Average age people first performed oral sex on a man (18+)
Sexual Behavior - Average number of male oral sex partners in lifetime (18+)
Sexual Behavior - People using protection when performing oral sex (%)
Sexual Behavior - Average number of times people have vaginal or anal sex a year
Sexual Behavior - People having sex without condom (%)
Sexual Behavior - Average number of male sex partners in lifetime (females 18+)
Sexual Behavior - Average number of male vaginal sex partners in lifetime (females 18+)
Sexual Behavior - Average number of female sex partners in lifetime (females 18+)
Sexual Behavior - Circumcised males 18+ (%)
Sleep Disorders - Average hours sleeping at night
Sleep Disorders - People that has trouble sleeping (%)
Smoking-Cigarette Use - People smoking cigarettes (%)
Taste & Smell - People 40+ having problems with smell (%)
Taste & Smell - People 40+ having problems with taste (%)
Taste & Smell - People 40+ that ever had wisdom teeth removed (%)
Taste & Smell - People 40+ that ever had tonsils teeth removed (%)
Taste & Smell - People 40+ that ever had a loss of consciousness because of a head injury (%)
Taste & Smell - People 40+ that ever had a broken nose or other serious injury to face or skull (%)
Taste & Smell - People 40+ that ever had two or more sinus infections (%)
Weight - Average height (inches)
Weight - Average weight (pounds)
Weight - Average BMI
Weight - People that are obese (%)
Weight - People that ever were obese (%)
Weight - People trying to lose weight (%)
Latest news from Walnut Cove, NC collected exclusively by city-data.com from local newspapers, TV, and radio stations
Ancestries: English (12.9%), American (9.7%), Scottish (4.5%), European (2.8%), German (2.5%), Irish (1.9%).
Current Local Time:
Land area: 2.41 square miles.
Population density: 663 people per square mile (low).
26 residents are foreign born
This town:
1.3%North Carolina:
8.3%
Median real estate property taxes paid for housing units with mortgages in 2022: $1,438 (0.7%)Median real estate property taxes paid for housing units with no mortgage in 2022: $1,188 (0.7%)
Nearest city with pop. 50,000+: Winston-Salem, NC
Nearest city with pop. 200,000+: Greensboro, NC
Nearest city with pop. 1,000,000+: Philadelphia, PA
Nearest cities:
Danbury, NC (2.9 miles),
Latitude: 36.30 N, Longitude: 80.14 W
Single-family new house construction building permits:
2022: 4 buildings , average cost: $211,1002020: 3 buildings , average cost: $250,0002017: 2 buildings , average cost: $190,0002016: 3 buildings , average cost: $201,7002014: 3 buildings , average cost: $146,7002013: 4 buildings , average cost: $121,3002012: 4 buildings , average cost: $102,5002011: 3 buildings , average cost: $201,7002008: 10 buildings , average cost: $176,4002007: 7 buildings , average cost: $167,6002006: 3 buildings , average cost: $79,6002005: 16 buildings , average cost: $100,9002004: 35 buildings , average cost: $75,3002003: 6 buildings , average cost: $96,3002002: 13 buildings , average cost: $111,3002001: 8 buildings , average cost: $89,6002000: 4 buildings , average cost: $181,3001999: 4 buildings , average cost: $121,3001998: 5 buildings , average cost: $132,3001997: 1 building , cost: $100,000Unemployment in December 2023: Here:
2.8%North Carolina:
3.2%
Population change in the 1990s: +134 (+10.1%).
Most common occupations in Walnut Cove, NC (%)
Both Males Females
Other production occupations, including supervisors (5.9%)
Other management occupations, except farmers and farm managers (5.5%)
Laborers and material movers, hand (4.3%)
Driver/sales workers and truck drivers (4.1%)
Other sales and related occupations, including supervisors (3.6%)
Retail sales workers, except cashiers (3.4%)
Textile, apparel, and furnishings workers (3.2%)
Other production occupations, including supervisors (8.7%)
Driver/sales workers and truck drivers (8.0%)
Laborers and material movers, hand (7.3%)
Other management occupations, except farmers and farm managers (4.5%)
Material recording, scheduling, dispatching, and distributing workers (4.5%)
Building and grounds cleaning and maintenance occupations (4.2%)
Retail sales workers, except cashiers (4.2%)
Other management occupations, except farmers and farm managers (6.6%)
Preschool, kindergarten, elementary, and middle school teachers (5.5%)
Other office and administrative support workers, including supervisors (5.2%)
Nursing, psychiatric, and home health aides (5.2%)
Cashiers (4.1%)
Other sales and related occupations, including supervisors (4.1%)
Personal appearance workers (3.7%)
Tornado activity:
Walnut Cove-area historical tornado activity is slightly below North Carolina state average. It is 33% smaller than the overall U.S. average.
On 5/5/1989, a category F3 (max. wind speeds 158-206 mph) tornado 5.8 miles away from the Walnut Cove town center injured 30 people and caused between $5,000,000 and $50,000,000 in damages.
On 3/20/1998, a category F3 tornado 11.5 miles away from the town center killed 2 people and injured 27 people and caused $34 million in damages.
Earthquake activity:
Walnut Cove-area historical earthquake activity is significantly above North Carolina state average. It is 27% smaller than the overall U.S. average. On 8/23/2011 at 17:51:04, a magnitude 5.8 (5.8 MW, Depth: 3.7 mi, Class: Moderate, Intensity: VI - VII) earthquake occurred 165.1 miles away from Walnut Cove center On 8/9/2020 at 12:07:37, a magnitude 5.1 (5.1 MW, Depth: 4.7 mi) earthquake occurred 54.5 miles away from Walnut Cove center On 7/27/1980 at 18:52:21, a magnitude 5.2 (5.1 MB, 4.7 MS, 5.0 UK, 5.2 UK) earthquake occurred 247.4 miles away from the city center On 8/2/1974 at 08:52:09, a magnitude 4.9 (4.3 MB, 4.9 LG, Class: Light, Intensity: IV - V) earthquake occurred 213.9 miles away from the city center On 12/9/2003 at 20:59:18, a magnitude 4.5 (4.5 ML, Depth: 6.2 mi) earthquake occurred 152.1 miles away from Walnut Cove center On 12/9/2003 at 20:59:14, a magnitude 4.5 (4.5 MB, 4.5 LG) earthquake occurred 152.6 miles away from the city center Magnitude types: regional Lg-wave magnitude (LG), body-wave magnitude (MB), local magnitude (ML), surface-wave magnitude (MS), moment magnitude (MW) Natural disasters: The number of natural disasters in Stokes County (15) is near the US average (15).Major Disasters (Presidential) Declared: 6Emergencies Declared: 6Hurricanes: 6, Droughts: 2, Floods: 2, Storms: 2, Blizzard: 1, Freeze: 1, Ice Storm: 1, Snowfall: 1, Tornado: 1, Tropical Storm: 1, Winter Storm: 1, Other: 1 (Note: some incidents may be assigned to more than one category). Hospitals and medical centers in Walnut Cove: WALNUT COVE HEALTH AND REHABILITATION CENTER (511 WINDMILL ST)
Other hospitals and medical centers near Walnut Cove: FORSYTH GROUP HOME #2 (Hospital, about 6 miles away; BELEWS CREEK, NC)
OAK FOREST HEALTH AND REHABILITATION (Nursing Home, about 10 miles away; WINSTON SALEM, NC)
GENTIVA HEALTH SERVICES (Home Health Center, about 12 miles away; KING, NC)
KING DIALYSIS CENTER OF WAKE FOREST UNIVERSITY (Dialysis Facility, about 12 miles away; KING, NC)
NORTHSIDE DIALYSIS CENTER OF WAKE FOREST UNIVERISITY (Dialysis Facility, about 12 miles away; WINSTON SALEM, NC)
FORSYTH GROUP HOME #1 (Hospital, about 12 miles away; KERNERSVILLE, NC)
MADISON DIALYSIS CENTER (Dialysis Facility, about 12 miles away; MADISON, NC)
Amtrak station near Walnut Cove: 16 miles: WINSTON-SALEM (127 S. CHERRY ST.) - Bus Station Services: fully wheelchair accessible, enclosed waiting area, public restrooms, public payphones, vending machines, free short-term parking, free long-term parking, call for taxi service.
Colleges/universities with over 2000 students nearest to Walnut Cove:
Wake Forest University (about 14 miles; Winston Salem, NC ; Full-time enrollment: 6,407)
Winston-Salem State University (about 16 miles; Winston-Salem, NC ; FT enrollment: 5,378)
Forsyth Technical Community College (about 18 miles; Winston Salem, NC ; FT enrollment: 7,190)
Guilford College (about 20 miles; Greensboro, NC ; FT enrollment: 2,211)
High Point University (about 24 miles; High Point, NC ; FT enrollment: 4,240)
Guilford Technical Community College (about 25 miles; Jamestown, NC ; FT enrollment: 13,068)
University of North Carolina at Greensboro (about 25 miles; Greensboro, NC ; FT enrollment: 16,174)
Public high schools in Walnut Cove: SOUTH STOKES HIGH Location: 1100 S STOKES HIGH DRIVE, Grades: 9-12)STOKES EARLY COLLEGE Location: 1165 DODGETOWN RD, Grades: 9-12)
Public elementary/middle schools in Walnut Cove: SOUTHEASTERN MIDDLE Location: 1044 N MAIN STREET, Grades: 6-8)
LONDON ELEMENTARY Location: 609 SCHOOL STREET, Grades: PK-5)WALNUT COVE ELEMENTARY Location: 1211 WALNUT COVE SCHOOL RD, Grades: PK-5)See full list of schools located in Walnut Cove Birthplace of: Burt Myers - Racing driver, Alex Yontz - Craftsman Truck series NASCAR driver (born : Jul 13, 1986).
Stokes County has a predicted average indoor radon screening level between 2 and 4 pCi/L (pico curies per liter) - Moderate Potential Drinking water stations with addresses in Walnut Cove and their reported violations in the past:
HILLBILLY HIDE AWAY (Population served: 250, Groundwater):
Past monitoring violations:
One routine major monitoring violation
Population served: 150, Groundwater):
Past health violations:
MCL, Monthly (TCR) - In AUG-2013, Contaminant: Coliform. Follow-up actions: St AO (w/o penalty) issued (AUG-21-2013), St Formal NOV issued (AUG-21-2013), St Public Notif requested (AUG-21-2013), St Compliance achieved (SEP-30-2013)
MCL, Monthly (TCR) - Between APR-2013 and JUN-2013, Contaminant: Coliform. Follow-up actions: St Public Notif requested (JUL-15-2013), St Formal NOV issued (JUL-15-2013), St AO (w/o penalty) issued (JUL-15-2013), St Public Notif received (JUL-16-2013), St Compliance achieved (SEP-30-2013)
MCL, Monthly (TCR) - In NOV-2009, Contaminant: Coliform. Follow-up actions: St Public Notif requested (NOV-19-2009), St Formal NOV issued (NOV-19-2009), St Public Notif received (NOV-24-2009), St Compliance achieved (APR-29-2010)
Past monitoring violations:
Monitoring, Repeat Major (TCR) - Between APR-2009 and JUN-2009, Contaminant: Coliform (TCR). Follow-up actions: St Public Notif requested (OCT-22-2009), St Formal NOV issued (OCT-22-2009), St AO (w/penalty) issued (JAN-22-2010), St Compliance achieved (DEC-31-2010)
4 routine major monitoring violations
Population served: 110, Groundwater):
Past monitoring violations:
3 routine major monitoring violations
One minor monitoring violation
Population served: 105, Groundwater):
Past health violations:
MCL, Monthly (TCR) - In FEB-2011, Contaminant: Coliform. Follow-up actions: St Public Notif received (JAN-31-2011), St Public Notif requested (MAR-01-2011), St Formal NOV issued (MAR-01-2011), St AO (w/o penalty) issued (MAR-01-2011), St Compliance achieved (MAR-22-2011)
MCL, Monthly (TCR) - In JAN-2011, Contaminant: Coliform. Follow-up actions: St Public Notif requested (JAN-31-2011), St Formal NOV issued (JAN-31-2011), St AO (w/o penalty) issued (JAN-31-2011), St Public Notif received (FEB-02-2011), St Compliance achieved (MAR-22-2011)
Past monitoring violations:
One routine major monitoring violation
One regular monitoring violation
Population served: 60, Groundwater):
Past health violations:
MCL, Monthly (TCR) - In JUN-2008, Contaminant: Coliform. Follow-up actions: St Public Notif requested (JUL-01-2008), St Formal NOV issued (JUL-01-2008), St Compliance achieved (SEP-13-2010)
MCL, Monthly (TCR) - In NOV-2007, Contaminant: Coliform. Follow-up actions: St Public Notif requested (NOV-13-2007), St Formal NOV issued (NOV-13-2007), St Public Notif received (NOV-16-2007), St Compliance achieved (SEP-13-2010)
MCL, Monthly (TCR) - Between OCT-2007 and DEC-2007, Contaminant: Coliform. Follow-up actions: St Public Notif requested (OCT-30-2007), St Formal NOV issued (OCT-30-2007), St Public Notif received (NOV-16-2007), St Compliance achieved (SEP-13-2010)
MCL, Monthly (TCR) - Between JUL-2006 and SEP-2006, Contaminant: Coliform. Follow-up actions: St Public Notif requested (SEP-11-2006), St Formal NOV issued (SEP-11-2006), St Public Notif received (NOV-16-2007), St Compliance achieved (SEP-13-2010)
Past monitoring violations:
Monitoring, Repeat Major (TCR) - Between JUL-2006 and SEP-2006, Contaminant: Coliform (TCR). Follow-up actions: St Public Notif requested (DEC-07-2006), St Formal NOV issued (DEC-07-2006), St Compliance achieved (SEP-14-2010)
Population served: 50, Groundwater):
Past health violations:
MCL, Monthly (TCR) - In NOV-2011, Contaminant: Coliform. Follow-up actions: St Public Notif requested (NOV-28-2011), St Formal NOV issued (NOV-28-2011), St AO (w/o penalty) issued (NOV-28-2011), St Compliance achieved (MAR-31-2012), St Public Notif received (APR-02-2012)
Population served: 45, Groundwater):
Past health violations:
MCL, Monthly (TCR) - In AUG-2014, Contaminant: Coliform. Follow-up actions: St AO (w/o penalty) issued (AUG-06-2014), St Public Notif requested (AUG-06-2014), St Formal NOV issued (AUG-06-2014)
MCL, Monthly (TCR) - Between JUL-2014 and SEP-2014, Contaminant: Coliform. Follow-up actions: St AO (w/o penalty) issued (JUL-16-2014), St Public Notif requested (JUL-16-2014), St Formal NOV issued (JUL-16-2014)
MCL, Monthly (TCR) - Between JUL-2012 and SEP-2012, Contaminant: Coliform. Follow-up actions: St Public Notif requested (AUG-01-2012), St Formal NOV issued (AUG-01-2012), St Public Notif received (AUG-01-2012), St AO (w/o penalty) issued (AUG-01-2012), St Compliance achieved (AUG-31-2012)
Past monitoring violations:
2 routine major monitoring violations
Population served: 25, Groundwater):
Past monitoring violations:
One routine major monitoring violation
Average household size: This town:
2.0 peopleNorth Carolina:
2.5 people
Percentage of family households: This town:
49.2%Whole state:
66.7%
Percentage of households with unmarried partners: This town:
4.0%Whole state:
5.9%
Likely homosexual households (counted as self-reported same-sex unmarried-partner households)
Lesbian couples: 0.4% of all households Gay men: 0.1% of all households
89 people in nursing facilities/skilled-nursing facilities in 2010People in group quarters in Walnut Cove in 2000:
96 people in nursing homes
46 people in other noninstitutional group quarters
8 people in homes for the mentally retarded
7 people in homes for abused, dependent, and neglected children
Banks with branches in Walnut Cove (2011 data):
Southern Community Bank and Trust: Walnut Cove Office at 1072 North Main Street, branch established on 1999/06/21. Info updated 2007/02/23: Bank assets: $1,499.7 mil, Deposits: $1,188.8 mil, headquarters in Winston Salem, NC, positive income , Commercial Lending Specialization, 22 total offices , Holding Company: Southern Community Financial Corporation
First-Citizens Bank & Trust Company: Walnut Cove Branch at 416 North Main Street, branch established on 1969/07/21. Info updated 2011/10/11: Bank assets: $20,566.4 mil, Deposits: $17,596.8 mil, headquarters in Raleigh, NC, positive income , Commercial Lending Specialization, 433 total offices , Holding Company: First Citizens Bancshares, Inc.
SunTrust Bank: Walnut Cove Main Branch 524 at 234 North Main Street, branch established on 1962/11/09. Info updated 2010/05/27: Bank assets: $171,291.7 mil, Deposits: $129,833.2 mil, headquarters in Atlanta, GA, positive income , Commercial Lending Specialization, 1716 total offices , Holding Company: Suntrust Banks, Inc.
For population 15 years and over in Walnut Cove:
Never married: 39.5%Now married: 39.9%Separated: 0.3%Widowed: 11.2%Divorced: 9.1% For population 25 years and over in Walnut Cove:
High school or higher: 92.6%Bachelor's degree or higher: 10.2%Graduate or professional degree: 3.6%Unemployed: 24.1%Mean travel time to work (commute): 23.8 minutes
Education Gini index (Inequality in education) Here:
8.1North Carolina average:
11.7
Religion statistics for Walnut Cove, NC (based on Stokes County data)
Religion Adherents Congregations Evangelical Protestant 11,953 47 Mainline Protestant 3,769 29 Catholic 592 1 Black Protestant 180 1 Other 2 2 Orthodox - 1 None 30,833 -
Source: Clifford Grammich, Kirk Hadaway, Richard Houseal, Dale E.Jones, Alexei Krindatch, Richie Stanley and Richard H.Taylor. 2012. 2010 U.S.Religion Census: Religious Congregations & Membership Study. Association of Statisticians of American Religious Bodies. Jones, Dale E., et al. 2002. Congregations and Membership in the United States 2000. Nashville, TN: Glenmary Research Center. Graphs represent county-level data
Food Environment Statistics: Number of grocery stores : 8Here :
1.74 / 10,000 pop.State :
2.05 / 10,000 pop.
Number of convenience stores (no gas) : 3Here :
0.65 / 10,000 pop.North Carolina :
0.92 / 10,000 pop.
Number of convenience stores (with gas) : 25Stokes County :
5.44 / 10,000 pop.North Carolina :
4.75 / 10,000 pop.
Number of full-service restaurants : 30Here :
6.53 / 10,000 pop.State :
7.57 / 10,000 pop.
Adult diabetes rate : This county :
10.2%North Carolina :
9.8%
Adult obesity rate : Stokes County :
29.0%North Carolina :
28.3%
Low-income preschool obesity rate : Stokes County :
15.7%North Carolina :
15.6%
Health and Nutrition: Healthy diet rate : This city:
46.4%North Carolina:
48.9%
Average overall health of teeth and gums : Here:
37.9%North Carolina:
46.1%
Average BMI : Walnut Cove:
28.5North Carolina:
28.8
People feeling badly about themselves : Walnut Cove:
16.5%State:
20.7%
People not drinking alcohol at all : Walnut Cove:
10.0%State:
10.7%
Average hours sleeping at night : Here:
6.7North Carolina:
6.8
Overweight people : Walnut Cove:
30.6%North Carolina:
33.7%
General health condition : Walnut Cove:
49.7%State:
55.8%
Average condition of hearing : Here:
75.1%North Carolina:
79.7%
More about Health and Nutrition of Walnut Cove, NC Residents
Local government employment and payroll (March 2022)
Function
Full-time employees
Monthly full-time payroll
Average yearly full-time wage
Part-time employees
Monthly part-time payroll
Other Government Administration
7 $24,803 $42,519 2 $1,382 Water Supply
5 $18,556 $44,534 0 $0 Other and Unallocable
1 $5,955 $71,460 6 $8,534 Sewerage
1 $4,631 $55,572 0 $0
Totals for Government
14 $53,944 $46,238 8 $9,916
Walnut Cove government finances - Expenditure in 2017 (per resident):
Current Operations - Liquor Stores: $680,000 ($426.07)
Police Protection: $4,000 ($2.51)General - Interest on Debt: $38,000 ($23.81)
Intergovernmental to Local - Other - Health - Other: $3,000 ($1.88)
Total Salaries and Wages: $171,000 ($107.14)
Walnut Cove government finances - Revenue in 2017 (per resident):
Revenue - Liquor Stores: $711,000 ($445.49)
Tax - Alcoholic Beverage Sales: $27,000 ($16.92)
Walnut Cove government finances - Debt in 2017 (per resident):
Long Term Debt - Beginning Outstanding - Unspecified Public Purpose: $946,000 ($592.73)
Outstanding Unspecified Public Purpose: $850,000 ($532.58)Retired Unspecified Public Purpose: $96,000 ($60.15)
Businesses in Walnut Cove, NC
Name Count Name Count
CVS 1 Hardee's 1 Curves 1 La-Z-Boy 1 Dunkin Donuts 1 Subway 1 Goodwill 1 U-Haul 1 H&R Block 1
Strongest AM radio stations in Walnut Cove:
WTRU (830 AM; 50 kW; KERNERSVILLE, NC; Owner: TRUTH BROADCASTING CORPORATION)
WWBG (1470 AM; 10 kW; GREENSBORO, NC; Owner: TRUTH BROADCASTING COPORATION)
WSJS (600 AM; 5 kW; WINSTON-SALEM, NC)
WTOB (1380 AM; 5 kW; WINSTON-SALEM, NC; Owner: TRUTH BROADCASTING CORP)
WSGH (1040 AM; 9 kW; LEWISVILLE, NC; Owner: WINSTON-SALEM, GREENSBORO, HIGH POINT AREA RADIO)
WCOG (1320 AM; 5 kW; GREENSBORO, NC; Owner: TRUTH BROADCASTING CORPORATION)
WPAQ (740 AM; 10 kW; MOUNT AIRY, NC; Owner: RALPH D. EPPERSON)
WPTF (680 AM; 50 kW; RALEIGH, NC; Owner: FIRST STATE COMMUNICATIONS)
WSYD (1300 AM; 10 kW; MOUNT AIRY, NC; Owner: GRANITE CITY BROADCASTING, INC.)
WFTK (1030 AM; daytime; 50 kW; WAKE FOREST, NC; Owner: POSITIVE RADIO GROUP, INC.)
WHEO (1270 AM; 5 kW; STUART, VA; Owner: MOUNTAIN VIEW COMMUNICATIONS, INC.)
WHKY (1290 AM; 50 kW; HICKORY, NC; Owner: LONG COMMUNICATIONS, LLC.)
WAAA (980 AM; 1 kW; WINSTON-SALEM, NC; Owner: MEDIA BROADCASTING CORPORATION)
Strongest FM radio stations in Walnut Cove:
WJMH (102.1 FM; REIDSVILLE, NC; Owner: ENTERCOM GREENSBORO LICENSE, LLC)
WMQX-FM (93.1 FM; WINSTON-SALEM, NC; Owner: ENTERCOM GREENSBORO LICENSE, LLC)
WTQR (104.1 FM; WINSTON-SALEM, NC; Owner: CLEAR CHANNEL BROADCASTING LICENSES, INC.)
WFDD (88.5 FM; WINSTON-SALEM, NC; Owner: WAKE FOREST UNIVERSITY)
W285DJ (104.9 FM; MOUNT AIRY, NC; Owner: TRIAD FAMILY NETWORK, INC,)
WKZL (107.5 FM; WINSTON-SALEM, NC; Owner: DICK BROADCASTING COMPANY, INC. OF TENNESSEE)
WGBT (94.5 FM; EDEN, NC; Owner: CLEAR CHANNEL BROADCASTING LICENSES, INC.)
W219CW (91.7 FM; DANBURY, NC; Owner: CALVARY CHAPEL OF TWIN FALLS, INC.)
WOZN (98.7 FM; GREENSBORO, NC; Owner: ENTERCOM GREENSBORO LICENSE, LLC)
WQMG-FM (97.1 FM; GREENSBORO, NC; Owner: ENTERCOM GREENSBORO LICENSE, LLC)
WMAG (99.5 FM; HIGH POINT, NC; Owner: CAPSTAR TX LIMITED PARTNERSHIP)
WVBZ (100.3 FM; HIGH POINT, NC; Owner: CAPSTAR TX LIMITED PARTNERSHIP)
WBRF (98.1 FM; GALAX, VA; Owner: BLUE RIDGE RADIO, INC.)
WBFJ-FM (89.3 FM; WINSTON-SALEM, NC; Owner: TRIAD FAMILY NETWORK, INC.)
WKRR (92.3 FM; ASHEBORO, NC; Owner: DICK BROADCASTING COMPANY, INC. OF TENNESSEE)
WFMX (105.7 FM; STATESVILLE, NC; Owner: MERCURY BROADCASTING COMPANY, INC.)
WROV-FM (96.3 FM; MARTINSVILLE, VA; Owner: CAPSTAR TX LIMITED PARTNERSHIP)
WXLK (92.3 FM; ROANOKE, VA; Owner: MEL WHEELER, INC.)
WSLQ (99.1 FM; ROANOKE, VA; Owner: MEL WHEELER, INC.)
WSLC-FM (94.9 FM; ROANOKE, VA; Owner: MEL WHEELER, INC.)
TV broadcast stations around Walnut Cove:
WFMY-TV (Channel 2; GREENSBORO, NC; Owner: WFMY TELEVISION CORPORATION)
WUPN-TV (Channel 48; GREENSBORO, NC; Owner: WUPN LICENSEE, LLC)
WXLV-TV (Channel 45; WINSTON-SALEM, NC; Owner: WXLV LICENSEE, LLC)
WTWB-TV (Channel 20; LEXINGTON, NC; Owner: WTWB OF THE TRIAD, LLC)
WLXI-TV (Channel 61; GREENSBORO, NC; Owner: TRI-STATE CHRISTIAN TV, INC.)
WXII-TV (Channel 12; WINSTON-SALEM, NC; Owner: WXII HEARST-ARGYLE TELEVISION, INC.)
WUNL-TV (Channel 26; WINSTON-SALEM, NC; Owner: UNIVERSITY OF NORTH CAROLINA)
WGPX (Channel 16; BURLINGTON, NC; Owner: PAXSON GREENSBORO LICENSE, INC.)
WGHP (Channel 8; HIGH POINT, NC; Owner: WGHP LICENSE, INC.)
WXIV-LP (Channel 14; REIDSVILLE, NC; Owner: CAROLINA BLUE COMMUNICATIONS, INC.)
Walnut Cove, North Carolina
Fatal accident count 11 Vehicles involved in fatal accidents 12 Fatal accidents involving drunk persons: 3 Fatalities 11 Persons involved in fatal accidents 19 Pedestrians involved in fatal accidents 1
North Carolina average
Fatal accident count 12844 Vehicles involved in fatal accidents 19176 Fatal accidents involving drunk persons 4159 Fatalities 14193 Persons involved in fatal accidents 32437 Pedestrians involved in fatal accidents 1507
See more detailed statistics of Walnut Cove fatal car crashes and road traffic accidents for 1975 - 2021 here
National Bridge Inventory (NBI) Statistics 21 Number of bridges230ft / 69.5m Total length74,280 Total average daily traffic6,392 Total average daily truck traffic148,560 Total future (year 2040) average daily traffic
New bridges - historical statistics
1 1920-1929 3 1950-1959 2 1960-1969 3 1970-1979 3 1980-1989 2 1990-1999 1 2000-2009 5 2010-2019 1 2020-2022
See full National Bridge Inventory statistics for Walnut Cove, NC
FCC Registered Antenna Towers: 33 (
See the full list of FCC Registered Antenna Towers in Walnut Cove )
FCC Registered Private Land Mobile Towers: 1
Belews Creek Steam Station, 3195 Pine Hall Road (Lat: 36.276583 Lon: -80.075000), Type: Pipe, Structure height: 4.3 m, Call Sign: WPKL800, Assigned Frequencies: 915.000 MHz, 917.000 MHz, Grant Date: 03/07/2022, Expiration Date: 04/09/2032, Certifier: Richard A Donaldson, Registrant: Duke Energy Business Services, LLC, 401 South College Street, Charlotte, NC 28202, Phone: (704) 382-3539, Email:
FCC Registered Broadcast Land Mobile Towers: 6
100 N Of Int Sr1973 & Nc Hwy 8 (Lat: 36.351528 Lon: -80.222000), Call Sign: KJJ397, Licensee ID: L00501571, Assigned Frequencies: 154.265 MHz, Grant Date: 05/02/1997, Expiration Date: 06/11/2002, Cancellation Date: 10/13/2002, Registrant: South Stokes Volunteer Fire Dept Inc, Rt 1, Walnut Cove, NC 27052, Phone: (919) 994-9203 Lat: 36.282111 Lon: -80.058917, Call Sign: WNVW488, Assigned Frequencies: 462.237 MHz, 462.287 MHz, 462.337 MHz, 462.387 MHz, 462.437 MHz, 467.337 MHz, 467.412 MHz, Grant Date: 02/02/2021, Expiration Date: 03/28/2031, Certifier: Richard A Donaldson, Registrant: Duke Energy Business Services, LLC, 401 South College Street, Charlotte, NC 28202, Phone: (704) 382-3539, Email:
Lat: 36.008194 Lon: -80.095611, Call Sign: WPPT517, Assigned Frequencies: 457.537 MHz, 457.550 MHz, 457.562 MHz, 457.587 MHz, 457.612 MHz, 464.012 MHz, 464.037 MHz, 464.062 MHz, 464.087 MHz, 464.112 MHz... (+43 more), Grant Date: 02/16/2005, Expiration Date: 04/03/2015, Cancellation Date: 06/06/2015, Certifier: Jerry L Burgess, Registrant: Business Radio Licensing, 30251 Golden Lantern, Suite E #501, Laguna Niguel, CA 92677, Phone: (949) 348-8510, Fax: (949) 348-8514, Email:
Mobiles Loc 1, Lat: 36.276472 Lon: -80.096306, Call Sign: KTO544, Assigned Frequencies: 160.770 MHz, 160.440 MHz, Grant Date: 01/04/2022, Expiration Date: 12/17/2031, Certifier: Jerry R Celio, Registrant: Norfolk Southern Railway Company, 650 West Peachtree St, Nw, Box 41, Atlanta, GA 30308, Phone: (404) 660-4050, Fax: (404) 582-6209, Email:
Lat: 36.370028 Lon: -80.133806, Call Sign: WQAR632, Assigned Frequencies: 159.630 MHz, 159.960 MHz, Grant Date: 07/26/2004, Expiration Date: 07/26/2014, Cancellation Date: 02/15/2012, Certifier: Keith M Robertson, Registrant: Business Radio Licensing, 30251 Golden Lantern Suite E 501, Laguna Niguel, CA 92677-9553, Phone: (949) 348-8510, Fax: (949) 348-8514, Email:
Lat: 36.304944 Lon: -80.139000, Call Sign: WQFG715, Assigned Frequencies: 451.887 MHz, 451.937 MHz, 451.175 MHz, 451.450 MHz, 451.537 MHz, 451.662 MHz, 451.737 MHz, Grant Date: 05/03/2016, Expiration Date: 07/11/2026, Certifier: John W Booth Jr, Registrant: Dee Polley, 216 Middle Fork Road, Garden Valley, ID 83622, Phone: (208) 426-5200, Fax: (208) 247-2277, Email:
FCC Registered Microwave Towers: 5
Booth Mt, HP-1032, Hp-1032, 1429 Mounce Road (Lat: 36.394139 Lon: -80.183556), Type: Tower, Structure height: 60.6 m, Call Sign: WQJI987, Assigned Frequencies: 6855.00 MHz, Grant Date: 06/28/2018, Expiration Date: 09/25/2028, Certifier: Wayne E Eberhard, Registrant: North Carolina State Highway Patrol, 4231 Mail Service Center, Raleigh, NC 27699-4231, Phone: (919) 948-7854, Fax: (919) 662-4444, Email:
DANBURY, Booth Mt., Hp-1032, 1429 Mounce Road (Lat: 36.394139 Lon: -80.183556), Type: Ltower, Structure height: 60.6 m, Call Sign: WQPW550, Assigned Frequencies: 11245.0 MHz, 11285.0 MHz, 17875.0 MHz, Grant Date: 08/30/2012, Expiration Date: 08/30/2022, Cancellation Date: 04/30/2018, Certifier: Chris Harris, Registrant: Conterra Ultra Broadband, LLC, 2101 Rexford Rd, Ste 200e, Charlotte, NC 28211, Phone: (704) 936-1801, Fax: (704) 936-1801, Email:
5GB0267A, 136 Plant Street (Lat: 36.282583 Lon: -80.142500), Type: Tank, Structure height: 47 m, Overall height: 50 m, Call Sign: WRBT928, Assigned Frequencies: 11385.0 MHz, 11385.0 MHz, 11385.0 MHz, 11385.0 MHz, 11385.0 MHz, 11385.0 MHz, 11385.0 MHz, 11385.0 MHz, 11245.0 MHz, 11245.0 MHz... (+20 more), Grant Date: 06/19/2018, Expiration Date: 06/19/2028, Certifier: David Werblow, Registrant: T-Mobile Usa, Inc., 12920 Se 38th Street, Bellevue, WA 98006, Phone: (425) 383-8401, Fax: (425) 383-4040, Email:
5GB0451A, Hwy 39, Meadows Township (Lat: 36.341472 Lon: -80.153833), Type: Ltower, Structure height: 59.4 m, Overall height: 60.7 m, Call Sign: WRVX405, Assigned Frequencies: 11485.0 MHz, 11485.0 MHz, 11485.0 MHz, 11485.0 MHz, 11485.0 MHz, 11485.0 MHz, 11485.0 MHz, 11485.0 MHz, 11645.0 MHz, 11645.0 MHz... (+6 more), Grant Date: 01/18/2023, Expiration Date: 01/18/2033, Certifier: Jenny Knopf, Registrant: T-Mobile Usa, Inc., 12920 Se 38th Street, Bellevue, WA 98006, Phone: (425) 383-8401, Fax: (425) 383-4040, Email:
BELEWS CREEK, Belews Creek Plant, 3195 Pine Hill Rd (Lat: 36.281833 Lon: -80.060444), Type: Pipe, Structure height: 79.1 m, Overall height: 83.8 m, Call Sign: WJS61, Assigned Frequencies: 5945.20 MHz, 5945.20 MHz, 5945.20 MHz, 5945.20 MHz, 5945.20 MHz, 5945.20 MHz, 5945.20 MHz, 5945.20 MHz, 6063.80 MHz, 6063.80 MHz... (+6 more), Grant Date: 01/12/2022, Expiration Date: 02/14/2032, Certifier: Richard A Donaldson, Registrant: Duke Energy Business Services, LLC, 401 South College Street, Charlotte, NC 28202, Phone: (704) 425-0458, Email:
FCC Registered Amateur Radio Licenses: 41 (
See the full list of FCC Registered Amateur Radio Licenses in Walnut Cove )
FAA Registered Aircraft: 20 (
See the full list of FAA Registered Aircraft in Walnut Cove )
Home Mortgage Disclosure Act Aggregated Statistics For Year 2009(Based on 1 partial tract) C) Refinancings D) Home Improvement Loans G) Loans On Manufactured Number Average Value Number Average Value Number Average Value
LOANS ORIGINATED 3 $138,650 0 $0 0 $0 APPLICATIONS APPROVED, NOT ACCEPTED 0 $0 0 $0 0 $0 APPLICATIONS DENIED 3 $99,500 1 $60,350 1 $44,400 APPLICATIONS WITHDRAWN 1 $94,690 0 $0 0 $0 FILES CLOSED FOR INCOMPLETENESS 0 $0 0 $0 0 $0
Aggregated Statistics For Year 2008(Based on 1 partial tract) A) FHA, FSA/RHS & VA B) Conventional C) Refinancings D) Home Improvement Loans G) Loans On Manufactured Number Average Value Number Average Value Number Average Value Number Average Value Number Average Value
LOANS ORIGINATED 1 $87,120 1 $107,190 3 $134,467 1 $24,030 1 $65,940 APPLICATIONS APPROVED, NOT ACCEPTED 0 $0 0 $0 1 $44,450 0 $0 0 $0 APPLICATIONS DENIED 0 $0 0 $0 3 $110,727 1 $35,310 1 $73,050 APPLICATIONS WITHDRAWN 0 $0 0 $0 1 $105,460 0 $0 0 $0 FILES CLOSED FOR INCOMPLETENESS 0 $0 0 $0 0 $0 0 $0 0 $0
Aggregated Statistics For Year 2007(Based on 1 partial tract) A) FHA, FSA/RHS & VA B) Conventional C) Refinancings D) Home Improvement Loans G) Loans On Manufactured Number Average Value Number Average Value Number Average Value Number Average Value Number Average Value
LOANS ORIGINATED 1 $57,560 2 $146,100 4 $90,145 1 $28,550 1 $101,650 APPLICATIONS APPROVED, NOT ACCEPTED 0 $0 0 $0 1 $102,670 0 $0 0 $0 APPLICATIONS DENIED 0 $0 1 $58,120 4 $93,460 1 $15,140 1 $81,790 APPLICATIONS WITHDRAWN 0 $0 0 $0 2 $99,570 0 $0 0 $0 FILES CLOSED FOR INCOMPLETENESS 0 $0 0 $0 0 $0 0 $0 0 $0
Aggregated Statistics For Year 2006(Based on 1 partial tract) B) Conventional C) Refinancings D) Home Improvement Loans F) Non-occupant Loans on G) Loans On Manufactured Number Average Value Number Average Value Number Average Value Number Average Value Number Average Value
LOANS ORIGINATED 2 $103,505 4 $109,945 1 $43,480 1 $34,750 1 $93,620 APPLICATIONS APPROVED, NOT ACCEPTED 1 $52,530 1 $53,490 0 $0 0 $0 0 $0 APPLICATIONS DENIED 2 $75,540 3 $114,993 1 $37,540 0 $0 1 $105,770 APPLICATIONS WITHDRAWN 0 $0 2 $87,505 0 $0 0 $0 0 $0 FILES CLOSED FOR INCOMPLETENESS 0 $0 1 $82,350 0 $0 0 $0 0 $0
Aggregated Statistics For Year 2005(Based on 1 partial tract) B) Conventional C) Refinancings D) Home Improvement Loans F) Non-occupant Loans on G) Loans On Manufactured Number Average Value Number Average Value Number Average Value Number Average Value Number Average Value
LOANS ORIGINATED 2 $131,445 4 $95,720 1 $34,540 1 $35,970 2 $55,320 APPLICATIONS APPROVED, NOT ACCEPTED 1 $31,240 1 $73,810 0 $0 0 $0 0 $0 APPLICATIONS DENIED 1 $69,440 6 $101,482 1 $40,740 0 $0 2 $73,000 APPLICATIONS WITHDRAWN 0 $0 3 $95,217 0 $0 0 $0 1 $41,810 FILES CLOSED FOR INCOMPLETENESS 0 $0 0 $0 0 $0 0 $0 0 $0
Aggregated Statistics For Year 2004(Based on 1 partial tract) B) Conventional C) Refinancings D) Home Improvement Loans F) Non-occupant Loans on G) Loans On Manufactured Number Average Value Number Average Value Number Average Value Number Average Value Number Average Value
LOANS ORIGINATED 3 $92,880 5 $94,580 1 $34,750 1 $59,490 1 $98,860 APPLICATIONS APPROVED, NOT ACCEPTED 0 $0 1 $106,120 0 $0 0 $0 0 $0 APPLICATIONS DENIED 2 $50,345 6 $73,618 1 $9,140 0 $0 2 $87,505 APPLICATIONS WITHDRAWN 1 $69,650 2 $106,400 0 $0 0 $0 0 $0 FILES CLOSED FOR INCOMPLETENESS 0 $0 1 $65,630 0 $0 0 $0 0 $0
Aggregated Statistics For Year 2003(Based on 1 partial tract) B) Conventional C) Refinancings F) Non-occupant Loans on Number Average Value Number Average Value Number Average Value
LOANS ORIGINATED 2 $124,970 9 $92,202 1 $35,810 APPLICATIONS APPROVED, NOT ACCEPTED 0 $0 1 $126,140 0 $0 APPLICATIONS DENIED 1 $69,600 4 $82,868 0 $0 APPLICATIONS WITHDRAWN 0 $0 3 $74,203 0 $0 FILES CLOSED FOR INCOMPLETENESS 0 $0 0 $0 0 $0
Aggregated Statistics For Year 2002(Based on 1 partial tract) A) FHA, FSA/RHS & VA B) Conventional C) Refinancings F) Non-occupant Loans on Number Average Value Number Average Value Number Average Value Number Average Value
LOANS ORIGINATED 1 $50,040 2 $99,390 5 $108,144 1 $55,220 APPLICATIONS APPROVED, NOT ACCEPTED 0 $0 1 $62,430 1 $99,670 0 $0 APPLICATIONS DENIED 0 $0 2 $56,845 3 $73,083 0 $0 APPLICATIONS WITHDRAWN 0 $0 0 $0 1 $122,070 0 $0 FILES CLOSED FOR INCOMPLETENESS 0 $0 0 $0 0 $0 0 $0
Aggregated Statistics For Year 2001(Based on 1 partial tract) B) Conventional C) Refinancings Number Average Value Number Average Value
LOANS ORIGINATED 2 $107,720 7 $94,821 APPLICATIONS APPROVED, NOT ACCEPTED 1 $48,620 1 $75,230 APPLICATIONS DENIED 2 $62,765 3 $65,227 APPLICATIONS WITHDRAWN 0 $0 1 $161,090 FILES CLOSED FOR INCOMPLETENESS 0 $0 0 $0
Aggregated Statistics For Year 2000(Based on 1 partial tract) B) Conventional C) Refinancings D) Home Improvement Loans Number Average Value Number Average Value Number Average Value
LOANS ORIGINATED 2 $78,690 3 $80,147 1 $6,710 APPLICATIONS APPROVED, NOT ACCEPTED 1 $68,940 1 $70,920 0 $0 APPLICATIONS DENIED 3 $43,350 4 $63,830 1 $21,490 APPLICATIONS WITHDRAWN 0 $0 1 $62,530 0 $0 FILES CLOSED FOR INCOMPLETENESS 0 $0 0 $0 0 $0
Aggregated Statistics For Year 1999(Based on 1 partial tract) A) FHA, FSA/RHS & VA B) Conventional C) Refinancings D) Home Improvement Loans F) Non-occupant Loans on Number Average Value Number Average Value Number Average Value Number Average Value Number Average Value
LOANS ORIGINATED 1 $52,890 4 $66,972 5 $75,740 1 $10,080 1 $31,150 APPLICATIONS APPROVED, NOT ACCEPTED 0 $0 2 $64,565 2 $62,275 0 $0 0 $0 APPLICATIONS DENIED 0 $0 6 $56,762 3 $68,597 1 $7,080 0 $0 APPLICATIONS WITHDRAWN 0 $0 1 $38,840 2 $65,735 0 $0 0 $0 FILES CLOSED FOR INCOMPLETENESS 0 $0 0 $0 1 $58,280 0 $0 0 $0
Detailed HMDA statistics for the following Tracts:
0707.00
Private Mortgage Insurance Companies Aggregated Statistics For Year 2007(Based on 1 partial tract) A) Conventional Number Average Value
LOANS ORIGINATED 1 $123,140 APPLICATIONS APPROVED, NOT ACCEPTED 0 $0 APPLICATIONS DENIED 0 $0 APPLICATIONS WITHDRAWN 0 $0 FILES CLOSED FOR INCOMPLETENESS 0 $0
Aggregated Statistics For Year 2005(Based on 1 partial tract) A) Conventional Number Average Value
LOANS ORIGINATED 1 $73,510 APPLICATIONS APPROVED, NOT ACCEPTED 0 $0 APPLICATIONS DENIED 0 $0 APPLICATIONS WITHDRAWN 0 $0 FILES CLOSED FOR INCOMPLETENESS 0 $0
Aggregated Statistics For Year 2004(Based on 1 partial tract) A) Conventional Number Average Value
LOANS ORIGINATED 1 $97,030 APPLICATIONS APPROVED, NOT ACCEPTED 0 $0 APPLICATIONS DENIED 0 $0 APPLICATIONS WITHDRAWN 0 $0 FILES CLOSED FOR INCOMPLETENESS 0 $0
Aggregated Statistics For Year 2003(Based on 1 partial tract) A) Conventional B) Refinancings Number Average Value Number Average Value
LOANS ORIGINATED 1 $52,320 1 $137,060 APPLICATIONS APPROVED, NOT ACCEPTED 0 $0 1 $72,690 APPLICATIONS DENIED 0 $0 0 $0 APPLICATIONS WITHDRAWN 0 $0 0 $0 FILES CLOSED FOR INCOMPLETENESS 0 $0 0 $0
Aggregated Statistics For Year 2002(Based on 1 partial tract) A) Conventional B) Refinancings Number Average Value Number Average Value
LOANS ORIGINATED 1 $66,450 1 $92,960 APPLICATIONS APPROVED, NOT ACCEPTED 0 $0 0 $0 APPLICATIONS DENIED 0 $0 0 $0 APPLICATIONS WITHDRAWN 0 $0 0 $0 FILES CLOSED FOR INCOMPLETENESS 0 $0 0 $0
Aggregated Statistics For Year 2001(Based on 1 partial tract) A) Conventional B) Refinancings Number Average Value Number Average Value
LOANS ORIGINATED 1 $79,760 2 $79,375 APPLICATIONS APPROVED, NOT ACCEPTED 0 $0 0 $0 APPLICATIONS DENIED 0 $0 0 $0 APPLICATIONS WITHDRAWN 0 $0 0 $0 FILES CLOSED FOR INCOMPLETENESS 0 $0 0 $0
Aggregated Statistics For Year 1999(Based on 1 partial tract) A) Conventional Number Average Value
LOANS ORIGINATED 1 $66,580 APPLICATIONS APPROVED, NOT ACCEPTED 0 $0 APPLICATIONS DENIED 0 $0 APPLICATIONS WITHDRAWN 0 $0 FILES CLOSED FOR INCOMPLETENESS 0 $0
Detailed PMIC statistics for the following Tracts:
0707.00
Most common first names in Walnut Cove, NC among deceased individuals Name Count Lived (average)
James 99 68.4 years William 74 74.5 years John 73 71.8 years Mary 62 78.6 years Robert 40 70.1 years George 32 73.5 years Paul 29 72.2 years Annie 29 78.6 years Virginia 23 73.2 years Walter 22 75.7 years
Most common last names in Walnut Cove, NC among deceased individuals Last name Count Lived (average)
Smith 113 74.5 years Mabe 99 73.6 years Hairston 58 73.7 years Tuttle 56 77.6 years Brown 54 71.8 years Nelson 35 73.0 years Mitchell 34 73.5 years Neal 34 73.6 years Tilley 31 76.2 years Joyce 30 72.7 years
Walnut Cove compared to North Carolina state average:
Median household income below state average. Median house value below state average. Unemployed percentage above state average. Black race population percentage above state average. Hispanic race population percentage below state average. Foreign-born population percentage significantly below state average. Length of stay since moving in significantly above state average. Institutionalized population percentage significantly above state average. Percentage of population with a bachelor's degree or higher significantly below state average. Walnut Cove on our top lists :
#49 on the list of "Top 101 cities with the largest percentage of people in homes for abused, dependent, and neglected children (population 1,000+)"
#69 on the list of "Top 101 cities with the largest percentage of people in other noninstitutional group quarters (population 1,000+)"
Top Patent Applicants
Julio A. Munoz (22)
S. Bruce King (10)
Sharon Pitts Dunlap (3)
Wayne Douglas Brown (2)
Terry Leonard Bullins (2)
Bobby Wayne Lawson (2)
George T. Hicks (2)
Tim Williams (1)
Bobby W. Lawson (1)
James Ray Hutchens (1)
Total of 50 patent applications in 2008-2024.


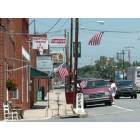
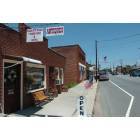


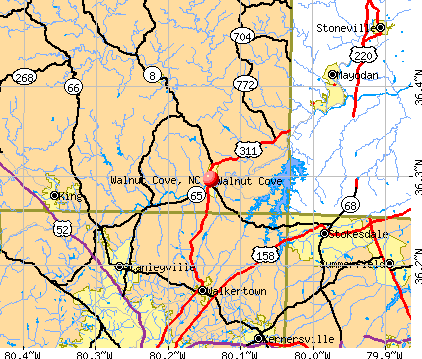


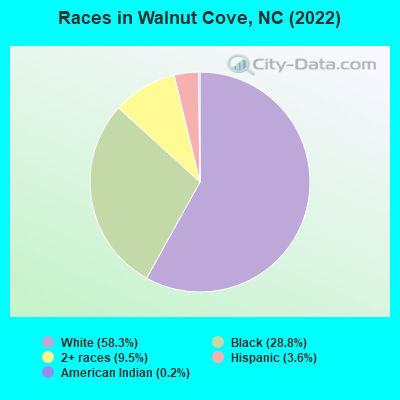
 Recent articles from our blog. Our writers, many of them Ph.D. graduates or candidates, create easy-to-read articles on a wide variety of topics.


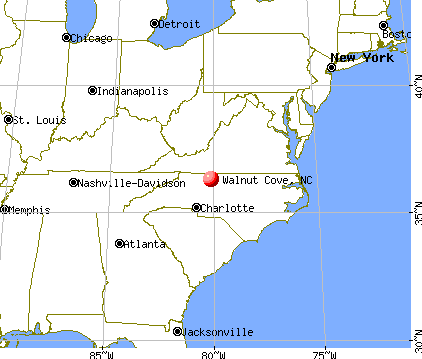
 (14.9 miles
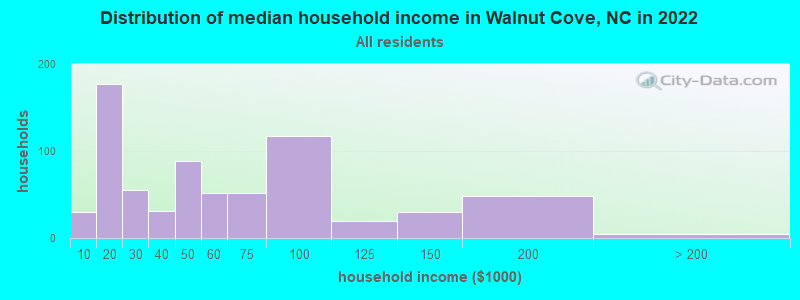
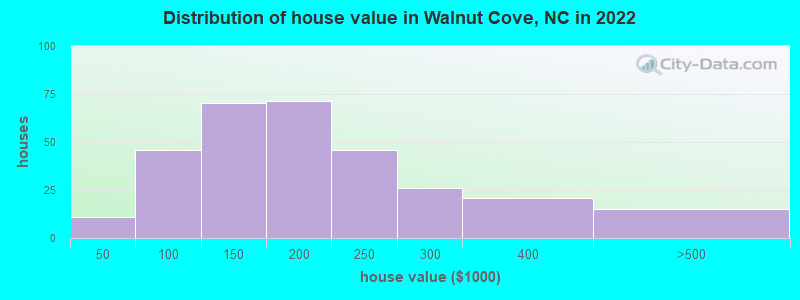
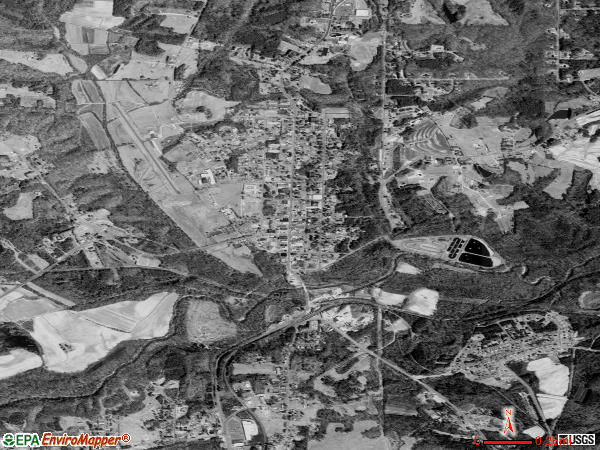
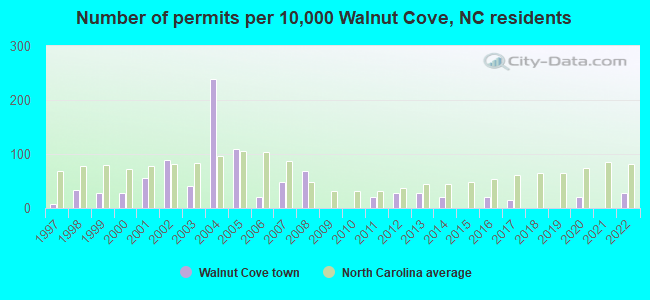
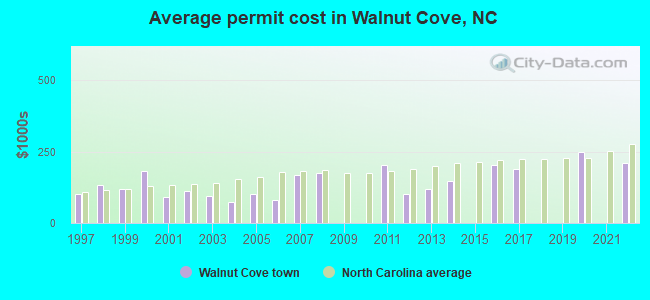
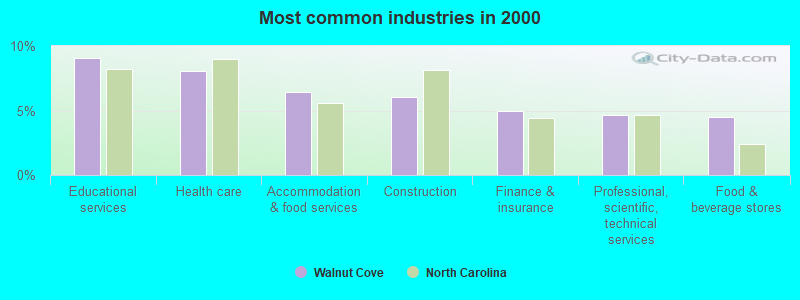
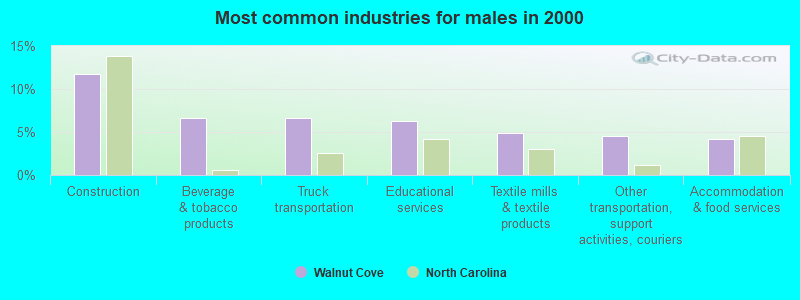
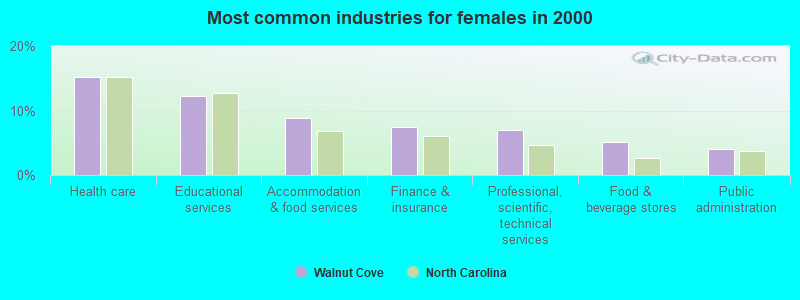
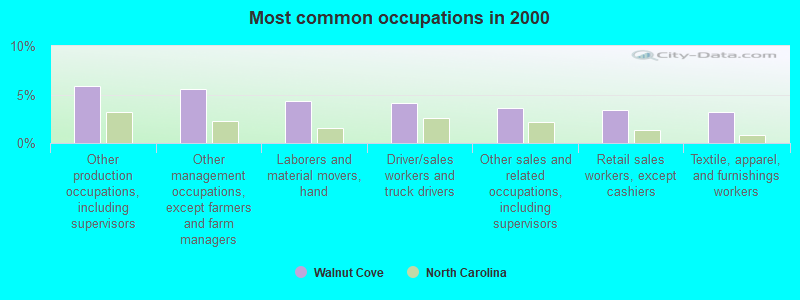
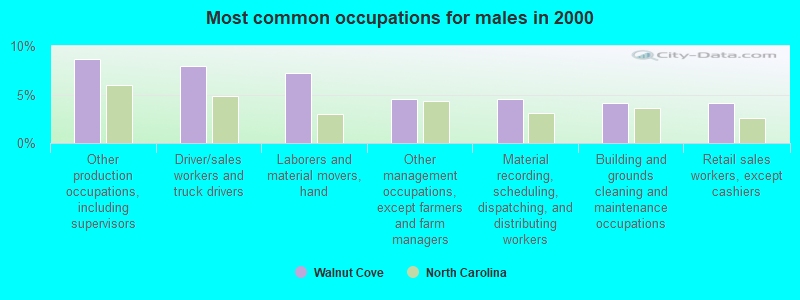
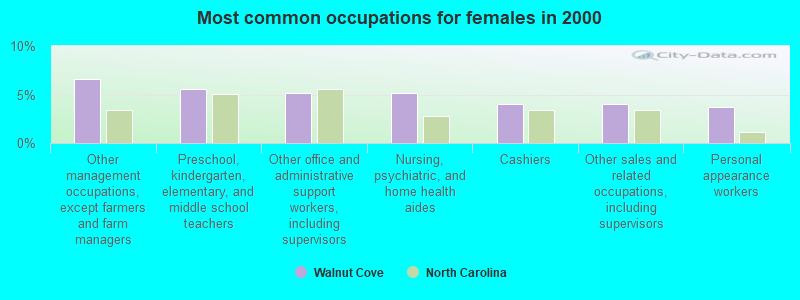
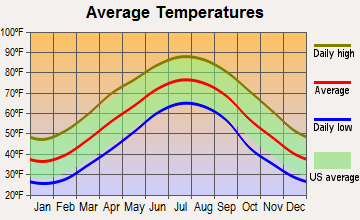
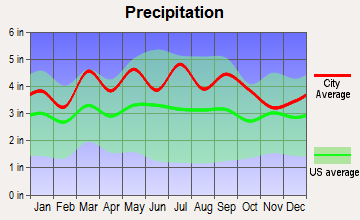
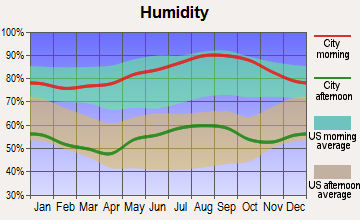
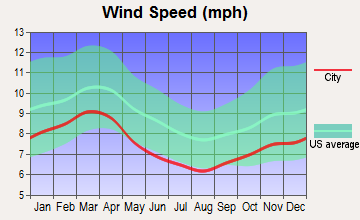
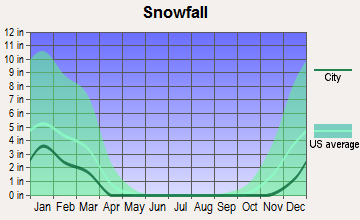
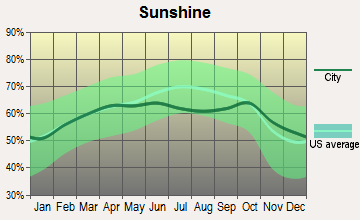
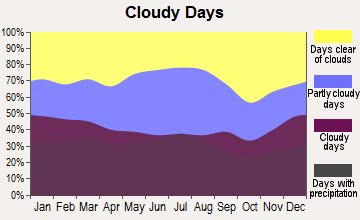
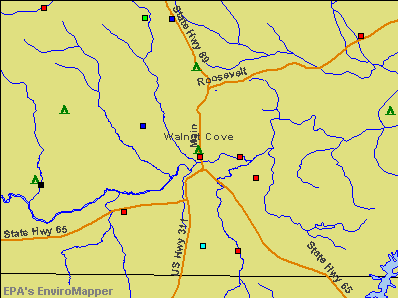

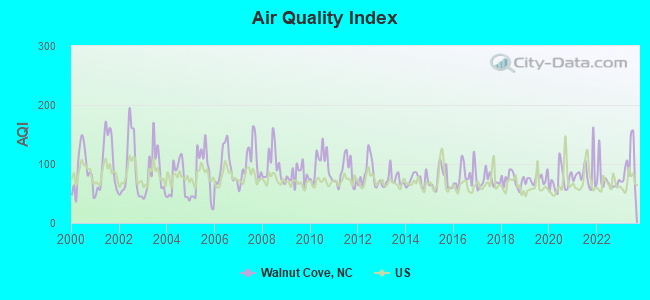
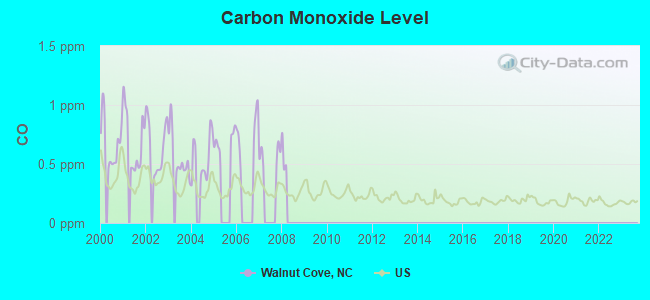
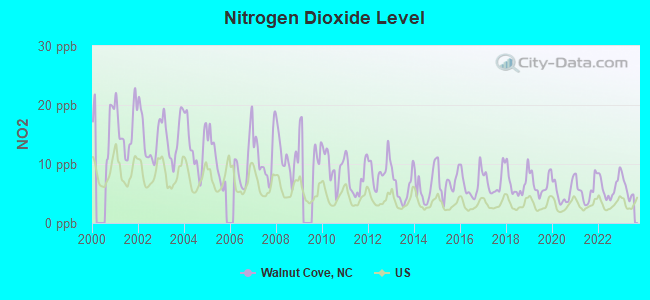
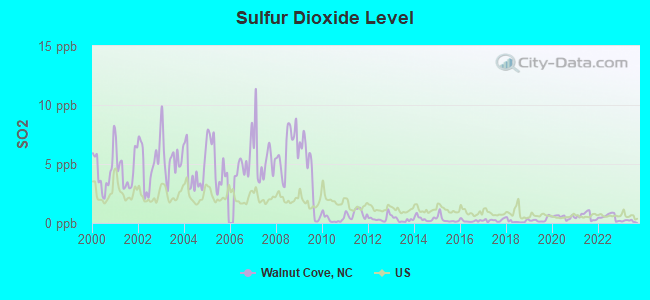
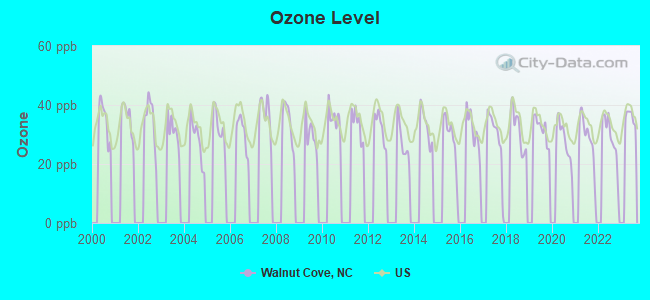
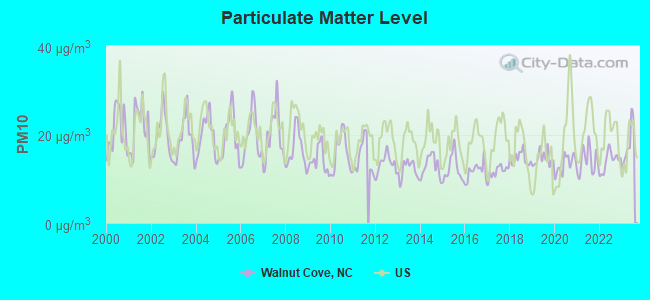
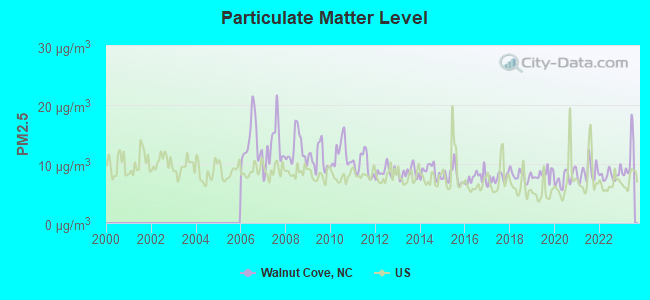

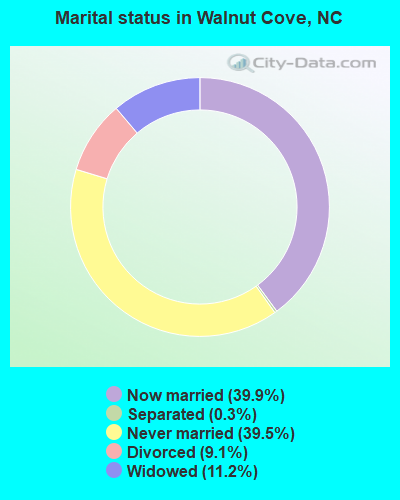
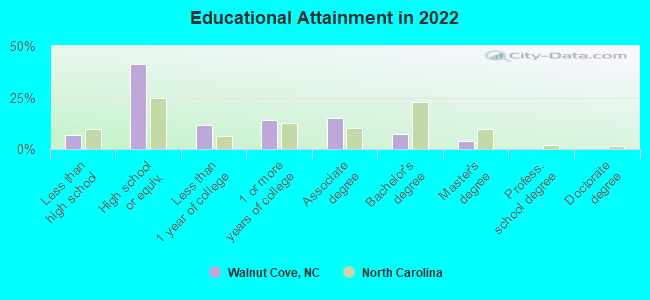
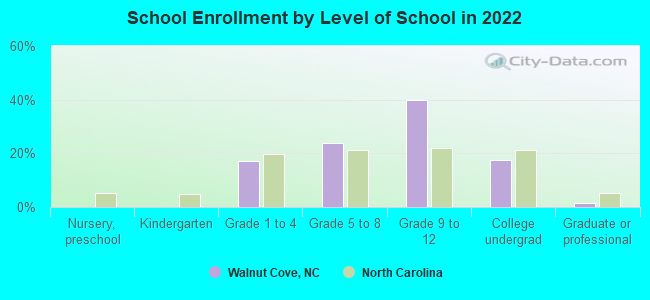
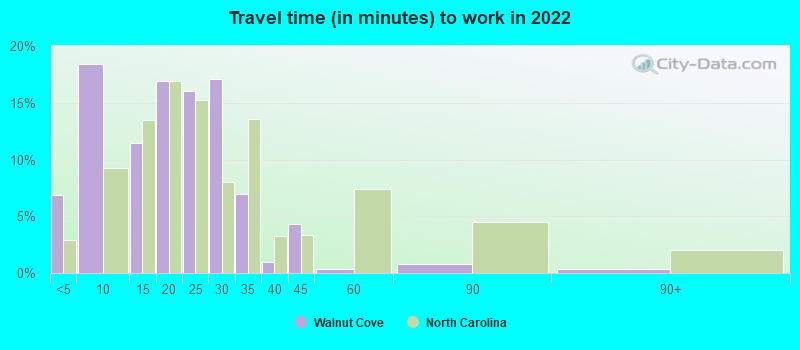
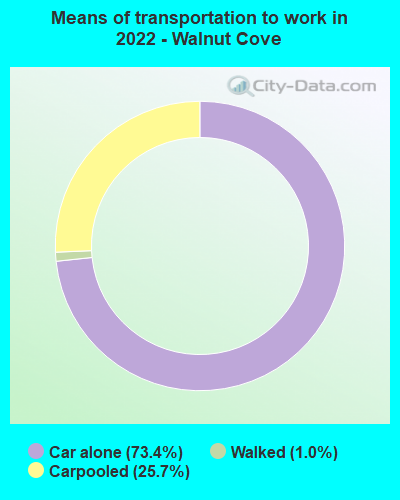
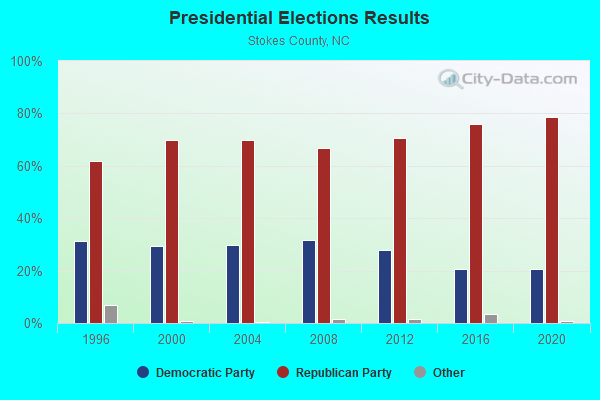
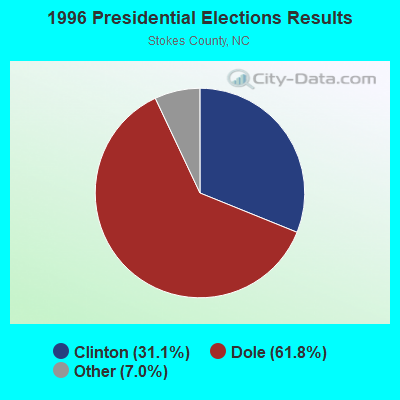
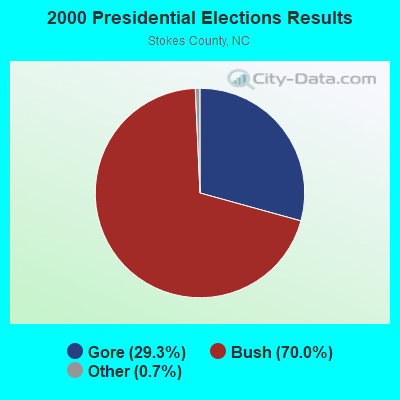

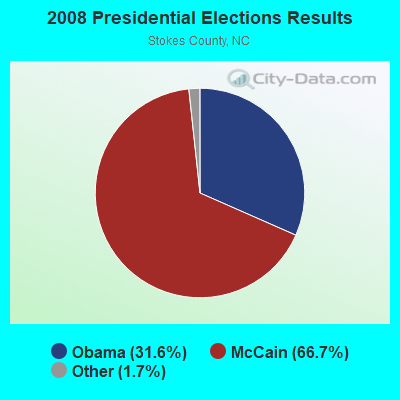

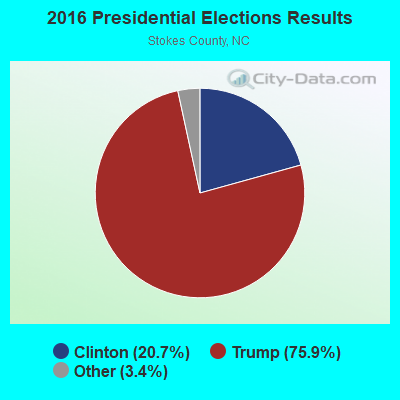
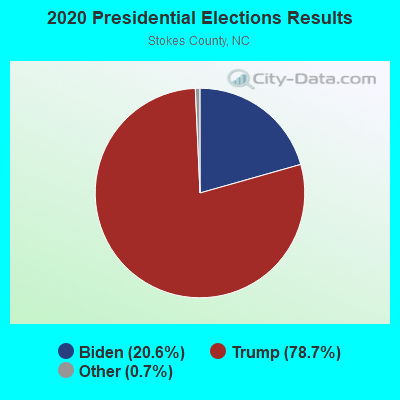
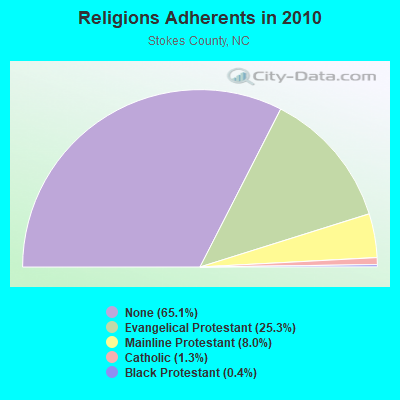
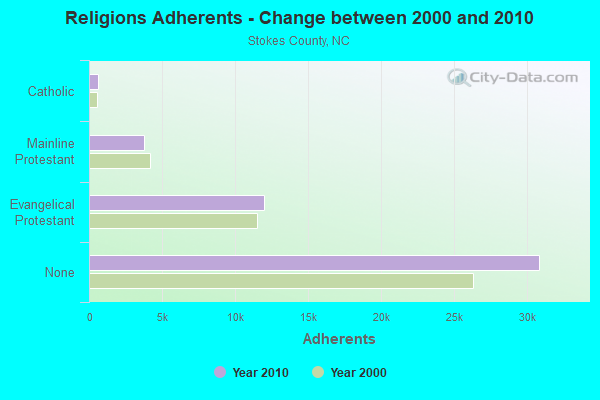
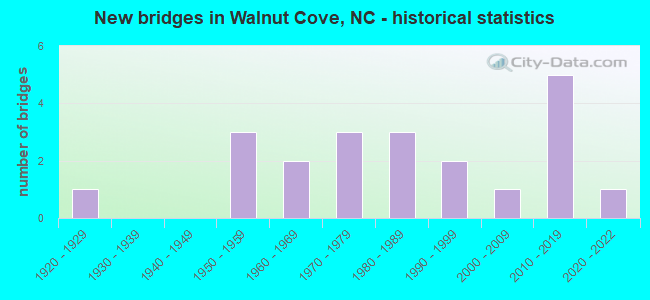
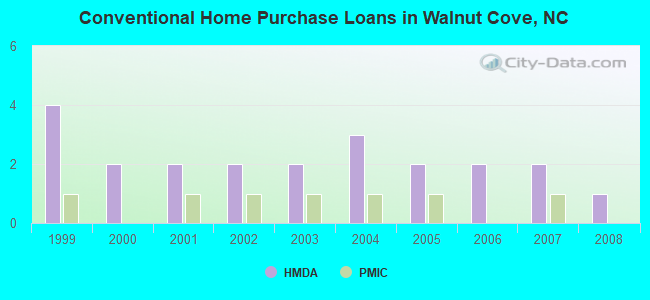
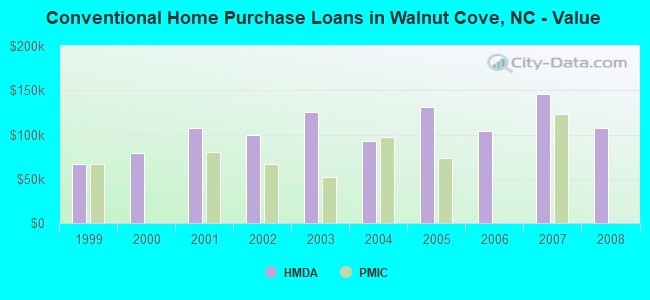
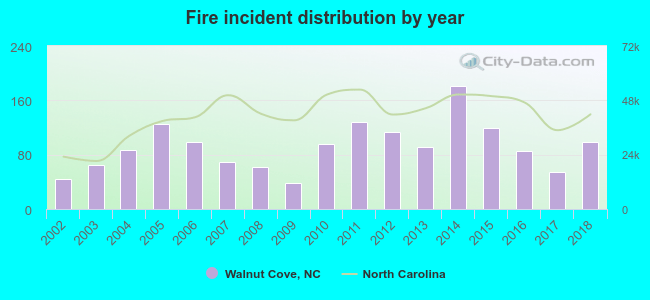 Based on the data from the years 2002 - 2018 the average number of fire incidents per year is 92. The highest number of fires - 181 took place in 2014, and the least - 38 in 2009. The data has an increasing trend.
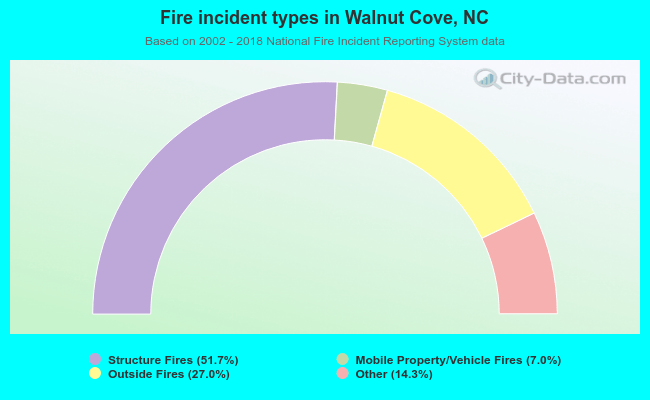 When looking into fire subcategories, the most incidents belonged to: Structure Fires (51.7%), and Outside Fires (27.0%).