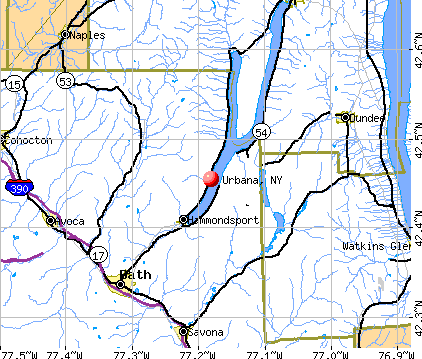
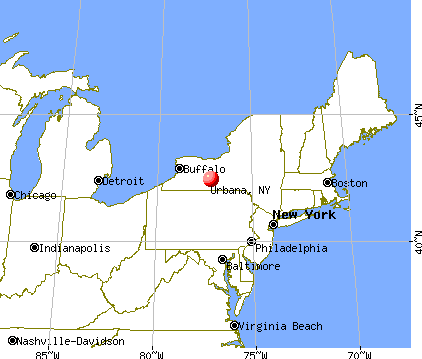
Urbana, New York
Submit your own pictures of this town and show them to the world
- OSM Map
- General Map
- Google Map
- MSN Map
Population change since 2000: -8.0%
 |
| Males: 1,172 | |
| Females: 1,171 |
| Median resident age: | 50.3 years |
| New York median age: | 40.7 years |
Zip codes: 14840.
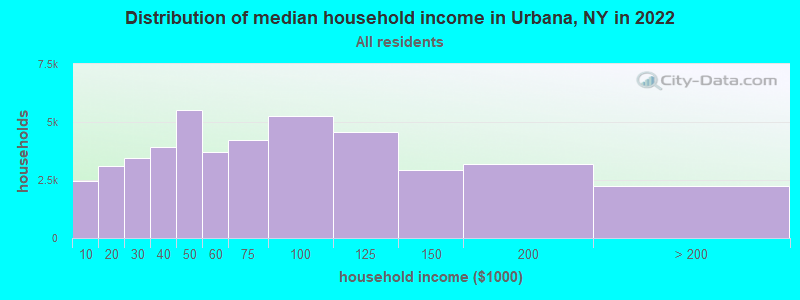
| Urbana: | $66,491 |
| NY: | $79,557 |
Estimated per capita income in 2022: $37,275 (it was $19,584 in 2000)
Urbana town income, earnings, and wages data
Estimated median house or condo value in 2022: $151,241 (it was $76,900 in 2000)
| Urbana: | $151,241 |
| NY: | $400,400 |
Mean prices in 2022: all housing units: $169,714; detached houses: $184,786; townhouses or other attached units: $138,888; in 2-unit structures: $291,252; in 3-to-4-unit structures: $333,918; in 5-or-more-unit structures: $308,305; mobile homes: $80,148; occupied boats, rvs, vans, etc.: $43,655
Detailed information about poverty and poor residents in Urbana, NY


- 2,25396.2%White alone
- 381.6%Hispanic
- 241.0%Black alone
- 160.7%Two or more races
- 80.3%Asian alone
- 40.2%American Indian alone
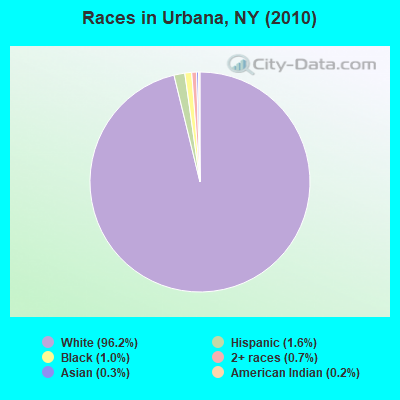
Races in Urbana detailed stats: ancestries, foreign born residents, place of birth
 Recent articles from our blog. Our writers, many of them Ph.D. graduates or candidates, create easy-to-read articles on a wide variety of topics.

 | Do New Yorkers really hate Midwestern transplants as much I suspect they do? (177 replies) |
| Why has the New York's population growth rate been so darn pathetic compared to its rivals? (216 replies) |
| Syracuse Construction Update (4332 replies) |
| Life in Ithaca (15 replies) |
| Moving to the city, need quick advice! (27 replies) |
| Moving to Syracuse (35 replies) |
Latest news from Urbana, NY collected exclusively by city-data.com from local newspapers, TV, and radio stations
Ancestries: English (22.1%), German (21.4%), Irish (17.3%), United States (9.7%), Polish (5.7%), Dutch (5.6%).
Current Local Time: EST time zone
Elevation: 730 feet
Land area: 41.1 square miles.
Population density: 57 people per square mile (very low).
41 residents are foreign born
| This town: | 1.6% |
| New York: | 20.4% |
| Urbana town: | 2.5% ($1,925) |
| New York: | 1.9% ($2,847) |
Nearest city with pop. 50,000+: Rochester, NY  (55.7 miles , pop. 219,773).
Nearest city with pop. 1,000,000+: Philadelphia, PA (199.0 miles , pop. 1,517,550).
Nearest cities:
), ), ), ), ), ), Latitude: 42.41 N, Longitude: 77.23 W
Area code commonly used in this area: 607

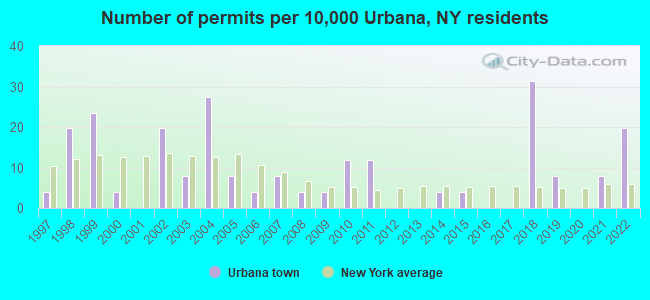
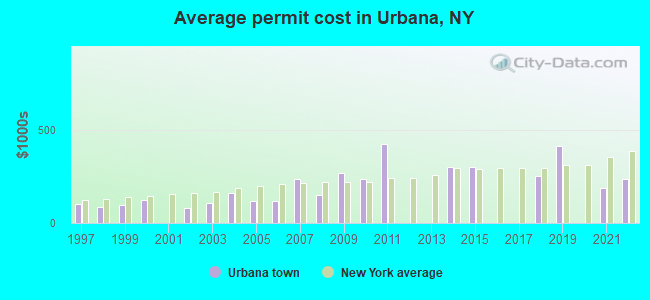
Single-family new house construction building permits:
- 2022: 5 buildings, average cost: $236,000
- 2021: 2 buildings, average cost: $187,500
- 2019: 2 buildings, average cost: $410,000
- 2018: 8 buildings, average cost: $249,800
- 2015: 1 building, cost: $300,000
- 2014: 1 building, cost: $300,000
- 2011: 3 buildings, average cost: $421,700
- 2010: 3 buildings, average cost: $237,700
- 2009: 1 building, cost: $270,000
- 2008: 1 building, cost: $150,000
- 2007: 2 buildings, average cost: $235,000
- 2006: 1 building, cost: $120,000
- 2005: 2 buildings, average cost: $115,500
- 2004: 7 buildings, average cost: $162,900
- 2003: 2 buildings, average cost: $106,500
- 2002: 5 buildings, average cost: $82,300
- 2000: 1 building, cost: $125,000
- 1999: 6 buildings, average cost: $95,200
- 1998: 5 buildings, average cost: $83,400
- 1997: 1 building, cost: $100,000
| Here: | 4.5% |
| New York: | 4.4% |
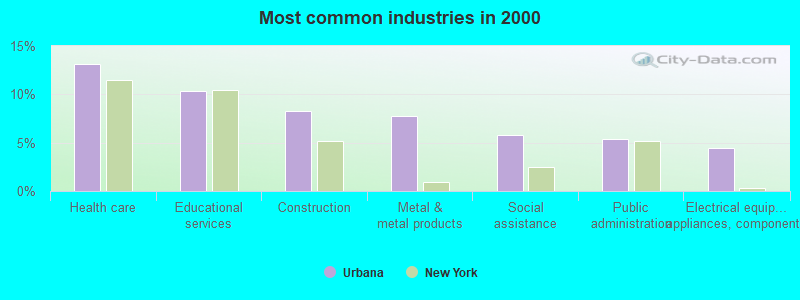
- Health care (13.2%)
- Educational services (10.4%)
- Construction (8.3%)
- Metal & metal products (7.8%)
- Social assistance (5.8%)
- Public administration (5.4%)
- Electrical equipment, appliances, components (4.4%)
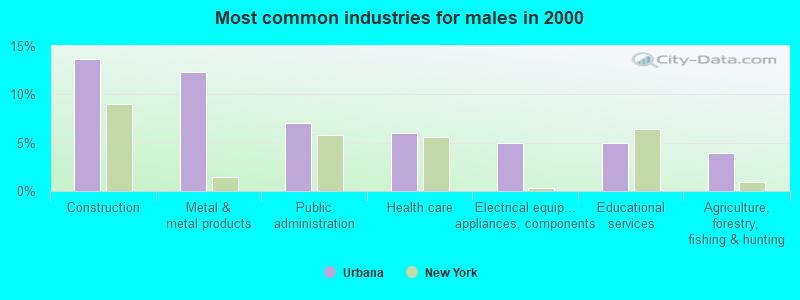
- Construction (13.7%)
- Metal & metal products (12.3%)
- Public administration (7.0%)
- Health care (6.0%)
- Electrical equipment, appliances, components (4.9%)
- Educational services (4.9%)
- Agriculture, forestry, fishing & hunting (3.9%)
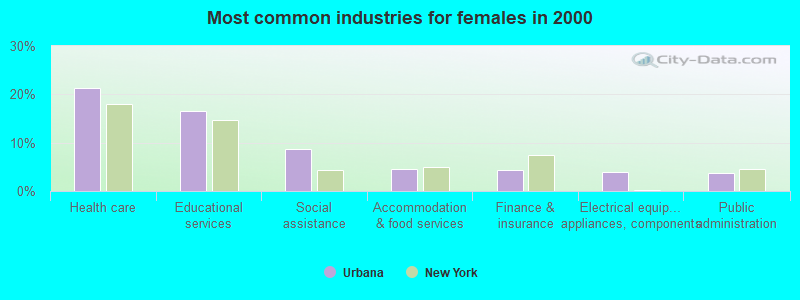
- Health care (21.3%)
- Educational services (16.5%)
- Social assistance (8.6%)
- Accommodation & food services (4.6%)
- Finance & insurance (4.4%)
- Electrical equipment, appliances, components (3.8%)
- Public administration (3.6%)
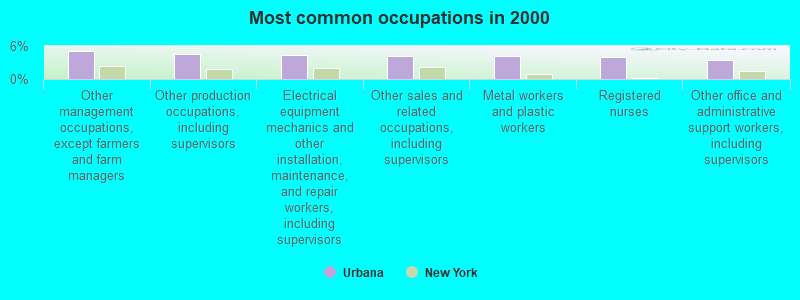
- Other management occupations, except farmers and farm managers (5.1%)
- Other production occupations, including supervisors (4.5%)
- Electrical equipment mechanics and other installation, maintenance, and repair workers, including supervisors (4.3%)
- Other sales and related occupations, including supervisors (4.2%)
- Metal workers and plastic workers (4.2%)
- Registered nurses (4.1%)
- Other office and administrative support workers, including supervisors (3.4%)
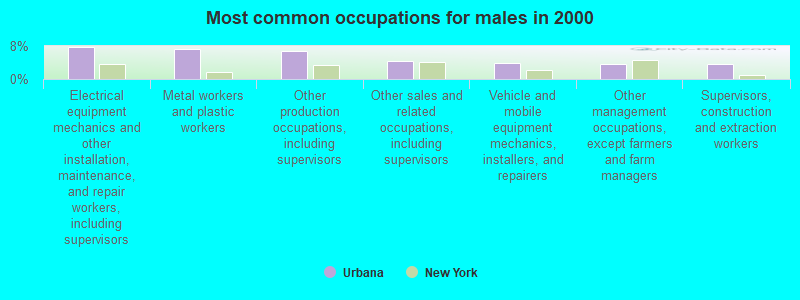
- Electrical equipment mechanics and other installation, maintenance, and repair workers, including supervisors (7.8%)
- Metal workers and plastic workers (7.2%)
- Other production occupations, including supervisors (6.8%)
- Other sales and related occupations, including supervisors (4.3%)
- Vehicle and mobile equipment mechanics, installers, and repairers (3.9%)
- Other management occupations, except farmers and farm managers (3.8%)
- Supervisors, construction and extraction workers (3.8%)
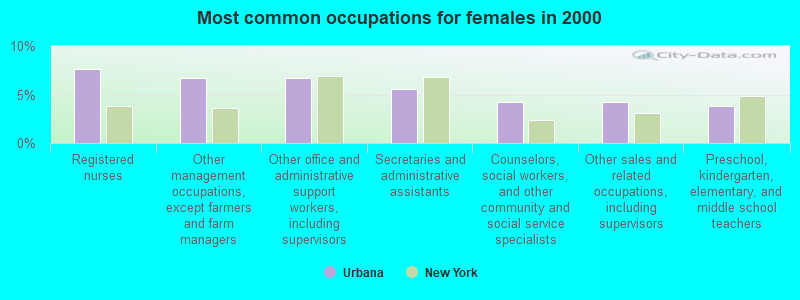
- Registered nurses (7.7%)
- Other management occupations, except farmers and farm managers (6.7%)
- Other office and administrative support workers, including supervisors (6.7%)
- Secretaries and administrative assistants (5.6%)
- Counselors, social workers, and other community and social service specialists (4.2%)
- Other sales and related occupations, including supervisors (4.2%)
- Preschool, kindergarten, elementary, and middle school teachers (3.8%)
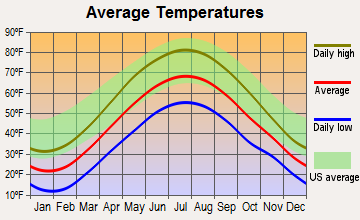
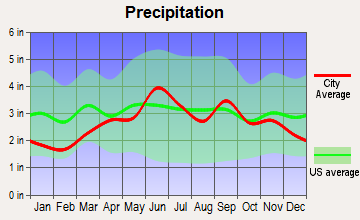
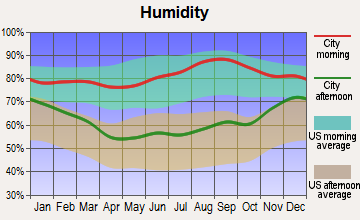
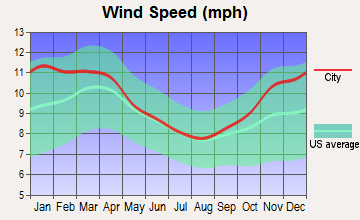
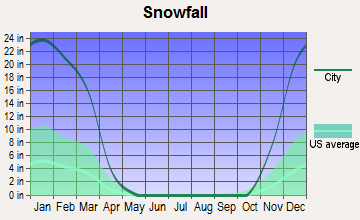
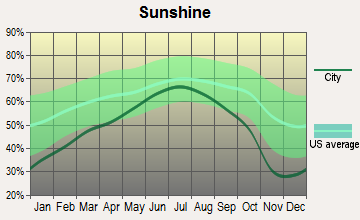
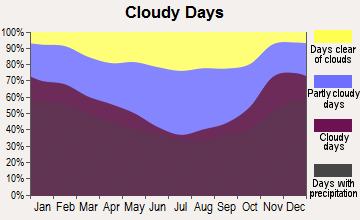
Average climate in Urbana, New York
Based on data reported by over 4,000 weather stations
(lower is better)
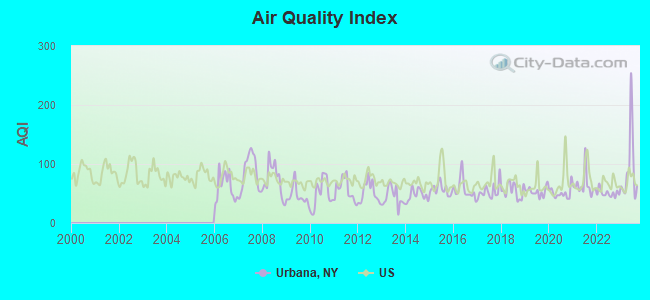
Air Quality Index (AQI) level in 2023 was 91.9. This is worse than average.
| City: | 91.9 |
| U.S.: | 72.6 |
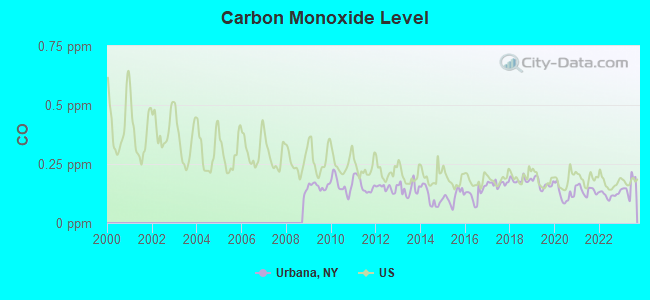
Carbon Monoxide (CO) [ppm] level in 2023 was 0.156. This is significantly better than average. Closest monitor was 22.0 miles away from the city center.
| City: | 0.156 |
| U.S.: | 0.251 |
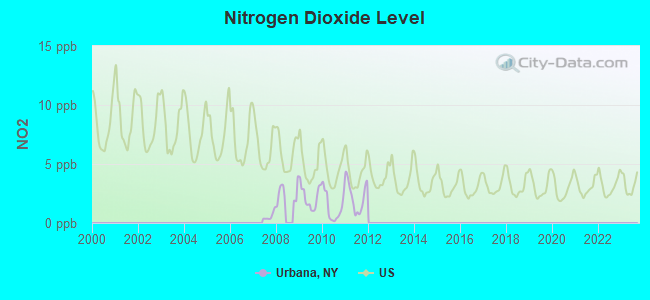
Nitrogen Dioxide (NO2) [ppb] level in 2011 was 2.25. This is significantly better than average. Closest monitor was 22.0 miles away from the city center.
| City: | 2.25 |
| U.S.: | 5.11 |
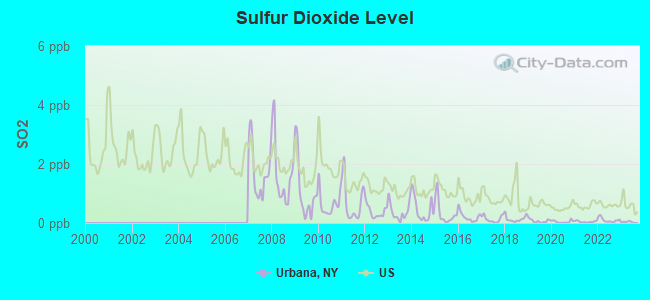
Sulfur Dioxide (SO2) [ppb] level in 2023 was 0.0309. This is significantly better than average. Closest monitor was 22.0 miles away from the city center.
| City: | 0.0309 |
| U.S.: | 1.5147 |
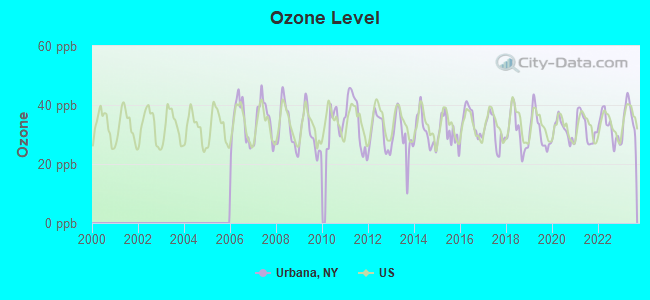
Ozone [ppb] level in 2023 was 35.9. This is about average. Closest monitor was 22.0 miles away from the city center.
| City: | 35.9 |
| U.S.: | 33.3 |
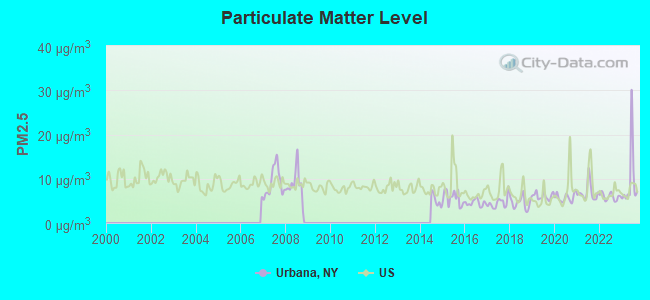
Particulate Matter (PM2.5) [µg/m3] level in 2023 was 9.50. This is about average. Closest monitor was 22.0 miles away from the city center.
| City: | 9.50 |
| U.S.: | 8.11 |
Tornado activity:
Urbana-area historical tornado activity is slightly below New York state average. It is 67% smaller than the overall U.S. average.
On 8/30/1955, a category F3 (max. wind speeds 158-206 mph) tornado 16.9 miles away from the Urbana town center caused between $5000 and $50,000 in damages.
On 5/2/1983, a category F3 tornado 38.6 miles away from the town center injured 6 people and caused between $500,000 and $5,000,000 in damages.
Earthquake activity:
Urbana-area historical earthquake activity is significantly above New York state average. It is 66% smaller than the overall U.S. average.On 10/7/1983 at 10:18:46, a magnitude 5.3 (5.1 MB, 5.3 LG, 5.1 ML, Class: Moderate, Intensity: VI - VII) earthquake occurred 180.7 miles away from the city center
On 9/25/1998 at 19:52:52, a magnitude 5.2 (4.8 MB, 4.3 MS, 5.2 LG, 4.5 MW, Depth: 3.1 mi) earthquake occurred 174.6 miles away from the city center
On 8/23/2011 at 17:51:04, a magnitude 5.8 (5.8 MW, Depth: 3.7 mi) earthquake occurred 313.4 miles away from the city center
On 4/20/2002 at 10:50:47, a magnitude 5.3 (5.3 ML, Depth: 3.0 mi) earthquake occurred 229.5 miles away from the city center
On 4/20/2002 at 10:50:47, a magnitude 5.2 (5.2 MB, 4.2 MS, 5.2 MW, 5.0 MW) earthquake occurred 227.6 miles away from the city center
On 1/31/1986 at 16:46:43, a magnitude 5.0 (5.0 MB) earthquake occurred 209.4 miles away from the city center
Magnitude types: regional Lg-wave magnitude (LG), body-wave magnitude (MB), local magnitude (ML), surface-wave magnitude (MS), moment magnitude (MW)
Natural disasters:
The number of natural disasters in Steuben County (20) is greater than the US average (15).Major Disasters (Presidential) Declared: 16
Emergencies Declared: 4
Causes of natural disasters: Storms: 12, Floods: 10, Hurricanes: 2, Tornadoes: 2, Blizzard: 1, Flash Flood: 1, Heavy Rain: 1, Landslide: 1, Power Outage: 1, Tropical Depression: 1, Tropical Storm: 1, Wind: 1, Winter Storm: 1, Other: 1 (Note: some incidents may be assigned to more than one category).
Colleges/universities with over 2000 students nearest to Urbana:
- Corning Community College (about 22 miles; Corning, NY; Full-time enrollment: 3,036)
- Alfred University (about 31 miles; Alfred, NY; FT enrollment: 2,411)
- SUNY College of Technology at Alfred (about 31 miles; Alfred, NY; FT enrollment: 3,483)
- Finger Lakes Community College (about 32 miles; Canandaigua, NY; FT enrollment: 4,732)
- Hobart William Smith Colleges (about 34 miles; Geneva, NY; FT enrollment: 2,476)
- Ithaca College (about 38 miles; Ithaca, NY; FT enrollment: 6,781)
- Cornell University (about 39 miles; Ithaca, NY; FT enrollment: 20,360)
Points of interest:
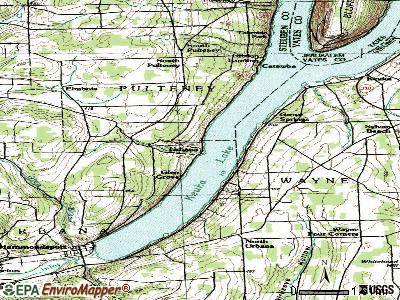
Notable locations in Urbana: Bully Hill Vineyards (A), Markhams Tree Farm (B), Heron Hill Winery (C), Hammondsport Fire Department (D), Hammondsport Village Hall (E), Ira Davenport Memorial Hospital Skilled Nursing Facility (F), Hammondsport Public Library (G). Display/hide their locations on the map
Churches in Urbana include: North Urbana Chapel (A), Pleasant Valley Mennonite Church (B), Harvest Baptist Church (C), Mount Washington Church (D), First United Methodist Church (E), Saint James Episcopal Church (F), First Presbyterian Church (G), Saint Gabriel's Roman Catholic Church (H). Display/hide their locations on the map
Cemeteries: Elmwood Cemetery (1), Pleasant Valley Cemetery (2), Free Baptist Cemetery (3), Depew Cemetery (4), Mount Washington Cemetery (5), Cold Springs Cemetery (6), Chestnut Grove Cemetery (7). Display/hide their locations on the map
Streams, rivers, and creeks: Glen Brook (A), Softwater Creek (B), Cold Brook (C), Mitchellsville Creek (D), Keuka Inlet (E). Display/hide their locations on the map
Parks in Urbana include: Pultney Park (1), Champlin Beach Park (2). Display/hide their locations on the map
| This town: | 2.3 people |
| New York: | 2.6 people |
| This town: | 64.6% |
| Whole state: | 63.5% |
| This town: | 7.2% |
| Whole state: | 6.8% |
Likely homosexual households (counted as self-reported same-sex unmarried-partner households)
- Lesbian couples: 0.4% of all households
- Gay men: 0.2% of all households
| This town: | 9.8% |
| Whole state: | 14.6% |
| This town: | 5.0% |
| Whole state: | 7.4% |
12 people in group homes intended for adults in 2010
People in group quarters in Urbana in 2000:
- 118 people in nursing homes
- 4 people in other group homes
- 2 people in religious group quarters
For population 15 years and over in Urbana:
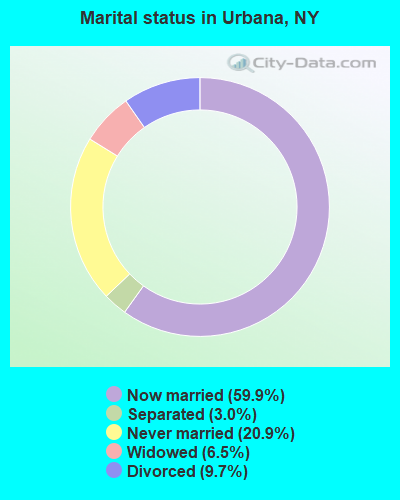
- Never married: 20.9%
- Now married: 59.9%
- Separated: 3.0%
- Widowed: 6.5%
- Divorced: 9.7%
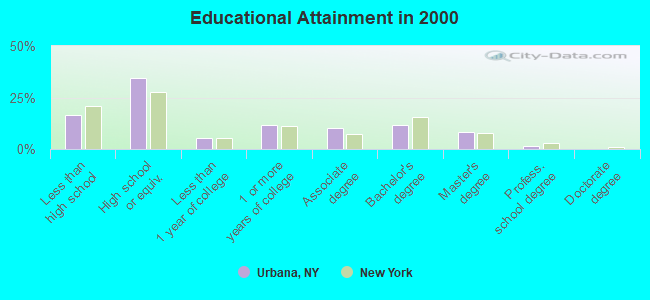
For population 25 years and over in Urbana:
- High school or higher: 83.3%
- Bachelor's degree or higher: 21.9%
- Graduate or professional degree: 10.1%
- Unemployed: 4.7%
- Mean travel time to work (commute): 20.3 minutes
| Here: | 11.5 |
| New York average: | 14.2 |
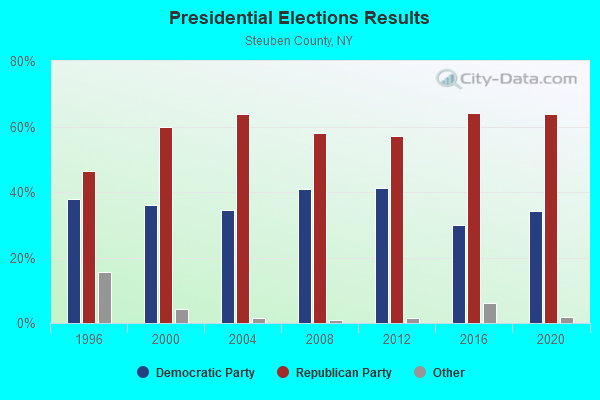
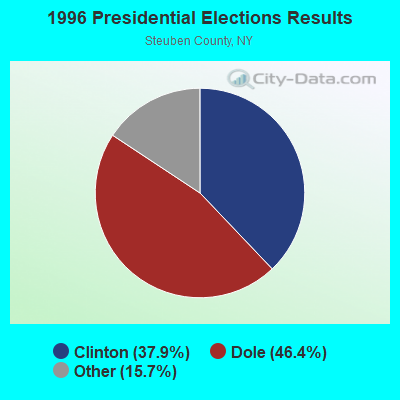
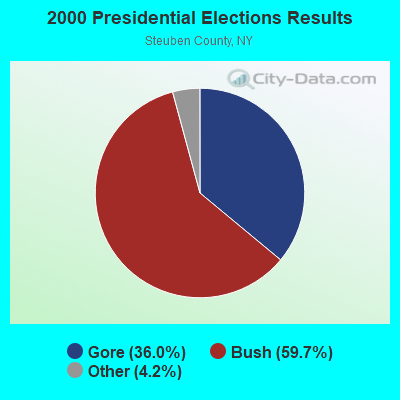
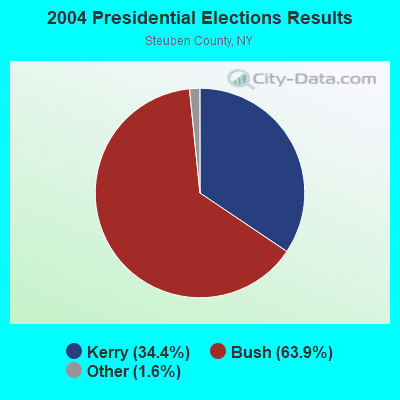
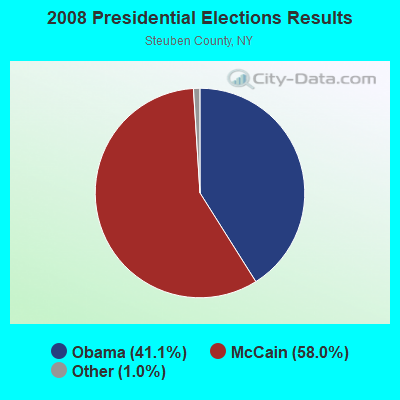
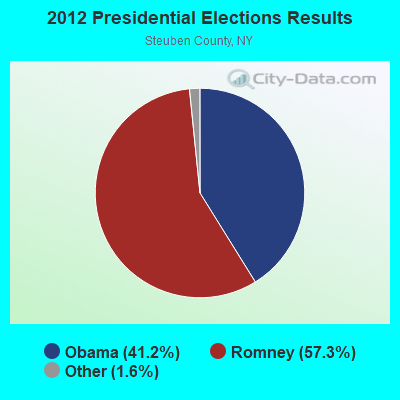
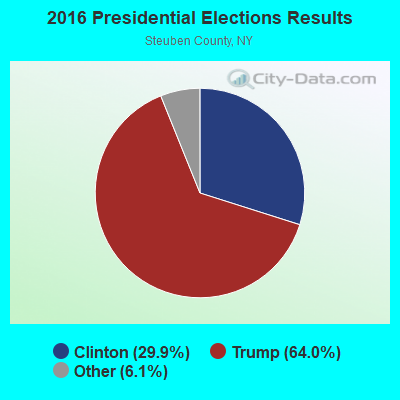
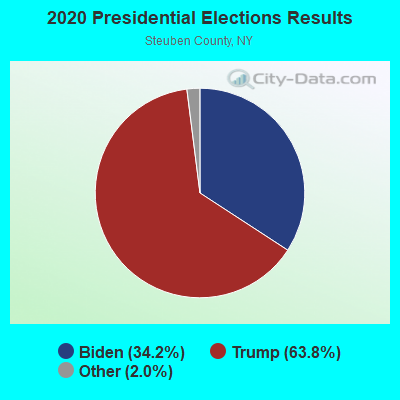
Graphs represent county-level data. Detailed 2008 Election Results
Religion statistics for Urbana, NY (based on Steuben County data)
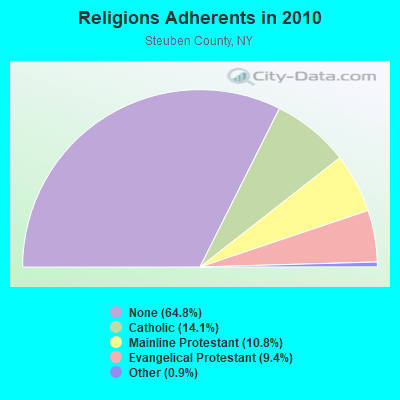
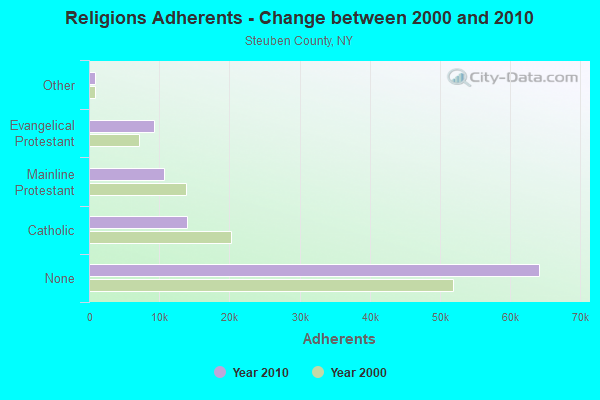
| Religion | Adherents | Congregations |
|---|---|---|
| Catholic | 13,963 | 11 |
| Mainline Protestant | 10,652 | 70 |
| Evangelical Protestant | 9,272 | 72 |
| Other | 857 | 8 |
| Orthodox | 65 | 1 |
| None | 64,181 | - |
Food Environment Statistics:
| Steuben County: | 2.48 / 10,000 pop. |
| New York: | 4.13 / 10,000 pop. |
| Steuben County: | 0.10 / 10,000 pop. |
| New York: | 0.06 / 10,000 pop. |
| This county: | 0.72 / 10,000 pop. |
| State: | 0.92 / 10,000 pop. |
| Here: | 4.24 / 10,000 pop. |
| New York: | 1.68 / 10,000 pop. |
| This county: | 9.00 / 10,000 pop. |
| New York: | 8.82 / 10,000 pop. |
| Steuben County: | 10.2% |
| New York: | 8.2% |
| Here: | 28.3% |
| New York: | 23.8% |
| Steuben County: | 14.2% |
| State: | 15.6% |
Strongest AM radio stations in Urbana:
- WABH (1380 AM; 10 kW; BATH, NY)
- WHAM (1180 AM; 50 kW; ROCHESTER, NY; Owner: CITICASTERS LICENSES, L.P.)
- WFLR (1570 AM; 5 kW; DUNDEE, NY; Owner: LAKES COUNTY COMMUNICATION CORP.)
- WLNL (1000 AM; daytime; 5 kW; HORSEHEADS, NY; Owner: LIGHTHOUSE MEDIA, INC.)
- WWLZ (820 AM; 4 kW; HORSEHEADS, NY; Owner: CHEMUNG COUNTY RADIO, INC.)
- WHHO (1320 AM; 5 kW; HORNELL, NY; Owner: BILBAT RADIO, INC.)
- WPIE (1160 AM; 5 kW; TRUMANSBURG, NY; Owner: PEMBROOK PINES ITHACA LTD. N.A.)
- WWKB (1520 AM; 50 kW; BUFFALO, NY; Owner: ENTERCOM BUFFALO LICENSE, LLC)
- WELM (1410 AM; 5 kW; ELMIRA, NY; Owner: PEMBROOK PINES ELMIRA, LIMITED)
- WEHH (1590 AM; 5 kW; ELMIRA HTS/HORSEHEAD, NY; Owner: PEMBROOK PINES ELMIRA, LTD.)
- WYLF (850 AM; 1 kW; PENN YAN, NY; Owner: M B COMMUNICATIONS, INC.)
- WLEA (1480 AM; 2 kW; HORNELL, NY; Owner: PMJ COMMUNICATIONS, INC.)
- WHCU (870 AM; 5 kW; ITHACA, NY; Owner: EAGLE BROADCASTING COMPANY, INC.)
Strongest FM radio stations in Urbana:
- WVIN-FM (98.3 FM; BATH, NY; Owner: PEMBROOK PINES MASS MEDIA, NA CORP.)
- WCIK (103.1 FM; BATH, NY; Owner: FAMILY LIFE MINISTRIES, INC.)
- WFLR-FM (95.9 FM; DUNDEE, NY; Owner: LAKES COUNTRY COMMUNICATIONS CORP.)
- WCIY (88.9 FM; CANANDAIGUA, NY; Owner: FAMILY LIFE MINISTRIES, INC.)
- WCBA-FM (98.7 FM; CORNING, NY; Owner: EOLIN BROADCASTING, INC.)
- WFXF (107.3 FM; SOUTH BRISTOL TOWNSH, NY; Owner: CITICASTERS LICENSES, L.P.)
- WNVE (95.1 FM; HONEOYE FALLS, NY; Owner: CITICASTERS LICENSES, L.P.)
- WGMM (97.7 FM; BIG FLATS, NY; Owner: EOLIN BROADCASTING, INC.)
- WDNY-FM (93.9 FM; DANSVILLE, NY; Owner: MILLER MEDIA INC.)
- W201CY (88.1 FM; DANSVILLE, NY; Owner: MARS HILL BROADCASTING CO., INC.)
- W246AP (97.1 FM; DANSVILLE, NY; Owner: CALVARY CHAPEL OF THE FINGER LAKES)
- WQNY (103.7 FM; ITHACA, NY; Owner: EAGLE II BROADCASTING CORPORATION)
- WNKI (106.1 FM; CORNING, NY; Owner: CHEMUNG COUNTY RADIO, INC.)
- W282AC (104.3 FM; DANSVILLE, NY; Owner: FAMILY LIFE MINISTRIES, INC.)
- WCKR (92.1 FM; HORNELL, NY; Owner: PMJ COMMUNICATIONS, INC.)
- WNGZ (104.9 FM; MONTOUR FALLS, NY; Owner: CHEMUNG COUNTY RADIO, INC.)
- WOKN (99.5 FM; SOUTHPORT, NY; Owner: PEMBROOK PINES ELMIRA, LTD.)
- WLVY (94.3 FM; ELMIRA, NY; Owner: PEMBROOK PINES ELMIRA, LTD.)
- WISY (102.3 FM; CANANDAIGUA, NY; Owner: CITICASTERS LICENSES, L.P.)
- WSQA (88.7 FM; HORNELL, NY; Owner: WSKG PUBLIC TELECOMMUNICATIONS COUNCIL)
TV broadcast stations around Urbana:
- W60AD (Channel 60; SAVONA, NY; Owner: WSKG PUBLIC TELECOMMUNICATIONS COUNCIL)
- W20BL (Channel 20; BATH, NY; Owner: WYDC, INC.)
- W56AI (Channel 56; HAMMONDSPORT, NY; Owner: BOCES OF STEUBEN-ALLEGANY COUNTY)
- WETM-TV (Channel 18; ELMIRA, NY; Owner: SMITH TELEVISION OF NEW YORK LICENSE HOLDINGS, INC.)
- WENY-TV (Channel 36; ELMIRA, NY; Owner: LILLY BROADCASTING, L.L.C.)
- WYDC (Channel 48; CORNING, NY; Owner: WYDC, INC.)
- W26BF (Channel 26; ELMIRA, NY; Owner: WYDC, INC.)
Urbana fatal accident list:
Feb 8, 2007 02:37 PM, Sr-54, Lat: 42.366622, Lon: -77.288108, Vehicles: 3, Persons: 4, Fatalities: 2, Drunk persons involved: 1
Dec 1, 1998 11:25 PM, Cr-16, Vehicles: 1, Persons: 2, Pedestrians: 1, Fatalities: 1, Drunk persons involved: 1
Jan 24, 1997 03:30 PM, 54, Vehicles: 2, Persons: 3, Fatalities: 1
- National Bridge Inventory (NBI) Statistics
- 9Number of bridges
- 36ft / 10.9mTotal length
- $4,524,000Total costs
- 16,209Total average daily traffic
- 1,838Total average daily truck traffic
- 17,472Total future (year 2038) average daily traffic
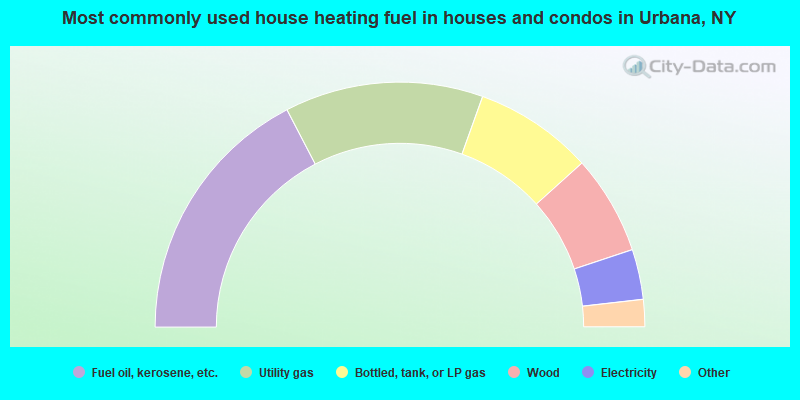
- 34.7%Fuel oil, kerosene, etc.
- 26.2%Utility gas
- 15.7%Bottled, tank, or LP gas
- 13.1%Wood
- 6.6%Electricity
- 3.1%Coal or coke
- 0.5%Other fuel
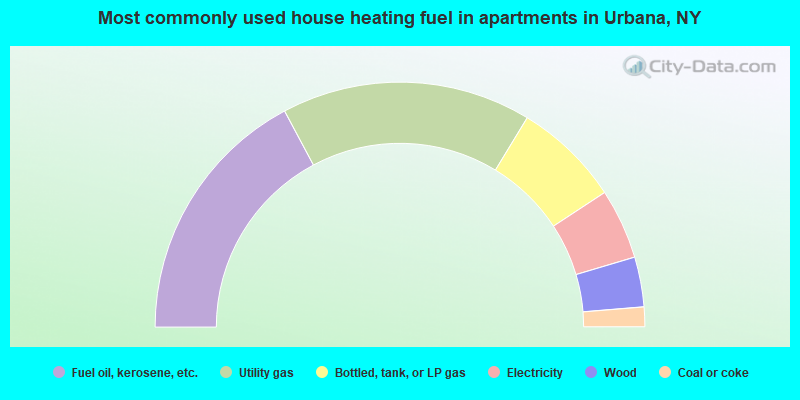
- 34.4%Fuel oil, kerosene, etc.
- 33.0%Utility gas
- 14.1%Bottled, tank, or LP gas
- 9.3%Electricity
- 6.6%Wood
- 2.6%Coal or coke
Urbana compared to New York state average:
- Median house value significantly below state average.
- Unemployed percentage significantly below state average.
- Black race population percentage significantly below state average.
- Hispanic race population percentage significantly below state average.
- Median age significantly above state average.
- Foreign-born population percentage significantly below state average.
- Renting percentage below state average.
- Length of stay since moving in significantly above state average.
- Number of rooms per house significantly below state average.
- House age significantly below state average.
- Institutionalized population percentage above state average.
- Number of college students below state average.