Swannanoa, North Carolina Submit your own pictures of this place and show them to the world
OSM Map
General Map
Google Map
MSN Map
OSM Map
General Map
Google Map
MSN Map
OSM Map
General Map
Google Map
MSN Map
OSM Map
General Map
Google Map
MSN Map
Please wait while loading the map...
Population in 2010: 4,576. Population change since 2000: +10.7%Males: 2,300 Females: 2,276
March 2022 cost of living index in Swannanoa: 88.9 (less than average, U.S. average is 100) Percentage of residents living in poverty in 2022: 18.3%for White Non-Hispanic residents , 82.1% for Black residents , 82.1% for Hispanic or Latino residents , 64.8% for two or more races residents )
Profiles of local businesses
Business Search - 14 Million verified businesses
Data:
Median household income ($)
Median household income (% change since 2000)
Household income diversity
Ratio of average income to average house value (%)
Ratio of average income to average rent
Median household income ($) - White
Median household income ($) - Black or African American
Median household income ($) - Asian
Median household income ($) - Hispanic or Latino
Median household income ($) - American Indian and Alaska Native
Median household income ($) - Multirace
Median household income ($) - Other Race
Median household income for houses/condos with a mortgage ($)
Median household income for apartments without a mortgage ($)
Races - White alone (%)
Races - White alone (% change since 2000)
Races - Black alone (%)
Races - Black alone (% change since 2000)
Races - American Indian alone (%)
Races - American Indian alone (% change since 2000)
Races - Asian alone (%)
Races - Asian alone (% change since 2000)
Races - Hispanic (%)
Races - Hispanic (% change since 2000)
Races - Native Hawaiian and Other Pacific Islander alone (%)
Races - Native Hawaiian and Other Pacific Islander alone (% change since 2000)
Races - Two or more races (%)
Races - Two or more races (% change since 2000)
Races - Other race alone (%)
Races - Other race alone (% change since 2000)
Racial diversity
Unemployment (%)
Unemployment (% change since 2000)
Unemployment (%) - White
Unemployment (%) - Black or African American
Unemployment (%) - Asian
Unemployment (%) - Hispanic or Latino
Unemployment (%) - American Indian and Alaska Native
Unemployment (%) - Multirace
Unemployment (%) - Other Race
Population density (people per square mile)
Population - Males (%)
Population - Females (%)
Population - Males (%) - White
Population - Males (%) - Black or African American
Population - Males (%) - Asian
Population - Males (%) - Hispanic or Latino
Population - Males (%) - American Indian and Alaska Native
Population - Males (%) - Multirace
Population - Males (%) - Other Race
Population - Females (%) - White
Population - Females (%) - Black or African American
Population - Females (%) - Asian
Population - Females (%) - Hispanic or Latino
Population - Females (%) - American Indian and Alaska Native
Population - Females (%) - Multirace
Population - Females (%) - Other Race
Coronavirus confirmed cases (May 21, 2024)
Deaths caused by coronavirus (May 21, 2024)
Coronavirus confirmed cases (per 100k population) (May 21, 2024)
Deaths caused by coronavirus (per 100k population) (May 21, 2024)
Daily increase in number of cases (May 21, 2024)
Weekly increase in number of cases (May 21, 2024)
Cases doubled (in days) (May 21, 2024)
Hospitalized patients (Apr 18, 2022)
Negative test results (Apr 18, 2022)
Total test results (Apr 18, 2022)
COVID Vaccine doses distributed (per 100k population) (Sep 19, 2023)
COVID Vaccine doses administered (per 100k population) (Sep 19, 2023)
COVID Vaccine doses distributed (Sep 19, 2023)
COVID Vaccine doses administered (Sep 19, 2023)
Likely homosexual households (%)
Likely homosexual households (% change since 2000)
Likely homosexual households - Lesbian couples (%)
Likely homosexual households - Lesbian couples (% change since 2000)
Likely homosexual households - Gay men (%)
Likely homosexual households - Gay men (% change since 2000)
Cost of living index
Median gross rent ($)
Median contract rent ($)
Median monthly housing costs ($)
Median house or condo value ($)
Median house or condo value ($ change since 2000)
Mean house or condo value by units in structure - 1, detached ($)
Mean house or condo value by units in structure - 1, attached ($)
Mean house or condo value by units in structure - 2 ($)
Mean house or condo value by units in structure by units in structure - 3 or 4 ($)
Mean house or condo value by units in structure - 5 or more ($)
Mean house or condo value by units in structure - Boat, RV, van, etc. ($)
Mean house or condo value by units in structure - Mobile home ($)
Median house or condo value ($) - White
Median house or condo value ($) - Black or African American
Median house or condo value ($) - Asian
Median house or condo value ($) - Hispanic or Latino
Median house or condo value ($) - American Indian and Alaska Native
Median house or condo value ($) - Multirace
Median house or condo value ($) - Other Race
Median resident age
Resident age diversity
Median resident age - Males
Median resident age - Females
Median resident age - White
Median resident age - Black or African American
Median resident age - Asian
Median resident age - Hispanic or Latino
Median resident age - American Indian and Alaska Native
Median resident age - Multirace
Median resident age - Other Race
Median resident age - Males - White
Median resident age - Males - Black or African American
Median resident age - Males - Asian
Median resident age - Males - Hispanic or Latino
Median resident age - Males - American Indian and Alaska Native
Median resident age - Males - Multirace
Median resident age - Males - Other Race
Median resident age - Females - White
Median resident age - Females - Black or African American
Median resident age - Females - Asian
Median resident age - Females - Hispanic or Latino
Median resident age - Females - American Indian and Alaska Native
Median resident age - Females - Multirace
Median resident age - Females - Other Race
Commute - mean travel time to work (minutes)
Travel time to work - Less than 5 minutes (%)
Travel time to work - Less than 5 minutes (% change since 2000)
Travel time to work - 5 to 9 minutes (%)
Travel time to work - 5 to 9 minutes (% change since 2000)
Travel time to work - 10 to 19 minutes (%)
Travel time to work - 10 to 19 minutes (% change since 2000)
Travel time to work - 20 to 29 minutes (%)
Travel time to work - 20 to 29 minutes (% change since 2000)
Travel time to work - 30 to 39 minutes (%)
Travel time to work - 30 to 39 minutes (% change since 2000)
Travel time to work - 40 to 59 minutes (%)
Travel time to work - 40 to 59 minutes (% change since 2000)
Travel time to work - 60 to 89 minutes (%)
Travel time to work - 60 to 89 minutes (% change since 2000)
Travel time to work - 90 or more minutes (%)
Travel time to work - 90 or more minutes (% change since 2000)
Marital status - Never married (%)
Marital status - Now married (%)
Marital status - Separated (%)
Marital status - Widowed (%)
Marital status - Divorced (%)
Median family income ($)
Median family income (% change since 2000)
Median non-family income ($)
Median non-family income (% change since 2000)
Median per capita income ($)
Median per capita income (% change since 2000)
Median family income ($) - White
Median family income ($) - Black or African American
Median family income ($) - Asian
Median family income ($) - Hispanic or Latino
Median family income ($) - American Indian and Alaska Native
Median family income ($) - Multirace
Median family income ($) - Other Race
Median year house/condo built
Median year apartment built
Year house built - Built 2005 or later (%)
Year house built - Built 2000 to 2004 (%)
Year house built - Built 1990 to 1999 (%)
Year house built - Built 1980 to 1989 (%)
Year house built - Built 1970 to 1979 (%)
Year house built - Built 1960 to 1969 (%)
Year house built - Built 1950 to 1959 (%)
Year house built - Built 1940 to 1949 (%)
Year house built - Built 1939 or earlier (%)
Average household size
Household density (households per square mile)
Average household size - White
Average household size - Black or African American
Average household size - Asian
Average household size - Hispanic or Latino
Average household size - American Indian and Alaska Native
Average household size - Multirace
Average household size - Other Race
Occupied housing units (%)
Vacant housing units (%)
Owner occupied housing units (%)
Renter occupied housing units (%)
Vacancy status - For rent (%)
Vacancy status - For sale only (%)
Vacancy status - Rented or sold, not occupied (%)
Vacancy status - For seasonal, recreational, or occasional use (%)
Vacancy status - For migrant workers (%)
Vacancy status - Other vacant (%)
Residents with income below the poverty level (%)
Residents with income below 50% of the poverty level (%)
Children below poverty level (%)
Poor families by family type - Married-couple family (%)
Poor families by family type - Male, no wife present (%)
Poor families by family type - Female, no husband present (%)
Poverty status for native-born residents (%)
Poverty status for foreign-born residents (%)
Poverty among high school graduates not in families (%)
Poverty among people who did not graduate high school not in families (%)
Residents with income below the poverty level (%) - White
Residents with income below the poverty level (%) - Black or African American
Residents with income below the poverty level (%) - Asian
Residents with income below the poverty level (%) - Hispanic or Latino
Residents with income below the poverty level (%) - American Indian and Alaska Native
Residents with income below the poverty level (%) - Multirace
Residents with income below the poverty level (%) - Other Race
Air pollution - Air Quality Index (AQI)
Air pollution - CO
Air pollution - NO2
Air pollution - SO2
Air pollution - Ozone
Air pollution - PM10
Air pollution - PM25
Air pollution - Pb
Crime - Murders per 100,000 population
Crime - Rapes per 100,000 population
Crime - Robberies per 100,000 population
Crime - Assaults per 100,000 population
Crime - Burglaries per 100,000 population
Crime - Thefts per 100,000 population
Crime - Auto thefts per 100,000 population
Crime - Arson per 100,000 population
Crime - City-data.com crime index
Crime - Violent crime index
Crime - Property crime index
Crime - Murders per 100,000 population (5 year average)
Crime - Rapes per 100,000 population (5 year average)
Crime - Robberies per 100,000 population (5 year average)
Crime - Assaults per 100,000 population (5 year average)
Crime - Burglaries per 100,000 population (5 year average)
Crime - Thefts per 100,000 population (5 year average)
Crime - Auto thefts per 100,000 population (5 year average)
Crime - Arson per 100,000 population (5 year average)
Crime - City-data.com crime index (5 year average)
Crime - Violent crime index (5 year average)
Crime - Property crime index (5 year average)
1996 Presidential Elections Results (%) - Democratic Party (Clinton)
1996 Presidential Elections Results (%) - Republican Party (Dole)
1996 Presidential Elections Results (%) - Other
2000 Presidential Elections Results (%) - Democratic Party (Gore)
2000 Presidential Elections Results (%) - Republican Party (Bush)
2000 Presidential Elections Results (%) - Other
2004 Presidential Elections Results (%) - Democratic Party (Kerry)
2004 Presidential Elections Results (%) - Republican Party (Bush)
2004 Presidential Elections Results (%) - Other
2008 Presidential Elections Results (%) - Democratic Party (Obama)
2008 Presidential Elections Results (%) - Republican Party (McCain)
2008 Presidential Elections Results (%) - Other
2012 Presidential Elections Results (%) - Democratic Party (Obama)
2012 Presidential Elections Results (%) - Republican Party (Romney)
2012 Presidential Elections Results (%) - Other
2016 Presidential Elections Results (%) - Democratic Party (Clinton)
2016 Presidential Elections Results (%) - Republican Party (Trump)
2016 Presidential Elections Results (%) - Other
2020 Presidential Elections Results (%) - Democratic Party (Biden)
2020 Presidential Elections Results (%) - Republican Party (Trump)
2020 Presidential Elections Results (%) - Other
Ancestries Reported - Arab (%)
Ancestries Reported - Czech (%)
Ancestries Reported - Danish (%)
Ancestries Reported - Dutch (%)
Ancestries Reported - English (%)
Ancestries Reported - French (%)
Ancestries Reported - French Canadian (%)
Ancestries Reported - German (%)
Ancestries Reported - Greek (%)
Ancestries Reported - Hungarian (%)
Ancestries Reported - Irish (%)
Ancestries Reported - Italian (%)
Ancestries Reported - Lithuanian (%)
Ancestries Reported - Norwegian (%)
Ancestries Reported - Polish (%)
Ancestries Reported - Portuguese (%)
Ancestries Reported - Russian (%)
Ancestries Reported - Scotch-Irish (%)
Ancestries Reported - Scottish (%)
Ancestries Reported - Slovak (%)
Ancestries Reported - Subsaharan African (%)
Ancestries Reported - Swedish (%)
Ancestries Reported - Swiss (%)
Ancestries Reported - Ukrainian (%)
Ancestries Reported - United States (%)
Ancestries Reported - Welsh (%)
Ancestries Reported - West Indian (%)
Ancestries Reported - Other (%)
Educational Attainment - No schooling completed (%)
Educational Attainment - Less than high school (%)
Educational Attainment - High school or equivalent (%)
Educational Attainment - Less than 1 year of college (%)
Educational Attainment - 1 or more years of college (%)
Educational Attainment - Associate degree (%)
Educational Attainment - Bachelor's degree (%)
Educational Attainment - Master's degree (%)
Educational Attainment - Professional school degree (%)
Educational Attainment - Doctorate degree (%)
School Enrollment - Nursery, preschool (%)
School Enrollment - Kindergarten (%)
School Enrollment - Grade 1 to 4 (%)
School Enrollment - Grade 5 to 8 (%)
School Enrollment - Grade 9 to 12 (%)
School Enrollment - College undergrad (%)
School Enrollment - Graduate or professional (%)
School Enrollment - Not enrolled in school (%)
School enrollment - Public schools (%)
School enrollment - Private schools (%)
School enrollment - Not enrolled (%)
Median number of rooms in houses and condos
Median number of rooms in apartments
Housing units lacking complete plumbing facilities (%)
Housing units lacking complete kitchen facilities (%)
Density of houses
Urban houses (%)
Rural houses (%)
Households with people 60 years and over (%)
Households with people 65 years and over (%)
Households with people 75 years and over (%)
Households with one or more nonrelatives (%)
Households with no nonrelatives (%)
Population in households (%)
Family households (%)
Nonfamily households (%)
Population in families (%)
Family households with own children (%)
Median number of bedrooms in owner occupied houses
Mean number of bedrooms in owner occupied houses
Median number of bedrooms in renter occupied houses
Mean number of bedrooms in renter occupied houses
Median number of vehichles in owner occupied houses
Mean number of vehichles in owner occupied houses
Median number of vehichles in renter occupied houses
Mean number of vehichles in renter occupied houses
Mortgage status - with mortgage (%)
Mortgage status - with second mortgage (%)
Mortgage status - with home equity loan (%)
Mortgage status - with both second mortgage and home equity loan (%)
Mortgage status - without a mortgage (%)
Average family size
Average family size - White
Average family size - Black or African American
Average family size - Asian
Average family size - Hispanic or Latino
Average family size - American Indian and Alaska Native
Average family size - Multirace
Average family size - Other Race
Geographical mobility - Same house 1 year ago (%)
Geographical mobility - Moved within same county (%)
Geographical mobility - Moved from different county within same state (%)
Geographical mobility - Moved from different state (%)
Geographical mobility - Moved from abroad (%)
Place of birth - Born in state of residence (%)
Place of birth - Born in other state (%)
Place of birth - Native, outside of US (%)
Place of birth - Foreign born (%)
Housing units in structures - 1, detached (%)
Housing units in structures - 1, attached (%)
Housing units in structures - 2 (%)
Housing units in structures - 3 or 4 (%)
Housing units in structures - 5 to 9 (%)
Housing units in structures - 10 to 19 (%)
Housing units in structures - 20 to 49 (%)
Housing units in structures - 50 or more (%)
Housing units in structures - Mobile home (%)
Housing units in structures - Boat, RV, van, etc. (%)
House/condo owner moved in on average (years ago)
Renter moved in on average (years ago)
Year householder moved into unit - Moved in 1999 to March 2000 (%)
Year householder moved into unit - Moved in 1995 to 1998 (%)
Year householder moved into unit - Moved in 1990 to 1994 (%)
Year householder moved into unit - Moved in 1980 to 1989 (%)
Year householder moved into unit - Moved in 1970 to 1979 (%)
Year householder moved into unit - Moved in 1969 or earlier (%)
Means of transportation to work - Drove car alone (%)
Means of transportation to work - Carpooled (%)
Means of transportation to work - Public transportation (%)
Means of transportation to work - Bus or trolley bus (%)
Means of transportation to work - Streetcar or trolley car (%)
Means of transportation to work - Subway or elevated (%)
Means of transportation to work - Railroad (%)
Means of transportation to work - Ferryboat (%)
Means of transportation to work - Taxicab (%)
Means of transportation to work - Motorcycle (%)
Means of transportation to work - Bicycle (%)
Means of transportation to work - Walked (%)
Means of transportation to work - Other means (%)
Working at home (%)
Industry diversity
Most Common Industries - Agriculture, forestry, fishing and hunting, and mining (%)
Most Common Industries - Agriculture, forestry, fishing and hunting (%)
Most Common Industries - Mining, quarrying, and oil and gas extraction (%)
Most Common Industries - Construction (%)
Most Common Industries - Manufacturing (%)
Most Common Industries - Wholesale trade (%)
Most Common Industries - Retail trade (%)
Most Common Industries - Transportation and warehousing, and utilities (%)
Most Common Industries - Transportation and warehousing (%)
Most Common Industries - Utilities (%)
Most Common Industries - Information (%)
Most Common Industries - Finance and insurance, and real estate and rental and leasing (%)
Most Common Industries - Finance and insurance (%)
Most Common Industries - Real estate and rental and leasing (%)
Most Common Industries - Professional, scientific, and management, and administrative and waste management services (%)
Most Common Industries - Professional, scientific, and technical services (%)
Most Common Industries - Management of companies and enterprises (%)
Most Common Industries - Administrative and support and waste management services (%)
Most Common Industries - Educational services, and health care and social assistance (%)
Most Common Industries - Educational services (%)
Most Common Industries - Health care and social assistance (%)
Most Common Industries - Arts, entertainment, and recreation, and accommodation and food services (%)
Most Common Industries - Arts, entertainment, and recreation (%)
Most Common Industries - Accommodation and food services (%)
Most Common Industries - Other services, except public administration (%)
Most Common Industries - Public administration (%)
Occupation diversity
Most Common Occupations - Management, business, science, and arts occupations (%)
Most Common Occupations - Management, business, and financial occupations (%)
Most Common Occupations - Management occupations (%)
Most Common Occupations - Business and financial operations occupations (%)
Most Common Occupations - Computer, engineering, and science occupations (%)
Most Common Occupations - Computer and mathematical occupations (%)
Most Common Occupations - Architecture and engineering occupations (%)
Most Common Occupations - Life, physical, and social science occupations (%)
Most Common Occupations - Education, legal, community service, arts, and media occupations (%)
Most Common Occupations - Community and social service occupations (%)
Most Common Occupations - Legal occupations (%)
Most Common Occupations - Education, training, and library occupations (%)
Most Common Occupations - Arts, design, entertainment, sports, and media occupations (%)
Most Common Occupations - Healthcare practitioners and technical occupations (%)
Most Common Occupations - Health diagnosing and treating practitioners and other technical occupations (%)
Most Common Occupations - Health technologists and technicians (%)
Most Common Occupations - Service occupations (%)
Most Common Occupations - Healthcare support occupations (%)
Most Common Occupations - Protective service occupations (%)
Most Common Occupations - Fire fighting and prevention, and other protective service workers including supervisors (%)
Most Common Occupations - Law enforcement workers including supervisors (%)
Most Common Occupations - Food preparation and serving related occupations (%)
Most Common Occupations - Building and grounds cleaning and maintenance occupations (%)
Most Common Occupations - Personal care and service occupations (%)
Most Common Occupations - Sales and office occupations (%)
Most Common Occupations - Sales and related occupations (%)
Most Common Occupations - Office and administrative support occupations (%)
Most Common Occupations - Natural resources, construction, and maintenance occupations (%)
Most Common Occupations - Farming, fishing, and forestry occupations (%)
Most Common Occupations - Construction and extraction occupations (%)
Most Common Occupations - Installation, maintenance, and repair occupations (%)
Most Common Occupations - Production, transportation, and material moving occupations (%)
Most Common Occupations - Production occupations (%)
Most Common Occupations - Transportation occupations (%)
Most Common Occupations - Material moving occupations (%)
People in Group quarters - Institutionalized population (%)
People in Group quarters - Correctional institutions (%)
People in Group quarters - Federal prisons and detention centers (%)
People in Group quarters - Halfway houses (%)
People in Group quarters - Local jails and other confinement facilities (including police lockups) (%)
People in Group quarters - Military disciplinary barracks (%)
People in Group quarters - State prisons (%)
People in Group quarters - Other types of correctional institutions (%)
People in Group quarters - Nursing homes (%)
People in Group quarters - Hospitals/wards, hospices, and schools for the handicapped (%)
People in Group quarters - Hospitals/wards and hospices for chronically ill (%)
People in Group quarters - Hospices or homes for chronically ill (%)
People in Group quarters - Military hospitals or wards for chronically ill (%)
People in Group quarters - Other hospitals or wards for chronically ill (%)
People in Group quarters - Hospitals or wards for drug/alcohol abuse (%)
People in Group quarters - Mental (Psychiatric) hospitals or wards (%)
People in Group quarters - Schools, hospitals, or wards for the mentally retarded (%)
People in Group quarters - Schools, hospitals, or wards for the physically handicapped (%)
People in Group quarters - Institutions for the deaf (%)
People in Group quarters - Institutions for the blind (%)
People in Group quarters - Orthopedic wards and institutions for the physically handicapped (%)
People in Group quarters - Wards in general hospitals for patients who have no usual home elsewhere (%)
People in Group quarters - Wards in military hospitals for patients who have no usual home elsewhere (%)
People in Group quarters - Juvenile institutions (%)
People in Group quarters - Long-term care (%)
People in Group quarters - Homes for abused, dependent, and neglected children (%)
People in Group quarters - Residential treatment centers for emotionally disturbed children (%)
People in Group quarters - Training schools for juvenile delinquents (%)
People in Group quarters - Short-term care, detention or diagnostic centers for delinquent children (%)
People in Group quarters - Type of juvenile institution unknown (%)
People in Group quarters - Noninstitutionalized population (%)
People in Group quarters - College dormitories (includes college quarters off campus) (%)
People in Group quarters - Military quarters (%)
People in Group quarters - On base (%)
People in Group quarters - Barracks, unaccompanied personnel housing (UPH), (Enlisted/Officer), ;and similar group living quarters for military personnel (%)
People in Group quarters - Transient quarters for temporary residents (%)
People in Group quarters - Military ships (%)
People in Group quarters - Group homes (%)
People in Group quarters - Homes or halfway houses for drug/alcohol abuse (%)
People in Group quarters - Homes for the mentally ill (%)
People in Group quarters - Homes for the mentally retarded (%)
People in Group quarters - Homes for the physically handicapped (%)
People in Group quarters - Other group homes (%)
People in Group quarters - Religious group quarters (%)
People in Group quarters - Dormitories (%)
People in Group quarters - Agriculture workers' dormitories on farms (%)
People in Group quarters - Job Corps and vocational training facilities (%)
People in Group quarters - Other workers' dormitories (%)
People in Group quarters - Crews of maritime vessels (%)
People in Group quarters - Other nonhousehold living situations (%)
People in Group quarters - Other noninstitutional group quarters (%)
Residents speaking English at home (%)
Residents speaking English at home - Born in the United States (%)
Residents speaking English at home - Native, born elsewhere (%)
Residents speaking English at home - Foreign born (%)
Residents speaking Spanish at home (%)
Residents speaking Spanish at home - Born in the United States (%)
Residents speaking Spanish at home - Native, born elsewhere (%)
Residents speaking Spanish at home - Foreign born (%)
Residents speaking other language at home (%)
Residents speaking other language at home - Born in the United States (%)
Residents speaking other language at home - Native, born elsewhere (%)
Residents speaking other language at home - Foreign born (%)
Class of Workers - Employee of private company (%)
Class of Workers - Self-employed in own incorporated business (%)
Class of Workers - Private not-for-profit wage and salary workers (%)
Class of Workers - Local government workers (%)
Class of Workers - State government workers (%)
Class of Workers - Federal government workers (%)
Class of Workers - Self-employed workers in own not incorporated business and Unpaid family workers (%)
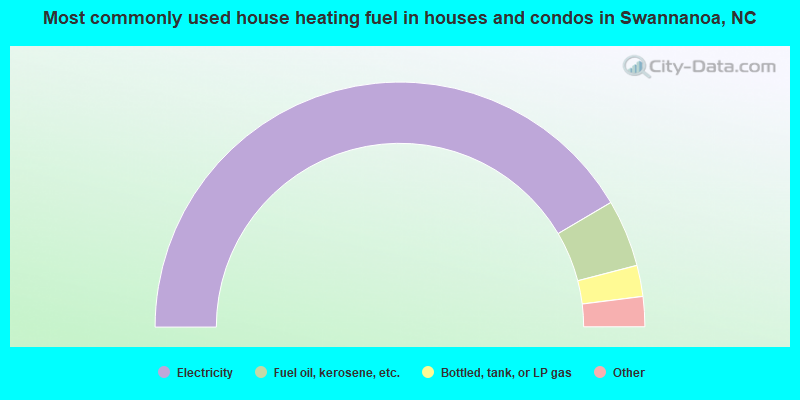
House heating fuel used in houses and condos - Utility gas (%)
House heating fuel used in houses and condos - Bottled, tank, or LP gas (%)
House heating fuel used in houses and condos - Electricity (%)
House heating fuel used in houses and condos - Fuel oil, kerosene, etc. (%)
House heating fuel used in houses and condos - Coal or coke (%)
House heating fuel used in houses and condos - Wood (%)
House heating fuel used in houses and condos - Solar energy (%)
House heating fuel used in houses and condos - Other fuel (%)
House heating fuel used in houses and condos - No fuel used (%)
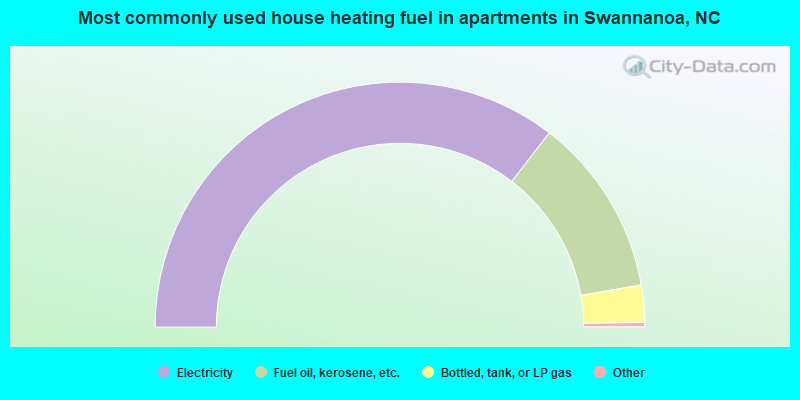
House heating fuel used in apartments - Utility gas (%)
House heating fuel used in apartments - Bottled, tank, or LP gas (%)
House heating fuel used in apartments - Electricity (%)
House heating fuel used in apartments - Fuel oil, kerosene, etc. (%)
House heating fuel used in apartments - Coal or coke (%)
House heating fuel used in apartments - Wood (%)
House heating fuel used in apartments - Solar energy (%)
House heating fuel used in apartments - Other fuel (%)
House heating fuel used in apartments - No fuel used (%)
Armed forces status - In Armed Forces (%)
Armed forces status - Civilian (%)
Armed forces status - Civilian - Veteran (%)
Armed forces status - Civilian - Nonveteran (%)
Fatal accidents locations in years 2005-2021
Fatal accidents locations in 2005
Fatal accidents locations in 2006
Fatal accidents locations in 2007
Fatal accidents locations in 2008
Fatal accidents locations in 2009
Fatal accidents locations in 2010
Fatal accidents locations in 2011
Fatal accidents locations in 2012
Fatal accidents locations in 2013
Fatal accidents locations in 2014
Fatal accidents locations in 2015
Fatal accidents locations in 2016
Fatal accidents locations in 2017
Fatal accidents locations in 2018
Fatal accidents locations in 2019
Fatal accidents locations in 2020
Fatal accidents locations in 2021
Alcohol use - People drinking some alcohol every month (%)
Alcohol use - People not drinking at all (%)
Alcohol use - Average days/month drinking alcohol
Alcohol use - Average drinks/week
Alcohol use - Average days/year people drink much
Audiometry - Average condition of hearing (%)
Audiometry - People that can hear a whisper from across a quiet room (%)
Audiometry - People that can hear normal voice from across a quiet room (%)
Audiometry - Ears ringing, roaring, buzzing (%)
Audiometry - Had a job exposure to loud noise (%)
Audiometry - Had off-work exposure to loud noise (%)
Blood Pressure & Cholesterol - Has high blood pressure (%)
Blood Pressure & Cholesterol - Checking blood pressure at home (%)
Blood Pressure & Cholesterol - Frequently checking blood cholesterol (%)
Blood Pressure & Cholesterol - Has high cholesterol level (%)
Consumer Behavior - Money monthly spent on food at supermarket/grocery store
Consumer Behavior - Money monthly spent on food at other stores
Consumer Behavior - Money monthly spent on eating out
Consumer Behavior - Money monthly spent on carryout/delivered foods
Consumer Behavior - Income spent on food at supermarket/grocery store (%)
Consumer Behavior - Income spent on food at other stores (%)
Consumer Behavior - Income spent on eating out (%)
Consumer Behavior - Income spent on carryout/delivered foods (%)
Current Health Status - General health condition (%)
Current Health Status - Blood donors (%)
Current Health Status - Has blood ever tested for HIV virus (%)
Current Health Status - Left-handed people (%)
Dermatology - People using sunscreen (%)
Diabetes - Diabetics (%)
Diabetes - Had a blood test for high blood sugar (%)
Diabetes - People taking insulin (%)
Diet Behavior & Nutrition - Diet health (%)
Diet Behavior & Nutrition - Milk product consumption (# of products/month)
Diet Behavior & Nutrition - Meals not home prepared (#/week)
Diet Behavior & Nutrition - Meals from fast food or pizza place (#/week)
Diet Behavior & Nutrition - Ready-to-eat foods (#/month)
Diet Behavior & Nutrition - Frozen meals/pizza (#/month)
Drug Use - People that ever used marijuana or hashish (%)
Drug Use - Ever used hard drugs (%)
Drug Use - Ever used any form of cocaine (%)
Drug Use - Ever used heroin (%)
Drug Use - Ever used methamphetamine (%)
Health Insurance - People covered by health insurance (%)
Kidney Conditions-Urology - Avg. # of times urinating at night
Medical Conditions - People with asthma (%)
Medical Conditions - People with anemia (%)
Medical Conditions - People with psoriasis (%)
Medical Conditions - People with overweight (%)
Medical Conditions - Elderly people having difficulties in thinking or remembering (%)
Medical Conditions - People who ever received blood transfusion (%)
Medical Conditions - People having trouble seeing even with glass/contacts (%)
Medical Conditions - People with arthritis (%)
Medical Conditions - People with gout (%)
Medical Conditions - People with congestive heart failure (%)
Medical Conditions - People with coronary heart disease (%)
Medical Conditions - People with angina pectoris (%)
Medical Conditions - People who ever had heart attack (%)
Medical Conditions - People who ever had stroke (%)
Medical Conditions - People with emphysema (%)
Medical Conditions - People with thyroid problem (%)
Medical Conditions - People with chronic bronchitis (%)
Medical Conditions - People with any liver condition (%)
Medical Conditions - People who ever had cancer or malignancy (%)
Mental Health - People who have little interest in doing things (%)
Mental Health - People feeling down, depressed, or hopeless (%)
Mental Health - People who have trouble sleeping or sleeping too much (%)
Mental Health - People feeling tired or having little energy (%)
Mental Health - People with poor appetite or overeating (%)
Mental Health - People feeling bad about themself (%)
Mental Health - People who have trouble concentrating on things (%)
Mental Health - People moving or speaking slowly or too fast (%)
Mental Health - People having thoughts they would be better off dead (%)
Oral Health - Average years since last visit a dentist
Oral Health - People embarrassed because of mouth (%)
Oral Health - People with gum disease (%)
Oral Health - General health of teeth and gums (%)
Oral Health - Average days a week using dental floss/device
Oral Health - Average days a week using mouthwash for dental problem
Oral Health - Average number of teeth
Pesticide Use - Households using pesticides to control insects (%)
Pesticide Use - Households using pesticides to kill weeds (%)
Physical Activity - People doing vigorous-intensity work activities (%)
Physical Activity - People doing moderate-intensity work activities (%)
Physical Activity - People walking or bicycling (%)
Physical Activity - People doing vigorous-intensity recreational activities (%)
Physical Activity - People doing moderate-intensity recreational activities (%)
Physical Activity - Average hours a day doing sedentary activities
Physical Activity - Average hours a day watching TV or videos
Physical Activity - Average hours a day using computer
Physical Functioning - People having limitations keeping them from working (%)
Physical Functioning - People limited in amount of work they can do (%)
Physical Functioning - People that need special equipment to walk (%)
Physical Functioning - People experiencing confusion/memory problems (%)
Physical Functioning - People requiring special healthcare equipment (%)
Prescription Medications - Average number of prescription medicines taking
Preventive Aspirin Use - Adults 40+ taking low-dose aspirin (%)
Reproductive Health - Vaginal deliveries (%)
Reproductive Health - Cesarean deliveries (%)
Reproductive Health - Deliveries resulted in a live birth (%)
Reproductive Health - Pregnancies resulted in a delivery (%)
Reproductive Health - Women breastfeeding newborns (%)
Reproductive Health - Women that had a hysterectomy (%)
Reproductive Health - Women that had both ovaries removed (%)
Reproductive Health - Women that have ever taken birth control pills (%)
Reproductive Health - Women taking birth control pills (%)
Reproductive Health - Women that have ever used Depo-Provera or injectables (%)
Reproductive Health - Women that have ever used female hormones (%)
Sexual Behavior - People 18+ that ever had sex (vaginal, anal, or oral) (%)
Sexual Behavior - Males 18+ that ever had vaginal sex with a woman (%)
Sexual Behavior - Males 18+ that ever performed oral sex on a woman (%)
Sexual Behavior - Males 18+ that ever had anal sex with a woman (%)
Sexual Behavior - Males 18+ that ever had any sex with a man (%)
Sexual Behavior - Females 18+ that ever had vaginal sex with a man (%)
Sexual Behavior - Females 18+ that ever performed oral sex on a man (%)
Sexual Behavior - Females 18+ that ever had anal sex with a man (%)
Sexual Behavior - Females 18+ that ever had any kind of sex with a woman (%)
Sexual Behavior - Average age people first had sex
Sexual Behavior - Average number of female sex partners in lifetime (males 18+)
Sexual Behavior - Average number of female vaginal sex partners in lifetime (males 18+)
Sexual Behavior - Average age people first performed oral sex on a woman (18+)
Sexual Behavior - Average number of woman performed oral sex on in lifetime (18+)
Sexual Behavior - Average number of male sex partners in lifetime (males 18+)
Sexual Behavior - Average number of male anal sex partners in lifetime (males 18+)
Sexual Behavior - Average age people first performed oral sex on a man (18+)
Sexual Behavior - Average number of male oral sex partners in lifetime (18+)
Sexual Behavior - People using protection when performing oral sex (%)
Sexual Behavior - Average number of times people have vaginal or anal sex a year
Sexual Behavior - People having sex without condom (%)
Sexual Behavior - Average number of male sex partners in lifetime (females 18+)
Sexual Behavior - Average number of male vaginal sex partners in lifetime (females 18+)
Sexual Behavior - Average number of female sex partners in lifetime (females 18+)
Sexual Behavior - Circumcised males 18+ (%)
Sleep Disorders - Average hours sleeping at night
Sleep Disorders - People that has trouble sleeping (%)
Smoking-Cigarette Use - People smoking cigarettes (%)
Taste & Smell - People 40+ having problems with smell (%)
Taste & Smell - People 40+ having problems with taste (%)
Taste & Smell - People 40+ that ever had wisdom teeth removed (%)
Taste & Smell - People 40+ that ever had tonsils teeth removed (%)
Taste & Smell - People 40+ that ever had a loss of consciousness because of a head injury (%)
Taste & Smell - People 40+ that ever had a broken nose or other serious injury to face or skull (%)
Taste & Smell - People 40+ that ever had two or more sinus infections (%)
Weight - Average height (inches)
Weight - Average weight (pounds)
Weight - Average BMI
Weight - People that are obese (%)
Weight - People that ever were obese (%)
Weight - People trying to lose weight (%)
Latest news from Swannanoa, NC collected exclusively by city-data.com from local newspapers, TV, and radio stations
Ancestries: English (42.6%), American (11.9%), German (7.6%), Irish (2.6%), Scotch-Irish (2.3%), Polish (1.4%).
Current Local Time:
Land area: 6.36 square miles.
Population density: 719 people per square mile (low).
202 residents are foreign born (2.3% Latin America , 1.3% Europe ).
This place:
3.7%North Carolina:
8.3%
Median real estate property taxes paid for housing units with mortgages in 2022: $1,499 (0.6%)Median real estate property taxes paid for housing units with no mortgage in 2022: $983 (0.4%)
Nearest city with pop. 50,000+: Asheville, NC
Nearest city with pop. 200,000+: Charlotte, NC
Nearest city with pop. 1,000,000+: Philadelphia, PA
Nearest cities:
Latitude: 35.60 N, Longitude: 82.39 W
Unemployment in December 2023: Here:
2.4%North Carolina:
3.2%
Most common occupations in Swannanoa, NC (%)
Both Males Females
Material recording, scheduling, dispatching, and distributing workers (5.3%)
Metal workers and plastic workers (4.5%)
Building and grounds cleaning and maintenance occupations (4.2%)
Electrical equipment mechanics and other installation, maintenance, and repair workers, including supervisors (4.1%)
Other production occupations, including supervisors (3.9%)
Driver/sales workers and truck drivers (3.8%)
Other office and administrative support workers, including supervisors (3.4%)
Material recording, scheduling, dispatching, and distributing workers (8.3%)
Driver/sales workers and truck drivers (7.4%)
Electrical equipment mechanics and other installation, maintenance, and repair workers, including supervisors (7.0%)
Metal workers and plastic workers (6.4%)
Building and grounds cleaning and maintenance occupations (5.8%)
Other production occupations, including supervisors (4.9%)
Construction traders workers except carpenters, electricians, painters, plumbers, and construction laborers (4.1%)
Assemblers and fabricators (5.0%)
Information and record clerks, except customer service representatives (4.9%)
Nursing, psychiatric, and home health aides (4.7%)
Other office and administrative support workers, including supervisors (4.2%)
Personal appearance workers (4.0%)
Health technologists and technicians (3.9%)
Customer service representatives (3.8%)
Air pollution and air quality trends(lower is better)
AQI Ozone PM2.5
Tornado activity:
Swannanoa-area historical tornado activity is below North Carolina state average. It is 39% smaller than the overall U.S. average.
On 5/5/1989, a category F4 (max. wind speeds 207-260 mph) tornado 40.3 miles away from the Swannanoa place center killed 2 people and injured 35 people and caused between $500,000 and $5,000,000 in damages.
On 5/5/1989, a category F4 tornado 46.4 miles away from the place center killed 4 people and injured 52 people and caused between $5,000,000 and $50,000,000 in damages.
Earthquake activity:
Swannanoa-area historical earthquake activity is significantly above North Carolina state average. It is 24% greater than the overall U.S. average. On 8/9/2020 at 12:07:37, a magnitude 5.1 (5.1 MW, Depth: 4.7 mi, Class: Moderate, Intensity: VI - VII) earthquake occurred 94.2 miles away from Swannanoa center On 8/23/2011 at 17:51:04, a magnitude 5.8 (5.8 MW, Depth: 3.7 mi) earthquake occurred 293.7 miles away from the city center On 8/2/1974 at 08:52:09, a magnitude 4.9 (4.3 MB, 4.9 LG, Class: Light, Intensity: IV - V) earthquake occurred 120.0 miles away from Swannanoa center On 11/30/1973 at 07:48:41, a magnitude 4.7 (4.7 MB, 4.6 ML) earthquake occurred 89.4 miles away from the city center On 7/27/1980 at 18:52:21, a magnitude 5.2 (5.1 MB, 4.7 MS, 5.0 UK, 5.2 UK) earthquake occurred 199.3 miles away from the city center On 4/29/2003 at 08:59:39, a magnitude 4.9 (4.4 MB, 4.6 MW, 4.9 LG) earthquake occurred 198.9 miles away from Swannanoa center Magnitude types: regional Lg-wave magnitude (LG), body-wave magnitude (MB), local magnitude (ML), surface-wave magnitude (MS), moment magnitude (MW) Natural disasters: The number of natural disasters in Buncombe County (11) is smaller than the US average (15).Major Disasters (Presidential) Declared: 8Emergencies Declared: 2Floods: 4, Hurricanes: 3, Storms: 3, Winter Storms: 2, Blizzard: 1, Landslide: 1, Mudslide: 1, Snowfall: 1, Tropical Storm: 1, Other: 1 (Note: some incidents may be assigned to more than one category). Hospitals and medical centers in Swannanoa: BLUE RIDGE HOMES-SWANNANOA (91 POPLAR CIRCLE) ASHEVILLE HEALTH CARE CENTER (1984 HIGHWAY 70)
SWANNANOA DIALYSIS CENTER (2305 US HIGHWAY 70)
College/University in Swannanoa: Warren Wilson College Full-time enrollment: 962; Location: 701 Warren Wilson Rd; Private, not-for-profit; Website: www.warren-wilson.edu; Offers Master's degree )
Colleges/universities with over 2000 students nearest to Swannanoa:
Asheville-Buncombe Technical Community College (about 10 miles; Asheville, NC ; Full-time enrollment: 6,992)
University of North Carolina at Asheville (about 11 miles; Asheville, NC ; FT enrollment: 3,312)
Isothermal Community College (about 33 miles; Spindale, NC ; FT enrollment: 2,165)
North Greenville University (about 38 miles; Tigerville, SC ; FT enrollment: 2,341)
Western Piedmont Community College (about 41 miles; Morganton, NC ; FT enrollment: 2,205)
Tusculum College (about 45 miles; Greeneville, TN ; FT enrollment: 2,070)
Western Carolina University (about 48 miles; Cullowhee, NC ; FT enrollment: 8,684)
Public high school in Swannanoa: COMMUNITY HIGH SCHOOL Location: 235 OLD US 70, Grades: 9-12)
Private high schools in Swannanoa: ASHEVILLE CHRISTIAN ACADEMY Students: 549, Location: 74 RIVERWOOD RD, Grades: PK-12)
SWANNANOA CHRISTIAN ACADEMY Students: 10, Location: 220 LYTLE COVE RD, Grades: 3-12)
HEIRBORNE CHRISTIAN ACADEMY Students: 4, Location: 50 OLD US 70, Grades: 8-11)
Public elementary/middle schools in Swannanoa:
See full list of schools located in Swannanoa User-submitted facts and corrections:
Medical Center Around Swannanoa: Family Care IMS(about 5 miles); http://www.familycaremed.com please link to our site thank you
Buncombe County has a predicted average indoor radon screening level greater than 4 pCi/L (pico curies per liter) - Highest Potential Average household size: This place:
2.4 peopleNorth Carolina:
2.5 people
Percentage of family households: This place:
64.5%Whole state:
66.7%
Percentage of households with unmarried partners: This place:
8.1%Whole state:
5.9%
Likely homosexual households (counted as self-reported same-sex unmarried-partner households)
Lesbian couples: 1.1% of all households Gay men: 0.5% of all households
People in group quarters in Swannanoa in 2010:
164 people in correctional residential facilities
47 people in correctional facilities intended for juveniles
35 people in other noninstitutional facilities
31 people in group homes intended for adults
4 people in group homes for juveniles (non-correctional)
people in training schools for juvenile delinquents in 2000people in homes for the mentally retarded in 2000Banks with branches in Swannanoa (2011 data):
Bank of America, National Association: Swannanoa Branch at 2323 Highway 70, branch established on 1965/08/20. Info updated 2009/11/18: Bank assets: $1,451,969.3 mil, Deposits: $1,077,176.8 mil, headquarters in Charlotte, NC, positive income , 5782 total offices , Holding Company: Bank Of America Corporation
For population 15 years and over in Swannanoa:
Never married: 35.3%Now married: 42.6%Separated: 2.8%Widowed: 4.6%Divorced: 14.6% For population 25 years and over in Swannanoa:
High school or higher: 85.7%Bachelor's degree or higher: 26.3%Graduate or professional degree: 6.8%Unemployed: 3.2%Mean travel time to work (commute): 18.8 minutes
Education Gini index (Inequality in education) Here:
13.9North Carolina average:
11.7
Religion statistics for Swannanoa, NC (based on Buncombe County data)
Religion Adherents Congregations Evangelical Protestant 82,696 245 Mainline Protestant 23,724 90 Catholic 8,832 5 Other 4,668 26 Black Protestant 2,019 13 Orthodox 444 3 None 115,753 -
Source: Clifford Grammich, Kirk Hadaway, Richard Houseal, Dale E.Jones, Alexei Krindatch, Richie Stanley and Richard H.Taylor. 2012. 2010 U.S.Religion Census: Religious Congregations & Membership Study. Association of Statisticians of American Religious Bodies. Jones, Dale E., et al. 2002. Congregations and Membership in the United States 2000. Nashville, TN: Glenmary Research Center. Graphs represent county-level data
Food Environment Statistics: Number of grocery stores : 49Buncombe County :
2.16 / 10,000 pop.North Carolina :
2.05 / 10,000 pop.
Number of supercenters and club stores : 1Here :
0.04 / 10,000 pop.North Carolina :
0.14 / 10,000 pop.
Number of convenience stores (no gas) : 21Buncombe County :
0.93 / 10,000 pop.State :
0.92 / 10,000 pop.
Number of convenience stores (with gas) : 111Buncombe County :
4.90 / 10,000 pop.North Carolina :
4.75 / 10,000 pop.
Number of full-service restaurants : 240Buncombe County :
10.60 / 10,000 pop.North Carolina :
7.57 / 10,000 pop.
Adult diabetes rate : This county :
8.7%North Carolina :
9.8%
Adult obesity rate : Here :
21.2%North Carolina :
28.3%
Low-income preschool obesity rate : This county :
15.3%North Carolina :
15.6%
Health and Nutrition: Healthy diet rate : This city:
47.2%State:
48.9%
Average overall health of teeth and gums : Average BMI : This city:
28.9North Carolina:
28.8
People feeling badly about themselves : Swannanoa:
23.2%North Carolina:
20.7%
People not drinking alcohol at all : Swannanoa:
11.5%State:
10.7%
Average hours sleeping at night : Swannanoa:
6.8North Carolina:
6.8
Overweight people : Swannanoa:
34.6%North Carolina:
33.7%
General health condition : Swannanoa:
52.9%North Carolina:
55.8%
Average condition of hearing : This city:
76.4%State:
79.7%
More about Health and Nutrition of Swannanoa, NC Residents
Businesses in Swannanoa, NC
Name Count Name Count
Ace Hardware 1 Subway 1 Burger King 1 U-Haul 2 FedEx 1 U.S. Cellular 1 Goodwill 1
Strongest AM radio stations in Swannanoa:
WFGW (1010 AM; 50 kW; BLACK MOUNTAIN, NC; Owner: BLUE RIDGE BROADCASTING CORP.)
WWRN (1350 AM; 10 kW; BLACK MOUNTAIN, NC; Owner: BLACK MOUNTAIN BROADCASTING CORP.)
WPEK (880 AM; daytime; 5 kW; FAIRVIEW, NC; Owner: CLEAR CHANNEL BROADCASTING LICENSES, INC.)
WKJV (1380 AM; 25 kW; ASHEVILLE, NC; Owner: INTERNATIONAL BAPTIST OUTREACH MISSIONS)
WWNC (570 AM; 5 kW; ASHEVILLE, NC; Owner: CAPSTAR TX LIMITED PARTNERSHIP)
WISE (1310 AM; 5 kW; ASHEVILLE, NC; Owner: ASHVILLE RADIO PARTNERS, LLC)
WLFJ (660 AM; daytime; 50 kW; GREENVILLE, SC; Owner: CLEAR CHANNEL BROADCASTING LICENSES, INC.)
WCSZ (1070 AM; 50 kW; SANS SOUCI, SC; Owner: WHYZ RADIO, L.P.)
WGCR (720 AM; daytime; 10 kW; PISGAH FOREST, NC; Owner: ANCHOR BAPTIST BROADCASTING ASSOCIATION)
WJFJ (1160 AM; 10 kW; TRYON, NC; Owner: COLUMBUS BROADCAST CORPORATION, INC.)
WWOL (780 AM; daytime; 10 kW; FOREST CITY, NC; Owner: HOLLY SPRINGS BAPTIST BROADCASTING CO., INC.)
WHKY (1290 AM; 50 kW; HICKORY, NC; Owner: LONG COMMUNICATIONS, LLC.)
WBRM (1250 AM; 5 kW; MARION, NC; Owner: WBRM, INC.)
Strongest FM radio stations in Swannanoa:
WMIT (106.9 FM; BLACK MOUNTAIN, NC; Owner: BLUE RIDGE BROADCASTING CORPORATION)
WNCW (88.7 FM; SPINDALE, NC; Owner: ISOTHERMAL COMMUNITY COLLEGE)
WQNQ (104.3 FM; OLD FORT, NC; Owner: CLEAR CHANNEL BROADCASTING LICENSES, INC.)
W249AR (97.7 FM; ASHEVILLE, NC; Owner: ENTERCOM GREENVILLE LICENSE, LLC)
WKSF (99.9 FM; ASHEVILLE, NC; Owner: CAPSTAR TX LIMITED PARTNERSHIP)
WCQS (88.1 FM; ASHEVILLE, NC; Owner: WESTERN NORTH CAROLINA PUBLIC RADIO)
WTPT (93.3 FM; FOREST CITY, NC; Owner: UPSTATE BROADCASTING, LLC)
W220CD (91.9 FM; ENKA, NC; Owner: CALVARY CHAPEL OF TWIN FALLS, INC.)
WLFA (91.3 FM; ASHEVILLE, NC; Owner: ASHEVILLE EDUCATIONAL ASSOCIATION, INC.)
WMYI (102.5 FM; HENDERSONVILLE, NC; Owner: CAPSTAR TX LIMITED PARTNERSHIP)
WSPA-FM (98.9 FM; SPARTANBURG, SC; Owner: ENTERCOM GREENVILLE LICENSE, LLC)
WFBC-FM (93.7 FM; GREENVILLE, SC; Owner: ENTERCOM GREENVILLE LICENSE, LLC)
WESC-FM (92.5 FM; GREENVILLE, SC; Owner: CLEAR CHANNEL BROADCASTING LICENSES, INC.)
WQNS (104.9 FM; WAYNESVILLE, NC; Owner: CLEAR CHANNEL BROADCASTING LICENSES, INC.)
W237AR (95.3 FM; HAZELWOOD, ETC., NC; Owner: WESTERN NORTH CAROLINA PUBLIC RADIO)
W292CJ (106.3 FM; ASHEVILLE, NC; Owner: BLUE RIDGE BROADCASTING CORP.)
W218AD (91.5 FM; BREVARD, NC; Owner: WESTERN NORTH CAROLINA PUBLIC RADIO)
WAGI-FM (105.3 FM; GAFFNEY, SC; Owner: GAFFNEY BROADCASTING, INC.)
WECR-FM (102.3 FM; BEECH MOUNTAIN, NC; Owner: RONDINARO BROADCASTING, INC)
WHCB (91.5 FM; BRISTOL, TN; Owner: APPALACHIAN EDUC. COMMUNICATION CORP)
TV broadcast stations around Swannanoa:
WASV-TV (Channel 62; ASHEVILLE, NC; Owner: MEDIA GENERAL BROADCASTING OF SOUTH CAROLINA HOLDINGS, INC.)
W52BA (Channel 52; BLACK MOUNTAIN, NC; Owner: UNIVERSITY OF NORTH CAROLINA)
W35AV (Channel 35; BLACK MOUNTAIN, NC; Owner: MEREDITH CORPORATION)
WAEN-LP (Channel 64; ASHEVILLE, NC; Owner: ASHEVILLE MEDIA GROUP, L.L.C.)
WHNS (Channel 21; ASHEVILLE, NC; Owner: MEREDITH CORPORATION)
W14AS (Channel 14; WEST ASHEVILLE, NC; Owner: MEREDITH CORPORATION)
W12AQ (Channel 12; BLACK MOUNTAIN, NC; Owner: WLOS LICENSEE, LLC)
W10AD (Channel 10; MONTREAT, ETC., NC; Owner: MEDIA GENERAL BROADCASTING OF SO. CAROLINA HOLDINGS, INC.)
WYFF (Channel 4; GREENVILLE, SC; Owner: WYFF HEARST-ARGYLE TELEVISION, INC.)
W23BQ (Channel 23; ASHEVILLE, ETC., NC; Owner: CAROLINA CHRISTIAN BROADCASTING, INC.)
W51CK (Channel 51; TALBERT, KY; Owner: MS COMMUNICATIONS, LLC)
W06AL (Channel 6; OTEEN/WARREN, NC; Owner: WLOS LICENSEE, LLC)
W08BP (Channel 8; BEAVER DAM, NC; Owner: MEDIA GENERAL BROADCASTING OF SO. CAROLINA HOLDINGS, INC.)
WLOS (Channel 13; ASHEVILLE, NC; Owner: WLOS LICENSEE, LLC)
W27AX (Channel 27; LAKE LURE, NC; Owner: UNIVERSITY OF NORTH CAROLINA)
Swannanoa fatal accident statistics for 1975 - 2021
Swannanoa fatal accident list:
Aug 19, 2018 09:38 PM, Us-70 Black Mtn Hwy, Lat: 35.602600, Lon: -82.396061, Vehicles: 1, Persons: 1, Fatalities: 1, Drunk persons involved: 1Lat: 35.595542, Lon: -82.400272, Vehicles: 1, Persons: 1, Fatalities: 1, Drunk persons involved: 1Lat: 35.596530, Lon: -82.403210, Vehicles: 2, Persons: 2, Fatalities: 1, Drunk persons involved: 1Lat: 35.604950, Lon: -82.398210, Vehicles: 3, Persons: 3, Fatalities: 1Lat: 35.596210, Lon: -82.398210, Vehicles: 2, Persons: 2, Fatalities: 1, Drunk persons involved: 1Lat: 35.595054, Lon: -82.415784, Vehicles: 1, Persons: 2, Pedestrians: 1, Fatalities: 1, Drunk persons involved: 1
National Bridge Inventory (NBI) Statistics 24 Number of bridges200ft / 61.3m Total length147,160 Total average daily traffic19,596 Total average daily truck traffic
New bridges - historical statistics
1 1920-1929 1 1940-1949 1 1950-1959 3 1960-1969 12 1970-1979 2 1980-1989 1 2000-2009 2 2010-2019 1 2020-2022
See full National Bridge Inventory statistics for Swannanoa, NC
FCC Registered Cell Phone Towers: 1 (
See the full list of FCC Registered Cell Phone Towers in Swannanoa )
FCC Registered Antenna Towers: 22 (
See the full list of FCC Registered Antenna Towers )
FCC Registered Broadcast Land Mobile Towers: 7
Whitson Ave (Lat: 35.507889 Lon: -82.396222), Call Sign: KVT783, Licensee ID: L00122051, Assigned Frequencies: 45.3600 MHz, 45.4800 MHz, 45.3200 MHz, Grant Date: 08/28/2014, Expiration Date: 10/30/2024, Registrant: County Of Buncombe, 164 Erwin Hills Road, Asheville, NC 28806, Phone: (828) 250-6600, Fax: (828) 250-6609, Email:
202 Whitson Ave (Lat: 35.599556 Lon: -82.395389), Call Sign: KBU267, Assigned Frequencies: 35.0600 MHz, Grant Date: 11/13/1996, Expiration Date: 01/14/2002, Cancellation Date: 05/05/2002, Registrant: Beacon Mfg Co, 202 Whitson Ave, Swannanoa, NC 28778, Phone: (704) 686-3861 Old Us 70 1 Mi W Of Black Mountain (Lat: 35.525111 Lon: -82.416500), Call Sign: KGO648, Assigned Frequencies: 152.870 MHz, Grant Date: 12/04/1996, Expiration Date: 12/23/2001, Cancellation Date: 05/05/2002, Registrant: B V Hedrick Gravel & Sand Co Inc, Box 425, Swannanoa, NC 28778 Lat: 35.597889 Lon: -82.399833, Call Sign: WPYQ724, Assigned Frequencies: 451.237 MHz, 451.312 MHz, 451.337 MHz, 451.387 MHz, 452.887 MHz, Grant Date: 09/30/2003, Expiration Date: 09/30/2013, Cancellation Date: 11/30/2013, Certifier: Brandon Langford, Registrant: Amta, 200 North Glebe Rd. #1000, Arlington, VA 22203, Phone: (703) 276-1100, Fax: (703) 558-0523, Email:
Swannanoa, Sr 2500 Rr Crossing @ Rr Mp S126.55 (Lat: 35.609444 Lon: -82.340833), Type: Bant, Structure height: 2.8 m, Overall height: 3 m, Call Sign: WQHB943, Licensee ID: L00008014, Assigned Frequencies: 161.475 MHz, Grant Date: 03/29/2017, Expiration Date: 06/25/2027, Certifier: Jerry R Celio, Registrant: Norfolk Southern Railway Company, 650 West Peachtree St, Nw, Box 41, Atlanta, GA 30308, Phone: (404) 660-4050, Fax: (404) 582-6209, Email:
741 Old Us 70 Hwy (Lat: 35.611750 Lon: -82.374806), Type: Mast, Structure height: 21 m, Overall height: 23 m, Call Sign: WQHX730, Assigned Frequencies: 158.730 MHz, 42.5600 MHz, Grant Date: 11/01/2017, Expiration Date: 11/28/2027, Certifier: Michael D Williams, Registrant: Nc Department Of Public Safety, 200 Leagan Drive, Raleigh, NC 27603, Phone: (919) 662-4700, Email:
Lat: 35.611472 Lon: -82.429806, Call Sign: WRPC383, Assigned Frequencies: 451.487 MHz, 451.637 MHz, 456.487 MHz, 456.637 MHz, 462.512 MHz, Grant Date: 01/15/2022, Expiration Date: 01/15/2032, Certifier: Donnie Owensby, Registrant: Mobile Communications Of America, 216 Haywood St, Asheville, NC 28801, Phone: (828) 785-9949, Email:
FCC Registered Microwave Towers: 5
SWANNANOA VALLEY, 1 Mi W Of (Lat: 35.600667 Lon: -82.417333), Type: Tower, Structure height: 54.9 m, Overall height: 59.4 m, Call Sign: WMT892, Assigned Frequencies: 6615.00 MHz, Grant Date: 12/28/2010, Expiration Date: 02/01/2021, Cancellation Date: 04/27/2015, Certifier: Steven T Campbell, Registrant: Holland & Knight LLP, 800 17th Street, N.W., Suite #1100, Washington, DC 20006-3906, Phone: (202) 955-3000, Fax: (202) 955-5564, Email:
SWANNANOA NC, 650 Us Hwy 70 (021570) (Lat: 35.597417 Lon: -82.371278), Type: Tower, Structure height: 60.1 m, Overall height: 60.7 m, Call Sign: WQIT330, Assigned Frequencies: 6004.50 MHz, 10995.0 MHz, Grant Date: 05/07/2008, Expiration Date: 05/07/2018, Cancellation Date: 11/07/2009, Certifier: William Chastain, Registrant: Radio Dynamics Corporation, Silver Spring, MD 20914, Phone: (301) 493-5171, Fax: (301) 576-4553, Email:
Swannonoa, 50-T Sassafras Valley Rd. (Lat: 35.617056 Lon: -82.393667), Type: Gtower, Structure height: 54.9 m, Call Sign: WQQF335, Assigned Frequencies: 11305.0 MHz, 17815.0 MHz, 11305.0 MHz, 17815.0 MHz, 11305.0 MHz, 17815.0 MHz, 11305.0 MHz, 17815.0 MHz, 11305.0 MHz, 17815.0 MHz... (+7 more), Grant Date: 08/30/2022, Expiration Date: 11/26/2032, Certifier: Bryan Dillingham, Registrant: Buncombe County Government, 59 Woodfin Place, Asheville, NC 28801, Phone: (828) 250-6833, Email:
SWANNANOA FD, 103 South Ave (Lat: 35.598556 Lon: -82.396389), Type: Building, Structure height: 9.1 m, Call Sign: WQWR553, Licensee ID: L00122051, Assigned Frequencies: 19375.0 MHz, 19375.0 MHz, 19375.0 MHz, 19375.0 MHz, 19375.0 MHz, 21875.0 MHz, 21875.0 MHz, 21875.0 MHz, 21875.0 MHz, 21875.0 MHz, 21875.0 MHz, Grant Date: 10/29/2015, Expiration Date: 10/29/2025, Certifier: Bryan Dillingham, Registrant: Buncombe County, 59 Woodfin Place Suite 200, Ashville, NC 28801, Phone: (828) 250-6800, Email:
KNAVL00152A, 58t Lee Rd (Lat: 35.600444 Lon: -82.417639), Type: Mast, Structure height: 54.9 m, Call Sign: WRXI700, Assigned Frequencies: 10775.0 MHz, 10775.0 MHz, 10775.0 MHz, 10775.0 MHz, 10775.0 MHz, 10775.0 MHz, 10775.0 MHz, 10775.0 MHz, 10775.0 MHz, 10775.0 MHz, 10775.0 MHz, 10775.0 MHz, Grant Date: 05/16/2023, Expiration Date: 05/16/2033, Certifier: Alison A Minea, Registrant: Dish Wireless L.L.C., 9601 S Meridan Blvd, Englewood, CO 80112, Phone: (202) 463-3709, Email:
FCC Registered Amateur Radio Licenses: 69 (
See the full list of FCC Registered Amateur Radio Licenses in Swannanoa )
FAA Registered Aircraft: 5
Aircraft: BEECH 95-B55 (T42A) (Category: Land, Engines: 2, Seats: 6, Weight: Up to 12,499 Pounds, Speed: 165 mph), Engine: CONT MOTOR I0-470 SERIES (260 HP) (Reciprocating)N-Number: 152BG, N152BG, N-152BG, Serial Number: TC-2015, Year manufactured: 1976, Airworthiness Date: 11/08/1976, Certificate Issue Date: 07/25/2006Registrant (Corporation): Blossman Gas Of North Carolina Inc, 2091 Us 70 Hwy, Swannanoa, NC 28778Aircraft: RAYTHEON AIRCRAFT COMPANY B300 (Category: Land, Engines: 2, Seats: 19, Weight: 12,500 - 19,999 Pounds), Engine: Turbo-propN-Number: 160AC, N160AC, N-160AC, Serial Number: FL-367, Certificate Issue Date: 08/22/2019Registrant (Corporation): Blossman Gas Of North Carolina Inc, 2091 Us 70 Hwy, Swannanoa, NC 28778Aircraft: CESSNA 170B (Category: Land, Seats: 4, Weight: Up to 12,499 Pounds, Speed: 105 mph), Engine: CONT MOTOR C145 SERIES (145 HP) (Reciprocating)N-Number: 2554C, N2554C, N-2554C, Serial Number: 26198, Airworthiness Date: 01/13/1956, Certificate Issue Date: 12/06/2018Registrant (Individual): Wilbur B Ward, 156 Mountain Crest Rd, Swannanoa, NC 28778Deregistered: Cancel Date: 10/18/2012Aircraft: CESSNA 525 (Category: Land, Engines: 2, Seats: 8, Weight: Up to 12,499 Pounds), Engine: WILLIAMS FJ 44 SERIES (1900 Pounds of Thrust) (Turbo-fan)N-Number: 256JB, N256JB, N-256JB, Serial Number: 525-0284, Year manufactured: 1998, Airworthiness Date: 11/08/1998, Certificate Issue Date: 08/11/2014Registrant (Corporation): Blossman Gas Of North Carolina Inc, 2091 Us 70 Hwy, Swannanoa, NC 28778Aircraft: BEECH B200 (Category: Land, Engines: 2, Seats: 11, Weight: 12,500 - 19,999 Pounds), Engine: P&W CANADA PT6A-60A (1050 HP) (Turbo-prop)N-Number: 151BG, N151BG, N-151BG, Serial Number: BB-1381, Year manufactured: 1990, Airworthiness Date: 09/06/1990, Certificate Issue Date: 05/15/2006Registrant (Corporation): Blossman Gas Of North Carolina Inc, 2091 Us 70 Hwy, Swannanoa, NC 28778
Home Mortgage Disclosure Act Aggregated Statistics For Year 2009(Based on 1 partial tract) A) FHA, FSA/RHS & VA B) Conventional C) Refinancings D) Home Improvement Loans F) Non-occupant Loans on G) Loans On Manufactured Number Average Value Number Average Value Number Average Value Number Average Value Number Average Value Number Average Value
LOANS ORIGINATED 5 $157,484 10 $156,709 40 $163,660 1 $57,460 4 $238,310 1 $535,560 APPLICATIONS APPROVED, NOT ACCEPTED 0 $0 1 $251,260 1 $138,430 0 $0 1 $174,150 1 $36,910 APPLICATIONS DENIED 1 $125,630 1 $90,200 17 $147,817 1 $60,430 1 $243,820 1 $119,970 APPLICATIONS WITHDRAWN 1 $189,340 2 $195,140 13 $142,575 1 $15,180 0 $0 1 $81,870 FILES CLOSED FOR INCOMPLETENESS 0 $0 0 $0 2 $210,770 0 $0 0 $0 0 $0
Aggregated Statistics For Year 2008(Based on 1 partial tract) A) FHA, FSA/RHS & VA B) Conventional C) Refinancings D) Home Improvement Loans F) Non-occupant Loans on G) Loans On Manufactured Number Average Value Number Average Value Number Average Value Number Average Value Number Average Value Number Average Value
LOANS ORIGINATED 4 $145,055 18 $167,903 38 $145,991 2 $60,580 10 $155,667 4 $91,245 APPLICATIONS APPROVED, NOT ACCEPTED 1 $118,190 2 $145,280 3 $166,017 0 $0 1 $205,710 1 $69,960 APPLICATIONS DENIED 0 $0 3 $111,140 19 $144,666 3 $88,417 2 $167,905 4 $78,072 APPLICATIONS WITHDRAWN 1 $221,790 3 $189,537 12 $133,742 1 $107,170 1 $158,670 2 $102,705 FILES CLOSED FOR INCOMPLETENESS 0 $0 0 $0 4 $156,590 0 $0 0 $0 0 $0
Aggregated Statistics For Year 2007(Based on 1 partial tract) A) FHA, FSA/RHS & VA B) Conventional C) Refinancings D) Home Improvement Loans E) Loans on Dwellings For 5+ Families F) Non-occupant Loans on G) Loans On Manufactured Number Average Value Number Average Value Number Average Value Number Average Value Number Average Value Number Average Value Number Average Value
LOANS ORIGINATED 0 $0 35 $145,388 39 $144,224 3 $55,373 1 $186,060 12 $162,792 4 $77,848 APPLICATIONS APPROVED, NOT ACCEPTED 0 $0 4 $157,855 9 $123,116 1 $27,390 0 $0 3 $141,607 1 $96,160 APPLICATIONS DENIED 1 $110,740 8 $146,469 30 $139,929 4 $26,792 0 $0 2 $273,585 5 $78,950 APPLICATIONS WITHDRAWN 1 $66,090 3 $163,140 9 $158,641 1 $45,550 0 $0 2 $118,930 1 $44,950 FILES CLOSED FOR INCOMPLETENESS 0 $0 0 $0 3 $137,737 0 $0 0 $0 0 $0 0 $0
Aggregated Statistics For Year 2006(Based on 1 partial tract) A) FHA, FSA/RHS & VA B) Conventional C) Refinancings D) Home Improvement Loans F) Non-occupant Loans on G) Loans On Manufactured Number Average Value Number Average Value Number Average Value Number Average Value Number Average Value Number Average Value
LOANS ORIGINATED 2 $153,465 54 $128,832 33 $140,090 6 $37,957 17 $126,890 4 $92,958 APPLICATIONS APPROVED, NOT ACCEPTED 1 $42,270 10 $99,521 5 $131,584 1 $23,820 3 $138,630 3 $86,433 APPLICATIONS DENIED 1 $68,170 15 $90,878 20 $113,810 3 $56,563 2 $138,875 9 $66,684 APPLICATIONS WITHDRAWN 0 $0 7 $130,520 13 $126,522 1 $33,640 1 $93,780 1 $104,490 FILES CLOSED FOR INCOMPLETENESS 0 $0 1 $104,490 4 $129,275 0 $0 0 $0 1 $46,140
Aggregated Statistics For Year 2005(Based on 1 partial tract) A) FHA, FSA/RHS & VA B) Conventional C) Refinancings D) Home Improvement Loans F) Non-occupant Loans on G) Loans On Manufactured Number Average Value Number Average Value Number Average Value Number Average Value Number Average Value Number Average Value
LOANS ORIGINATED 1 $103,000 54 $134,009 36 $111,861 5 $37,570 16 $131,081 7 $79,019 APPLICATIONS APPROVED, NOT ACCEPTED 0 $0 7 $109,894 14 $114,061 1 $41,380 1 $217,320 2 $63,855 APPLICATIONS DENIED 1 $136,050 12 $100,523 23 $108,415 4 $37,660 2 $101,665 8 $62,108 APPLICATIONS WITHDRAWN 0 $0 6 $109,702 21 $128,025 2 $196,035 2 $91,395 3 $72,837 FILES CLOSED FOR INCOMPLETENESS 0 $0 1 $63,110 4 $110,222 0 $0 0 $0 0 $0
Aggregated Statistics For Year 2004(Based on 1 partial tract) A) FHA, FSA/RHS & VA B) Conventional C) Refinancings D) Home Improvement Loans F) Non-occupant Loans on G) Loans On Manufactured Number Average Value Number Average Value Number Average Value Number Average Value Number Average Value Number Average Value
LOANS ORIGINATED 1 $83,950 38 $115,179 40 $103,369 3 $36,617 11 $86,955 4 $79,858 APPLICATIONS APPROVED, NOT ACCEPTED 0 $0 10 $66,595 9 $118,650 1 $128,900 2 $69,215 6 $56,662 APPLICATIONS DENIED 1 $84,250 13 $96,112 25 $104,040 3 $40,487 3 $98,737 9 $57,556 APPLICATIONS WITHDRAWN 0 $0 6 $115,358 15 $130,651 1 $19,350 1 $183,380 2 $77,700 FILES CLOSED FOR INCOMPLETENESS 0 $0 1 $109,850 1 $184,870 0 $0 0 $0 0 $0
Aggregated Statistics For Year 2003(Based on 1 partial tract) A) FHA, FSA/RHS & VA B) Conventional C) Refinancings D) Home Improvement Loans F) Non-occupant Loans on Number Average Value Number Average Value Number Average Value Number Average Value Number Average Value
LOANS ORIGINATED 1 $75,620 31 $114,922 77 $100,151 3 $36,220 9 $98,076 APPLICATIONS APPROVED, NOT ACCEPTED 1 $13,400 8 $61,066 11 $85,711 1 $15,480 0 $0 APPLICATIONS DENIED 0 $0 14 $53,501 30 $98,985 3 $21,137 2 $52,545 APPLICATIONS WITHDRAWN 0 $0 1 $206,010 11 $106,252 0 $0 1 $134,560 FILES CLOSED FOR INCOMPLETENESS 0 $0 0 $0 2 $93,180 0 $0 0 $0
Aggregated Statistics For Year 2002(Based on 1 partial tract) A) FHA, FSA/RHS & VA B) Conventional C) Refinancings D) Home Improvement Loans F) Non-occupant Loans on Number Average Value Number Average Value Number Average Value Number Average Value Number Average Value
LOANS ORIGINATED 1 $161,350 30 $92,853 55 $99,194 1 $10,720 9 $101,218 APPLICATIONS APPROVED, NOT ACCEPTED 0 $0 8 $58,981 9 $87,821 0 $0 0 $0 APPLICATIONS DENIED 0 $0 15 $47,612 35 $81,935 3 $23,420 1 $58,650 APPLICATIONS WITHDRAWN 0 $0 3 $92,683 11 $85,169 0 $0 1 $102,110 FILES CLOSED FOR INCOMPLETENESS 0 $0 1 $124,740 2 $94,370 0 $0 0 $0
Aggregated Statistics For Year 2001(Based on 1 partial tract) A) FHA, FSA/RHS & VA B) Conventional C) Refinancings D) Home Improvement Loans E) Loans on Dwellings For 5+ Families F) Non-occupant Loans on Number Average Value Number Average Value Number Average Value Number Average Value Number Average Value Number Average Value
LOANS ORIGINATED 2 $122,650 28 $93,371 46 $89,303 3 $12,900 1 $38,400 5 $89,132 APPLICATIONS APPROVED, NOT ACCEPTED 0 $0 7 $38,361 11 $78,539 1 $44,660 0 $0 1 $69,360 APPLICATIONS DENIED 0 $0 20 $49,656 27 $71,856 3 $31,853 0 $0 2 $56,115 APPLICATIONS WITHDRAWN 0 $0 1 $127,120 10 $77,462 1 $5,060 0 $0 0 $0 FILES CLOSED FOR INCOMPLETENESS 0 $0 0 $0 3 $79,287 0 $0 0 $0 0 $0
Aggregated Statistics For Year 2000(Based on 1 partial tract) A) FHA, FSA/RHS & VA B) Conventional C) Refinancings D) Home Improvement Loans F) Non-occupant Loans on Number Average Value Number Average Value Number Average Value Number Average Value Number Average Value
LOANS ORIGINATED 2 $87,675 30 $75,814 19 $74,738 2 $16,520 7 $70,980 APPLICATIONS APPROVED, NOT ACCEPTED 2 $43,465 9 $43,894 6 $89,807 0 $0 0 $0 APPLICATIONS DENIED 1 $61,620 30 $37,689 20 $67,220 1 $47,330 2 $78,445 APPLICATIONS WITHDRAWN 1 $72,040 3 $72,143 9 $59,374 1 $10,420 1 $13,690 FILES CLOSED FOR INCOMPLETENESS 0 $0 1 $143,190 1 $56,270 0 $0 0 $0
Aggregated Statistics For Year 1999(Based on 1 partial tract) A) FHA, FSA/RHS & VA B) Conventional C) Refinancings D) Home Improvement Loans F) Non-occupant Loans on Number Average Value Number Average Value Number Average Value Number Average Value Number Average Value
LOANS ORIGINATED 2 $80,640 28 $145,921 30 $73,624 2 $33,515 4 $175,620 APPLICATIONS APPROVED, NOT ACCEPTED 0 $0 13 $52,416 18 $63,077 1 $18,730 2 $42,735 APPLICATIONS DENIED 0 $0 40 $43,327 25 $66,747 2 $21,075 4 $51,955 APPLICATIONS WITHDRAWN 0 $0 3 $73,957 7 $78,444 2 $29,125 1 $50,050 FILES CLOSED FOR INCOMPLETENESS 0 $0 1 $64,390 3 $88,200 0 $0 0 $0
Detailed HMDA statistics for the following Tracts:
0030.02
Private Mortgage Insurance Companies Aggregated Statistics For Year 2009(Based on 1 partial tract) A) Conventional B) Refinancings Number Average Value Number Average Value
LOANS ORIGINATED 1 $318,540 1 $122,350 APPLICATIONS APPROVED, NOT ACCEPTED 0 $0 0 $0 APPLICATIONS DENIED 0 $0 0 $0 APPLICATIONS WITHDRAWN 0 $0 0 $0 FILES CLOSED FOR INCOMPLETENESS 0 $0 0 $0
Aggregated Statistics For Year 2008(Based on 1 partial tract) A) Conventional B) Refinancings Number Average Value Number Average Value
LOANS ORIGINATED 3 $146,567 2 $130,990 APPLICATIONS APPROVED, NOT ACCEPTED 1 $189,930 0 $0 APPLICATIONS DENIED 0 $0 0 $0 APPLICATIONS WITHDRAWN 0 $0 0 $0 FILES CLOSED FOR INCOMPLETENESS 0 $0 0 $0
Aggregated Statistics For Year 2007(Based on 1 partial tract) A) Conventional B) Refinancings C) Non-occupant Loans on Number Average Value Number Average Value Number Average Value
LOANS ORIGINATED 10 $163,378 4 $150,265 1 $105,390 APPLICATIONS APPROVED, NOT ACCEPTED 2 $137,535 1 $93,180 0 $0 APPLICATIONS DENIED 0 $0 0 $0 0 $0 APPLICATIONS WITHDRAWN 1 $73,230 0 $0 0 $0 FILES CLOSED FOR INCOMPLETENESS 0 $0 0 $0 0 $0
Aggregated Statistics For Year 2006(Based on 1 partial tract) A) Conventional B) Refinancings C) Non-occupant Loans on D) Loans On Manufactured Number Average Value Number Average Value Number Average Value Number Average Value
LOANS ORIGINATED 10 $145,665 1 $301,570 1 $176,540 1 $67,580 APPLICATIONS APPROVED, NOT ACCEPTED 1 $98,840 0 $0 0 $0 0 $0 APPLICATIONS DENIED 1 $62,520 0 $0 0 $0 0 $0 APPLICATIONS WITHDRAWN 0 $0 1 $161,350 0 $0 0 $0 FILES CLOSED FOR INCOMPLETENESS 0 $0 0 $0 0 $0 0 $0
Aggregated Statistics For Year 2005(Based on 1 partial tract) A) Conventional B) Refinancings C) Non-occupant Loans on Number Average Value Number Average Value Number Average Value
LOANS ORIGINATED 9 $129,930 2 $122,055 2 $116,250 APPLICATIONS APPROVED, NOT ACCEPTED 1 $207,790 1 $81,870 0 $0 APPLICATIONS DENIED 0 $0 0 $0 0 $0 APPLICATIONS WITHDRAWN 1 $124,140 0 $0 0 $0 FILES CLOSED FOR INCOMPLETENESS 0 $0 0 $0 0 $0
Aggregated Statistics For Year 2004(Based on 1 partial tract) A) Conventional B) Refinancings Number Average Value Number Average Value
LOANS ORIGINATED 7 $111,553 4 $116,550 APPLICATIONS APPROVED, NOT ACCEPTED 0 $0 1 $87,230 APPLICATIONS DENIED 0 $0 0 $0 APPLICATIONS WITHDRAWN 1 $114,610 0 $0 FILES CLOSED FOR INCOMPLETENESS 0 $0 0 $0
Aggregated Statistics For Year 2003(Based on 1 partial tract) A) Conventional B) Refinancings C) Non-occupant Loans on Number Average Value Number Average Value Number Average Value
LOANS ORIGINATED 9 $116,599 10 $119,348 1 $114,320 APPLICATIONS APPROVED, NOT ACCEPTED 0 $0 0 $0 0 $0 APPLICATIONS DENIED 1 $54,780 0 $0 0 $0 APPLICATIONS WITHDRAWN 0 $0 0 $0 0 $0 FILES CLOSED FOR INCOMPLETENESS 0 $0 0 $0 0 $0
Aggregated Statistics For Year 2002(Based on 1 partial tract) A) Conventional B) Refinancings C) Non-occupant Loans on Number Average Value Number Average Value Number Average Value
LOANS ORIGINATED 7 $116,741 7 $100,283 0 $0 APPLICATIONS APPROVED, NOT ACCEPTED 2 $115,655 2 $147,360 1 $117,000 APPLICATIONS DENIED 0 $0 1 $100,320 0 $0 APPLICATIONS WITHDRAWN 0 $0 0 $0 0 $0 FILES CLOSED FOR INCOMPLETENESS 0 $0 0 $0 0 $0
Aggregated Statistics For Year 2001(Based on 1 partial tract) A) Conventional B) Refinancings Number Average Value Number Average Value
LOANS ORIGINATED 9 $118,683 5 $101,872 APPLICATIONS APPROVED, NOT ACCEPTED 1 $63,710 1 $106,870 APPLICATIONS DENIED 0 $0 0 $0 APPLICATIONS WITHDRAWN 1 $72,640 0 $0 FILES CLOSED FOR INCOMPLETENESS 0 $0 0 $0
Aggregated Statistics For Year 2000(Based on 1 partial tract) A) Conventional B) Refinancings C) Non-occupant Loans on Number Average Value Number Average Value Number Average Value
LOANS ORIGINATED 6 $92,337 1 $129,200 1 $77,100 APPLICATIONS APPROVED, NOT ACCEPTED 0 $0 1 $147,960 0 $0 APPLICATIONS DENIED 0 $0 1 $57,750 0 $0 APPLICATIONS WITHDRAWN 0 $0 0 $0 0 $0 FILES CLOSED FOR INCOMPLETENESS 0 $0 0 $0 0 $0
Aggregated Statistics For Year 1999(Based on 1 partial tract) A) Conventional B) Refinancings Number Average Value Number Average Value
LOANS ORIGINATED 4 $111,592 2 $117,375 APPLICATIONS APPROVED, NOT ACCEPTED 0 $0 2 $92,200 APPLICATIONS DENIED 0 $0 0 $0 APPLICATIONS WITHDRAWN 0 $0 0 $0 FILES CLOSED FOR INCOMPLETENESS 0 $0 0 $0
Detailed PMIC statistics for the following Tracts:
0030.02
Most common first names in Swannanoa, NC among deceased individuals Name Count Lived (average)
William 80 76.5 years James 67 73.6 years John 63 77.1 years Mary 55 76.7 years Robert 28 69.6 years Charles 27 76.2 years Helen 23 77.5 years George 22 74.9 years Margaret 20 76.2 years Betty 19 74.1 years
Most common last names in Swannanoa, NC among deceased individuals Last name Count Lived (average)
Davis 22 73.6 years Mcmahan 22 75.6 years Allen 21 74.1 years Hall 20 75.2 years Jones 18 74.3 years Patton 17 71.0 years Wilson 17 78.7 years Burnette 16 71.2 years Robinson 16 74.3 years Edwards 14 75.6 years
Swannanoa compared to North Carolina state average:
Unemployed percentage significantly below state average. Black race population percentage significantly below state average. Median age below state average. Foreign-born population percentage below state average. Length of stay since moving in significantly below state average. Institutionalized population percentage above state average.
#10 on the list of "Top 101 cities with the largest percentage of people in training schools for juvenile delinquents (population 1,000+)"
#30 on the list of "Top 101 counties with the lowest percentage of residents that drank alcohol in the past 30 days"
#32 on the list of "Top 101 counties with the largest number of people moving in compared to moving out (pop. 50,000+)"
#55 on the list of "Top 101 counties with the highest percentage of residents that keep firearms around their homes"
#84 on the list of "Top 101 counties with the lowest percentage of residents that visited a dentist within the past year"
#89 on the list of "Top 101 counties with the highest percentage of residents that smoked 100+ cigarettes in their lives"
Top Patent Applicants
Derrick F. Stikeleather (4)
Marc Ogle (1)
Nancy Ellington (1)
Bradley Gene Jones (1)
Philip Howard Diehn (1)
Edwin Howard Ferree, Jr. (1)
David R. Bassett (1)
Total of 10 patent applications in 2008-2024.


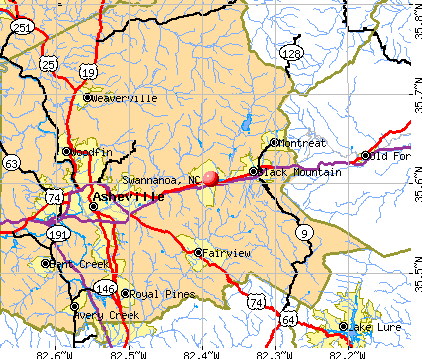


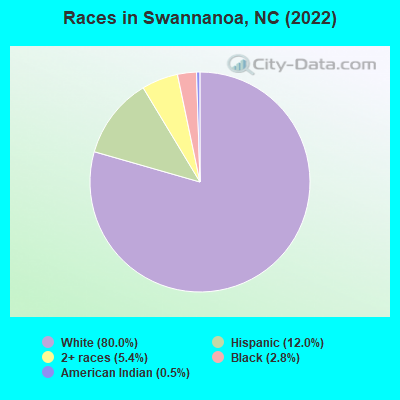
 Recent articles from our blog. Our writers, many of them Ph.D. graduates or candidates, create easy-to-read articles on a wide variety of topics.


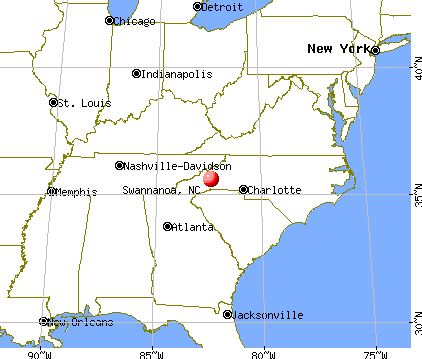
 (9.6 miles
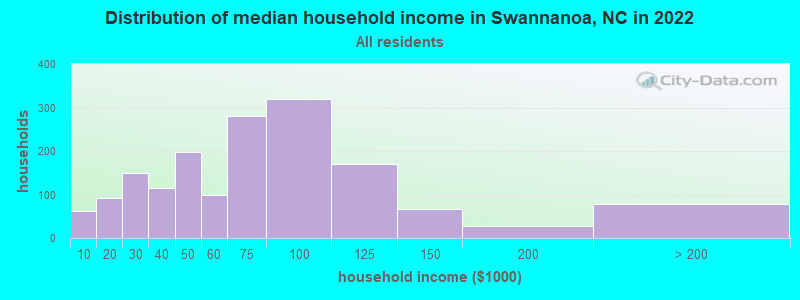
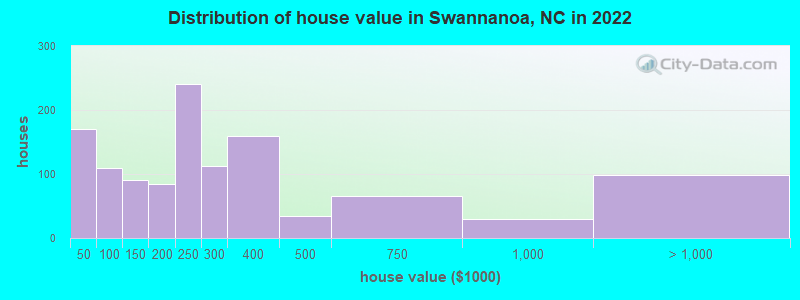

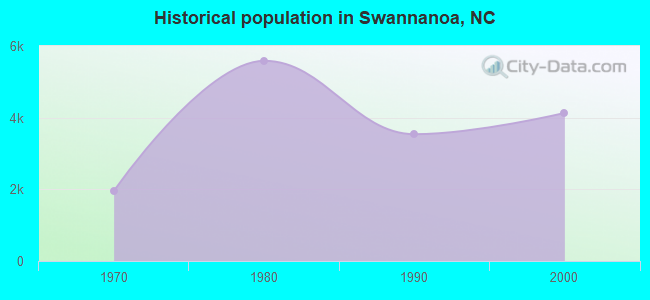
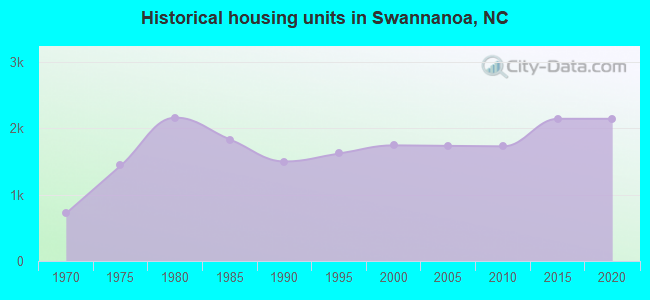
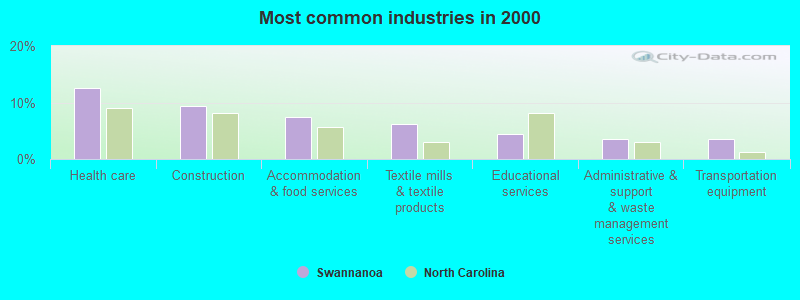
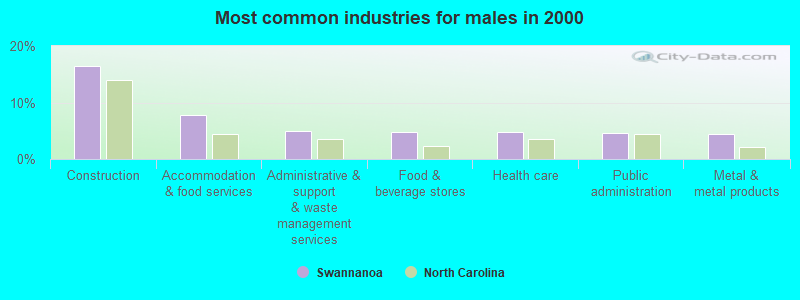
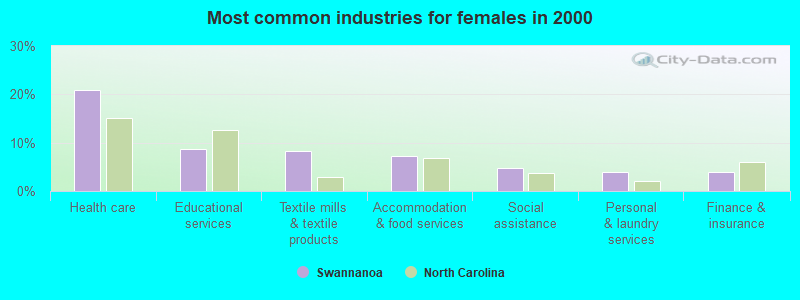
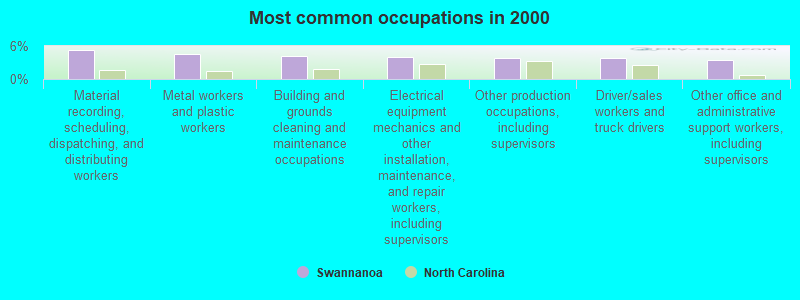
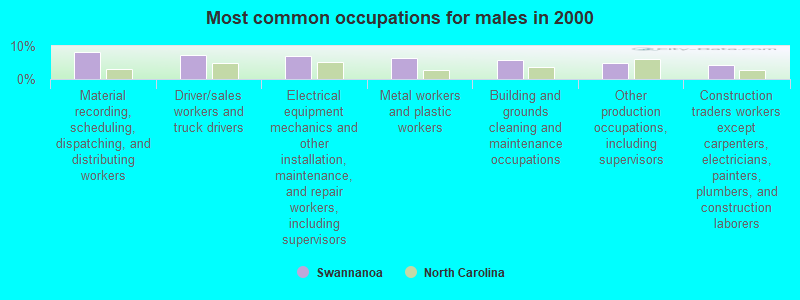
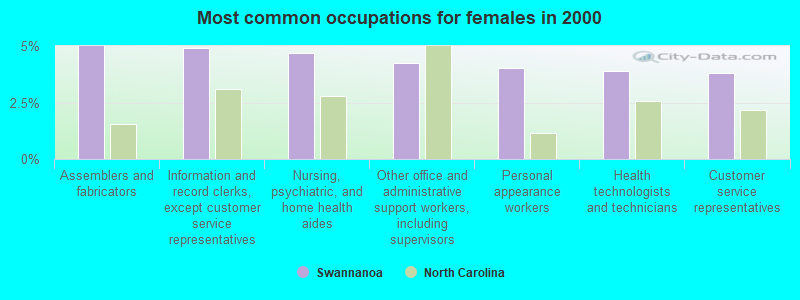
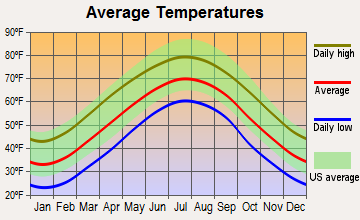
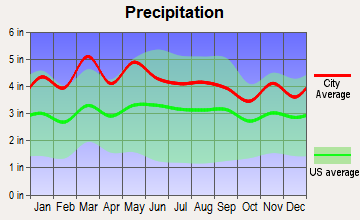
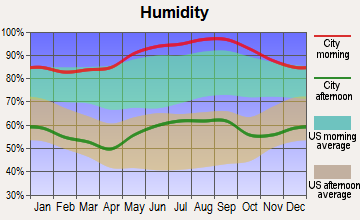
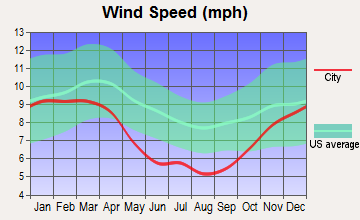
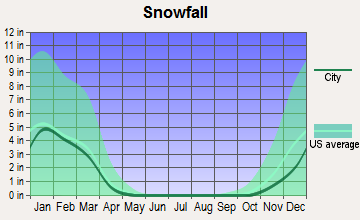
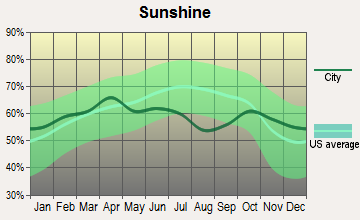
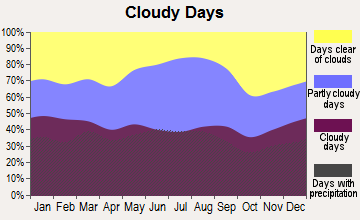
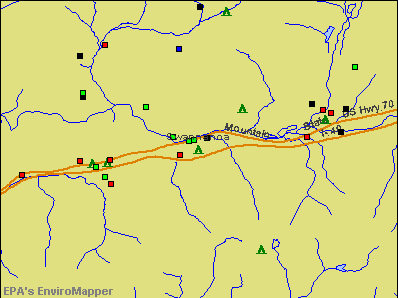

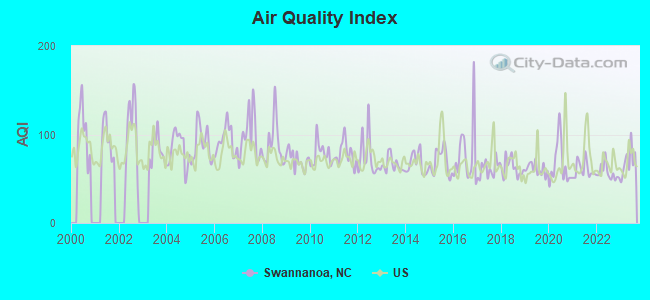
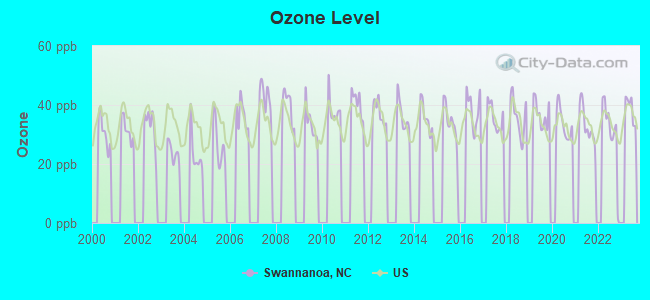
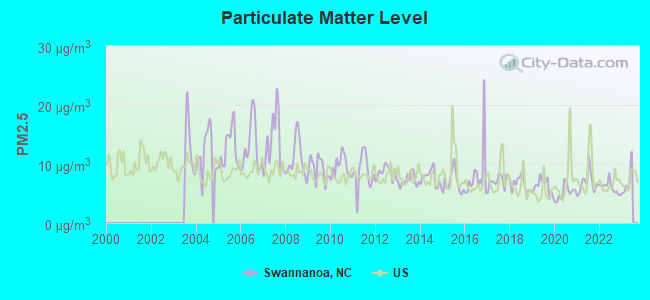

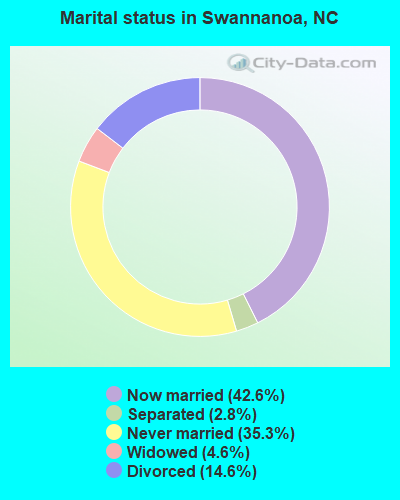
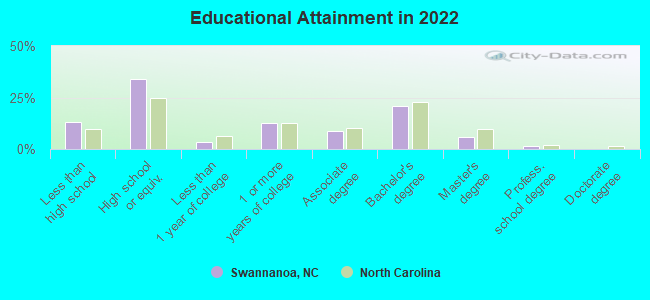
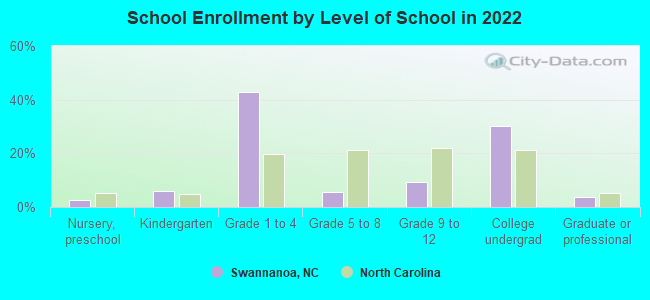
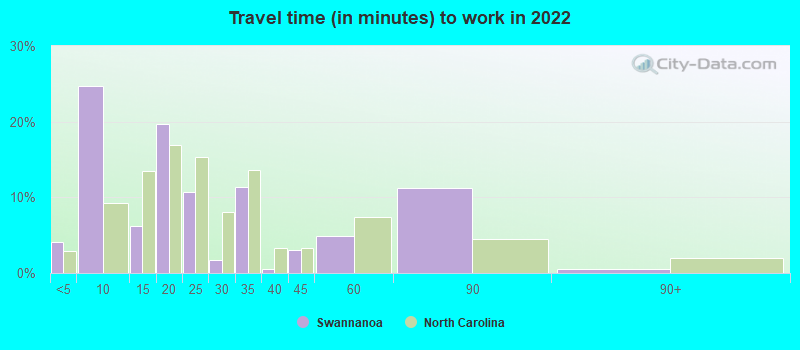
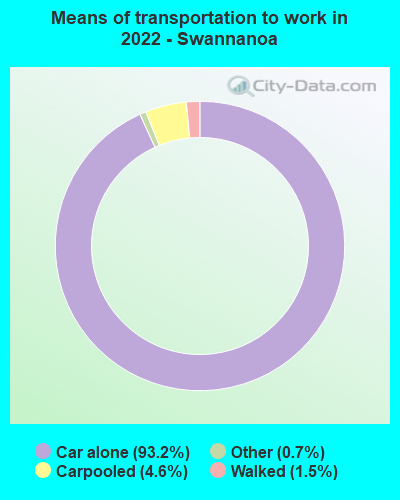
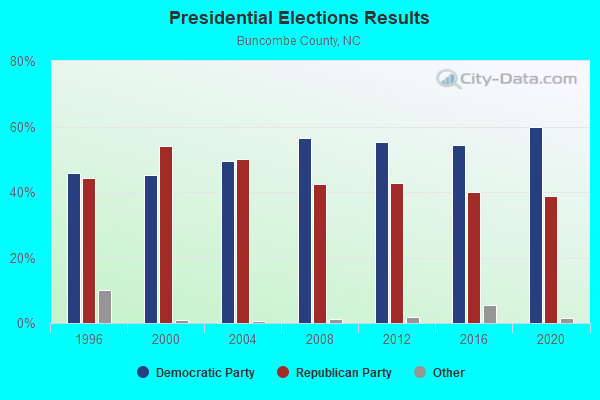
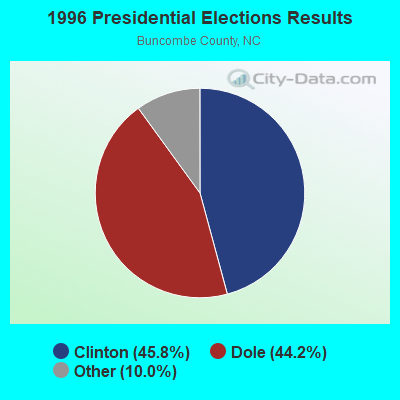
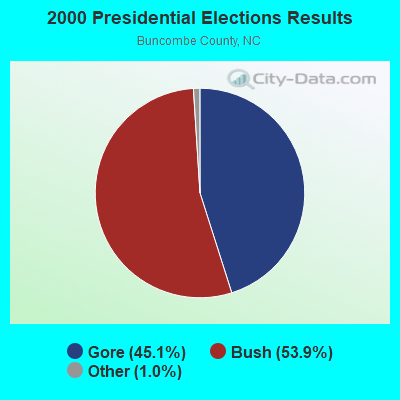
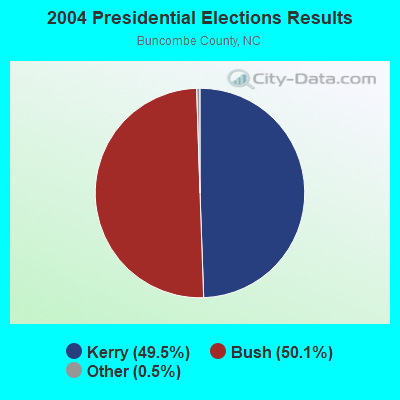

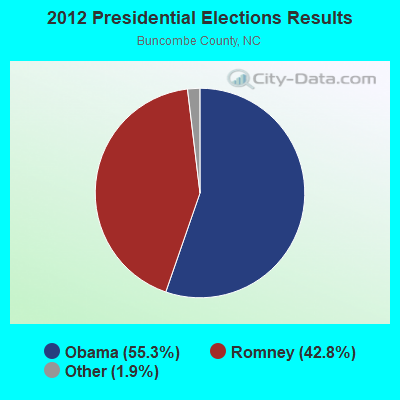
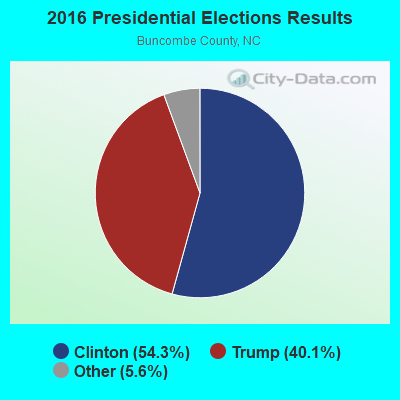
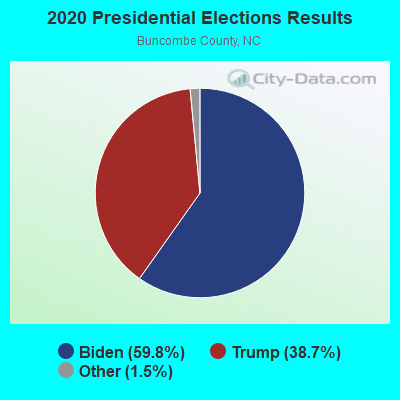
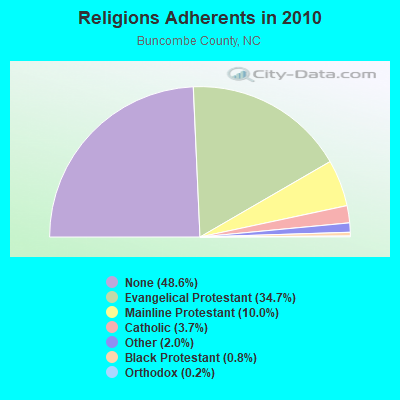
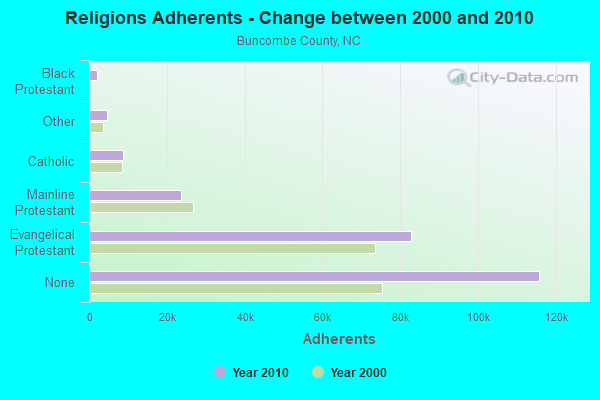
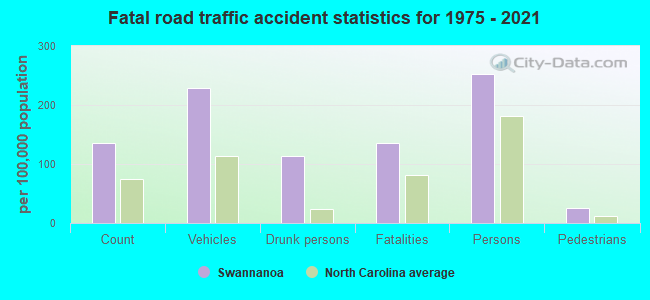
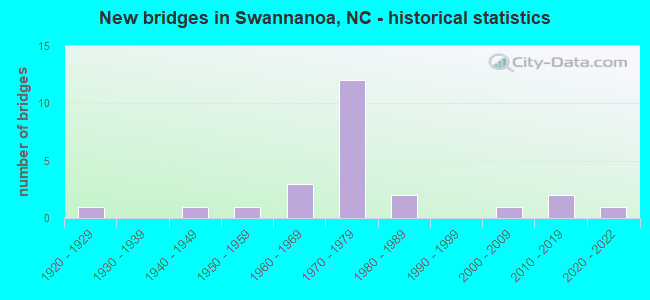
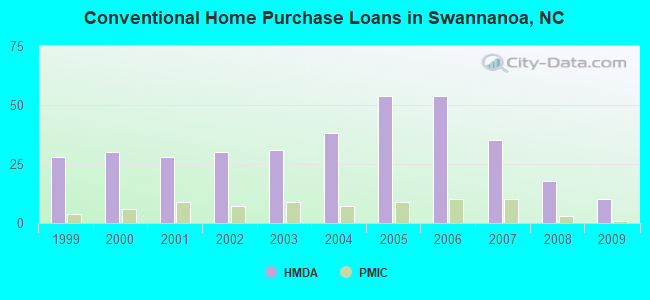
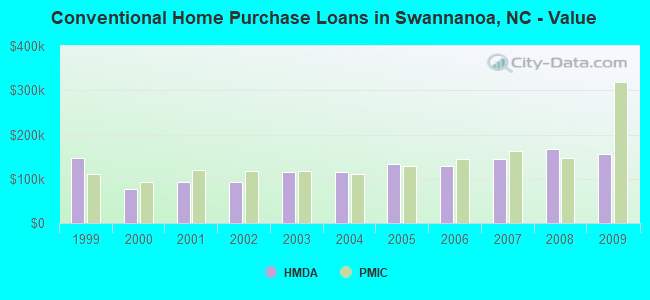
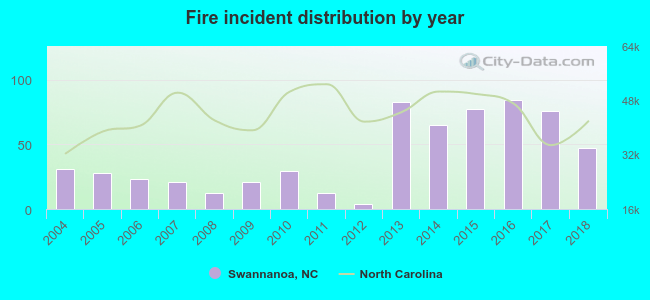 According to the data from the years 2004 - 2018 the average number of fires per year is 41. The highest number of fires - 84 took place in 2016, and the least - 4 in 2012. The data has a rising trend.
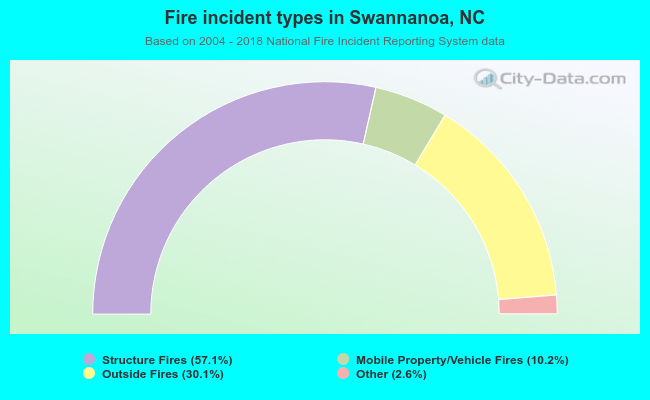 When looking into fire subcategories, the most reports belonged to: Structure Fires (57.1%), and Outside Fires (30.1%).