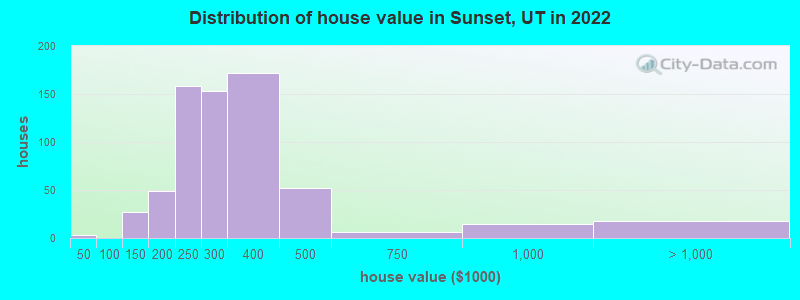
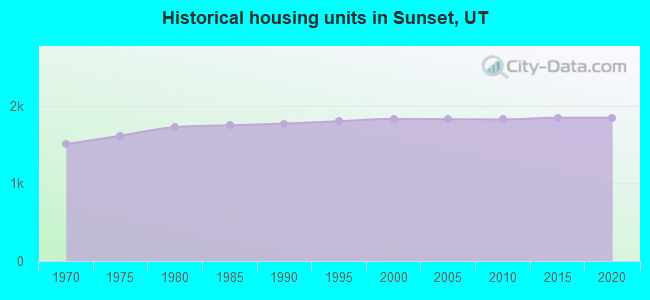
Estimated median house or condo value in 2022: $321,296 (it was $102,500 in 2000)
Sunset:
$321,296
UT:
$499,500
Mean prices in 2022:all housing units: $542,786; detached houses: $569,919; townhouses or other attached units: $417,045; in 2-unit structures: $316,176; in 3-to-4-unit structures: $320,740; in 5-or-more-unit structures: $373,951; mobile homes: $46,968
Median gross rent in 2022: $1,171.
March 2022 cost of living index in Sunset: 88.3 (less than average, U.S. average is 100)
Percentage of residents living in poverty in 2022: 11.6%
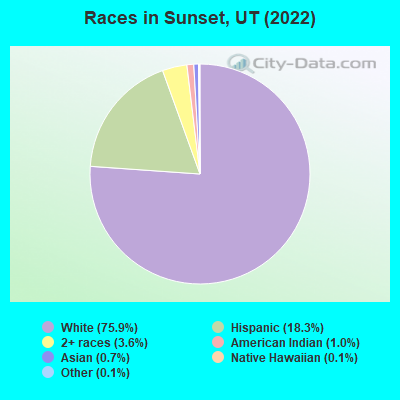
(13.5% for White Non-Hispanic residents, 3.9% for Hispanic or Latino residents, 54.7% for American Indian residents, 8.1% for two or more races residents)
According to our research of Utah and other state lists, there were 12 registered sex offenders living in Sunset, Utah as of May 07, 2024. The ratio of all residents to sex offenders in Sunset is 448 to 1. The ratio of registered sex offenders to all residents in this city is near the state average.
Crime rates in Sunset by year
Type
2009
2010
2011
2012
2013
2014
2015
2016
2017
2018
2019
2020
2021
2022
Murders (per 100,000)
0 (0.0)
0 (0.0)
0 (0.0)
0 (0.0)
0 (0.0)
0 (0.0)
1 (19.4)
0 (0.0)
1 (19.1)
0 (0.0)
0 (0.0)
0 (0.0)
0 (0.0)
0 (0.0)
Rapes (per 100,000)
1 (20.4)
1 (19.5)
1 (19.2)
0 (0.0)
2 (38.9)
0 (0.0)
0 (0.0)
2 (38.5)
7 (133.4)
3 (56.6)
0 (0.0)
4 (74.3)
0 (0.0)
2 (36.0)
Robberies (per 100,000)
1 (20.4)
1 (19.5)
0 (0.0)
0 (0.0)
0 (0.0)
0 (0.0)
0 (0.0)
0 (0.0)
0 (0.0)
0 (0.0)
0 (0.0)
0 (0.0)
1 (18.7)
0 (0.0)
Assaults (per 100,000)
2 (40.9)
1 (19.5)
0 (0.0)
0 (0.0)
2 (38.9)
4 (77.9)
2 (38.8)
0 (0.0)
1 (19.1)
12 (226.2)
13 (242.4)
8 (148.5)
11 (205.5)
13 (233.9)
Burglaries (per 100,000)
26 (531.5)
11 (214.8)
17 (325.6)
14 (265.0)
17 (330.9)
10 (194.6)
12 (232.8)
18 (346.8)
10 (190.6)
14 (264.0)
13 (242.4)
14 (259.9)
26 (485.6)
13 (233.9)
Thefts (per 100,000)
100 (2,044)
118 (2,304)
90 (1,724)
119 (2,253)
112 (2,180)
84 (1,635)
108 (2,095)
79 (1,522)
81 (1,544)
64 (1,207)
40 (745.7)
68 (1,262)
59 (1,102)
61 (1,098)
Auto thefts (per 100,000)
4 (81.8)
6 (117.1)
3 (57.5)
5 (94.6)
3 (58.4)
4 (77.9)
3 (58.2)
1 (19.3)
3 (57.2)
5 (94.3)
4 (74.6)
11 (204.2)
26 (485.6)
10 (180.0)
Arson (per 100,000)
0 (0.0)
0 (0.0)
0 (0.0)
0 (0.0)
0 (0.0)
0 (0.0)
0 (0.0)
0 (0.0)
0 (0.0)
1 (18.9)
0 (0.0)
0 (0.0)
0 (0.0)
0 (0.0)
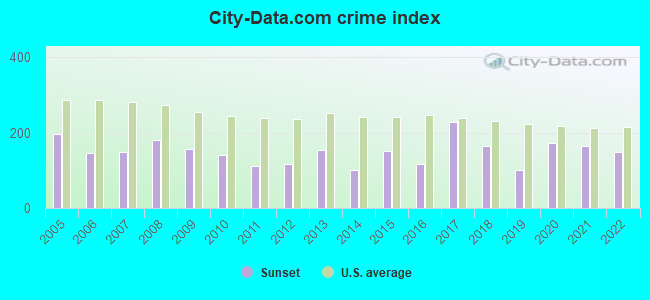
City-Data.com crime index
156.2
141.9
111.7
116.2
154.0
100.8
151.3
117.5
228.4
164.8
101.2
174.1
163.6
150.3
The City-Data.com crime index weighs serious crimes and violent crimes more heavily. Higher means more crime, U.S. average is 246.1. It adjusts for the number of visitors and daily workers commuting into cities.
Latest news from Sunset, UT collected exclusively by city-data.com from local newspapers, TV, and radio stations
Ancestries: English (15.5%), Irish (9.9%), American (8.0%), Canadian (5.6%), German (3.3%), Norwegian (2.9%).
Current Local Time: MST time zone
Elevation: 4567 feet
Land area: 1.47 square miles.
Population density: 3,646 people per square mile (average).
336 residents are foreign born (5.2% Latin America).
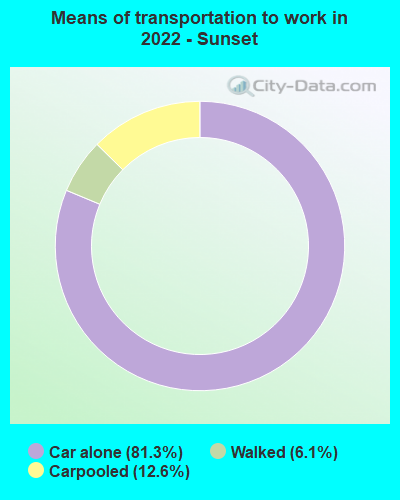
This city:
6.1%
Utah:
8.4%
Median real estate property taxes paid for housing units with mortgages in 2022: $1,560 (0.5%) Median real estate property taxes paid for housing units with no mortgage in 2022: $1,789 (0.7%)
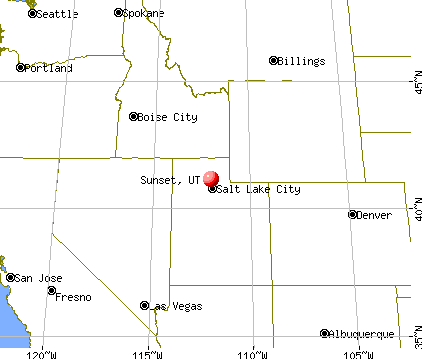
Nearest city with pop. 50,000+: North Davis, UT (4.8 miles , pop. 149,866).
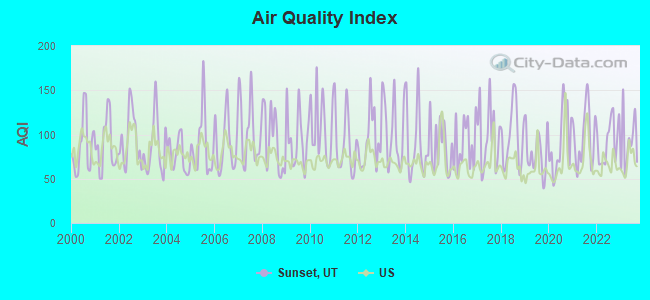
Air Quality Index (AQI) level in 2023 was 91.4. This is worse than average.
City:
91.4
U.S.:
72.6
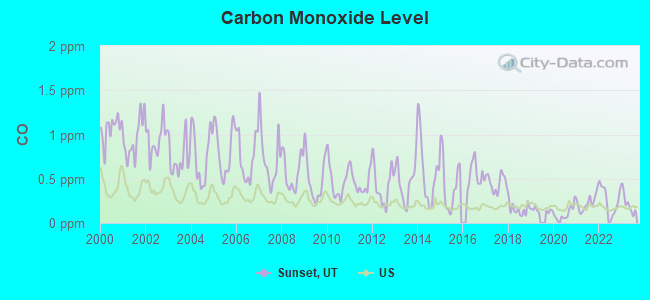
Carbon Monoxide (CO) [ppm] level in 2023 was 0.219. This is about average.Closest monitor was 2.2 miles away from the city center.
City:
0.219
U.S.:
0.251
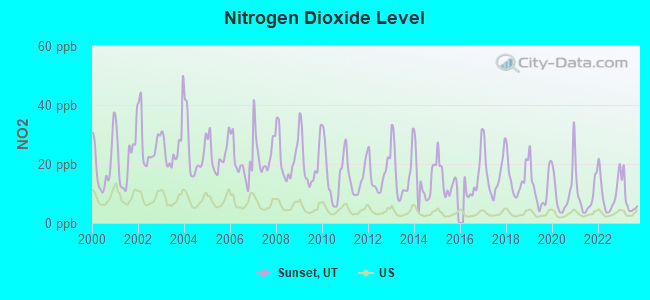
Nitrogen Dioxide (NO2) [ppb] level in 2023 was 7.90. This is significantly worse than average.Closest monitor was 4.1 miles away from the city center.
City:
7.90
U.S.:
5.11
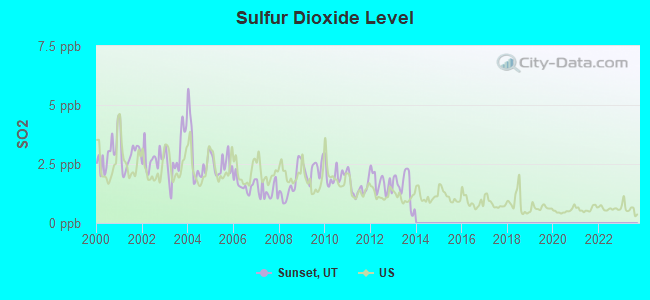
Sulfur Dioxide (SO2) [ppb] level in 2013 was 1.53. This is about average.Closest monitor was 6.2 miles away from the city center.
City:
1.53
U.S.:
1.51
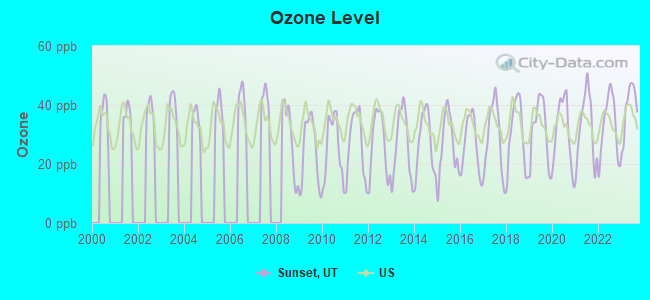
Ozone [ppb] level in 2023 was 39.2. This is about average.Closest monitor was 2.2 miles away from the city center.
City:
39.2
U.S.:
33.3
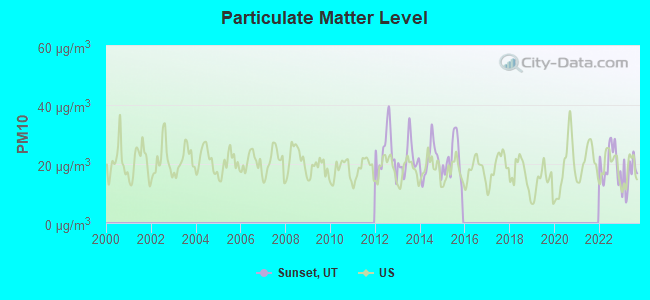
Particulate Matter (PM10) [µg/m3] level in 2023 was 16.2. This is about average.Closest monitor was 2.2 miles away from the city center.
City:
16.2
U.S.:
19.2
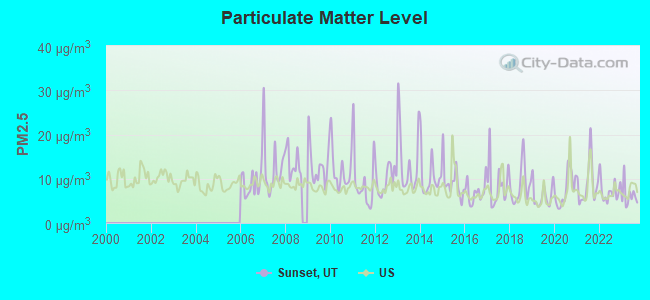
Particulate Matter (PM2.5) [µg/m3] level in 2023 was 6.21. This is better than average.Closest monitor was 3.6 miles away from the city center.
City:
6.21
U.S.:
8.11
Earthquake activity:
Sunset-area historical earthquake activity is significantly above Utah state average. It is 2131% greater than the overall U.S. average.
On 8/18/1959 at 06:37:13, a magnitude 7.7 (7.7 UK, Class: Major, Intensity: VIII - XII) earthquake occurred 247.0 miles away from Sunset center, causing $26,000,000 total damage On 10/28/1983 at 14:06:06, a magnitude 7.3 (6.2 MB, 7.3 MS, 7.0 MW) earthquake occurred 222.2 miles away from the city center, causing 2 deaths (2 shaking deaths) and 3 injuries, causing $15,000,000 total damage On 10/3/1915 at 06:52:48, a magnitude 7.6 (7.6 UK) earthquake occurred 289.7 miles away from Sunset center On 3/28/1975 at 02:31:05, a magnitude 6.2 (6.1 MB, 6.0 MS, 6.2 ML, Class: Strong, Intensity: VII - IX) earthquake occurred 64.5 miles away from the city center On 3/18/2020 at 13:09:31, a magnitude 5.7 (5.7 MW, Depth: 7.4 mi, Class: Moderate, Intensity: VI - VII) earthquake occurred 27.1 miles away from the city center On 12/21/1932 at 06:10:09, a magnitude 7.2 (7.2 UK) earthquake occurred 369.4 miles away from the city center Magnitude types: body-wave magnitude (MB), local magnitude (ML), surface-wave magnitude (MS), moment magnitude (MW)
Natural disasters:
The number of natural disasters in Davis County (7) is smaller than the US average (15). Major Disasters (Presidential) Declared: 3 Emergencies Declared: 2
Causes of natural disasters: Storms: 3, Floods: 2, Landslides: 2, Drought: 1, Earthquake: 1, Hurricane: 1, Mudslide: 1, Other: 1 (Note: some incidents may be assigned to more than one category).
Hospitals and medical centers near Sunset:
HERITAGE PARK CARE CENTER (Nursing Home, about 2 miles away; ROY, UT)
IVY LANE PEDIATRICS, INC (Home Health Center, about 2 miles away; ROY, UT)
MT OGDEN HEALTH AND REHABILITATION CENTER (Nursing Home, about 4 miles away; WASHINGTON TERRACE, UT)
BONNEVILLE DIALYSIS CENTER (Dialysis Facility, about 4 miles away; OGDEN, UT)
OGDEN REGIONAL MEDICAL CENTER Acute Care Hospitals (about 4 miles away; OGDEN, UT)
OGDEN REG MEDICAL CENTER TCU (Nursing Home, about 4 miles away; OGDEN, UT)
WASHINGTON TERRACE CARE AND REHABILITATION CENTER (Nursing Home, about 4 miles away; OGDEN, UT)
Davis County has a predicted average indoor radon screening level between 2 and 4 pCi/L (pico curies per liter) - Moderate Potential
Drinking water stations with addresses in Sunset and their reported violations in the past:
SUNSET CITY WATER SYSTEM (Population served: 5,200, Purch surface water):
Past monitoring violations:
One minor monitoring violation
Average household size:
This city:
3.0 people
Utah:
3.1 people
Percentage of family households:
This city:
74.9%
Whole state:
75.2%
Percentage of households with unmarried partners:
This city:
8.0%
Whole state:
4.6%
Likely homosexual households (counted as self-reported same-sex unmarried-partner households)
Lesbian couples: 0.6% of all households
Gay men: 0.3% of all households
Banks with branches in Sunset (2011 data):
U.S. Bank National Association: Sunset Smiths Branch at 2353 North Main Street, branch established on 2004/03/29. Info updated 2012/01/30: Bank assets: $330,470.8 mil, Deposits: $236,091.5 mil, headquarters in Cincinnati, OH, positive income, 3121 total offices, Holding Company: U.S. Bancorp
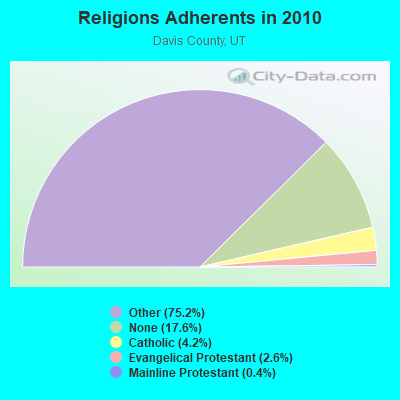
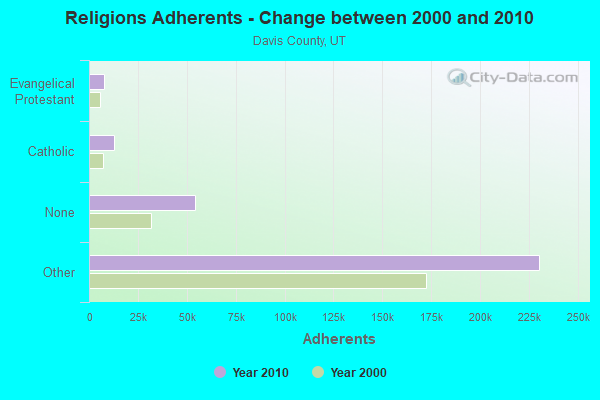
Religion statistics for Sunset, UT (based on Davis County data)
Religion
Adherents
Congregations
Other
230,405
556
Catholic
12,782
1
Evangelical Protestant
7,928
34
Mainline Protestant
1,135
7
Black Protestant
200
1
None
54,029
-
Source: Clifford Grammich, Kirk Hadaway, Richard Houseal, Dale E.Jones, Alexei Krindatch, Richie Stanley and Richard H.Taylor. 2012. 2010 U.S.Religion Census: Religious Congregations & Membership Study. Association of Statisticians of American Religious Bodies. Jones, Dale E., et al. 2002. Congregations and Membership in the United States 2000. Nashville, TN: Glenmary Research Center. Graphs represent county-level data
Lat: 41.132611 Lon: -112.029361, Call Sign: WQFX253, Assigned Frequencies: 153.792 MHz, Grant Date: 10/12/2016, Expiration Date: 10/25/2026, Certifier: Neil Coker, Registrant: Federal Licensing Inc, 1588 Fairfield Road, Gettysburg, PA 17325, Phone: (717) 334-9262, Fax: (717) 334-6440, Email:
FCC Registered Microwave Towers:
4
UT-SLC0439A, 85 W 1800 N (Lat: 41.138972 Lon: -112.027083), Type: Tower, Structure height: 29.9 m, Overall height: 31.4 m, Call Sign: WQLR981, Assigned Frequencies: 23275.0 MHz, Grant Date: 06/24/2020, Expiration Date: 04/12/2030, Cancellation Date: 05/09/2023, Certifier: Nadja S Sodos-Wallace, Registrant: T-Mobile Usa, Inc., 12920 Se 38th Street, Bellevue, WA 98006, Phone: (425) 383-8401, Email:
SL03XC150, 85 W 1800 N (Lat: 41.138972 Lon: -112.027083), Type: Mtower, Structure height: 29.9 m, Overall height: 31.4 m, Call Sign: WQWL384, Assigned Frequencies: 23075.0 MHz, Grant Date: 09/25/2015, Expiration Date: 09/25/2025, Cancellation Date: 05/12/2023, Certifier: David Werblow, Registrant: T-Mobile Usa, Inc., 12920 Se 38th Street, Bellevue, WA 98006, Phone: (425) 383-8401, Email:
ARSENAL, 472 West 1800 North (Lat: 41.140528 Lon: -112.034556), Type: Mtower, Structure height: 36.6 m, Overall height: 38.4 m, Call Sign: WQYD553, Assigned Frequencies: 21970.0 MHz, 21970.0 MHz, Grant Date: 08/24/2016, Expiration Date: 08/24/2026, Cancellation Date: 03/03/2022, Certifier: Gregory M Romano, Registrant: Verizon, 1300 I St Nw - Suite 500 East, Washington, DC 20005, Phone: (202) 515-2453, Email:
2447 North Main St (Lat: 41.134361 Lon: -112.031861), Structure height: 7.6 m, Overall height: 6.4 m, Call Sign: WHQ375, Licensee ID: L00010098, Assigned Frequencies: 2076.00 MHz, Grant Date: 11/23/1982, Expiration Date: 10/01/2006, Cancellation Date: 12/09/1999, Registrant: Bonneville Holding Company, Salt Lake City, UT 84110
Aircraft: GEYER STEPHEN WAYNE GEYER WEEDHOOPER (Category: Land, Seats: 2, Weight: Up to 12,499 Pounds), Engine: Reciprocating N-Number: 6383G, N6383G, N-6383G, Serial Number: 21499, Certificate Issue Date: 05/13/1999 Registrant (Individual): Stephen W Geyer, 138 W 2650 N, Sunset, UT 84015
Home Mortgage Disclosure Act Aggregated Statistics For Year 2009 (Based on 1 full tract)
A) FHA, FSA/RHS & VA Home Purchase Loans
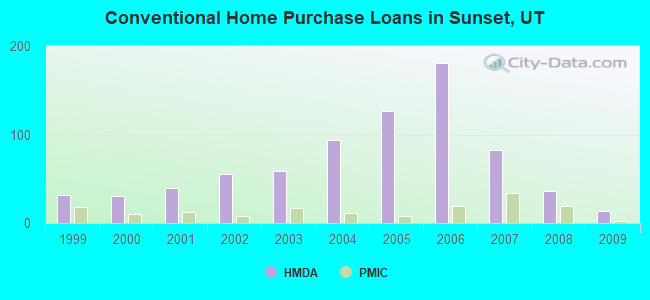
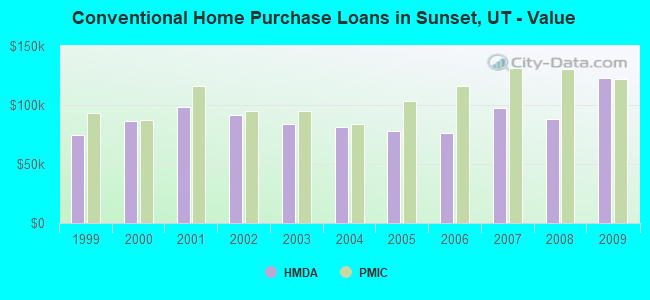
B) Conventional Home Purchase Loans
C) Refinancings
D) Home Improvement Loans
F) Non-occupant Loans on < 5 Family Dwellings (A B C & D)
G) Loans On Manufactured Home Dwelling (A B C & D)
Number
Average Value
Number
Average Value
Number
Average Value
Number
Average Value
Number
Average Value
Number
Average Value
LOANS ORIGINATED
49
$129,959
14
$122,786
142
$118,620
7
$51,429
6
$108,167
1
$30,000
APPLICATIONS APPROVED, NOT ACCEPTED
1
$131,000
1
$47,000
13
$126,308
1
$11,000
0
$0
0
$0
APPLICATIONS DENIED
9
$134,222
3
$133,333
34
$114,971
8
$46,000
2
$63,500
0
$0
APPLICATIONS WITHDRAWN
5
$142,000
0
$0
26
$118,500
0
$0
1
$115,000
0
$0
FILES CLOSED FOR INCOMPLETENESS
0
$0
1
$315,000
11
$115,091
1
$150,000
1
$138,000
0
$0
Aggregated Statistics For Year 2008 (Based on 1 full tract)
A) FHA, FSA/RHS & VA Home Purchase Loans
B) Conventional Home Purchase Loans
C) Refinancings
D) Home Improvement Loans
E) Loans on Dwellings For 5+ Families
F) Non-occupant Loans on < 5 Family Dwellings (A B C & D)
G) Loans On Manufactured Home Dwelling (A B C & D)
Number
Average Value
Number
Average Value
Number
Average Value
Number
Average Value
Number
Average Value
Number
Average Value
Number
Average Value
LOANS ORIGINATED
65
$136,985
36
$88,389
109
$123,183
8
$50,125
0
$0
15
$126,400
1
$132,000
APPLICATIONS APPROVED, NOT ACCEPTED
3
$160,333
3
$192,667
15
$143,200
1
$20,000
0
$0
2
$112,500
0
$0
APPLICATIONS DENIED
7
$126,143
13
$107,077
68
$149,912
21
$29,714
1
$196,000
8
$95,625
0
$0
APPLICATIONS WITHDRAWN
8
$124,375
7
$118,000
30
$132,933
2
$73,500
0
$0
3
$158,333
0
$0
FILES CLOSED FOR INCOMPLETENESS
2
$122,000
2
$176,500
6
$130,500
0
$0
0
$0
1
$120,000
0
$0
Aggregated Statistics For Year 2007 (Based on 1 full tract)
A) FHA, FSA/RHS & VA Home Purchase Loans
B) Conventional Home Purchase Loans
C) Refinancings
D) Home Improvement Loans
F) Non-occupant Loans on < 5 Family Dwellings (A B C & D)
G) Loans On Manufactured Home Dwelling (A B C & D)
Number
Average Value
Number
Average Value
Number
Average Value
Number
Average Value
Number
Average Value
Number
Average Value
LOANS ORIGINATED
29
$134,655
82
$97,659
135
$105,452
24
$39,500
28
$108,607
0
$0
APPLICATIONS APPROVED, NOT ACCEPTED
2
$123,500
12
$118,083
19
$132,579
10
$36,800
4
$84,250
0
$0
APPLICATIONS DENIED
9
$150,111
34
$106,647
79
$116,506
21
$55,048
9
$96,111
2
$24,500
APPLICATIONS WITHDRAWN
5
$142,600
8
$110,000
27
$128,296
2
$102,500
0
$0
0
$0
FILES CLOSED FOR INCOMPLETENESS
1
$239,000
7
$92,571
10
$100,800
0
$0
5
$101,200
0
$0
Aggregated Statistics For Year 2006 (Based on 1 full tract)
A) FHA, FSA/RHS & VA Home Purchase Loans
B) Conventional Home Purchase Loans
C) Refinancings
D) Home Improvement Loans
F) Non-occupant Loans on < 5 Family Dwellings (A B C & D)
G) Loans On Manufactured Home Dwelling (A B C & D)
Number
Average Value
Number
Average Value
Number
Average Value
Number
Average Value
Number
Average Value
Number
Average Value
LOANS ORIGINATED
30
$117,200
181
$76,387
104
$91,654
19
$24,842
44
$92,227
0
$0
APPLICATIONS APPROVED, NOT ACCEPTED
2
$124,500
33
$74,727
16
$102,000
4
$18,500
4
$69,500
0
$0
APPLICATIONS DENIED
1
$98,000
47
$88,234
73
$94,178
18
$42,944
12
$139,583
1
$25,000
APPLICATIONS WITHDRAWN
7
$119,857
34
$76,853
39
$103,128
4
$84,500
5
$64,000
0
$0
FILES CLOSED FOR INCOMPLETENESS
0
$0
3
$71,667
9
$118,889
0
$0
0
$0
0
$0
Aggregated Statistics For Year 2005 (Based on 1 full tract)
A) FHA, FSA/RHS & VA Home Purchase Loans
B) Conventional Home Purchase Loans
C) Refinancings
D) Home Improvement Loans
F) Non-occupant Loans on < 5 Family Dwellings (A B C & D)
G) Loans On Manufactured Home Dwelling (A B C & D)
Number
Average Value
Number
Average Value
Number
Average Value
Number
Average Value
Number
Average Value
Number
Average Value
LOANS ORIGINATED
49
$98,429
126
$78,032
123
$84,163
21
$39,619
41
$98,000
0
$0
APPLICATIONS APPROVED, NOT ACCEPTED
0
$0
12
$86,167
35
$97,229
4
$30,750
7
$126,857
0
$0
APPLICATIONS DENIED
10
$111,400
61
$77,885
112
$85,500
29
$21,241
25
$89,680
1
$62,000
APPLICATIONS WITHDRAWN
5
$103,000
34
$89,324
58
$90,017
9
$134,444
9
$108,222
0
$0
FILES CLOSED FOR INCOMPLETENESS
1
$106,000
3
$118,333
17
$109,000
0
$0
0
$0
0
$0
Aggregated Statistics For Year 2004 (Based on 1 full tract)
A) FHA, FSA/RHS & VA Home Purchase Loans
B) Conventional Home Purchase Loans
C) Refinancings
D) Home Improvement Loans
F) Non-occupant Loans on < 5 Family Dwellings (A B C & D)
G) Loans On Manufactured Home Dwelling (A B C & D)
Number
Average Value
Number
Average Value
Number
Average Value
Number
Average Value
Number
Average Value
Number
Average Value
LOANS ORIGINATED
44
$110,023
94
$81,149
146
$87,795
12
$23,250
35
$101,114
1
$117,000
APPLICATIONS APPROVED, NOT ACCEPTED
0
$0
14
$105,429
25
$84,160
3
$18,333
6
$100,167
0
$0
APPLICATIONS DENIED
6
$171,500
26
$85,846
103
$95,835
17
$17,471
17
$87,471
0
$0
APPLICATIONS WITHDRAWN
5
$121,600
15
$111,133
49
$100,224
2
$68,000
7
$70,571
0
$0
FILES CLOSED FOR INCOMPLETENESS
1
$110,000
2
$40,500
14
$118,000
0
$0
1
$111,000
0
$0
Aggregated Statistics For Year 2003 (Based on 1 full tract)
A) FHA, FSA/RHS & VA Home Purchase Loans
B) Conventional Home Purchase Loans
C) Refinancings
D) Home Improvement Loans
E) Loans on Dwellings For 5+ Families
F) Non-occupant Loans on < 5 Family Dwellings (A B C & D)
Number
Average Value
Number
Average Value
Number
Average Value
Number
Average Value
Number
Average Value
Number
Average Value
LOANS ORIGINATED
41
$103,805
59
$83,695
273
$91,048
8
$29,375
1
$280,000
36
$94,778
APPLICATIONS APPROVED, NOT ACCEPTED
0
$0
9
$71,778
23
$104,087
1
$30,000
0
$0
3
$145,667
APPLICATIONS DENIED
1
$78,000
20
$81,700
83
$96,627
5
$18,000
0
$0
8
$110,375
APPLICATIONS WITHDRAWN
3
$99,000
7
$116,429
60
$104,283
0
$0
0
$0
1
$117,000
FILES CLOSED FOR INCOMPLETENESS
0
$0
3
$74,333
14
$104,286
0
$0
0
$0
1
$189,000
Aggregated Statistics For Year 2002 (Based on 1 full tract)
A) FHA, FSA/RHS & VA Home Purchase Loans
B) Conventional Home Purchase Loans
C) Refinancings
D) Home Improvement Loans
F) Non-occupant Loans on < 5 Family Dwellings (A B C & D)
Number
Average Value
Number
Average Value
Number
Average Value
Number
Average Value
Number
Average Value
LOANS ORIGINATED
42
$103,690
55
$91,109
205
$89,244
6
$7,000
29
$100,448
APPLICATIONS APPROVED, NOT ACCEPTED
2
$106,500
9
$107,778
29
$93,138
2
$19,500
3
$83,000
APPLICATIONS DENIED
5
$102,800
22
$70,591
60
$88,683
13
$30,462
7
$61,000
APPLICATIONS WITHDRAWN
4
$87,250
14
$88,000
112
$111,732
0
$0
3
$92,333
FILES CLOSED FOR INCOMPLETENESS
2
$92,500
5
$78,800
16
$96,625
0
$0
1
$57,000
Aggregated Statistics For Year 2001 (Based on 1 full tract)
A) FHA, FSA/RHS & VA Home Purchase Loans
B) Conventional Home Purchase Loans
C) Refinancings
D) Home Improvement Loans
F) Non-occupant Loans on < 5 Family Dwellings (A B C & D)
Number
Average Value
Number
Average Value
Number
Average Value
Number
Average Value
Number
Average Value
LOANS ORIGINATED
57
$103,158
39
$98,051
184
$86,967
21
$16,000
17
$103,118
APPLICATIONS APPROVED, NOT ACCEPTED
1
$109,000
6
$109,667
23
$84,043
1
$13,000
1
$180,000
APPLICATIONS DENIED
6
$93,000
23
$78,217
68
$85,382
13
$11,077
2
$88,000
APPLICATIONS WITHDRAWN
1
$89,000
10
$86,400
90
$103,767
1
$200,000
3
$78,000
FILES CLOSED FOR INCOMPLETENESS
0
$0
2
$84,000
19
$94,632
1
$10,000
0
$0
Aggregated Statistics For Year 2000 (Based on 1 full tract)
A) FHA, FSA/RHS & VA Home Purchase Loans
B) Conventional Home Purchase Loans
C) Refinancings
D) Home Improvement Loans
E) Loans on Dwellings For 5+ Families
F) Non-occupant Loans on < 5 Family Dwellings (A B C & D)
Number
Average Value
Number
Average Value
Number
Average Value
Number
Average Value
Number
Average Value
Number
Average Value
LOANS ORIGINATED
56
$104,321
31
$86,065
70
$75,971
9
$16,222
0
$0
14
$77,857
APPLICATIONS APPROVED, NOT ACCEPTED
2
$97,500
10
$65,300
14
$56,714
3
$12,000
0
$0
1
$12,000
APPLICATIONS DENIED
3
$121,333
16
$84,875
64
$68,734
15
$20,667
0
$0
2
$43,000
APPLICATIONS WITHDRAWN
1
$100,000
10
$75,400
28
$95,607
1
$35,000
1
$6,564,000
1
$100,000
FILES CLOSED FOR INCOMPLETENESS
1
$87,000
1
$89,000
39
$97,718
0
$0
0
$0
0
$0
Aggregated Statistics For Year 1999 (Based on 1 full tract)
A) FHA, FSA/RHS & VA Home Purchase Loans
B) Conventional Home Purchase Loans
C) Refinancings
D) Home Improvement Loans
E) Loans on Dwellings For 5+ Families
F) Non-occupant Loans on < 5 Family Dwellings (A B C & D)
Detailed PMIC statistics for the following Tracts:1253.01
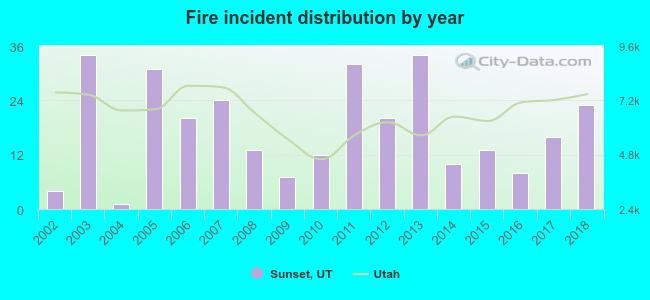
2002 - 2018 National Fire Incident Reporting System (NFIRS) incidents
Based on the data from the years 2002 - 2018 the average number of fires per year is 18. The highest number of fires - 34 took place in 2003, and the least - 1 in 2004. The data has a growing trend.
When looking into fire subcategories, the most reports belonged to: Structure Fires (51.7%), and Outside Fires (30.5%).
Fire incident types reported to NFIRS in Sunset, UT
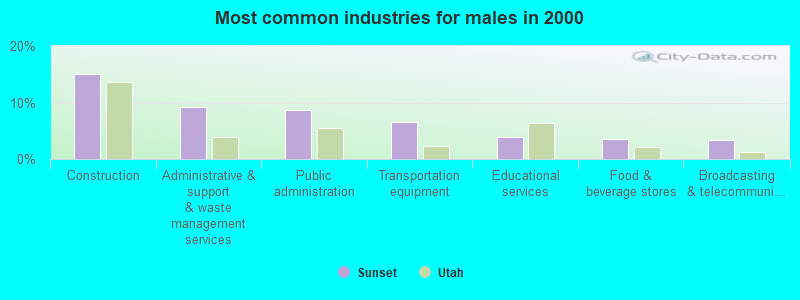
#46 on the list of "Top 101 cities with largest percentage of males in occupations: installation, maintenance, and repair occupations (population 5,000+)"
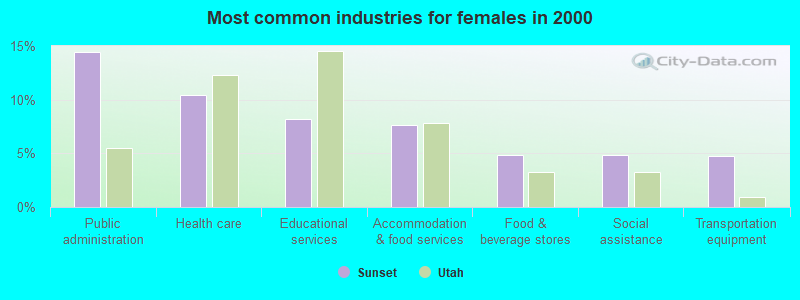
#67 on the list of "Top 101 cities with largest percentage of females in occupations: material moving occupations (population 5,000+)"
#2 on the list of "Top 101 counties with the lowest percentage of residents that smoked 100+ cigarettes in their lives"
#5 on the list of "Top 101 counties with the most Other congregations"
#7 on the list of "Top 101 counties with the highest number of births per 1000 residents 2007-2013"
#7 on the list of "Top 101 counties with the most Other adherents"
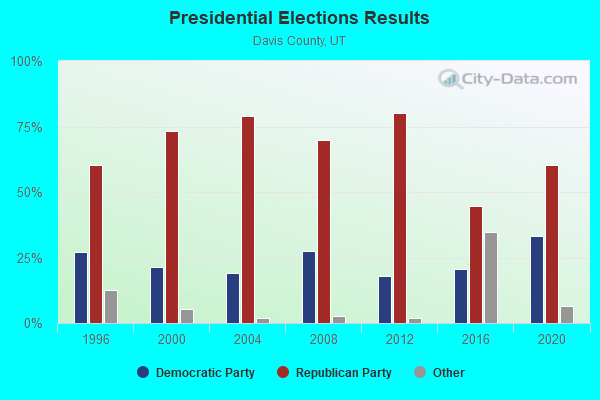
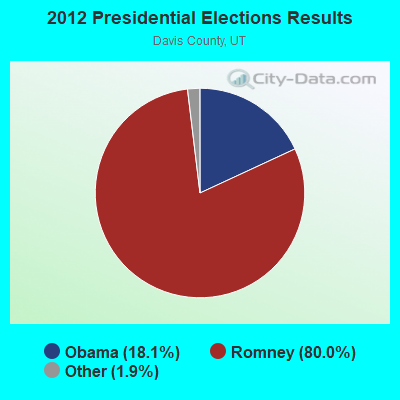
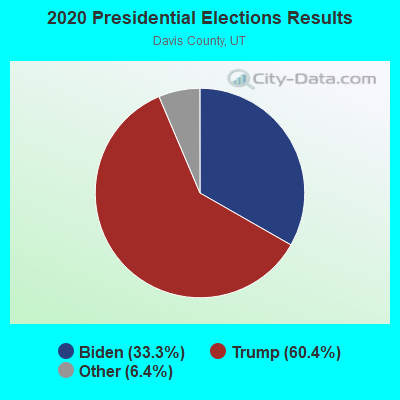
#12 on the list of "Top 101 counties with highest percentage of residents voting for Romney (Republican) in the 2012 Presidential Election (pop. 50,000+)"


 Recent articles from our blog. Our writers, many of them Ph.D. graduates or candidates, create easy-to-read articles on a wide variety of topics.

 , pop. 149,866).


 Based on the data from the years 2002 - 2018 the average number of fires per year is 18. The highest number of fires - 34 took place in 2003, and the least - 1 in 2004. The data has a growing trend.
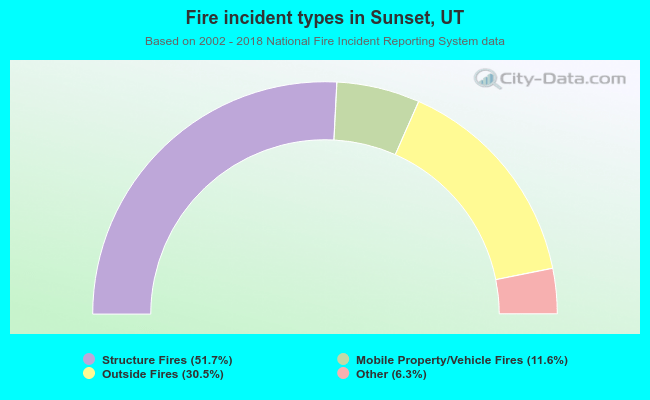 When looking into fire subcategories, the most reports belonged to: Structure Fires (51.7%), and Outside Fires (30.5%).