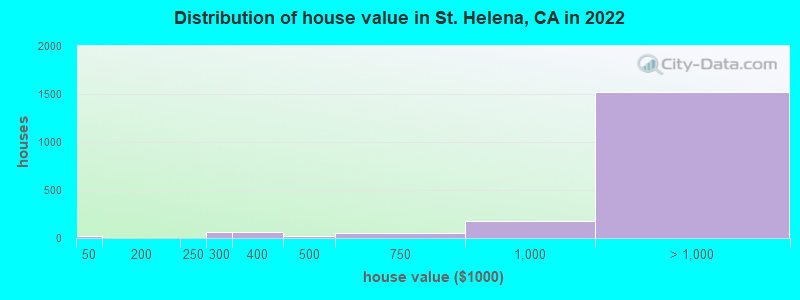
Estimated median house or condo value in 2022: over $1,000,000 (it was $434,000 in 2000)
St. Helena:
over $1,000,000
CA:
$715,900
Mean prices in 2022:all housing units: over $1,000,000; detached houses: over $1,000,000; townhouses or other attached units: $710,503; mobile homes: $329,223
Median gross rent in 2022: $1,875.
March 2022 cost of living index in St. Helena: 131.7 (high, U.S. average is 100)
Percentage of residents living in poverty in 2022: 5.7%
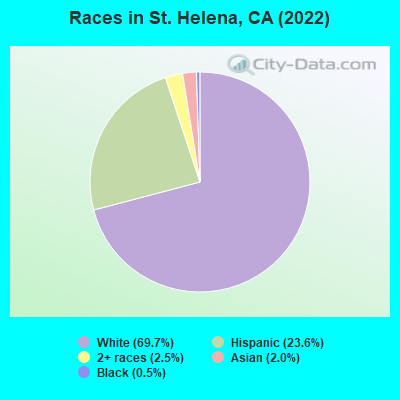
(4.3% for White Non-Hispanic residents, 81.5% for Black residents, 6.5% for Hispanic or Latino residents, 3.8% for other race residents, 10.6% for two or more races residents)
According to our research of California and other state lists, there were 3 registered sex offenders living in St. Helena, California as of May 09, 2024. The ratio of all residents to sex offenders in St. Helena is 2,017 to 1. The ratio of registered sex offenders to all residents in this city is much lower than the state average.
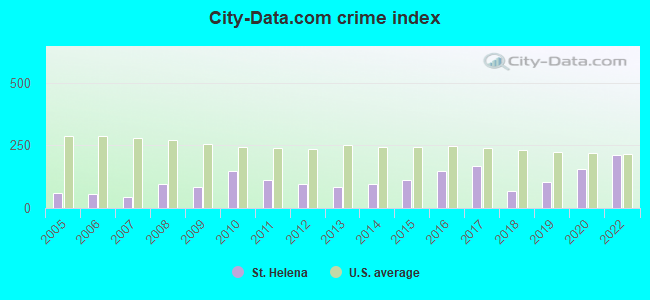
Crime rates in St. Helena by year
Type
2009
2010
2011
2012
2013
2014
2015
2016
2017
2018
2019
2020
2022
Murders (per 100,000)
0 (0.0)
0 (0.0)
0 (0.0)
0 (0.0)
0 (0.0)
0 (0.0)
0 (0.0)
0 (0.0)
0 (0.0)
0 (0.0)
0 (0.0)
0 (0.0)
0 (0.0)
Rapes (per 100,000)
0 (0.0)
0 (0.0)
1 (17.0)
1 (16.8)
0 (0.0)
2 (33.5)
1 (16.6)
2 (32.6)
5 (80.5)
0 (0.0)
1 (16.1)
4 (65.2)
8 (149.6)
Robberies (per 100,000)
0 (0.0)
2 (34.4)
0 (0.0)
0 (0.0)
0 (0.0)
2 (33.5)
0 (0.0)
1 (16.3)
1 (16.1)
1 (16.0)
1 (16.1)
1 (16.3)
1 (18.7)
Assaults (per 100,000)
4 (68.9)
10 (172.0)
3 (51.0)
2 (33.7)
6 (101.1)
2 (33.5)
8 (132.7)
6 (97.7)
5 (80.5)
8 (128.0)
10 (161.4)
7 (114.1)
6 (112.2)
Burglaries (per 100,000)
24 (413.6)
18 (309.6)
12 (204.0)
34 (572.5)
25 (421.3)
17 (284.4)
19 (315.2)
29 (472.2)
33 (531.4)
11 (176.0)
21 (339.0)
24 (391.3)
8 (149.6)
Thefts (per 100,000)
49 (844.4)
102 (1,754)
94 (1,598)
50 (841.9)
45 (758.3)
33 (552.0)
70 (1,161)
73 (1,189)
52 (837.4)
31 (495.9)
43 (694.1)
62 (1,011)
57 (1,066)
Auto thefts (per 100,000)
4 (68.9)
7 (120.4)
7 (119.0)
2 (33.7)
2 (33.7)
6 (100.4)
3 (49.8)
14 (227.9)
8 (128.8)
5 (80.0)
3 (48.4)
5 (81.5)
7 (130.9)
Arson (per 100,000)
0 (0.0)
0 (0.0)
1 (17.0)
0 (0.0)
0 (0.0)
0 (0.0)
0 (0.0)
3 (48.8)
2 (32.2)
1 (16.0)
0 (0.0)
1 (16.3)
0 (0.0)
City-Data.com crime index
82.0
146.2
111.5
96.6
82.7
93.5
112.3
149.3
166.3
68.9
105.4
154.2
211.3
The City-Data.com crime index weighs serious crimes and violent crimes more heavily. Higher means more crime, U.S. average is 246.1. It adjusts for the number of visitors and daily workers commuting into cities.
Ancestries: European (9.6%), Irish (8.8%), Italian (8.6%), English (6.6%), German (6.5%), French Canadian (4.2%).
Current Local Time: PST time zone
Elevation: 257 feet
Land area: 4.71 square miles.
Population density: 1,103 people per square mile (low).
1,454 residents are foreign born (14.8% Latin America, 4.3% Europe, 4.3% North America).
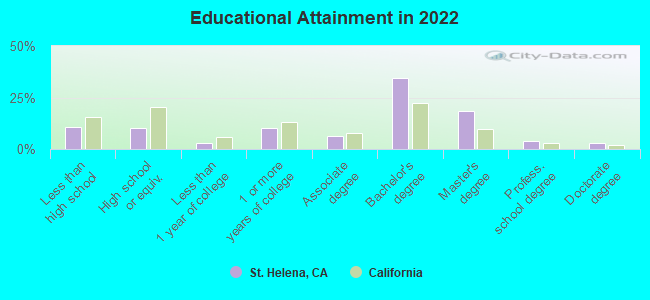
This city:
27.4%
California:
26.5%
Median real estate property taxes paid for housing units with mortgages in 2022: $8,364 (0.4%) Median real estate property taxes paid for housing units with no mortgage in 2022: $4,600 (0.3%)
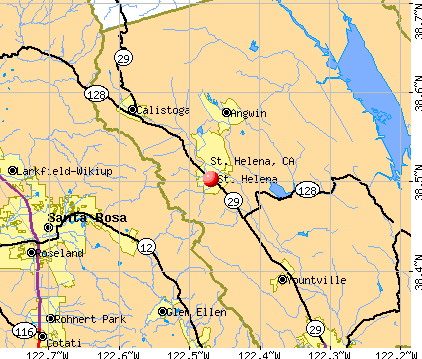
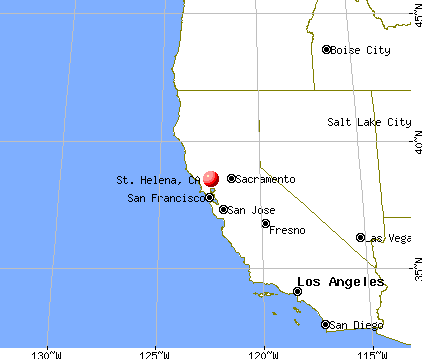
Nearest city with pop. 50,000+: Santa Rosa, CA (13.3 miles , pop. 147,595).
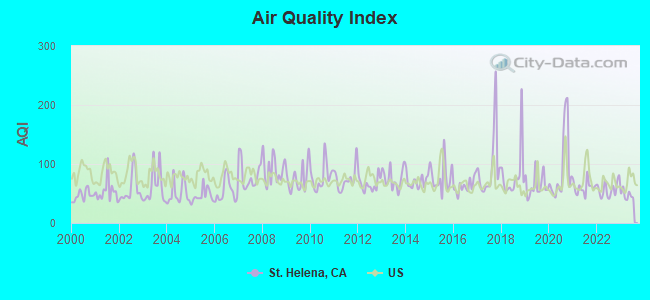
Air Quality Index (AQI) level in 2023 was 47.4. This is significantly better than average.
City:
47.4
U.S.:
72.6
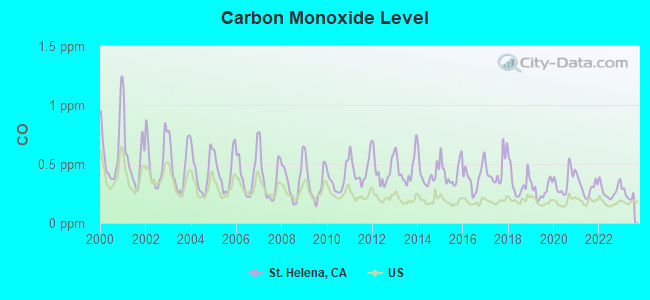
Carbon Monoxide (CO) [ppm] level in 2023 was 0.241. This is about average.Closest monitor was 13.7 miles away from the city center.
City:
0.241
U.S.:
0.251
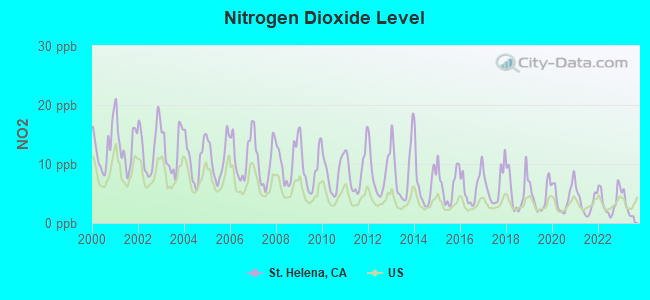
Nitrogen Dioxide (NO2) [ppb] level in 2023 was 2.89. This is significantly better than average.Closest monitor was 4.5 miles away from the city center.
City:
2.89
U.S.:
5.11
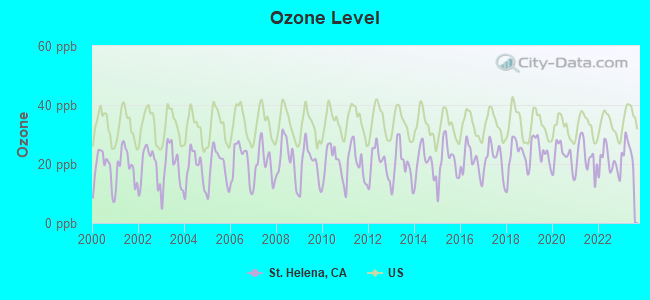
Ozone [ppb] level in 2023 was 24.7. This is better than average.Closest monitor was 4.5 miles away from the city center.
City:
24.7
U.S.:
33.3
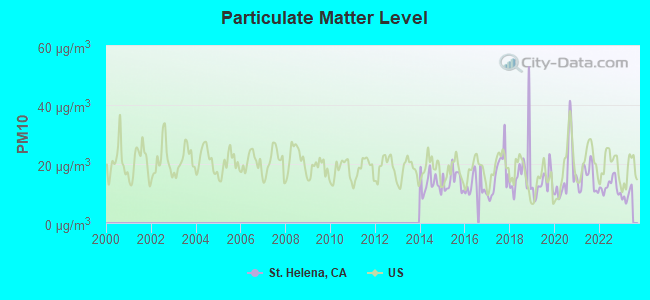
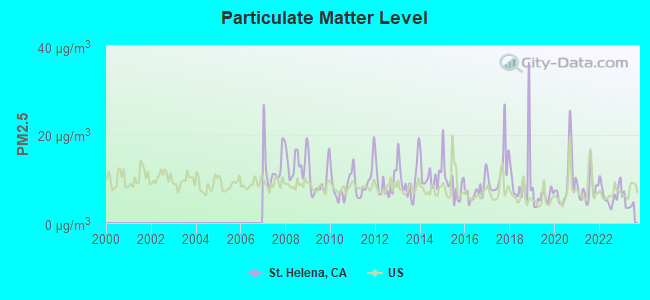
Particulate Matter (PM10) [µg/m3] level in 2022 was 12.5. This is significantly better than average.Closest monitor was 13.7 miles away from the city center.
City:
12.5
U.S.:
19.2
Particulate Matter (PM2.5) [µg/m3] level in 2023 was 4.56. This is significantly better than average.Closest monitor was 13.7 miles away from the city center.
City:
4.56
U.S.:
8.11
Earthquake activity:
St. Helena-area historical earthquake activity is significantly above California state average. It is 7537% greater than the overall U.S. average.
On 4/18/1906 at 13:12:21, a magnitude 7.9 (7.9 UK, Class: Major, Intensity: VIII - XII) earthquake occurred 45.2 miles away from St. Helena center, causing $524,000,000 total damage On 1/31/1922 at 13:17:28, a magnitude 7.6 (7.6 UK) earthquake occurred 223.8 miles away from St. Helena center On 10/18/1989 at 00:04:15, a magnitude 7.1 (6.5 MB, 7.1 MS, 6.9 MW, 7.0 ML) earthquake occurred 103.6 miles away from St. Helena center, causing 62 deaths (62 shaking deaths) and 3757 injuries, causing $1,305,032,704 total damage On 4/25/1992 at 18:06:04, a magnitude 7.2 (6.3 MB, 7.1 MS, 7.2 MW, 7.1 MW, Depth: 9.4 mi) earthquake occurred 153.7 miles away from St. Helena center, causing $75,000,000 total damage On 11/4/1927 at 13:51:53, a magnitude 7.5 (7.5 UK) earthquake occurred 260.7 miles away from the city center On 7/21/1952 at 11:52:14, a magnitude 7.7 (7.7 UK) earthquake occurred 309.3 miles away from St. Helena center, causing $50,000,000 total damage Magnitude types: body-wave magnitude (MB), local magnitude (ML), surface-wave magnitude (MS), moment magnitude (MW)
Natural disasters:
The number of natural disasters in Napa County (26) is a lot greater than the US average (15). Major Disasters (Presidential) Declared: 13 Emergencies Declared: 3
Causes of natural disasters: Floods: 15, Winter Storms: 9, Landslides: 7, Mudslides: 7, Storms: 6, Fires: 5, Earthquakes: 2, Drought: 1, Freeze: 1, Heavy Rain: 1, Hurricane: 1, Tornado: 1, Other: 1 (Note: some incidents may be assigned to more than one category).
Hospitals and medical centers near St. Helena:
CRESTWOOD GERIATRIC TREATMENT CTR (Nursing Home, about 4 miles away; ANGWIN, CA)
N M HOLDERMAN MEMORIAL HOSPITAL (Hospital, about 10 miles away; YOUNTVILLE, CA)
N M HOLDERMAN MEMORIAL HOSPITAL - SNF (Nursing Home, about 10 miles away; YOUNTVILLE, CA)
MONTE VERDE (Hospital, about 10 miles away; SANTA ROSA, CA)
SPRING LAKE VILLAGE (Nursing Home, about 10 miles away; SANTA ROSA, CA)
CALISTOGA HOUSE (Hospital, about 11 miles away; SANTA ROSA, CA)
SUTTER WARRACK HOSPITAL (Hospital, about 12 miles away; SANTA ROSA, CA)
15 miles: SANTA ROSA (175 RAILROAD ST.) - Bus Station . Services: fully wheelchair accessible, public restrooms, public payphones, full-service food facilities, free short-term parking, call for taxi service.
18 miles: NAPA (1275 MCKINSTRY ST.) - Bus Station . Services: fully wheelchair accessible, public payphones, free short-term parking, free long-term parking, call for taxi service.
18 miles: ROHNERT PARK (6480 REDWOOD DR.) - Bus Station . Services: fully wheelchair accessible, public restrooms, public payphones, full-service food facilities, free short-term parking, call for taxi service.
ST. HELENA PUBLIC LIBRARY (Operating income: $1,176,040; Location: 1492 LIBRARY LANE; 62,109 books; 7,061 e-books; 6,861 audio materials; 8,982 video materials; 23 other licensed databases; 174 print serial subscriptions)
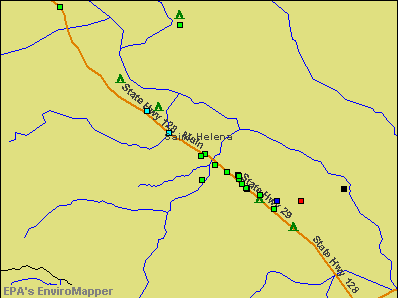
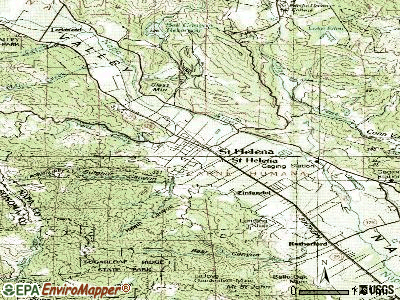
Notable locations in St. Helena: Louis Martini Vineyards (A), Forman Winery (B), Christian Brothers Winery (C), Charles Krug Winery (D), Beringer Brothers Winery (E), Silverado Museum (F), Saint Helena Public Library (G), Saint Helena City Hall (H), Saint Helena Fire Department (I). Display/hide their locations on the map
WINE COUNTRY INN (Population served: 35, Groundwater):
Past health violations:
MCL, Average - Between JUL-2009 and SEP-2009, Contaminant: Arsenic. Follow-up actions: St Violation/Reminder Notice (OCT-14-2009)
MCL, Monthly (TCR) - Between OCT-2007 and DEC-2007, Contaminant: Coliform. Follow-up actions: St Violation/Reminder Notice (DEC-07-2007)
MCL, Monthly (TCR) - Between OCT-2007 and DEC-2007, Contaminant: Coliform. Follow-up actions: St Violation/Reminder Notice (DEC-07-2007)
Drinking water stations with addresses in St. Helena that have no violations reported:
ROMBAUER VINEYARDS (Population served: 100,Primary Water Source Type: Groundwater)
WHITEHALL LANE WINERY (Population served: 100,Primary Water Source Type: Groundwater)
WHITE SULPHUR SPRINGS RESORT (Population served: 75,Primary Water Source Type: Groundwater)
NINE SUNS WINERY (Population served: 28,Primary Water Source Type: Groundwater)
FRANK FAMILY VINEYARDS (Population served: 25,Primary Water Source Type: Groundwater)
Average household size:
This city:
2.4 people
California:
2.9 people
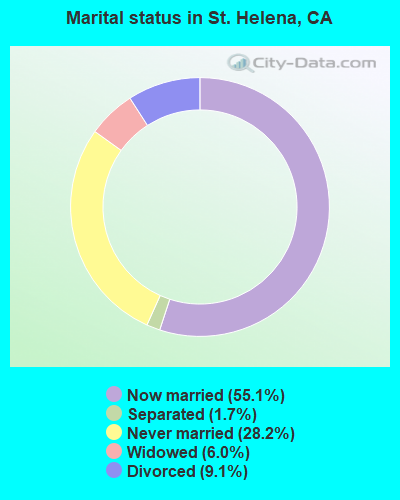
Percentage of family households:
This city:
60.0%
Whole state:
68.7%
Percentage of households with unmarried partners:
This city:
4.8%
Whole state:
7.2%
Likely homosexual households (counted as self-reported same-sex unmarried-partner households)
Lesbian couples: 0.4% of all households
Gay men: 0.4% of all households
98 people in college/university student housing in 2010
People in group quarters in St. Helena in 2000:
44 people in nursing homes
6 people in homes for the mentally ill
2 people in religious group quarters
Banks with branches in St. Helena (2011 data):
Bank of America, National Association: St. Helena Branch at 1001 Adams Street, branch established on 1927/02/19. Info updated 2009/11/18: Bank assets: $1,451,969.3 mil, Deposits: $1,077,176.8 mil, headquarters in Charlotte, NC, positive income, 5782 total offices, Holding Company: Bank Of America Corporation
Bank of the West: St. Helena Branch at 1451 Main Street, branch established on 1921/01/01. Info updated 2009/11/16: Bank assets: $62,408.3 mil, Deposits: $43,995.2 mil, headquarters in San Francisco, CA, positive income, 647 total offices, Holding Company: Bnp Paribas
Silicon Valley Bank: St. Helena Branch at 899 Adams Street, Suite G-2, branch established on 1998/03/02. Info updated 2006/11/03: Bank assets: $18,760.9 mil, Deposits: $16,815.1 mil, headquarters in Santa Clara, CA, positive income, Commercial Lending Specialization, 5 total offices, Holding Company: Svb Financial Group
Westamerica Bank: St. Helena Branch at 1000 Adams Street, branch established on 1980/11/18. Info updated 2011/06/21: Bank assets: $4,998.1 mil, Deposits: $4,253.2 mil, headquarters in San Rafael, CA, positive income, Commercial Lending Specialization, 98 total offices, Holding Company: Westamerica Bancorporation
Wells Fargo Bank, National Association: St. Helena Branch at 1107 Main Street, branch established on 1963/10/11. Info updated 2011/04/05: Bank assets: $1,161,490.0 mil, Deposits: $905,653.0 mil, headquarters in Sioux Falls, SD, positive income, 6395 total offices, Holding Company: Wells Fargo & Company
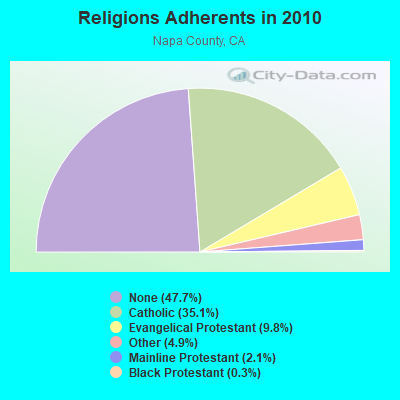
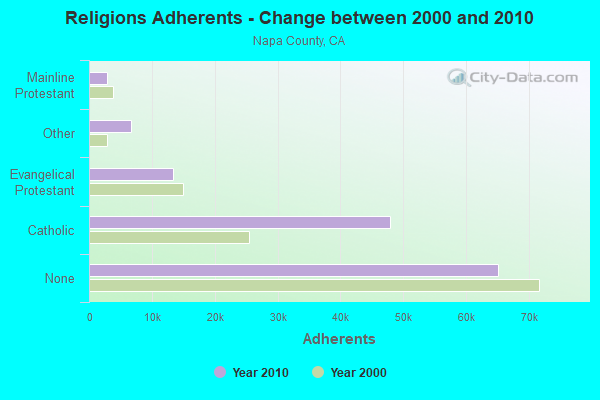
Religion statistics for St. Helena, CA (based on Napa County data)
Religion
Adherents
Congregations
Catholic
47,968
8
Evangelical Protestant
13,323
55
Other
6,725
20
Mainline Protestant
2,923
14
Black Protestant
364
2
Orthodox
80
2
None
65,101
-
Source: Clifford Grammich, Kirk Hadaway, Richard Houseal, Dale E.Jones, Alexei Krindatch, Richie Stanley and Richard H.Taylor. 2012. 2010 U.S.Religion Census: Religious Congregations & Membership Study. Association of Statisticians of American Religious Bodies. Jones, Dale E., et al. 2002. Congregations and Membership in the United States 2000. Nashville, TN: Glenmary Research Center. Graphs represent county-level data
Mt. St. Helena 3 Miles S.W. Of (Lat: 38.669333 Lon: -122.631639), Overall height: 17.7 m, Call Sign: KMB305, Assigned Frequencies: 931.962 MHz, 931.737 MHz, 931.062 MHz, Grant Date: 04/23/2019, Expiration Date: 04/01/2029, Certifier: J. Roy Pottle, Registrant: Wilkinson Barker Knauer, LLP, 1800 M Street, N.W., Suite 800n, Washington, DC 20036, Phone: (202) 783-4141, Fax: (202) 783-5851, Email:
Mt. St Helena, 3 Miles S.W. Of (Lat: 38.669333 Lon: -122.631639), Overall height: 20.7 m, Call Sign: KNKK816, Licensee ID: L00129894, Assigned Frequencies: 931.987 MHz, Grant Date: 05/11/1999, Expiration Date: 04/01/2009, Cancellation Date: 02/07/2005, Certifier: Erik Young, Registrant: Verizon Wireless (Vaw) LLC
FCC Registered Amateur Radio Licenses:
6
Call Sign: KB0LHO, Licensee ID: L00876172, Grant Date: 06/11/2004, Expiration Date: 06/11/2014, Cancellation Date: 06/14/2016, Registrant: Basil G Tenold, 727 Hunt Ave. #46, St. Helena, CA 94574
Call Sign: N6TXH, Licensee ID: L01431622, Grant Date: 09/17/2008, Expiration Date: 11/04/2018, Cancellation Date: 11/05/2020, Registrant: Robert L Hancock Jr, 1831 Crinella Dr., St. Helena, CA 94574
Call Sign: AG6MM, Previous Call Sign: AD4MT, Licensee ID: L00715996, Grant Date: 12/02/2011, Expiration Date: 12/02/2021, Cancellation Date: 12/18/2015, Certifier: Stuart I Clark, Registrant: Stuart I Clark, 1979 Sulphur Springs Ave., St. Helena, CA 94574
Call Sign: WA6BTK, Previous Call Sign: AG6MM, Licensee ID: L00715996, Grant Date: 12/18/2015, Expiration Date: 12/18/2025, Cancellation Date: 10/29/2019, Certifier: Stuart I Clark, Registrant: Stuart I Clark, 1979 Sulphur Springs Ave., St. Helena, CA 94574
Call Sign: KM6JQT, Licensee ID: L02093976, Grant Date: 03/31/2017, Expiration Date: 03/31/2027, Certifier: Louise A Warnock, Registrant: Louise A Warnock, 1807 Crinella, St. Helena, CA 94574
Call Sign: K6WBY, Previous Call Sign: KN6MEB, Licensee ID: L02392920, Grant Date: 03/15/2022, Expiration Date: 03/15/2032, Certifier: David Capponi, Registrant: David J Capponi 287, 270 Pope Street, St. Helena, CA 94574
Home Mortgage Disclosure Act Aggregated Statistics For Year 2009 (Based on 1 full tract)
A) FHA, FSA/RHS & VA Home Purchase Loans
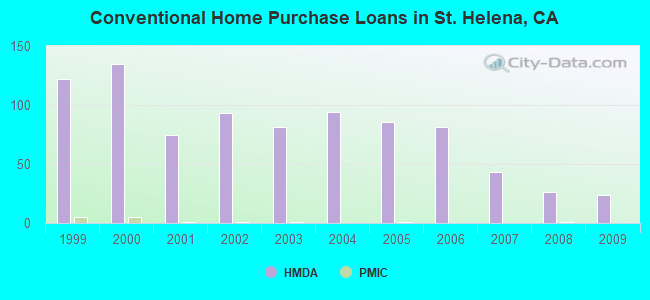
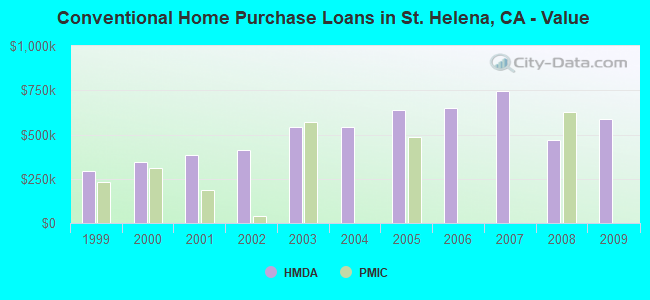
B) Conventional Home Purchase Loans
C) Refinancings
D) Home Improvement Loans
E) Loans on Dwellings For 5+ Families
F) Non-occupant Loans on < 5 Family Dwellings (A B C & D)
G) Loans On Manufactured Home Dwelling (A B C & D)
Number
Average Value
Number
Average Value
Number
Average Value
Number
Average Value
Number
Average Value
Number
Average Value
Number
Average Value
LOANS ORIGINATED
5
$489,562
24
$585,945
159
$448,002
8
$229,076
3
$672,457
32
$419,485
1
$39,950
APPLICATIONS APPROVED, NOT ACCEPTED
1
$296,610
3
$287,960
23
$384,934
0
$0
0
$0
6
$316,920
1
$149,810
APPLICATIONS DENIED
1
$558,270
4
$281,632
46
$506,167
1
$9,990
0
$0
10
$595,025
2
$138,320
APPLICATIONS WITHDRAWN
0
$0
3
$356,203
34
$646,218
3
$170,113
0
$0
9
$1,224,517
0
$0
FILES CLOSED FOR INCOMPLETENESS
0
$0
0
$0
7
$594,369
0
$0
0
$0
0
$0
0
$0
Aggregated Statistics For Year 2008 (Based on 1 full tract)
A) FHA, FSA/RHS & VA Home Purchase Loans
B) Conventional Home Purchase Loans
C) Refinancings
D) Home Improvement Loans
E) Loans on Dwellings For 5+ Families
F) Non-occupant Loans on < 5 Family Dwellings (A B C & D)
G) Loans On Manufactured Home Dwelling (A B C & D)
Number
Average Value
Number
Average Value
Number
Average Value
Number
Average Value
Number
Average Value
Number
Average Value
Number
Average Value
LOANS ORIGINATED
1
$403,470
26
$467,507
72
$497,977
2
$404,475
1
$459,400
26
$546,712
3
$68,910
APPLICATIONS APPROVED, NOT ACCEPTED
0
$0
3
$243,683
16
$535,366
0
$0
0
$0
7
$428,870
1
$139,820
APPLICATIONS DENIED
1
$547,290
4
$311,345
36
$453,659
4
$275,890
1
$1,120,540
8
$510,336
7
$85,317
APPLICATIONS WITHDRAWN
0
$0
2
$516,825
19
$446,208
1
$7,990
0
$0
10
$433,536
0
$0
FILES CLOSED FOR INCOMPLETENESS
0
$0
1
$599,220
9
$522,320
1
$99,870
0
$0
5
$317,386
0
$0
Aggregated Statistics For Year 2007 (Based on 1 full tract)
B) Conventional Home Purchase Loans
C) Refinancings
D) Home Improvement Loans
F) Non-occupant Loans on < 5 Family Dwellings (A B C & D)
G) Loans On Manufactured Home Dwelling (A B C & D)
Number
Average Value
Number
Average Value
Number
Average Value
Number
Average Value
Number
Average Value
LOANS ORIGINATED
43
$748,584
123
$563,527
14
$220,570
47
$574,486
4
$75,652
APPLICATIONS APPROVED, NOT ACCEPTED
9
$511,112
15
$560,937
2
$570,755
6
$712,905
0
$0
APPLICATIONS DENIED
14
$448,773
40
$456,656
12
$148,972
8
$576,000
21
$147,570
APPLICATIONS WITHDRAWN
7
$705,796
29
$505,928
1
$69,910
8
$723,559
0
$0
FILES CLOSED FOR INCOMPLETENESS
0
$0
12
$751,355
0
$0
4
$581,492
0
$0
Aggregated Statistics For Year 2006 (Based on 1 full tract)
A) FHA, FSA/RHS & VA Home Purchase Loans
B) Conventional Home Purchase Loans
C) Refinancings
D) Home Improvement Loans
E) Loans on Dwellings For 5+ Families
F) Non-occupant Loans on < 5 Family Dwellings (A B C & D)
G) Loans On Manufactured Home Dwelling (A B C & D)
Number
Average Value
Number
Average Value
Number
Average Value
Number
Average Value
Number
Average Value
Number
Average Value
Number
Average Value
LOANS ORIGINATED
1
$151,800
81
$648,378
149
$592,082
23
$498,829
6
$824,760
65
$621,775
5
$119,244
APPLICATIONS APPROVED, NOT ACCEPTED
0
$0
14
$546,004
18
$492,248
4
$440,428
0
$0
7
$468,961
3
$104,863
APPLICATIONS DENIED
0
$0
23
$442,685
29
$478,894
4
$174,022
0
$0
11
$543,746
7
$149,663
APPLICATIONS WITHDRAWN
0
$0
8
$393,362
28
$591,979
3
$131,497
0
$0
4
$424,448
0
$0
FILES CLOSED FOR INCOMPLETENESS
0
$0
2
$507,340
8
$570,258
0
$0
0
$0
1
$335,560
0
$0
Aggregated Statistics For Year 2005 (Based on 1 full tract)
B) Conventional Home Purchase Loans
C) Refinancings
D) Home Improvement Loans
E) Loans on Dwellings For 5+ Families
F) Non-occupant Loans on < 5 Family Dwellings (A B C & D)
G) Loans On Manufactured Home Dwelling (A B C & D)
Number
Average Value
Number
Average Value
Number
Average Value
Number
Average Value
Number
Average Value
Number
Average Value
LOANS ORIGINATED
86
$637,403
164
$581,158
25
$394,407
1
$559,270
62
$597,754
5
$102,266
APPLICATIONS APPROVED, NOT ACCEPTED
14
$604,570
25
$400,519
0
$0
0
$0
7
$685,679
1
$70,910
APPLICATIONS DENIED
24
$570,258
34
$436,314
11
$635,445
1
$998,700
13
$624,188
3
$68,577
APPLICATIONS WITHDRAWN
16
$617,197
27
$661,066
6
$348,213
0
$0
10
$462,897
1
$103,860
FILES CLOSED FOR INCOMPLETENESS
3
$508,007
16
$481,935
0
$0
0
$0
2
$547,290
0
$0
Aggregated Statistics For Year 2004 (Based on 1 full tract)
B) Conventional Home Purchase Loans
C) Refinancings
D) Home Improvement Loans
E) Loans on Dwellings For 5+ Families
F) Non-occupant Loans on < 5 Family Dwellings (A B C & D)
G) Loans On Manufactured Home Dwelling (A B C & D)
Number
Average Value
Number
Average Value
Number
Average Value
Number
Average Value
Number
Average Value
Number
Average Value
LOANS ORIGINATED
94
$540,817
200
$468,086
20
$230,550
2
$1,288,325
61
$509,779
8
$107,860
APPLICATIONS APPROVED, NOT ACCEPTED
12
$652,234
19
$389,177
0
$0
1
$499,350
4
$1,262,855
0
$0
APPLICATIONS DENIED
14
$456,905
44
$388,177
3
$261,327
0
$0
9
$455,962
5
$176,170
APPLICATIONS WITHDRAWN
14
$414,674
22
$831,100
3
$48,270
0
$0
9
$1,045,750
1
$119,840
FILES CLOSED FOR INCOMPLETENESS
0
$0
18
$337,727
1
$3,645,260
0
$0
0
$0
0
$0
Aggregated Statistics For Year 2003 (Based on 1 full tract)
B) Conventional Home Purchase Loans
C) Refinancings
D) Home Improvement Loans
E) Loans on Dwellings For 5+ Families
F) Non-occupant Loans on < 5 Family Dwellings (A B C & D)
Number
Average Value
Number
Average Value
Number
Average Value
Number
Average Value
Number
Average Value
LOANS ORIGINATED
81
$541,209
503
$372,434
3
$217,383
1
$554,280
101
$401,468
APPLICATIONS APPROVED, NOT ACCEPTED
6
$693,763
54
$356,906
3
$169,780
0
$0
6
$296,282
APPLICATIONS DENIED
16
$423,636
61
$403,491
7
$57,781
0
$0
7
$394,344
APPLICATIONS WITHDRAWN
14
$475,881
69
$349,921
2
$80,395
0
$0
15
$351,942
FILES CLOSED FOR INCOMPLETENESS
0
$0
10
$394,287
0
$0
0
$0
2
$314,590
Aggregated Statistics For Year 2002 (Based on 1 full tract)
A) FHA, FSA/RHS & VA Home Purchase Loans
B) Conventional Home Purchase Loans
C) Refinancings
D) Home Improvement Loans
E) Loans on Dwellings For 5+ Families
F) Non-occupant Loans on < 5 Family Dwellings (A B C & D)
Number
Average Value
Number
Average Value
Number
Average Value
Number
Average Value
Number
Average Value
Number
Average Value
LOANS ORIGINATED
0
$0
93
$411,711
333
$380,265
7
$216,719
5
$1,101,366
77
$372,372
APPLICATIONS APPROVED, NOT ACCEPTED
0
$0
19
$371,937
30
$323,845
2
$117,345
0
$0
5
$347,948
APPLICATIONS DENIED
0
$0
15
$423,715
41
$270,355
2
$74,905
0
$0
14
$379,720
APPLICATIONS WITHDRAWN
1
$197,740
9
$353,318
48
$348,109
4
$139,070
0
$0
4
$306,850
FILES CLOSED FOR INCOMPLETENESS
0
$0
0
$0
8
$283,006
0
$0
0
$0
1
$299,610
Aggregated Statistics For Year 2001 (Based on 1 full tract)
A) FHA, FSA/RHS & VA Home Purchase Loans
B) Conventional Home Purchase Loans
C) Refinancings
D) Home Improvement Loans
E) Loans on Dwellings For 5+ Families
F) Non-occupant Loans on < 5 Family Dwellings (A B C & D)
Number
Average Value
Number
Average Value
Number
Average Value
Number
Average Value
Number
Average Value
Number
Average Value
LOANS ORIGINATED
1
$230,700
75
$382,888
279
$356,565
35
$67,769
0
$0
52
$320,410
APPLICATIONS APPROVED, NOT ACCEPTED
0
$0
10
$230,600
25
$305,283
4
$54,928
1
$558,270
4
$216,718
APPLICATIONS DENIED
0
$0
23
$279,766
53
$350,412
5
$28,962
0
$0
6
$213,888
APPLICATIONS WITHDRAWN
0
$0
14
$397,625
43
$298,170
3
$10,653
0
$0
9
$306,379
FILES CLOSED FOR INCOMPLETENESS
0
$0
3
$282,963
10
$244,382
0
$0
0
$0
2
$216,220
Aggregated Statistics For Year 2000 (Based on 1 full tract)
A) FHA, FSA/RHS & VA Home Purchase Loans
B) Conventional Home Purchase Loans
C) Refinancings
D) Home Improvement Loans
E) Loans on Dwellings For 5+ Families
F) Non-occupant Loans on < 5 Family Dwellings (A B C & D)
Number
Average Value
Number
Average Value
Number
Average Value
Number
Average Value
Number
Average Value
Number
Average Value
LOANS ORIGINATED
1
$183,760
135
$342,554
69
$326,242
18
$87,941
0
$0
46
$274,708
APPLICATIONS APPROVED, NOT ACCEPTED
0
$0
29
$361,598
14
$497,495
4
$128,583
1
$409,470
8
$411,839
APPLICATIONS DENIED
0
$0
25
$276,081
20
$291,820
7
$110,143
1
$315,590
3
$193,413
APPLICATIONS WITHDRAWN
0
$0
18
$315,534
19
$151,645
3
$71,240
0
$0
8
$363,278
FILES CLOSED FOR INCOMPLETENESS
0
$0
5
$441,626
8
$192,624
1
$659,140
0
$0
2
$267,650
Aggregated Statistics For Year 1999 (Based on 1 partial tract)
A) FHA, FSA/RHS & VA Home Purchase Loans
B) Conventional Home Purchase Loans
C) Refinancings
D) Home Improvement Loans
E) Loans on Dwellings For 5+ Families
F) Non-occupant Loans on < 5 Family Dwellings (A B C & D)
Detailed PMIC statistics for the following Tracts:2016.00
2005 - 2011 National Fire Incident Reporting System (NFIRS) incidents
Based on the data from the years 2005 - 2011 the average number of fire incidents per year is 24. The highest number of reported fire incidents - 40 took place in 2011, and the least - 2 in 2010. The data has a rising trend.
When looking into fire subcategories, the most reports belonged to: Structure Fires (34.3%), and Outside Fires (34.3%).
Fire incident types reported to NFIRS in St. Helena, CA
#8 on the list of "Top 101 cities with largest percentage of females in occupations: installation, maintenance, and repair occupations (population 5,000+)"
#24 on the list of "Top 100 cities with highest ratio of median house value to median household income (pop. 5,000+)"
#83 on the list of "Top 100 cities with highest median house value (pop. 5,000+)"
#93 on the list of "Top 101 cities with largest percentage of males in occupations: community and social service occupations (population 5,000+)"
#12 on the list of "Top 101 counties with the highest Particulate Matter (PM2.5) Annual air pollution readings in 2012 (µg/m3)"
#18 on the list of "Top 101 counties with the highest Nitrogen Dioxide air pollution readings in 2012 (ppm)"
#40 on the list of "Top 101 counties with the largest decrease in the number of deaths per 1000 residents 2000-2006 to 2007-2013 (pop. 50,000+)"
#55 on the list of "Top 101 counties with the lowest percentage of residents relocating from foreign countries between 2010 and 2011 (pop. 50,000+)"
#56 on the list of "Top 101 counties with the lowest Ozone (1-hour) air pollution readings in 2012 (ppm)"


 Recent articles from our blog. Our writers, many of them Ph.D. graduates or candidates, create easy-to-read articles on a wide variety of topics.

 (13.3 miles

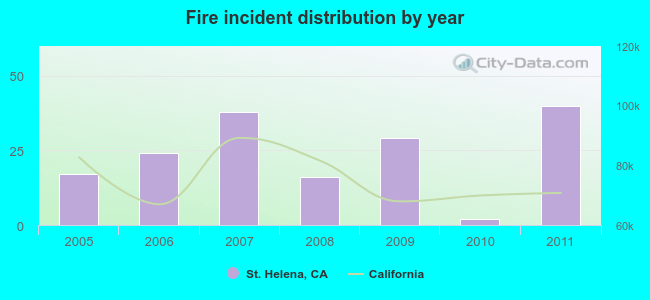 Based on the data from the years 2005 - 2011 the average number of fire incidents per year is 24. The highest number of reported fire incidents - 40 took place in 2011, and the least - 2 in 2010. The data has a rising trend.
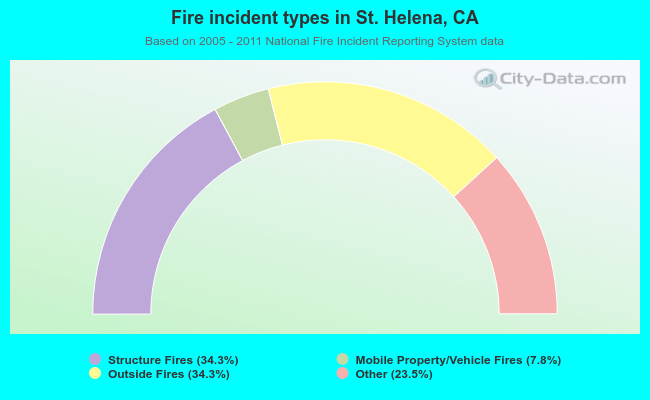 When looking into fire subcategories, the most reports belonged to: Structure Fires (34.3%), and Outside Fires (34.3%).