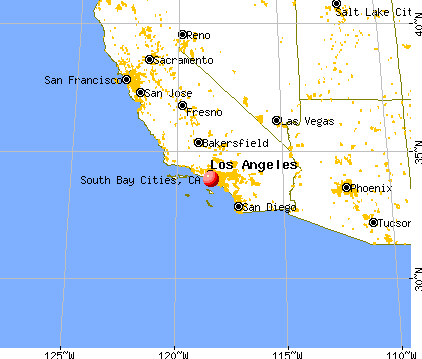
South Bay Cities, California
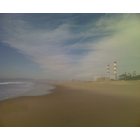
South Bay Cities: El Segundo, Ca. looking north from "Hamerland" .
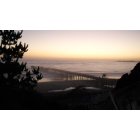
South Bay Cities: Santa Cruz
- add
your
Submit your own pictures of this place and show them to the world
- OSM Map
- General Map
- Google Map
- MSN Map
| Males: 68,077 | |
| Females: 66,286 |
| Median resident age: | 36.4 years |
| California median age: | 33.3 years |
Zip code: 90266
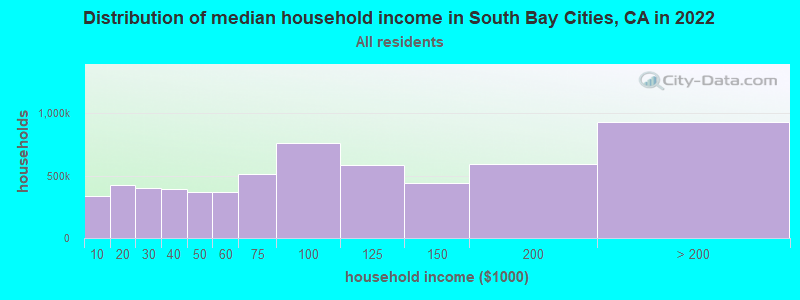
| South Bay Cities: | $147,932 |
| CA: | $91,551 |
Estimated per capita income in 2022: $95,837 (it was $45,915 in 2000)
South Bay Cities CCD income, earnings, and wages data
Estimated median house or condo value in 2022: over $1,000,000 (it was $420,000 in 2000)
| South Bay Cities: | over $1,000,000 |
| CA: | $715,900 |
Mean prices in 2022: all housing units: over $1,000,000; detached houses: over $1,000,000; townhouses or other attached units: $750,854; in 2-unit structures: over $1,000,000; in 3-to-4-unit structures: $791,642; in 5-or-more-unit structures: $738,503; mobile homes: $205,184; occupied boats, rvs, vans, etc.: $276,239
South Bay Cities, CA residents, houses, and apartments details
Detailed information about poverty and poor residents in South Bay Cities, CA


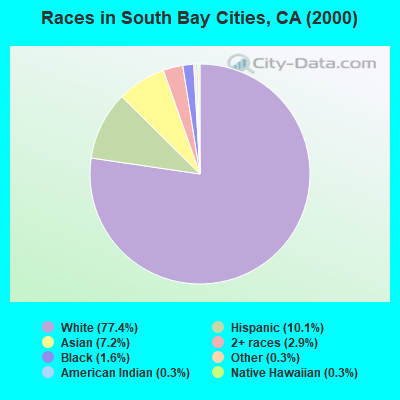
- 101,91077.4%White alone
- 13,29810.1%Hispanic
- 9,5227.2%Asian alone
- 3,8562.9%Two or more races
- 2,0591.6%Black alone
- 3340.3%American Indian alone
- 3310.3%Native Hawaiian and Other
Pacific Islander alone - 4020.3%Other race alone
 Recent articles from our blog. Our writers, many of them Ph.D. graduates or candidates, create easy-to-read articles on a wide variety of topics.
Current Local Time: PST time zone
Land area: 17.2 square miles.
Population density: 7,818 people per square mile (high).
| South Bay Cities CCD: | 0.7% ($2,922) |
| California: | 0.8% ($1,564) |
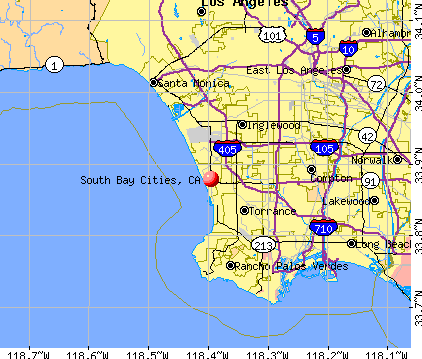
Nearest city with pop. 200,000+: Los Angeles, CA  (14.4 miles , pop. 3,694,820).
Nearest cities:
), Latitude: 33.88 N, Longitude: 118.40 W
Area code commonly used in this area: 310

| Here: | 5.0% |
| California: | 5.1% |
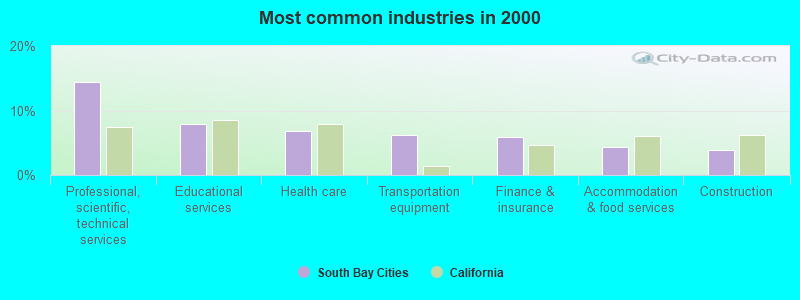
- Professional, scientific, technical services (14.4%)
- Educational services (7.8%)
- Health care (6.9%)
- Transportation equipment (6.2%)
- Finance & insurance (5.9%)
- Accommodation & food services (4.4%)
- Construction (3.9%)
- Professional, scientific, technical services (15.4%)
- Transportation equipment (7.5%)
- Construction (6.2%)
- Finance & insurance (6.0%)
- Educational services (4.6%)
- Accommodation & food services (4.2%)
- Health care (4.1%)
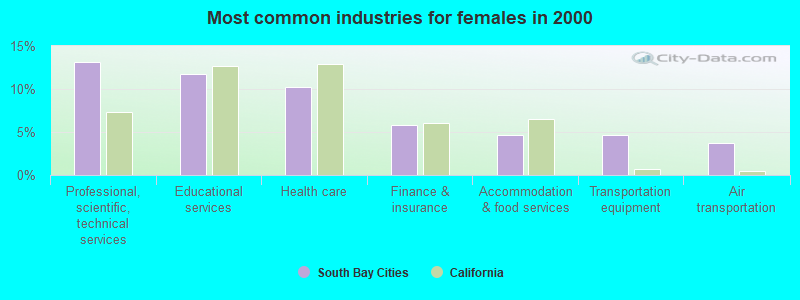
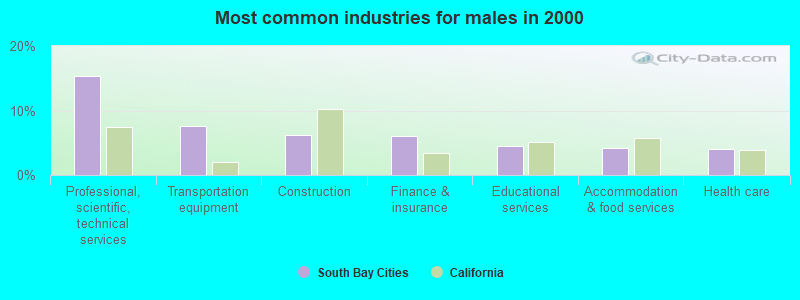
- Professional, scientific, technical services (13.1%)
- Educational services (11.8%)
- Health care (10.3%)
- Finance & insurance (5.8%)
- Accommodation & food services (4.6%)
- Transportation equipment (4.6%)
- Air transportation (3.7%)
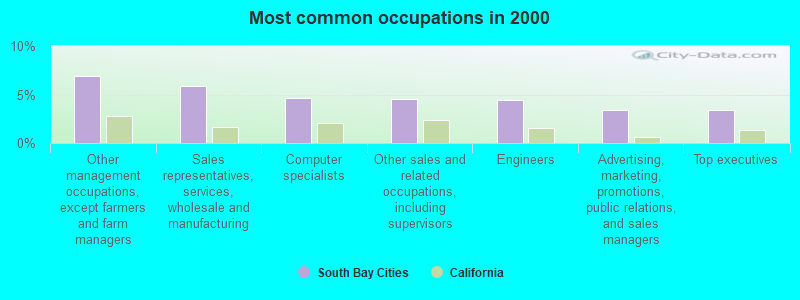
- Other management occupations, except farmers and farm managers (6.9%)
- Sales representatives, services, wholesale and manufacturing (5.9%)
- Computer specialists (4.6%)
- Other sales and related occupations, including supervisors (4.5%)
- Engineers (4.5%)
- Advertising, marketing, promotions, public relations, and sales managers (3.4%)
- Top executives (3.4%)
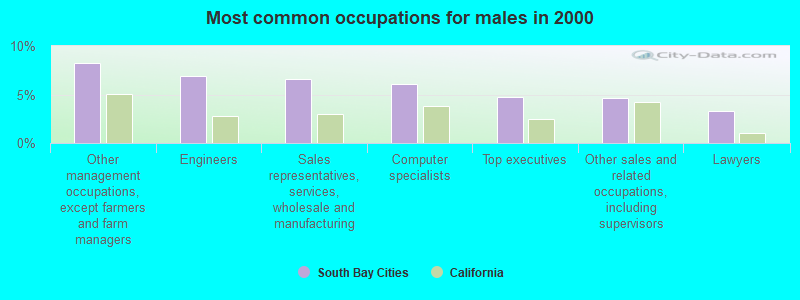
- Other management occupations, except farmers and farm managers (8.2%)
- Engineers (6.9%)
- Sales representatives, services, wholesale and manufacturing (6.5%)
- Computer specialists (6.1%)
- Top executives (4.7%)
- Other sales and related occupations, including supervisors (4.7%)
- Lawyers (3.3%)
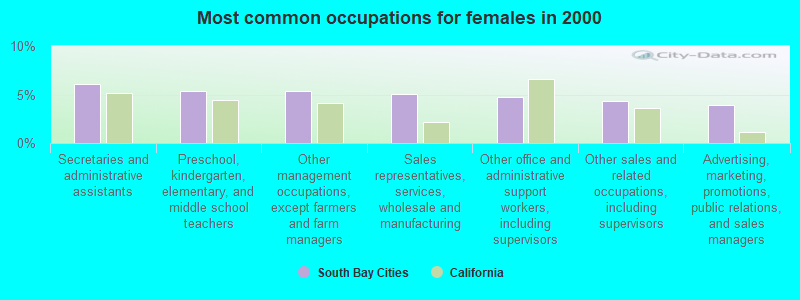
- Secretaries and administrative assistants (6.0%)
- Preschool, kindergarten, elementary, and middle school teachers (5.4%)
- Other management occupations, except farmers and farm managers (5.3%)
- Sales representatives, services, wholesale and manufacturing (5.1%)
- Other office and administrative support workers, including supervisors (4.7%)
- Other sales and related occupations, including supervisors (4.3%)
- Advertising, marketing, promotions, public relations, and sales managers (3.9%)
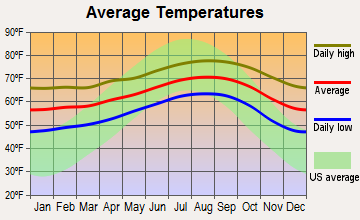
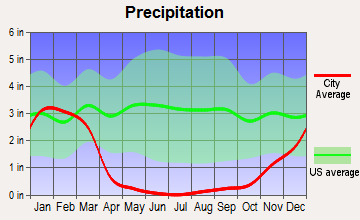
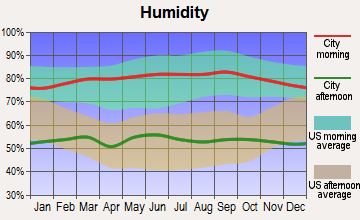
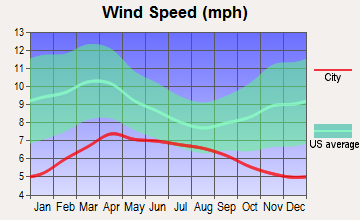
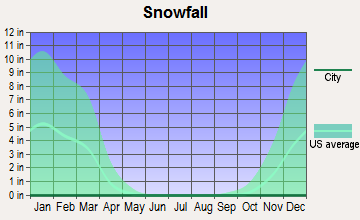
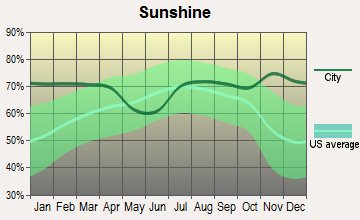
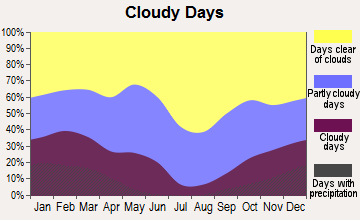
Average climate in South Bay Cities, California
Based on data reported by over 4,000 weather stations
(lower is better)
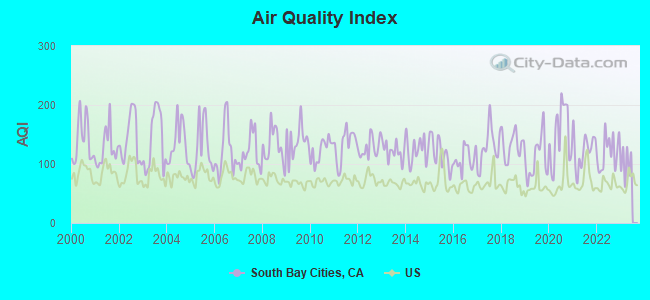
Air Quality Index (AQI) level in 2022 was 120. This is significantly worse than average.
| City: | 120 |
| U.S.: | 73 |
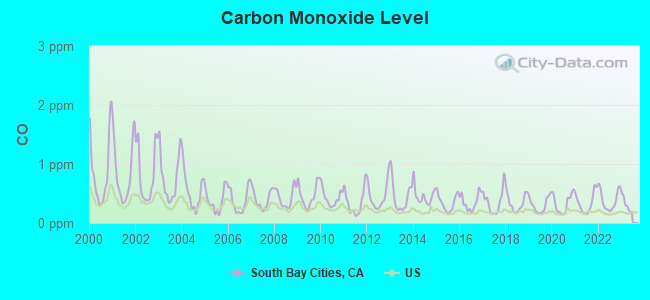
Carbon Monoxide (CO) [ppm] level in 2022 was 0.388. This is significantly worse than average. Closest monitor was 3.4 miles away from the city center.
| City: | 0.388 |
| U.S.: | 0.251 |
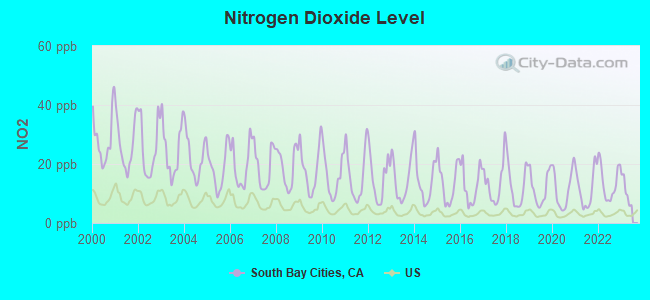
Nitrogen Dioxide (NO2) [ppb] level in 2022 was 13.7. This is significantly worse than average. Closest monitor was 3.4 miles away from the city center.
| City: | 13.7 |
| U.S.: | 5.1 |
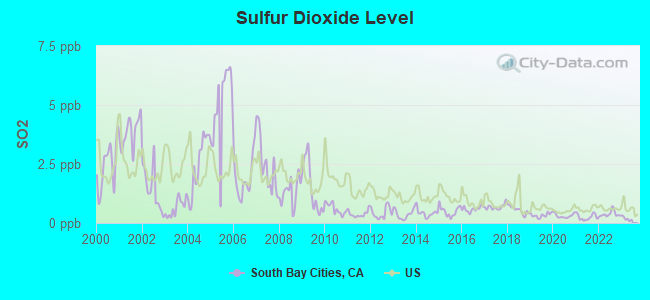
Sulfur Dioxide (SO2) [ppb] level in 2022 was 0.378. This is significantly better than average. Closest monitor was 1.6 miles away from the city center.
| City: | 0.378 |
| U.S.: | 1.515 |
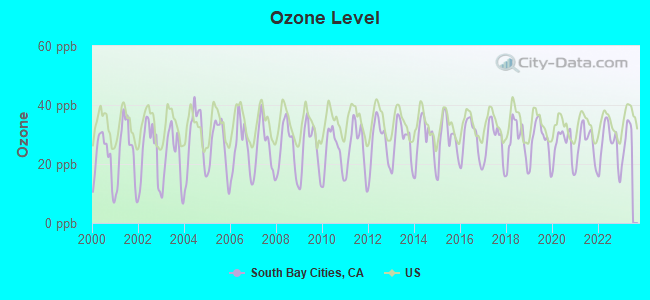
Ozone [ppb] level in 2022 was 26.5. This is better than average. Closest monitor was 3.4 miles away from the city center.
| City: | 26.5 |
| U.S.: | 33.3 |
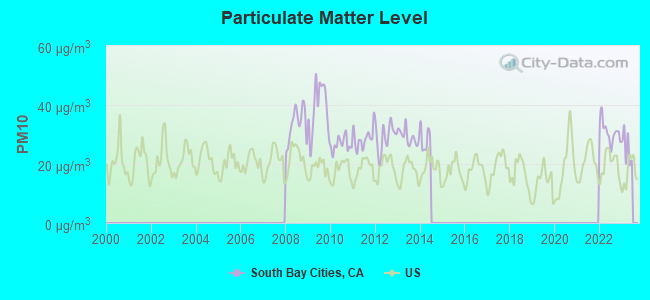
Particulate Matter (PM10) [µg/m3] level in 2022 was 30.9. This is significantly worse than average. Closest monitor was 3.4 miles away from the city center.
| City: | 30.9 |
| U.S.: | 19.2 |
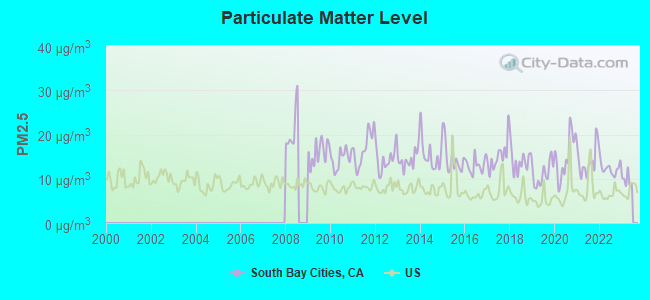
Particulate Matter (PM2.5) [µg/m3] level in 2022 was 12.4. This is significantly worse than average. Closest monitor was 11.1 miles away from the city center.
| City: | 12.4 |
| U.S.: | 8.1 |
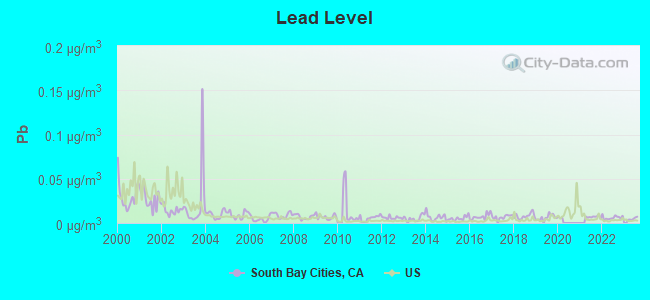
Lead (Pb) [µg/m3] level in 2022 was 0.00604. This is significantly better than average. Closest monitor was 3.4 miles away from the city center.
| City: | 0.00604 |
| U.S.: | 0.00931 |
Earthquake activity:
South Bay Cities-area historical earthquake activity is significantly above California state average. It is 6738% greater than the overall U.S. average.On 7/21/1952 at 11:52:14, a magnitude 7.7 (7.7 UK, Class: Major, Intensity: VIII - XII) earthquake occurred 84.9 miles away from the city center, causing $50,000,000 total damage
On 6/28/1992 at 11:57:34, a magnitude 7.6 (6.2 MB, 7.6 MS, 7.3 MW, Depth: 0.7 mi) earthquake occurred 108.9 miles away from the city center, causing 3 deaths (1 shaking deaths, 2 other deaths) and 400 injuries, causing $100,000,000 total damage and $40,000,000 insured losses
On 10/16/1999 at 09:46:44, a magnitude 7.4 (6.3 MB, 7.4 MS, 7.2 MW, 7.3 ML) earthquake occurred 120.5 miles away from South Bay Cities center
On 11/4/1927 at 13:51:53, a magnitude 7.5 (7.5 UK) earthquake occurred 166.6 miles away from the city center
On 1/17/1994 at 12:30:55, a magnitude 6.8 (6.4 MB, 6.8 MS, 6.7 MW, Depth: 11.4 mi, Class: Strong, Intensity: VII - IX) earthquake occurred 21.8 miles away from the city center, causing 60 deaths (60 shaking deaths) and 7000 injuries
On 4/21/1918 at 22:32:30, a magnitude 6.8 (6.8 UK) earthquake occurred 55.1 miles away from the city center
Magnitude types: body-wave magnitude (MB), local magnitude (ML), surface-wave magnitude (MS), moment magnitude (MW)
Natural disasters:
The number of natural disasters in Los Angeles County (57) is a lot greater than the US average (15).Major Disasters (Presidential) Declared: 27
Emergencies Declared: 3
Causes of natural disasters: Fires: 37, Floods: 16, Storms: 9, Winter Storms: 6, Landslides: 5, Mudslides: 5, Earthquakes: 3, Freeze: 1, Heavy Rain: 1, Hurricane: 1, Snow: 1, Tornado: 1, Wind: 1, Other: 1 (Note: some incidents may be assigned to more than one category).
Hospitals and medical centers near South Bay Cities:
- HUMAN TOUCH HOME HEALTH CARE AGENCY, INC (Home Health Center, about 2 miles away; MANHATTAN BEACH, CA)
- BAYSHORE SANITARIUM (Nursing Home, about 2 miles away; HERMOSA BEACH, CA)
- COASTAL DIALYSIS CENTER (Dialysis Facility, about 3 miles away; REDONDO BEACH, CA)
- AMI SOUTH BAY HOSPITAL (Hospital, about 3 miles away; REDONDO BEACH, CA)
- SOUTH BAY MEDICAL CENTER SNF/DP (Nursing Home, about 3 miles away; REDONDO BEACH, CA)
- BEACHSIDE HOME (Hospital, about 3 miles away; LAWNDALE, CA)
- DUHANEY HOME HEALTH CARE (Home Health Center, about 3 miles away; EL SEGUNDO, CA)
Amtrak stations near South Bay Cities:
- 12 miles: SAN PEDRO (CATALINA TERMINAL, BERTH 95) - Bus Station . Services: partially wheelchair accessible, enclosed waiting area, public restrooms, public payphones, snack bar, paid short-term parking, paid long-term parking, call for taxi service.
- 14 miles: LONG BEACH (601 N. LONG BEACH BLVD.) - Bus Station . Services: fully wheelchair accessible, public restrooms, public payphones, full-service food facilities, paid short-term parking, paid long-term parking, call for taxi service, public transit connection.
- 16 miles: LOS ANGELES (800 N. ALAMEDA ST.) . Services: ticket office, fully wheelchair accessible, enclosed waiting area, public restrooms, public payphones, snack bar, free short-term parking, paid long-term parking, car rental agency, taxi stand, public transit connection.
Colleges/universities with over 2000 students nearest to South Bay Cities:
- El Camino Community College District (about 4 miles; Torrance, CA; Full-time enrollment: 13,952)
- Los Angeles Southwest College (about 7 miles; Los Angeles, CA; FT enrollment: 3,247)
- Loyola Marymount University (about 7 miles; Los Angeles, CA; FT enrollment: 7,720)
- California State University-Dominguez Hills (about 8 miles; Carson, CA; FT enrollment: 9,862)
- West Los Angeles College (about 9 miles; Culver City, CA; FT enrollment: 5,221)
- Los Angeles Harbor College (about 10 miles; Wilmington, CA; FT enrollment: 5,285)
- Santa Monica College (about 11 miles; Santa Monica, CA; FT enrollment: 20,311)
Points of interest:
Notable locations in South Bay Cities: El Segundo Station (A), El Segundo Golf Course (B), Monstad Pier (C), Radisson Plaza Golf Course (D), Redondo Beach Public Library (E), Hermosa Beach Branch County of Los Angeles Public Library (F), Redondo Beach City Hall (G), Hermosa Beach City Hall (H), Manhattan Heights Library (I), Manhattan Heights Community Center (J), Manhattan Beach City Hall (K), City of Manhattan Beach Public Library (L), El Segundo Public Library (M), El Segundo City Hall (N), El Segundo Police Department (O), South Bay Ambulance (P), Redondo Beach Fire Department Station 2 (Q), Chevron Fire Department (R), Manhattan Beach Fire Department Station 2 (S), Northrop Grumman Corporation Fire Department (T). Display/hide their locations on the map
Shopping Centers: Galleria Shopping Center (1), Metlox Plaza Shopping Center (2), South Bay Shopping Center (3), The Pier Shopping Center (4), Loreto Plaza Shopping Center (5), Hermosa Beach Pavilion Shopping Center (6), Sepulveda Shopping Center (7), Manhattan Village Shopping Center (8), Manhattan Marketplace Shopping Center (9). Display/hide their locations on the map
Churches in South Bay Cities include: Berean Tabernacle (A), Christ Episcopal Church (B), Church of Christ (C), Church of the Nazarene (D), Community Baptist Church (E), First Baptist Church (F), First Church of Christ Scientist (G), First Congregational Church (H), First United Methodist Church (I). Display/hide their locations on the map
Cemetery: Pacific Crest Cemetery (1). Display/hide its location on the map
Parks in South Bay Cities include: Waller Football Stadium (1), Dominquez Park (2), Parque Culiacan (3), Belfo Park (4), Cypress Park (5), Hilltop Park (6), Live Oak Park (7), Perry Park (8), Redondo Beach (9). Display/hide their locations on the map
| This place: | 2.3 people |
| California: | 2.9 people |
| This place: | 55.8% |
| Whole state: | 68.7% |
| This place: | 6.8% |
| Whole state: | 7.2% |
Likely homosexual households (counted as self-reported same-sex unmarried-partner households)
- Lesbian couples: 0.3% of all households
- Gay men: 0.3% of all households
| This place: | 4.9% |
| Whole state: | 14.2% |
| This place: | 2.6% |
| Whole state: | 6.3% |
People in group quarters in South Bay Cities in 2010:
- 370 people in other noninstitutional facilities
- 74 people in nursing facilities/skilled-nursing facilities
- 40 people in group homes intended for adults
- 26 people in emergency and transitional shelters (with sleeping facilities) for people experiencing homelessness
- 17 people in residential treatment centers for adults
- 14 people in workers' group living quarters and job corps centers
- 5 people in college/university student housing
- 4 people in group homes for juveniles (non-correctional)
People in group quarters in South Bay Cities in 2000:
- 88 people in training schools for juvenile delinquents
- 81 people in other noninstitutional group quarters
- 71 people in nursing homes
- 36 people in other nonhousehold living situations
- 20 people in religious group quarters
- 18 people in homes or halfway houses for drug/alcohol abuse
- 10 people in other group homes
- 6 people in homes for the mentally ill
- 4 people in homes for the mentally retarded
- 3 people in unknown juvenile institutions
For population 15 years and over in South Bay Cities:
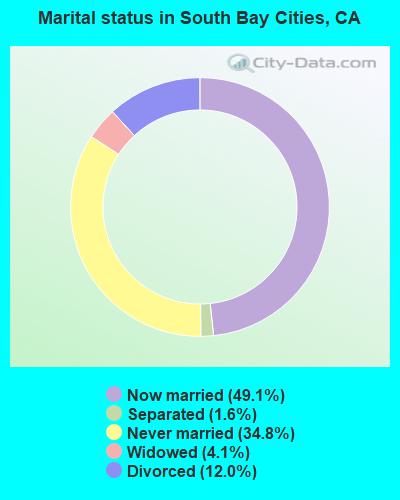
- Never married: 34.8%
- Now married: 49.1%
- Separated: 1.6%
- Widowed: 4.1%
- Divorced: 12.0%
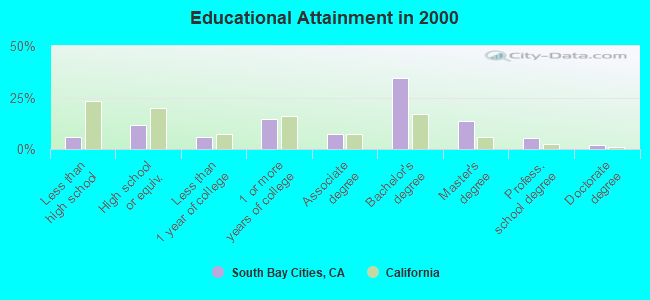
For population 25 years and over in South Bay Cities:
- High school or higher: 94.4%
- Bachelor's degree or higher: 55.1%
- Graduate or professional degree: 20.6%
- Unemployed: 3.6%
- Mean travel time to work (commute): 26.9 minutes
| Here: | 9.5 |
| California average: | 16.1 |


Graphs represent county-level data. Detailed 2008 Election Results
Religion statistics for South Bay Cities, CA (based on Los Angeles County data)


| Religion | Adherents | Congregations |
|---|---|---|
| Catholic | 3,542,994 | 275 |
| Evangelical Protestant | 814,611 | 3,249 |
| Other | 451,594 | 1,023 |
| Mainline Protestant | 229,056 | 860 |
| Black Protestant | 112,338 | 290 |
| Orthodox | 63,517 | 76 |
| None | 4,604,495 | - |
Food Environment Statistics:
| Here: | 2.12 / 10,000 pop. |
| California: | 2.14 / 10,000 pop. |
| This county: | 0.03 / 10,000 pop. |
| State: | 0.04 / 10,000 pop. |
| Here: | 0.58 / 10,000 pop. |
| State: | 0.62 / 10,000 pop. |
| This county: | 1.23 / 10,000 pop. |
| State: | 1.49 / 10,000 pop. |
| Los Angeles County: | 7.15 / 10,000 pop. |
| California: | 7.42 / 10,000 pop. |
| Here: | 7.5% |
| State: | 7.3% |
| Los Angeles County: | 20.4% |
| California: | 21.3% |
| Los Angeles County: | 18.6% |
| California: | 17.9% |
2.98% of this county's 2021 resident taxpayers lived in other counties in 2020 ($81,235 average adjusted gross income)
| Here: | 2.98% |
| California average: | 5.19% |
0.01% of residents moved from foreign countries ($155 average AGI)
Los Angeles County: 0.01% California average: 0.03%
Top counties from which taxpayers relocated into this county between 2020 and 2021:
| from Orange County, CA | |
| from San Bernardino County, CA | |
| from Riverside County, CA |
4.68% of this county's 2020 resident taxpayers moved to other counties in 2021 ($97,324 average adjusted gross income)
| Here: | 4.68% |
| California average: | 6.14% |
0.01% of residents moved to foreign countries ($196 average AGI)
Los Angeles County: 0.01% California average: 0.02%
Top counties to which taxpayers relocated from this county between 2020 and 2021:
| to Orange County, CA | |
| to San Bernardino County, CA | |
| to Riverside County, CA |
Strongest AM radio stations in South Bay Cities:
- KNX (1070 AM; 50 kW; LOS ANGELES, CA; Owner: INFINITY BROADCASTING OPERATIONS, INC.)
- KFWB (980 AM; 50 kW; LOS ANGELES, CA; Owner: INFINITY BROADCASTING OPERATIONS, INC.)
- KSPN (710 AM; 50 kW; LOS ANGELES, CA; Owner: KABC-AM RADIO, INC.)
- KFI (640 AM; 50 kW; LOS ANGELES, CA; Owner: CAPSTAR TX LIMITED PARTNERSHIP)
- KBLA (1580 AM; 50 kW; SANTA MONICA, CA)
- KLAC (570 AM; 50 kW; LOS ANGELES, CA; Owner: AMFM RADIO LICENSES, L.L.C.)
- KMPC (1540 AM; 50 kW; LOS ANGELES, CA; Owner: ROSE CITY RADIO CORPORATION)
- KTNQ (1020 AM; 50 kW; LOS ANGELES, CA; Owner: KTNQ-AM LICENSE CORP.)
- KXMX (1190 AM; 25 kW; ANAHEIM, CA; Owner: NEW INSPIRATION BROADCASTING COMPANY)
- KXTA (1150 AM; 50 kW; LOS ANGELES, CA; Owner: CITICASTERS LICENSES, L.P.)
- KFOX (1650 AM; 10 kW; TORRANCE, CA; Owner: CHAGAL COMMUNICATIONS, INC.)
- KDIS (1110 AM; 50 kW; PASADENA, CA; Owner: ABC,INC.)
- KABC (790 AM; 5 kW; LOS ANGELES, CA; Owner: KABC-AM RADIO, INC.)
Strongest FM radio stations in South Bay Cities:
- KKBT (100.3 FM; LOS ANGELES, CA; Owner: RADIO ONE LICENSES, LLC)
- KZLA-FM (93.9 FM; LOS ANGELES, CA; Owner: EMMIS RADIO LICENSE CORPORATION)
- KRTH-FM (101.1 FM; LOS ANGELES, CA; Owner: INFINITY BROADCASTING OPERATIONS, INC.)
- KPWR (105.9 FM; LOS ANGELES, CA; Owner: EMMIS RADIO LICENSE CORPORATION)
- KLSX (97.1 FM; LOS ANGELES, CA; Owner: INFINITY BROADCASTING OPERATIONS, INC.)
- KZAB (93.5 FM; REDONDO BEACH, CA; Owner: KZAB LICENSING, INC.)
- KUSC (91.5 FM; LOS ANGELES, CA; Owner: UNIVERSITY OF SOUTHERN CALIFORNIA)
- KKLA-FM (99.5 FM; LOS ANGELES, CA; Owner: NEW INSPIRATION BROADCASTING CO., INC.)
- KCBS-FM (93.1 FM; LOS ANGELES, CA; Owner: INFINITY BROADCASTING OPERATIONS, INC.)
- KSCA (101.9 FM; GLENDALE, CA; Owner: HBC LICENSE CORPORATION)
- K212FA (90.3 FM; TEMPLE CITY, CA; Owner: EDUCATIONAL MEDIA FOUNDATION)
- KLOS (95.5 FM; LOS ANGELES, CA; Owner: KLOS-FM RADIO, INC.)
- KOST (103.5 FM; LOS ANGELES, CA; Owner: CAPSTAR TX LIMITED PARTNERSHIP)
- KLVE (107.5 FM; LOS ANGELES, CA; Owner: KLVE-FM LICENSE CORP.)
- KIIS-FM (102.7 FM; LOS ANGELES, CA; Owner: CITICASTERS LICENSES, L.P.)
- KPCC (89.3 FM; PASADENA, CA; Owner: PASADENA AREA COMMUNITY COLLEGE DISTRICT)
- KHHT (92.3 FM; LOS ANGELES, CA; Owner: AMFM RADIO LICENSES, L.L.C.)
- KBIG-FM (104.3 FM; LOS ANGELES, CA; Owner: AMFM RADIO LICENSES, L.L.C.)
- KMZT-FM (105.1 FM; LOS ANGELES, CA; Owner: MOUNT WILSON FM BROADCASTERS, INC.)
- KPFK (90.7 FM; LOS ANGELES, CA; Owner: PACIFICA FOUNDATION, INC)
TV broadcast stations around South Bay Cities:
- KTRO-LP (Channel 50; LANCASTER, CA; Owner: ROBERT D. ADELMAN)
- KCBS-TV (Channel 2; LOS ANGELES, CA; Owner: CBS BROADCASTING INC.)
- KNBC (Channel 4; LOS ANGELES, CA; Owner: NBC SUBSIDIARY (KNBC-TV), INC.)
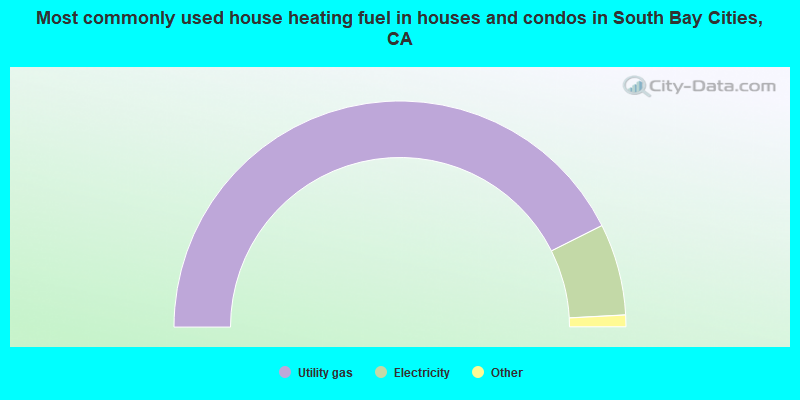
- 85.2%Utility gas
- 13.1%Electricity
- 0.7%Bottled, tank, or LP gas
- 0.6%No fuel used
- 0.3%Wood
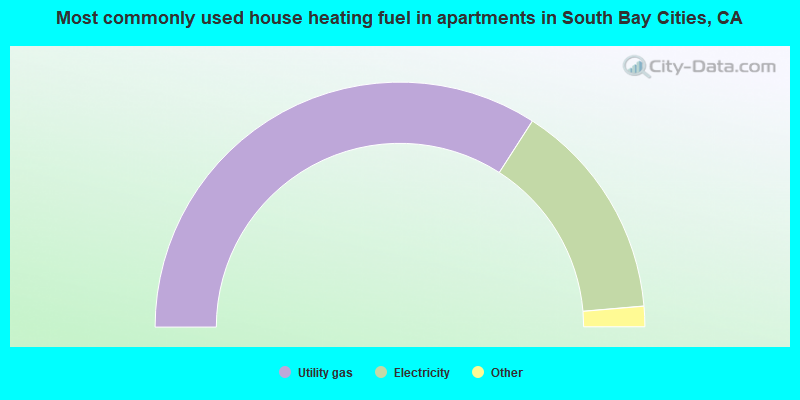
- 68.2%Utility gas
- 29.1%Electricity
- 1.4%No fuel used
- 0.9%Bottled, tank, or LP gas
- 0.2%Solar energy
- 0.2%Wood
South Bay Cities compared to California state average:
- Median household income above state average.
- Unemployed percentage significantly below state average.
- Black race population percentage significantly below state average.
- Hispanic race population percentage significantly below state average.
- Median age above state average.
- Foreign-born population percentage significantly below state average.
- Length of stay since moving in significantly above state average.
- Number of rooms per house significantly below state average.
- House age significantly below state average.
- Percentage of population with a bachelor's degree or higher above state average.
South Bay Cities, CA compared to other similar cities:
South Bay Cities on our top lists:
- #1 on the list of "Top 101 cities with largest percentage of females in occupations: transportation, tourism, and lodging attendants (population 50,000+)"
- #1 on the list of "Top 101 cities with largest percentage of females in occupations: sales representatives, services, wholesale and manufacturing (population 50,000+)"
- #1 on the list of "Top 101 cities with largest percentage of females in occupations: advertising, marketing, promotions, public relations, and sales managers (population 50,000+)"
- #2 on the list of "Top 101 cities with largest percentage of females in industries: publishing, and motion picture and sound recording industries (population 50,000+)"
- #2 on the list of "Top 101 cities with largest percentage of females in occupations: business operations specialists (population 50,000+)"
- #2 on the list of "Top 101 cities with largest percentage of females in industries: air transportation (population 50,000+)"
- #3 on the list of "Top 101 cities with largest percentage of females in occupations: operations specialties managers except financial managers (population 50,000+)"
- #3 on the list of "Top 101 cities with largest percentage of males in industries: data processing, libraries, and other information services (population 50,000+)"
- #4 on the list of "Top 101 cities with largest percentage of males in industries: air transportation (population 50,000+)"
- #4 on the list of "Top 101 cities with largest percentage of females in occupations: engineers (population 50,000+)"
- #6 on the list of "Top 101 cities with largest percentage of females in industries: transportation equipment (population 50,000+)"
- #6 on the list of "Top 101 cities with largest percentage of males in industries: publishing, and motion picture and sound recording industries (population 50,000+)"
- #6 on the list of "Top 101 cities with largest percentage of males in industries: sporting goods, camera, and hobby and toy stores (population 50,000+)"
- #8 on the list of "Top 101 cities with largest percentage of males in industries: electronic shopping and mail-order houses (population 50,000+)"
- #9 on the list of "Top 101 cities with largest percentage of males in industries: transportation equipment (population 50,000+)"
- #9 on the list of "Top 101 cities with largest percentage of females in industries: radio, tv, and computer stores (population 50,000+)"
- #9 on the list of "Top 100 cities with highest median house value (pop. 50,000+)"
- #10 on the list of "Top 101 cities with largest percentage of males in industries: sewing, needlework, and piece goods stores (population 50,000+)"
- #12 on the list of "Top 101 cities with largest percentage of males in industries: petroleum and coal products (population 50,000+)"
- #12 on the list of "Top 101 cities with largest percentage of females in industries: data processing, libraries, and other information services (population 50,000+)"
- #77 (90266) on the list of "Top 101 zip codes with the highest average reported salary/wage in 2012 (pop 5,000+)"
- #1 on the list of "Top 101 counties with the most Evangelical Protestant congregations"
- #1 on the list of "Top 101 counties with the most Mainline Protestant congregations"
- #1 on the list of "Top 101 counties with the most Orthodox adherents"
- #1 on the list of "Top 101 counties with the highest ground withdrawal of fresh water for public supply (pop. 50,000+)"
- #1 on the list of "Top 101 counties with the most Catholic adherents (pop. 50,000+)"