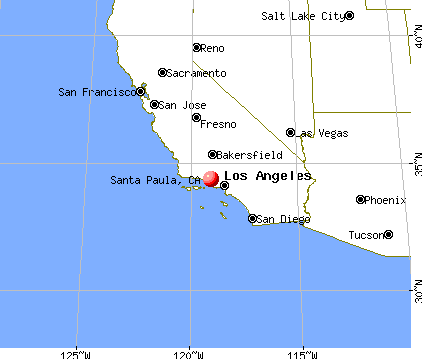
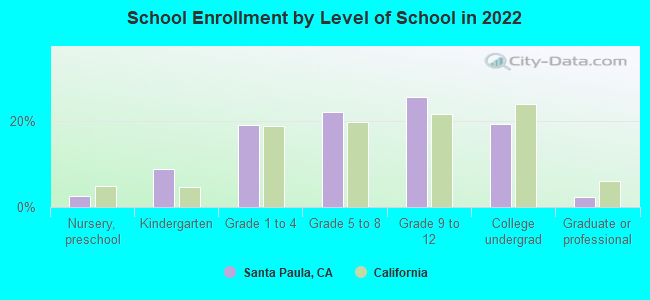
Santa Paula, California
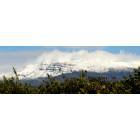
Santa Paula: Santa Paula Citrus Orchards and Topa Topa Mountaina
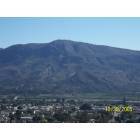
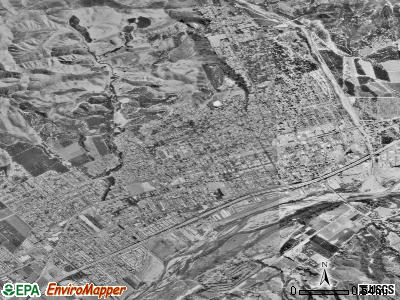
Santa Paula: View of town and South Mountain
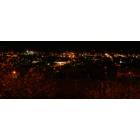
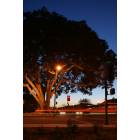
Santa Paula: santa paula at night
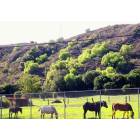
Santa Paula: Horses on Ojai Rd.
Santa Paula: towering fig tree
- add
your
Submit your own pictures of this city and show them to the world
- OSM Map
- General Map
- Google Map
- MSN Map
Population change since 2000: +8.5%
 |
| Males: 15,494 | |
| Females: 15,524 |
| Median resident age: | 35.3 years |
| California median age: | 37.9 years |
Zip codes: 93060.
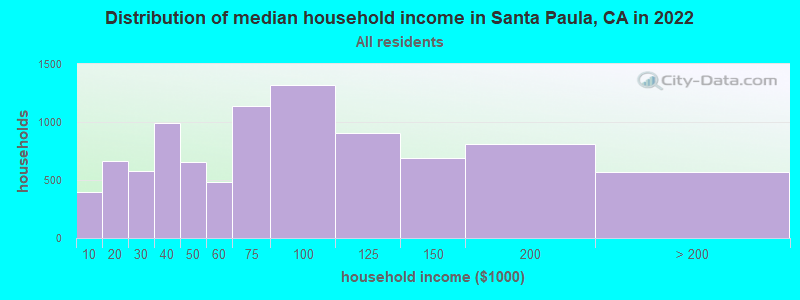
| Santa Paula: | $72,316 |
| CA: | $91,551 |
Estimated per capita income in 2022: $29,267 (it was $15,736 in 2000)
Santa Paula city income, earnings, and wages data
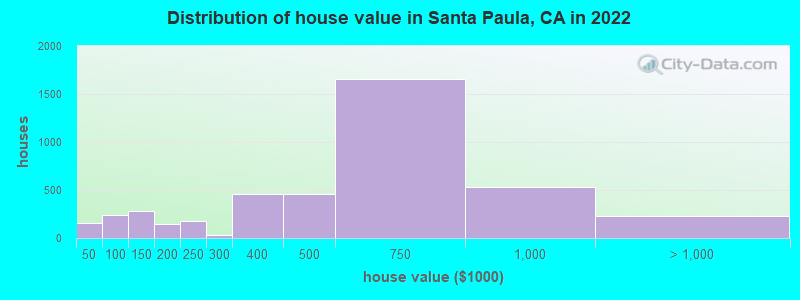
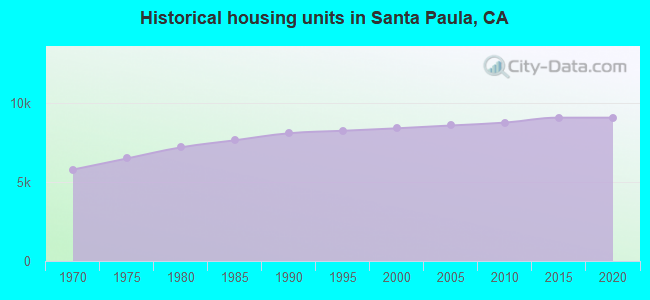
Estimated median house or condo value in 2022: $575,493 (it was $166,600 in 2000)
| Santa Paula: | $575,493 |
| CA: | $715,900 |
Mean prices in 2022: all housing units: $605,449; detached houses: $714,067; townhouses or other attached units: $447,040; in 2-unit structures: $213,205; in 3-to-4-unit structures: $416,730; in 5-or-more-unit structures: $235,105; mobile homes: $144,568
Median gross rent in 2022: $1,671.
(7.4% for White Non-Hispanic residents, 0.6% for Black residents, 19.7% for Hispanic or Latino residents, 8.4% for American Indian residents, 12.9% for other race residents, 6.4% for two or more races residents)
Detailed information about poverty and poor residents in Santa Paula, CA

Compare current foreclosures near Santa Paula, CA:
| Photo | Address | Area | Beds / Baths | Price | Details |
|---|---|---|---|---|---|

|
#1
Center Ln
Santa Paula, CA 93060
|
1,250 sq. feet
|
2 baths 3 beds |
show details | |

|
#2
Acacia Rd
Santa Paula, CA 93060
|
1,616 sq. feet
|
2 baths 3 beds |
show details | |

|
#3
E Pleasant St
Santa Paula, CA 93060
|
1,997 sq. feet
|
1 baths 3 beds |
show details | |

|
#4
Dana Dr
Santa Paula, CA 93060
|
1,614 sq. feet
|
2 baths 2 beds |
show details | |

|
#5
Lucada St
Santa Paula, CA 93060
|
1,216 sq. feet
|
1 baths 2 beds |
show details | |

|
#6
Corte Granada
Santa Paula, CA 93060
|
2,020 sq. feet
|
3 baths 4 beds |
show details | |

|
#7
Amber Dr
Santa Paula, CA 93060
|
2,333 sq. feet
|
2 baths 4 beds |
show details | |

|
#8
Corte La Brisa
Santa Paula, CA 93060
|
2,020 sq. feet
|
3 baths 4 beds |
show details | |

|
#9
1/2 Sycamore St
Santa Paula, CA 93060
|
720 sq. feet
|
1 baths 2 beds |
show details | |

|
#10
Prieto St
Santa Paula, CA 93060
|
850 sq. feet
|
1 baths 2 beds |
show details |
| Photo | Address | Area | Beds / Baths | Price | Details |
|---|---|---|---|---|---|

|
#11
12 Sycamore St
Santa Paula, CA 93060
|
- sq. feet
|
- baths - beds |
show details | |

|
#12
S 12th St # 768
Santa Paula, CA 93060
|
- sq. feet
|
- baths - beds |
show details | |

|
#13
W Telegraph Rd Spc B49
Santa Paula, CA 93060
|
- sq. feet
|
- baths - beds |
show details | |

|
#14
S Steckel Dr Apt C
Santa Paula, CA 93060
|
- sq. feet
|
- baths - beds |
show details | |

|
#15
Ramona Dr
Newbury Park, CA 91320
|
1,234 sq. feet
|
2 baths 3 beds |
$645,000
|
show details |

|
#16
Main St
Fillmore, CA 93015
|
750 sq. feet
|
1 baths 2 beds |
$350,000
|
show details |

|
#17
Colonia Ave Apt B
Oxnard, CA 93036
|
912 sq. feet
|
1 baths 2 beds |
show details | |

|
#18
Kern St
Oxnard, CA 93033
|
1,233 sq. feet
|
2 baths 4 beds |
show details | |

|
#19
Warwick Ave
Thousand Oaks, CA 91360
|
1,433 sq. feet
|
3 baths 3 beds |
show details | |

|
#20
Cayo Grande Ct
Newbury Park, CA 91320
|
2,582 sq. feet
|
3 baths 4 beds |
show details |
| Photo | Address | Area | Beds / Baths | Price | Details |
|---|---|---|---|---|---|

|
#21
Green River St
Oxnard, CA 93036
|
1,556 sq. feet
|
2 baths 4 beds |
show details | |

|
#22
Canal St
Oxnard, CA 93035
|
2,504 sq. feet
|
3 baths 3 beds |
show details | |

|
#23
Kumquat Pl
Oxnard, CA 93036
|
1,860 sq. feet
|
2 baths 5 beds |
show details | |

|
#24
N Hayes Ave
Oxnard, CA 93030
|
1,044 sq. feet
|
1 baths 3 beds |
show details | |

|
#25
E Park
Camarillo, CA 93012
|
2,963 sq. feet
|
4 baths 5 beds |
show details | |

|
#26
Camino Verde
Thousand Oaks, CA 91360
|
2,407 sq. feet
|
3 baths 3 beds |
show details | |

|
#27
Saratoga Ave Unit 1201
Ventura, CA 93003
|
1,250 sq. feet
|
2 baths 4 beds |
show details | |

|
#28
Harbour Island Ln
Oxnard, CA 93035
|
1,937 sq. feet
|
2 baths 2 beds |
show details | |

|
#29
Camino Manzanas
Thousand Oaks, CA 91360
|
2,085 sq. feet
|
2 baths 5 beds |
show details | |

|
#30
Mira Sol Dr
Moorpark, CA 93021
|
1,644 sq. feet
|
2 baths 3 beds |
show details |
| Photo | Address | Area | Beds / Baths | Price | Details |
|---|---|---|---|---|---|

|
#31
Roosevelt Ct
Simi Valley, CA 93065
|
3,665 sq. feet
|
3 baths 4 beds |
show details | |

|
#32
Ribera Dr
Oxnard, CA 93030
|
2,419 sq. feet
|
3 baths 4 beds |
show details | |

|
#33
Lookout Dr
Oxnard, CA 93035
|
1,950 sq. feet
|
2 baths 4 beds |
show details | |

|
#34
Elderberry Ave
Moorpark, CA 93021
|
1,587 sq. feet
|
2 baths 3 beds |
show details | |

|
#35
Pyramid Ave
Ventura, CA 93004
|
1,319 sq. feet
|
2 baths 3 beds |
show details | |

|
#36
Callas Dr
Oxnard, CA 93035
|
2,469 sq. feet
|
3 baths 5 beds |
show details | |

|
#37
Utica Ave
Ventura, CA 93004
|
1,354 sq. feet
|
2 baths 4 beds |
show details | |

|
#38
S Padre Juan Ave
Ojai, CA 93023
|
1,057 sq. feet
|
1 baths 1 beds |
show details | |

|
#39
W Elm St
Oxnard, CA 93033
|
1,272 sq. feet
|
2 baths 3 beds |
show details | |

|
#40
Drown Ave
Ojai, CA 93023
|
1,481 sq. feet
|
2 baths 4 beds |
show details |
| Photo | Address | Area | Beds / Baths | Price | Details |
|---|---|---|---|---|---|

|
#41
Frank Ave
Oxnard, CA 93033
|
1,020 sq. feet
|
1 baths 2 beds |
show details | |

|
#42
Encino Pl
Oxnard, CA 93033
|
1,612 sq. feet
|
2 baths 3 beds |
show details | |

|
#43
Bernadette St
Oxnard, CA 93030
|
1,530 sq. feet
|
2 baths 3 beds |
show details | |

|
#44
Susan Ave
Moorpark, CA 93021
|
1,068 sq. feet
|
2 baths 3 beds |
show details | |

|
#45
Walter Ave
Newbury Park, CA 91320
|
1,414 sq. feet
|
2 baths 4 beds |
show details | |

|
#46
N Canyonlands Rd
Moorpark, CA 93021
|
1,439 sq. feet
|
2 baths 3 beds |
show details | |

|
#47
W Cedar St
Oxnard, CA 93033
|
1,050 sq. feet
|
1 baths 3 beds |
show details | |

|
#48
W Robert Ave
Oxnard, CA 93030
|
1,838 sq. feet
|
2 baths 4 beds |
show details | |

|
#49
Kenmore Cir
Newbury Park, CA 91320
|
1,361 sq. feet
|
2 baths 4 beds |
show details | |

|
Check over 1 million property listings on Foreclosure.com!
|
browse all offers | |||


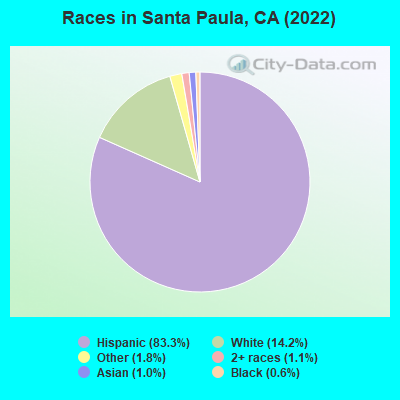
- 25,37483.3%Hispanic
- 4,32314.2%White alone
- 5401.8%Other race alone
- 3341.1%Two or more races
- 3041.0%Asian alone
- 1680.6%Black alone
- 240.08%American Indian alone
- 90.03%Native Hawaiian and Other
Pacific Islander alone
According to our research of California and other state lists, there were 25 registered sex offenders living in Santa Paula, California as of April 18, 2024.
The ratio of all residents to sex offenders in Santa Paula is 1,221 to 1.
The ratio of registered sex offenders to all residents in this city is lower than the state average.
Type |
2009 |
2010 |
2011 |
2012 |
2013 |
2014 |
2015 |
2016 |
2017 |
2018 |
2019 |
2020 |
2021 |
2022 |
|---|---|---|---|---|---|---|---|---|---|---|---|---|---|---|
| Murders (per 100,000) | 0 (0.0) | 1 (3.4) | 1 (3.4) | 1 (3.3) | 6 (19.9) | 3 (9.9) | 1 (3.3) | 2 (6.5) | 2 (6.6) | 1 (3.3) | 2 (6.6) | 2 (6.7) | 0 (0.0) | 0 (0.0) |
| Rapes (per 100,000) | 4 (14.0) | 3 (10.2) | 7 (23.6) | 4 (13.4) | 6 (19.9) | 3 (9.9) | 11 (35.8) | 9 (29.2) | 7 (23.0) | 3 (9.9) | 6 (19.9) | 8 (26.8) | 3 (9.9) | 5 (16.2) |
| Robberies (per 100,000) | 40 (139.8) | 26 (88.7) | 45 (151.7) | 28 (93.6) | 33 (109.4) | 18 (59.5) | 16 (52.1) | 26 (84.5) | 18 (59.0) | 32 (105.1) | 21 (69.8) | 23 (77.0) | 22 (72.6) | 19 (61.6) |
| Assaults (per 100,000) | 64 (223.8) | 71 (242.1) | 77 (259.6) | 58 (194.0) | 63 (208.9) | 61 (201.5) | 68 (221.4) | 43 (139.7) | 76 (249.2) | 54 (177.3) | 62 (206.0) | 69 (231.1) | 63 (207.9) | 78 (252.8) |
| Burglaries (per 100,000) | 114 (398.6) | 100 (341.1) | 104 (350.6) | 103 (344.5) | 103 (341.5) | 74 (244.5) | 101 (328.9) | 76 (246.9) | 84 (275.4) | 99 (325.1) | 103 (342.2) | 99 (331.5) | 65 (214.5) | 68 (220.4) |
| Thefts (per 100,000) | 450 (1,573) | 376 (1,282) | 319 (1,075) | 422 (1,411) | 358 (1,187) | 321 (1,060) | 255 (830.3) | 218 (708.2) | 308 (1,010) | 318 (1,044) | 272 (903.7) | 289 (967.8) | 202 (666.7) | 225 (729.3) |
| Auto thefts (per 100,000) | 73 (255.2) | 41 (139.8) | 52 (175.3) | 65 (217.4) | 75 (248.7) | 52 (171.8) | 50 (162.8) | 49 (159.2) | 42 (137.7) | 41 (134.6) | 29 (96.4) | 49 (164.1) | 37 (122.1) | 49 (158.8) |
| Arson (per 100,000) | 2 (7.0) | 2 (6.8) | 1 (3.4) | 3 (10.0) | 6 (19.9) | 3 (9.9) | 4 (13.0) | 3 (9.7) | 2 (6.6) | 0 (0.0) | 3 (10.0) | 3 (10.0) | 2 (6.6) | 9 (29.2) |
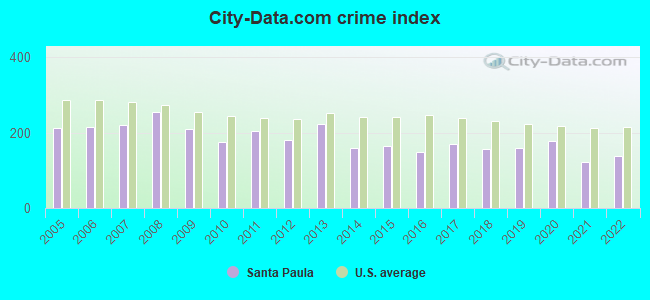
| City-Data.com crime index | 209.1 | 176.4 | 204.6 | 182.2 | 221.6 | 159.2 | 164.3 | 148.0 | 169.7 | 156.7 | 159.2 | 179.2 | 122.8 | 139.3 |
The City-Data.com crime index weighs serious crimes and violent crimes more heavily. Higher means more crime, U.S. average is 246.1. It adjusts for the number of visitors and daily workers commuting into cities.
Crime rate in Santa Paula detailed stats: murders, rapes, robberies, assaults, burglaries, thefts, arson
Full-time law enforcement employees in 2021, including police officers: 41 (30 officers - 28 male; 2 female).
| Officers per 1,000 residents here: | 0.99 |
| California average: | 2.30 |
 Recent articles from our blog. Our writers, many of them Ph.D. graduates or candidates, create easy-to-read articles on a wide variety of topics.

 | Differences in Camarillo and Thousand Oaks (38 replies) |
| Favorite city in VC? (11 replies) |
| Safe Community in Ventura with Great Air Quality? (5 replies) |
| Downtown Santa Paula vs. Downtown Oxnard (27 replies) |
| Fire! Dang fires that start at night are scary! (40 replies) |
| Possible relocation to near Santa Barbara (2 replies) |
Latest news from Santa Paula, CA collected exclusively by city-data.com from local newspapers, TV, and radio stations
Ancestries: American (2.7%).
Current Local Time: PST time zone
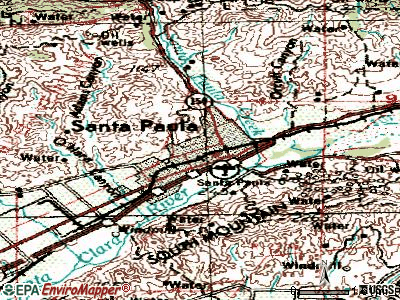
Elevation: 274 feet
Land area: 4.60 square miles.
Population density: 6,740 people per square mile (high).
9,308 residents are foreign born (29.2% Latin America).
| This city: | 30.6% |
| California: | 26.5% |
Median real estate property taxes paid for housing units with mortgages in 2022: $4,069 (0.7%)
Median real estate property taxes paid for housing units with no mortgage in 2022: $2,314 (0.5%)
Nearest city with pop. 50,000+: Camarillo, CA  (9.2 miles , pop. 57,077).
Nearest city with pop. 200,000+: Los Angeles, CA (43.8 miles , pop. 3,694,820).
Nearest cities:
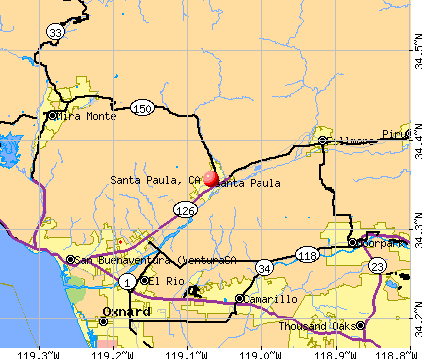
), ), ), Latitude: 34.36 N, Longitude: 119.07 W
Daytime population change due to commuting: -5,692 (-18.7%)
Workers who live and work in this city: 3,397 (24.9%)
Area code: 805
Santa Paula, California accommodation & food services, waste management - Economy and Business Data
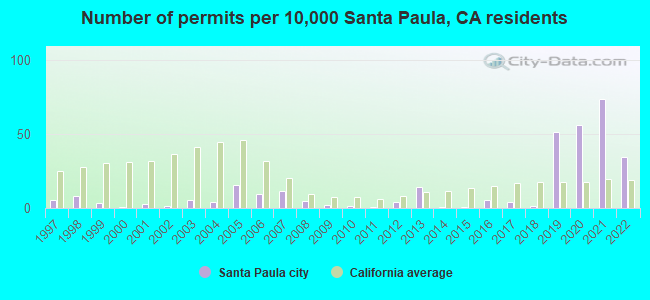
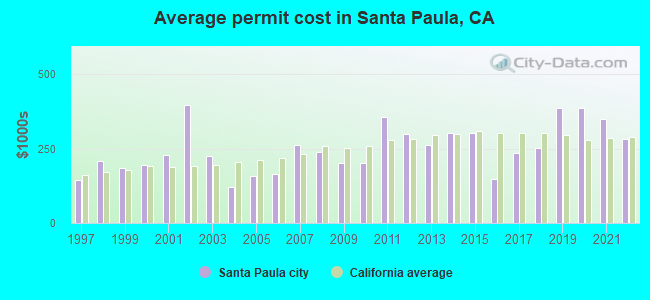
Single-family new house construction building permits:
- 2022: 98 buildings, average cost: $281,300
- 2021: 210 buildings, average cost: $348,900
- 2020: 160 buildings, average cost: $385,000
- 2019: 146 buildings, average cost: $385,000
- 2018: 3 buildings, average cost: $253,400
- 2017: 11 buildings, average cost: $234,500
- 2016: 15 buildings, average cost: $148,200
- 2015: 2 buildings, average cost: $301,800
- 2014: 2 buildings, average cost: $301,800
- 2013: 41 buildings, average cost: $261,500
- 2012: 12 buildings, average cost: $300,100
- 2011: 1 building, cost: $357,100
- 2010: 4 buildings, average cost: $200,400
- 2009: 5 buildings, average cost: $201,800
- 2008: 13 buildings, average cost: $237,200
- 2007: 33 buildings, average cost: $261,000
- 2006: 27 buildings, average cost: $163,700
- 2005: 44 buildings, average cost: $159,300
- 2004: 11 buildings, average cost: $121,200
- 2003: 15 buildings, average cost: $226,200
- 2002: 4 buildings, average cost: $396,200
- 2001: 8 buildings, average cost: $228,600
- 2000: 2 buildings, average cost: $195,500
- 1999: 10 buildings, average cost: $183,200
- 1998: 23 buildings, average cost: $206,600
- 1997: 15 buildings, average cost: $143,300
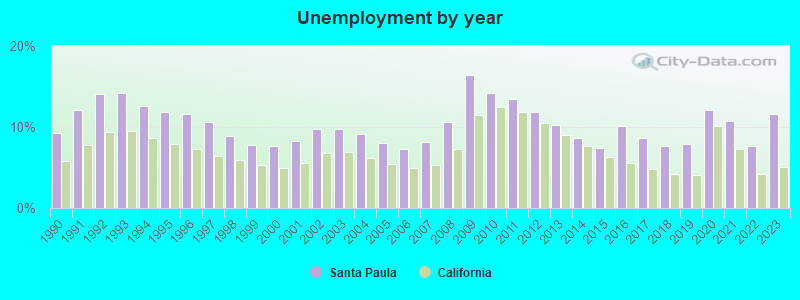
| Here: | 11.6% |
| California: | 5.1% |
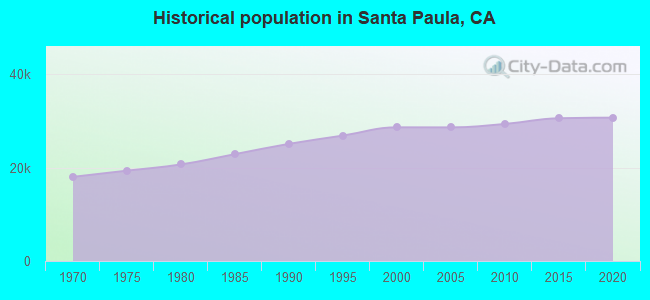
Population change in the 1990s: +3,616 (+14.5%).
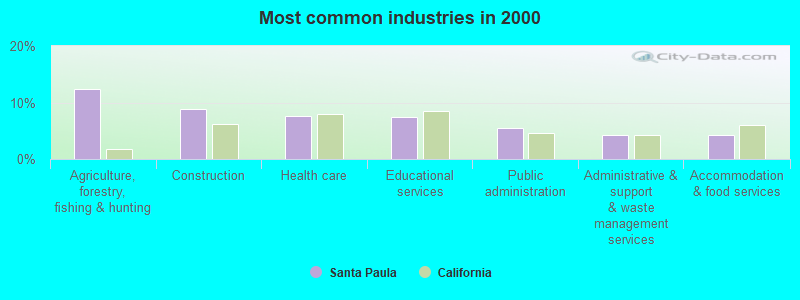
- Agriculture, forestry, fishing & hunting (12.3%)
- Construction (8.8%)
- Health care (7.6%)
- Educational services (7.5%)
- Public administration (5.6%)
- Administrative & support & waste management services (4.3%)
- Accommodation & food services (4.3%)
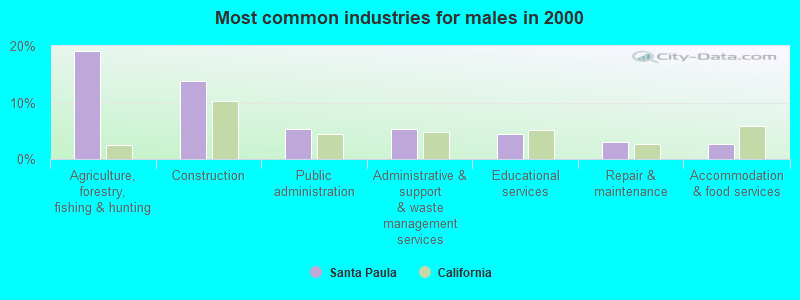
- Agriculture, forestry, fishing & hunting (19.1%)
- Construction (13.7%)
- Public administration (5.3%)
- Administrative & support & waste management services (5.2%)
- Educational services (4.4%)
- Repair & maintenance (3.0%)
- Accommodation & food services (2.6%)
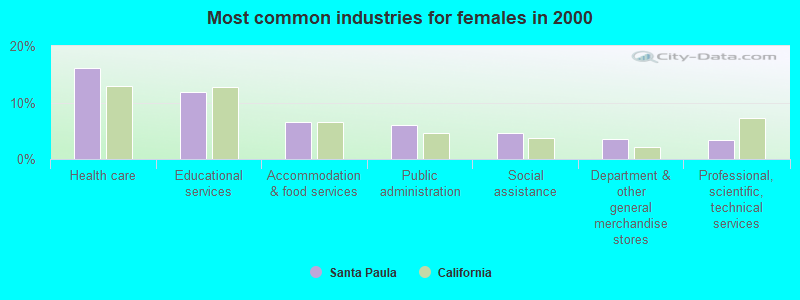
- Health care (16.2%)
- Educational services (11.8%)
- Accommodation & food services (6.5%)
- Public administration (6.0%)
- Social assistance (4.6%)
- Department & other general merchandise stores (3.6%)
- Professional, scientific, technical services (3.4%)
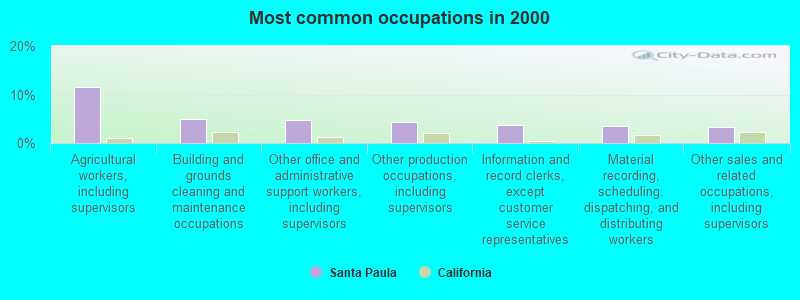
- Agricultural workers, including supervisors (11.5%)
- Building and grounds cleaning and maintenance occupations (5.0%)
- Other office and administrative support workers, including supervisors (4.7%)
- Other production occupations, including supervisors (4.3%)
- Information and record clerks, except customer service representatives (3.6%)
- Material recording, scheduling, dispatching, and distributing workers (3.5%)
- Other sales and related occupations, including supervisors (3.2%)
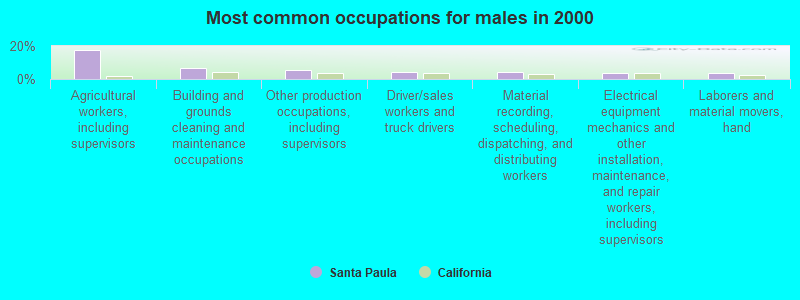
- Agricultural workers, including supervisors (17.4%)
- Building and grounds cleaning and maintenance occupations (6.6%)
- Other production occupations, including supervisors (5.2%)
- Driver/sales workers and truck drivers (4.4%)
- Material recording, scheduling, dispatching, and distributing workers (4.2%)
- Electrical equipment mechanics and other installation, maintenance, and repair workers, including supervisors (3.5%)
- Laborers and material movers, hand (3.4%)
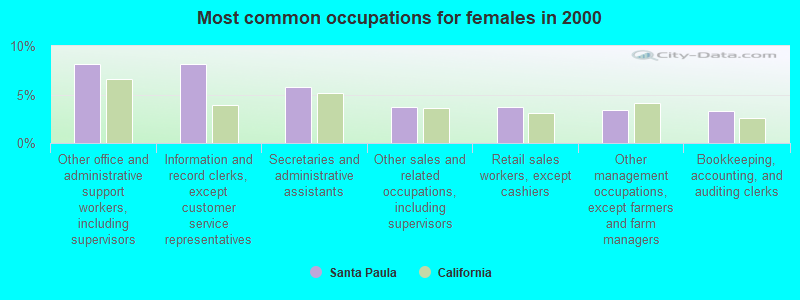
- Other office and administrative support workers, including supervisors (8.2%)
- Information and record clerks, except customer service representatives (8.1%)
- Secretaries and administrative assistants (5.8%)
- Other sales and related occupations, including supervisors (3.7%)
- Retail sales workers, except cashiers (3.7%)
- Other management occupations, except farmers and farm managers (3.4%)
- Bookkeeping, accounting, and auditing clerks (3.3%)
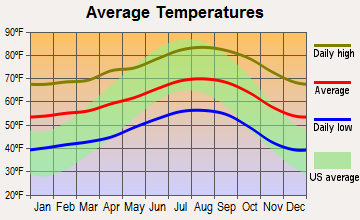
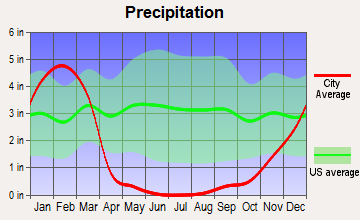
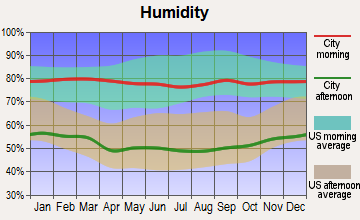
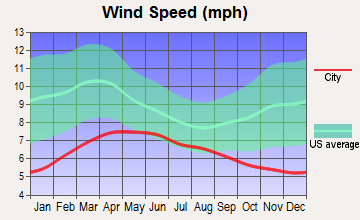
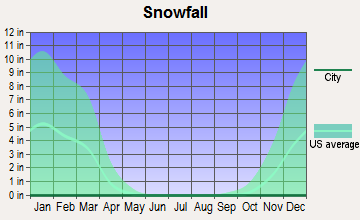
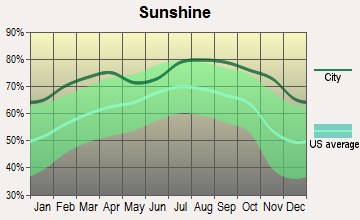
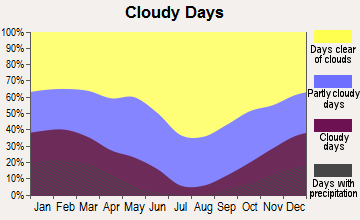
Average climate in Santa Paula, California
Based on data reported by over 4,000 weather stations
|
|


(lower is better)
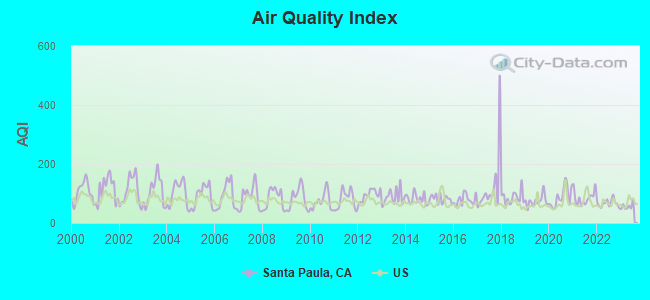
Air Quality Index (AQI) level in 2023 was 56.6. This is better than average.
| City: | 56.6 |
| U.S.: | 72.6 |
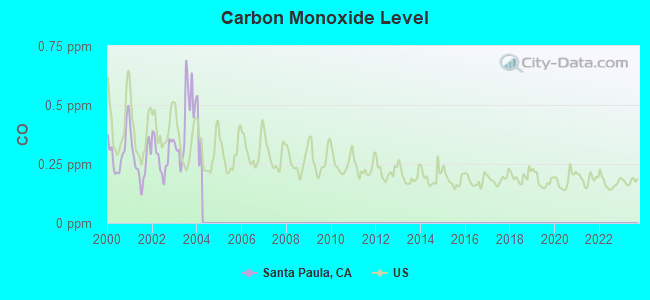
Carbon Monoxide (CO) [ppm] level in 2003 was 0.427. This is significantly worse than average. Closest monitor was 8.3 miles away from the city center.
| City: | 0.427 |
| U.S.: | 0.251 |
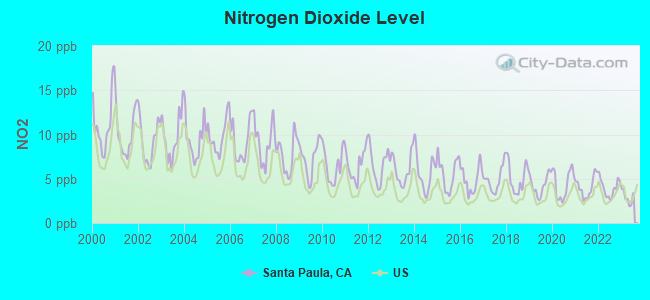
Nitrogen Dioxide (NO2) [ppb] level in 2023 was 2.91. This is significantly better than average. Closest monitor was 8.3 miles away from the city center.
| City: | 2.91 |
| U.S.: | 5.11 |
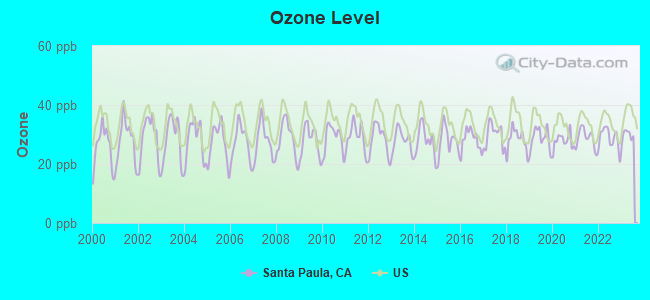
Ozone [ppb] level in 2023 was 29.7. This is about average. Closest monitor was 0.2 miles away from the city center.
| City: | 29.7 |
| U.S.: | 33.3 |
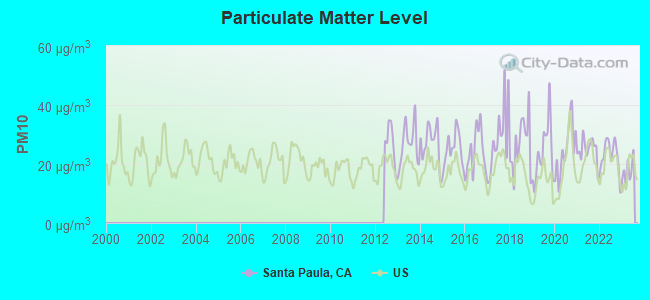
Particulate Matter (PM10) [µg/m3] level in 2023 was 17.7. This is about average. Closest monitor was 8.3 miles away from the city center.
| City: | 17.7 |
| U.S.: | 19.2 |
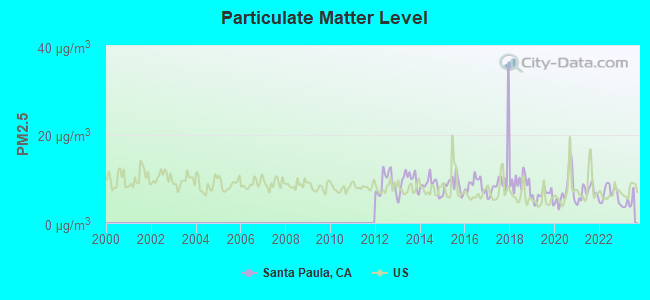
Particulate Matter (PM2.5) [µg/m3] level in 2023 was 4.67. This is significantly better than average. Closest monitor was 8.3 miles away from the city center.
| City: | 4.67 |
| U.S.: | 8.11 |
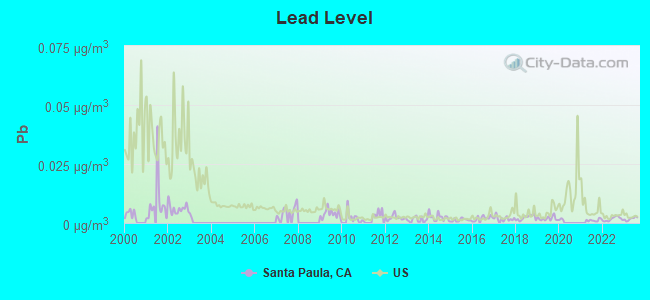
Lead (Pb) [µg/m3] level in 2023 was 0.00179. This is significantly better than average. Closest monitor was 8.3 miles away from the city center.
| City: | 0.00179 |
| U.S.: | 0.00931 |
Earthquake activity:
Santa Paula-area historical earthquake activity is significantly above California state average. It is 6877% greater than the overall U.S. average.On 7/21/1952 at 11:52:14, a magnitude 7.7 (7.7 UK, Class: Major, Intensity: VIII - XII) earthquake occurred 44.7 miles away from the city center, causing $50,000,000 total damage
On 11/4/1927 at 13:51:53, a magnitude 7.5 (7.5 UK) earthquake occurred 118.2 miles away from Santa Paula center
On 6/28/1992 at 11:57:34, a magnitude 7.6 (6.2 MB, 7.6 MS, 7.3 MW, Depth: 0.7 mi) earthquake occurred 145.5 miles away from the city center, causing 3 deaths (1 shaking deaths, 2 other deaths) and 400 injuries, causing $100,000,000 total damage and $40,000,000 insured losses
On 10/16/1999 at 09:46:44, a magnitude 7.4 (6.3 MB, 7.4 MS, 7.2 MW, 7.3 ML) earthquake occurred 150.6 miles away from Santa Paula center
On 1/17/1994 at 12:30:55, a magnitude 6.8 (6.4 MB, 6.8 MS, 6.7 MW, Depth: 11.4 mi, Class: Strong, Intensity: VII - IX) earthquake occurred 31.4 miles away from the city center, causing 60 deaths (60 shaking deaths) and 7000 injuries
On 4/18/1906 at 13:12:21, a magnitude 7.9 (7.9 UK) earthquake occurred 334.2 miles away from Santa Paula center, causing $524,000,000 total damage
Magnitude types: body-wave magnitude (MB), local magnitude (ML), surface-wave magnitude (MS), moment magnitude (MW)
Natural disasters:
The number of natural disasters in Ventura County (36) is a lot greater than the US average (15).Major Disasters (Presidential) Declared: 24
Emergencies Declared: 2
Causes of natural disasters: Fires: 17, Floods: 16, Storms: 10, Landslides: 5, Mudslides: 4, Winter Storms: 4, Freezes: 2, Heavy Rains: 2, Earthquake: 1, Hurricane: 1, Snow: 1, Tornado: 1, Wind: 1, Other: 1 (Note: some incidents may be assigned to more than one category).
Hospitals and medical centers in Santa Paula:
Airports located in Santa Paula:
- Santa Paula Airport (SZP) (Runways: 2, Itinerant Ops: 24,250, Local Ops: 72,750)
College/University in Santa Paula:
Colleges/universities with over 2000 students nearest to Santa Paula:
- Ventura College (about 11 miles; Ventura, CA; Full-time enrollment: 8,460)
- California State University-Channel Islands (about 14 miles; Camarillo, CA; FT enrollment: 4,163)
- Moorpark College (about 14 miles; Moorpark, CA; FT enrollment: 9,338)
- California Lutheran University (about 15 miles; Thousand Oaks, CA; FT enrollment: 4,103)
- Oxnard College (about 15 miles; Oxnard, CA; FT enrollment: 3,879)
- College of the Canyons (about 29 miles; Santa Clarita, CA; FT enrollment: 11,307)
- Pepperdine University (about 30 miles; Malibu, CA; FT enrollment: 6,722)
Public high schools in Santa Paula:
- SANTA PAULA HIGH (Students: 1,010, Location: 404 N. SIXTH ST., Grades: 9-12)
- RENAISSANCE HIGH (Students: 30, Location: 333 N. PALM AVE., Grades: 9-12)
Biggest public elementary/middle schools in Santa Paula:
- ISBELL MIDDLE (Students: 879, Location: 221 S. FOURTH ST., Grades: 6-8)
- GLEN CITY ELEMENTARY (Students: 295, Location: 141 STECKEL DR., Grades: KG-5)
- BRIGGS ELEMENTARY (Students: 272, Location: 14438 W. TELEGRAPH RD., Grades: 5-8)
- BLANCHARD ELEMENTARY (Students: 230, Location: 115 PECK RD., Grades: KG-5)
- BARBARA WEBSTER ELEMENTARY (Students: 209, Location: 1150 SATICOY ST., Grades: KG-5)
- MCKEVETT ELEMENTARY (Students: 158, Location: 955 E. PLEASANT ST., Grades: KG-5)
- GRACE S. THILLE ELEMENTARY (Students: 157, Location: 1144 VENTURA ST., Grades: KG-5)
- THELMA B. BEDELL ELEMENTARY (Students: 154, Location: 1305 LAUREL RD., Grades: KG-5)
- OLIVELANDS ELEMENTARY (Students: 97, Location: 12465 FOOTHILL RD., Grades: KG-4)
- MUPU ELEMENTARY (Students: 93, Location: 4410 N. OJAI RD., Grades: KG-8)
Private elementary/middle school in Santa Paula:
User-submitted facts and corrections:
- Santa Paula Memorial Hospital is no longer open for care. Our nearest hospital services are now located in Ventura.
- Santa Paula does not have hospital anymore
Points of interest:
Notable locations in Santa Paula: Santa Paula City Hall (A), California Oil Museum (B), Blanchard Community Library (C), City of Santa Paula Fire Department Station 2 (D), City of Santa Paula Fire Department Station 81 (E). Display/hide their locations on the map
Shopping Center: Santa Paula Shopping Center (1). Display/hide its location on the map
Churches in Santa Paula include: Asamblea Apostolica (A), Bethel Baptist Church (B), Chapel of Praise Church of God (C), Church of Christ (D), The Church of Jesus Christ of Latter Day Saints (E), Church of the Nazarene (F), Citrus Valley Christian Center (G), First Baptist Church (H), First Christian Church (I). Display/hide their locations on the map
Cemetery: Santa Paula Cemetery (1). Display/hide its location on the map
Parks in Santa Paula include: Harding Park (1), Las Piedras Park (2), Veterans Memorial Park (3), Obregon Park (4), Ebell Park (5), Mill Park (6). Display/hide their locations on the map
Tourist attraction: Aviation Museum of Santa Paula (Airport).
Birthplace of: Eric Fleming - Television actor, Jim Colborn - Baseball player and coach, Laura Diaz (TV anchor) - Journalist, Danny Flores - Male singer, Scott Holman (baseball) - Baseball player.
| This city: | 3.5 people |
| California: | 2.9 people |
| This city: | 80.1% |
| Whole state: | 68.7% |
| This city: | 7.0% |
| Whole state: | 7.2% |
Likely homosexual households (counted as self-reported same-sex unmarried-partner households)
- Lesbian couples: 0.2% of all households
- Gay men: 0.3% of all households
People in group quarters in Santa Paula in 2010:
- 89 people in nursing facilities/skilled-nursing facilities
- 32 people in other noninstitutional facilities
- 5 people in group homes intended for adults
- 5 people in residential treatment centers for adults
People in group quarters in Santa Paula in 2000:
- 129 people in nursing homes
- 44 people in other noninstitutional group quarters
- 33 people in other group homes
- 16 people in college dormitories (includes college quarters off campus)
- 13 people in religious group quarters
- 8 people in homes for the mentally retarded
Banks with branches in Santa Paula (2011 data):
- Ojai Community Bank: Harvard Branch at 537 W Harvard Blvd, branch established on 1967/01/30; Santa Paula Branch at 948 E Main St, branch established on 1929/10/19. Info updated 2009/09/28: Bank assets: $128.3 mil, Deposits: $114.3 mil, headquarters in Ojai, CA, positive income, Commercial Lending Specialization, 3 total offices
- Bank of America, National Association: Santa Paula Branch at 715 East Main Street, branch established on 1927/02/19. Info updated 2009/11/18: Bank assets: $1,451,969.3 mil, Deposits: $1,077,176.8 mil, headquarters in Charlotte, NC, positive income, 5782 total offices, Holding Company: Bank Of America Corporation
- Union Bank, National Association: Santa Paula Branch at 634 East Main, branch established on 1997/11/12. Info updated 2011/09/01: Bank assets: $88,967.5 mil, Deposits: $65,286.4 mil, headquarters in San Francisco, CA, positive income, Commercial Lending Specialization, 403 total offices, Holding Company: Mitsubishi Ufj Financial Group, Inc.
- Santa Clara Valley Bank, National Association: at 901 East Main Street, branch established on 1998/12/01. Info updated 2006/11/03: Bank assets: $126.7 mil, Deposits: $105.1 mil, local headquarters, positive income, Commercial Lending Specialization, 3 total offices
- Wells Fargo Bank, National Association: Santa Paula Center Branch at 576 West Main Street, branch established on 1997/05/07. Info updated 2011/04/05: Bank assets: $1,161,490.0 mil, Deposits: $905,653.0 mil, headquarters in Sioux Falls, SD, positive income, 6395 total offices, Holding Company: Wells Fargo & Company
For population 15 years and over in Santa Paula:
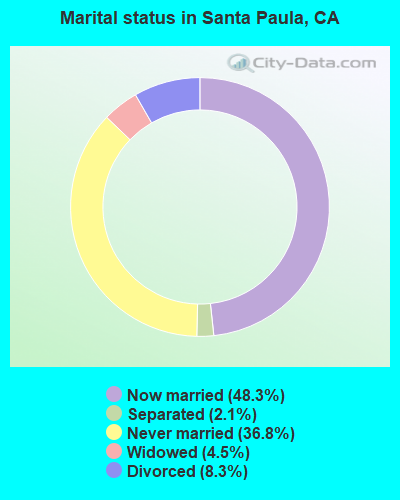
- Never married: 36.8%
- Now married: 48.3%
- Separated: 2.1%
- Widowed: 4.5%
- Divorced: 8.3%
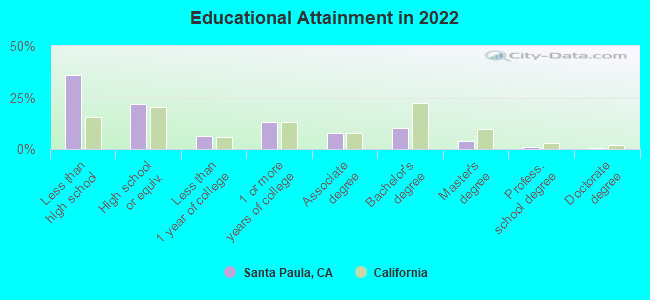
For population 25 years and over in Santa Paula:
- High school or higher: 64.4%
- Bachelor's degree or higher: 13.9%
- Graduate or professional degree: 4.7%
- Unemployed: 8.0%
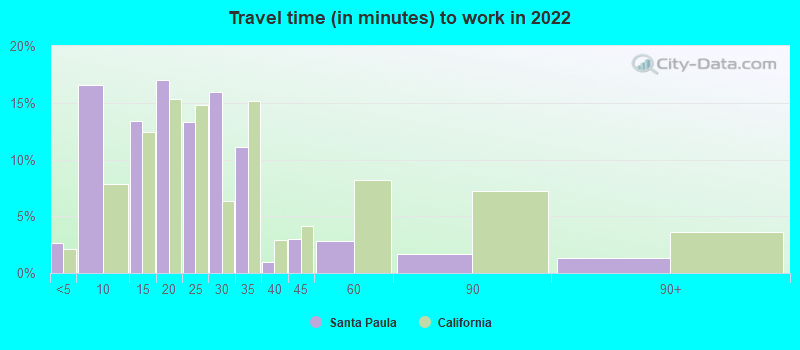
- Mean travel time to work (commute): 25.2 minutes
| Here: | 21.8 |
| California average: | 15.5 |
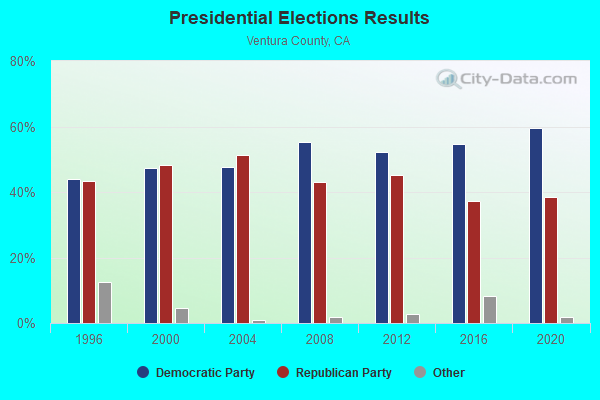
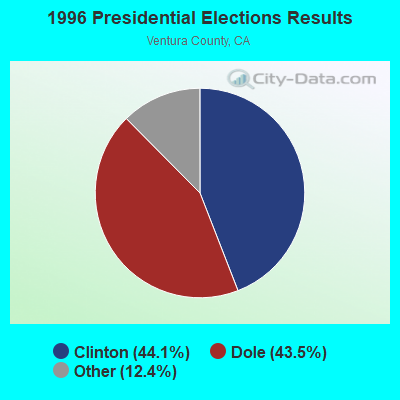
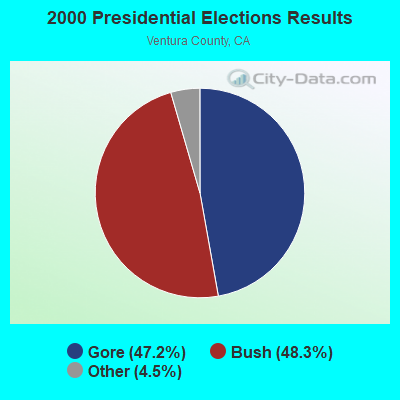
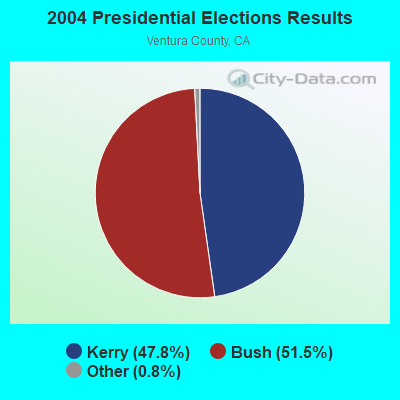
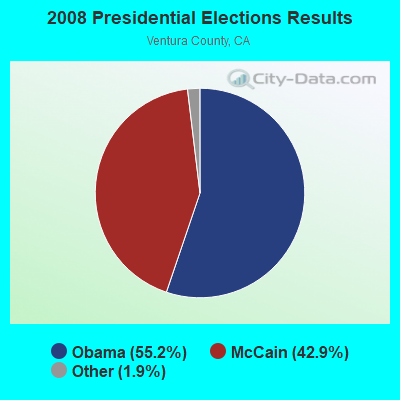
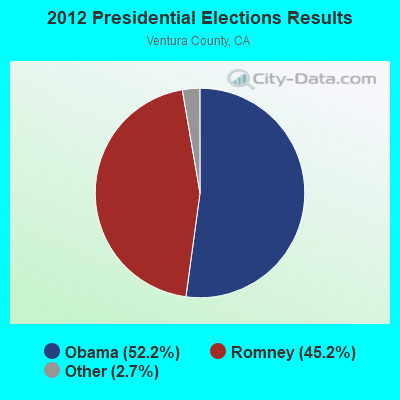
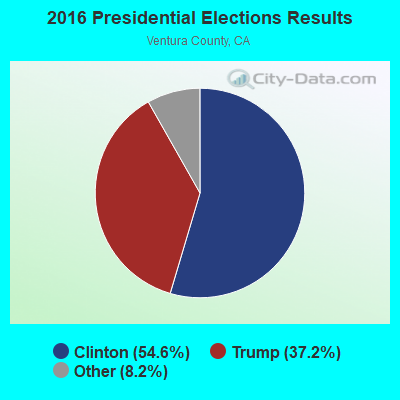
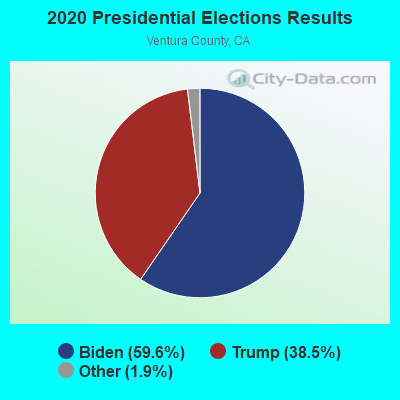
Graphs represent county-level data. Detailed 2008 Election Results
Religion statistics for Santa Paula, CA (based on Ventura County data)
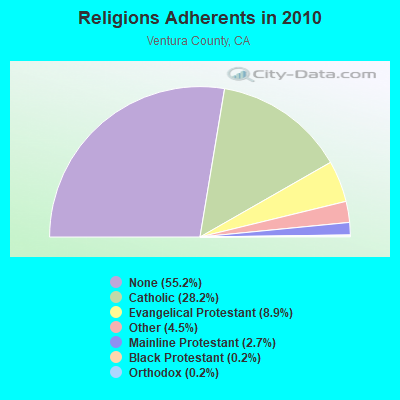
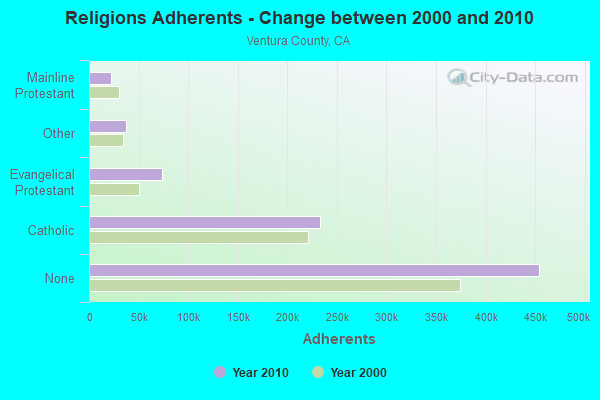
| Religion | Adherents | Congregations |
|---|---|---|
| Catholic | 232,571 | 20 |
| Evangelical Protestant | 73,341 | 268 |
| Other | 37,398 | 118 |
| Mainline Protestant | 22,006 | 65 |
| Black Protestant | 1,986 | 4 |
| Orthodox | 1,680 | 7 |
| None | 454,336 | - |
Food Environment Statistics:
| This county: | 1.97 / 10,000 pop. |
| California: | 2.14 / 10,000 pop. |
| This county: | 0.05 / 10,000 pop. |
| California: | 0.04 / 10,000 pop. |
| Here: | 0.57 / 10,000 pop. |
| State: | 0.62 / 10,000 pop. |
| This county: | 1.69 / 10,000 pop. |
| California: | 1.49 / 10,000 pop. |
| Ventura County: | 7.28 / 10,000 pop. |
| California: | 7.42 / 10,000 pop. |
| Ventura County: | 7.4% |
| California: | 7.3% |
| Here: | 23.1% |
| California: | 21.3% |
| This county: | 19.0% |
| California: | 17.9% |
Health and Nutrition:
| Here: | 47.3% |
| California: | 49.4% |
| Santa Paula: | 47.3% |
| California: | 48.0% |
| This city: | 28.4 |
| State: | 28.1 |
| Here: | 20.9% |
| California: | 20.2% |
| Here: | 9.6% |
| California: | 11.2% |
| Santa Paula: | 6.8 |
| California: | 6.8 |
| Here: | 31.9% |
| California: | 31.5% |
| Here: | 55.2% |
| California: | 56.4% |
| Here: | 81.1% |
| State: | 80.9% |
More about Health and Nutrition of Santa Paula, CA Residents
| Local government employment and payroll (March 2022) | |||||
| Function | Full-time employees | Monthly full-time payroll | Average yearly full-time wage | Part-time employees | Monthly part-time payroll |
|---|---|---|---|---|---|
| Police Protection - Officers | 28 | $328,587 | $140,823 | 0 | $0 |
| Other Government Administration | 23 | $167,966 | $87,634 | 0 | $0 |
| Police - Other | 17 | $139,039 | $98,145 | 3 | $6,160 |
| Water Supply | 13 | $82,132 | $75,814 | 0 | $0 |
| Financial Administration | 11 | $81,983 | $89,436 | 0 | $0 |
| Parks and Recreation | 9 | $58,108 | $77,477 | 23 | $27,461 |
| Other and Unallocable | 7 | $57,368 | $98,345 | 1 | $1,616 |
| Streets and Highways | 5 | $28,111 | $67,466 | 0 | $0 |
| Totals for Government | 113 | $943,294 | $100,173 | 27 | $35,236 |
Santa Paula government finances - Expenditure in 2017 (per resident):
- Construction - Parks and Recreation: $3,088,000 ($99.56)
Regular Highways: $1,066,000 ($34.37)
Police Protection: $284,000 ($9.16)
Central Staff Services: $215,000 ($6.93)
- Current Operations - Police Protection: $6,231,000 ($200.88)
Sewerage: $5,233,000 ($168.71)
Central Staff Services: $5,057,000 ($163.03)
Water Utilities: $3,615,000 ($116.55)
Local Fire Protection: $3,019,000 ($97.33)
Regular Highways: $1,534,000 ($49.46)
Parks and Recreation: $1,429,000 ($46.07)
Protective Inspection and Regulation - Other: $746,000 ($24.05)
Health - Other: $170,000 ($5.48)
Libraries: $7,000 ($0.23)
- General - Interest on Debt: $3,942,000 ($127.09)
- Other Capital Outlay - Water Utilities: $5,028,000 ($162.10)
Sewerage: $107,000 ($3.45)
Local Fire Protection: $62,000 ($2.00)
- Water Utilities - Interest on Debt: $2,416,000 ($77.89)
Santa Paula government finances - Revenue in 2017 (per resident):
- Charges - Sewerage: $11,133,000 ($358.92)
Other: $4,094,000 ($131.99)
Parks and Recreation: $241,000 ($7.77)
Regular Highways: $136,000 ($4.38)
- Federal Intergovernmental - Other: $742,000 ($23.92)
Housing and Community Development: $167,000 ($5.38)
- Miscellaneous - General Revenue - Other: $1,063,000 ($34.27)
Special Assessments: $320,000 ($10.32)
Rents: $273,000 ($8.80)
Interest Earnings: $227,000 ($7.32)
Fines and Forfeits: $128,000 ($4.13)
Donations From Private Sources: $82,000 ($2.64)
- Revenue - Water Utilities: $7,856,000 ($253.27)
- State Intergovernmental - Other: $943,000 ($30.40)
Highways: $594,000 ($19.15)
General Local Government Support: $26,000 ($0.84)
- Tax - Property: $6,285,000 ($202.62)
General Sales and Gross Receipts: $2,770,000 ($89.30)
Public Utilities Sales: $748,000 ($24.12)
Other License: $436,000 ($14.06)
Occupation and Business License - Other: $128,000 ($4.13)
Other Selective Sales: $100,000 ($3.22)
Documentary and Stock Transfer: $60,000 ($1.93)
Other: $11,000 ($0.35)
Santa Paula government finances - Debt in 2017 (per resident):
- Long Term Debt - Beginning Outstanding - Unspecified Public Purpose: $127,397,000 ($4107.20)
Outstanding Unspecified Public Purpose: $124,927,000 ($4027.56)
Retired Unspecified Public Purpose: $2,470,000 ($79.63)
Santa Paula government finances - Cash and Securities in 2017 (per resident):
- Bond Funds - Cash and Securities: $3,789,000 ($122.15)
- Other Funds - Cash and Securities: $45,740,000 ($1474.63)
4.96% of this county's 2021 resident taxpayers lived in other counties in 2020 ($110,211 average adjusted gross income)
| Here: | 4.96% |
| California average: | 5.19% |
0.03% of residents moved from foreign countries ($345 average AGI)
Ventura County: 0.03% California average: 0.03%
Top counties from which taxpayers relocated into this county between 2020 and 2021:
| from Los Angeles County, CA | |
| from Santa Barbara County, CA | |
| from Orange County, CA |
5.51% of this county's 2020 resident taxpayers moved to other counties in 2021 ($95,405 average adjusted gross income)
| Here: | 5.51% |
| California average: | 6.14% |
0.02% of residents moved to foreign countries ($247 average AGI)
Ventura County: 0.02% California average: 0.02%
Top counties to which taxpayers relocated from this county between 2020 and 2021:
| to Los Angeles County, CA | |
| to San Diego County, CA | |
| to Santa Barbara County, CA |
| Businesses in Santa Paula, CA | ||||
| Name | Count | Name | Count | |
|---|---|---|---|---|
| AutoZone | 1 | Kmart | 1 | |
| Baskin-Robbins | 1 | McDonald's | 1 | |
| Blockbuster | 1 | Nike | 2 | |
| CVS | 1 | Payless | 1 | |
| Carl\s Jr. | 1 | RadioShack | 1 | |
| Chevrolet | 1 | Rite Aid | 1 | |
| Circle K | 2 | Sears | 1 | |
| Curves | 1 | Starbucks | 1 | |
| Domino's Pizza | 1 | T-Mobile | 1 | |
| FedEx | 3 | Taco Bell | 1 | |
| GNC | 1 | U-Haul | 1 | |
| H&R Block | 1 | UPS | 1 | |
| KFC | 1 | Vons | 1 | |
Strongest AM radio stations in Santa Paula:
- KOXR (910 AM; 5 kW; OXNARD, CA; Owner: LAZER BROADCASTING CORPORATION)
- KKZZ (1400 AM; 1 kW; SANTA PAULA, CA; Owner: GOLD COAST BROADCASTING LLC)
- KACD (850 AM; 25 kW; THOUSAND OAKS, CA; Owner: CITICASTERS LICENSES, L.P.)
- KSPN (710 AM; 50 kW; LOS ANGELES, CA; Owner: KABC-AM RADIO, INC.)
- KVTA (1520 AM; 10 kW; PORT HUENEME, CA; Owner: GOLD COAST BROADCASTING LLC)
- KUNX (1590 AM; 5 kW; VENTURA, CA; Owner: GOLD COAST BROADCASTING LLC)
- KLAC (570 AM; 50 kW; LOS ANGELES, CA; Owner: AMFM RADIO LICENSES, L.L.C.)
- KIRN (670 AM; 35 kW; SIMI VALLEY, CA; Owner: LOTUS OXNARD CORP.)
- KFWB (980 AM; 50 kW; LOS ANGELES, CA; Owner: INFINITY BROADCASTING OPERATIONS, INC.)
- KNX (1070 AM; 50 kW; LOS ANGELES, CA; Owner: INFINITY BROADCASTING OPERATIONS, INC.)
- KFI (640 AM; 50 kW; LOS ANGELES, CA; Owner: CAPSTAR TX LIMITED PARTNERSHIP)
- KSUR (1260 AM; 25 kW; BEVERLY HILLS, CA)
- KBLA (1580 AM; 50 kW; SANTA MONICA, CA)
Strongest FM radio stations in Santa Paula:
- KCZN (96.7 FM; SANTA PAULA, CA; Owner: LAZER BROADCASTING CORPORATION)
- K272DI (102.3 FM; FILLMORE, CA; Owner: SANTA MONICA COMMUNITY COLLEGE DIST.)
- KLFH (89.5 FM; OJAI, CA; Owner: SHEPHERD COMMUNICATIONS, INC.)
- KMRO (90.3 FM; CAMARILLO, CA; Owner: THE ASSOCIATION FOR COMMUNITY EDUCATION, INC.)
- KCPB (91.1 FM; THOUSAND OAKS, CA; Owner: UNIVERSITY OF SOUTHERN CALIFORNIA)
- KSSC (107.1 FM; VENTURA, CA; Owner: ENTRAVISION HOLDINGS, LLC)
- KDAR (98.3 FM; OXNARD, CA; Owner: ATEP RADIO, INC.)
- KCAQ (104.7 FM; OXNARD, CA; Owner: GOLD COAST BROADCASTING LLC)
- KOCP (95.9 FM; CAMARILLO, CA; Owner: GOLD COAST BROADCASTING LLC)
- KMLA (103.7 FM; EL RIO, CA; Owner: GOLD COAST RADIO, L.L.C.)
- KFYV (105.5 FM; OJAI, CA; Owner: GOLD COAST BROADCASTING LLC)
- K271AC (102.1 FM; OJAI, CA; Owner: SANTA MONICA COMMUNITY COLLEGE DIST.)
- KHAY (100.7 FM; VENTURA, CA; Owner: CUMULUS LICENSING CORP.)
- K293AG (106.5 FM; TAFT, CA; Owner: CENTRO CRISTIANO DE FE, INC.)
- K254AH (98.7 FM; ISLA VISTA, CA; Owner: PACIFICA FOUNDATION, INC.)
- K220FR (91.9 FM; SIMI VALLEY, CA; Owner: LIFE ON THE WAY COMMUNICATIONS, INC.)
- KCSN (88.5 FM; NORTHRIDGE, CA; Owner: CALIFORNIA STATE UNIVERSITY, NORTHRIDGE)
- K210CH (89.9 FM; OAK VIEW, CA; Owner: LIFE ON THE WAY COMMUNICATIONS, INC.)
- KKBT (100.3 FM; LOS ANGELES, CA; Owner: RADIO ONE LICENSES, LLC)
- KBBY-FM (95.1 FM; VENTURA, CA; Owner: CUMULUS LICENSING CORP.)
TV broadcast stations around Santa Paula:
- KADY-TV (Channel 63; OXNARD, CA; Owner: BILTMORE BROADCASTING, L.L.C.)
- K25GV (Channel 25; OXNARD, CA; Owner: CAPITAL BROADCASTING CORP.)
- KTRO-LP (Channel 50; LANCASTER, CA; Owner: ROBERT D. ADELMAN)
- KJLA (Channel 57; VENTURA, CA; Owner: KJLA, LLC)
- National Bridge Inventory (NBI) Statistics
- 40Number of bridges
- 456ft / 139mTotal length
- 826,250Total average daily traffic
- 70,683Total average daily truck traffic
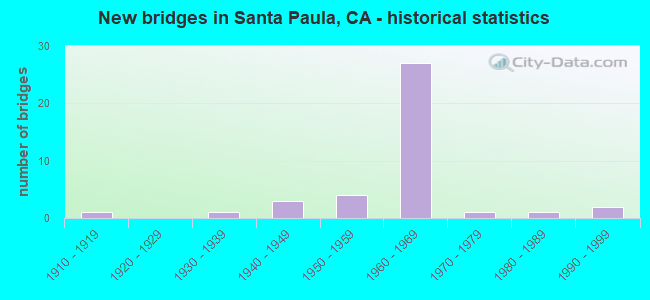
- New bridges - historical statistics
- 11910-1919
- 11930-1939
- 31940-1949
- 41950-1959
- 271960-1969
- 11970-1979
- 11980-1989
- 21990-1999
FCC Registered Commercial Land Mobile Towers: 3 (See the full list of FCC Registered Commercial Land Mobile Towers in Santa Paula, CA)
FCC Registered Private Land Mobile Towers: 17 (See the full list of FCC Registered Private Land Mobile Towers)
FCC Registered Broadcast Land Mobile Towers: 39 (See the full list of FCC Registered Broadcast Land Mobile Towers)
FCC Registered Microwave Towers: 80 (See the full list of FCC Registered Microwave Towers in this town)
FCC Registered Paging Towers: 22 (See the full list of FCC Registered Paging Towers)
FCC Registered Amateur Radio Licenses: 108 (See the full list of FCC Registered Amateur Radio Licenses in Santa Paula)
FAA Registered Aircraft Manufacturers and Dealers: 3 (See the full list of FAA Registered Manufacturers and Dealers in Santa Paula)
FAA Registered Aircraft: 121 (See the full list of FAA Registered Aircraft)
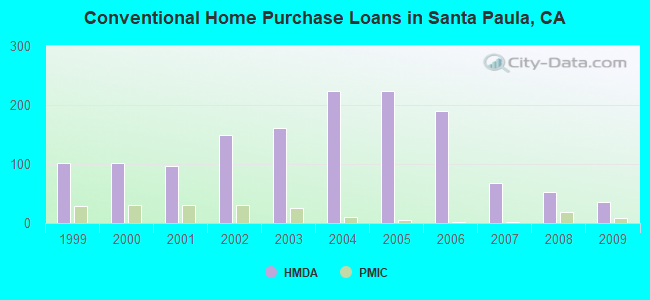
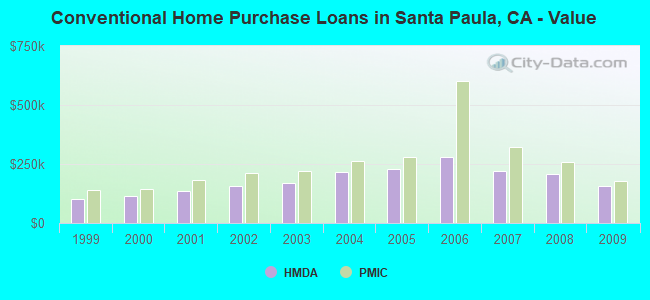
| Home Mortgage Disclosure Act Aggregated Statistics For Year 2009 (Based on 2 full tracts) | ||||||||||||||
| A) FHA, FSA/RHS & VA Home Purchase Loans | B) Conventional Home Purchase Loans | C) Refinancings | D) Home Improvement Loans | E) Loans on Dwellings For 5+ Families | F) Non-occupant Loans on < 5 Family Dwellings (A B C & D) | G) Loans On Manufactured Home Dwelling (A B C & D) | ||||||||
|---|---|---|---|---|---|---|---|---|---|---|---|---|---|---|
| Number | Average Value | Number | Average Value | Number | Average Value | Number | Average Value | Number | Average Value | Number | Average Value | Number | Average Value | |
| LOANS ORIGINATED | 58 | $217,564 | 36 | $155,205 | 90 | $187,024 | 3 | $181,593 | 1 | $247,060 | 18 | $151,305 | 1 | $77,970 |
| APPLICATIONS APPROVED, NOT ACCEPTED | 3 | $249,900 | 6 | $172,557 | 13 | $212,944 | 2 | $278,885 | 0 | $0 | 1 | $385,300 | 0 | $0 |
| APPLICATIONS DENIED | 16 | $233,426 | 21 | $144,843 | 40 | $262,557 | 5 | $102,488 | 1 | $784,320 | 14 | $165,613 | 2 | $43,980 |
| APPLICATIONS WITHDRAWN | 9 | $196,317 | 9 | $183,856 | 22 | $216,413 | 4 | $86,755 | 0 | $0 | 7 | $139,251 | 0 | $0 |
| FILES CLOSED FOR INCOMPLETENESS | 3 | $222,373 | 3 | $208,917 | 2 | $291,385 | 1 | $164,930 | 0 | $0 | 4 | $266,642 | 0 | $0 |
Detailed HMDA statistics for the following Tracts: 0006.00 , 0007.00
| Private Mortgage Insurance Companies Aggregated Statistics For Year 2009 (Based on 2 full tracts) | ||||
| A) Conventional Home Purchase Loans | B) Refinancings | |||
|---|---|---|---|---|
| Number | Average Value | Number | Average Value | |
| LOANS ORIGINATED | 8 | $178,545 | 1 | $131,950 |
| APPLICATIONS APPROVED, NOT ACCEPTED | 1 | $178,930 | 0 | $0 |
| APPLICATIONS DENIED | 2 | $149,940 | 0 | $0 |
| APPLICATIONS WITHDRAWN | 1 | $305,880 | 0 | $0 |
| FILES CLOSED FOR INCOMPLETENESS | 0 | $0 | 0 | $0 |
Detailed PMIC statistics for the following Tracts: 0006.00 , 0007.00
2005 - 2018 National Fire Incident Reporting System (NFIRS) incidents
- Fire incident types reported to NFIRS in Santa Paula, CA
- 30138.1%Outside Fires
- 29437.2%Structure Fires
- 11514.5%Mobile Property/Vehicle Fires
- 8110.2%Other
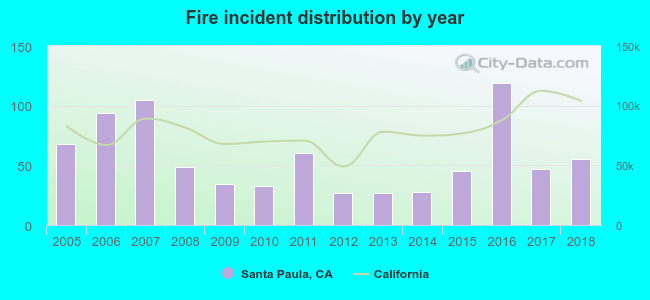 Based on the data from the years 2005 - 2018 the average number of fire incidents per year is 56. The highest number of fire incidents - 119 took place in 2016, and the least - 27 in 2012. The data has a dropping trend.
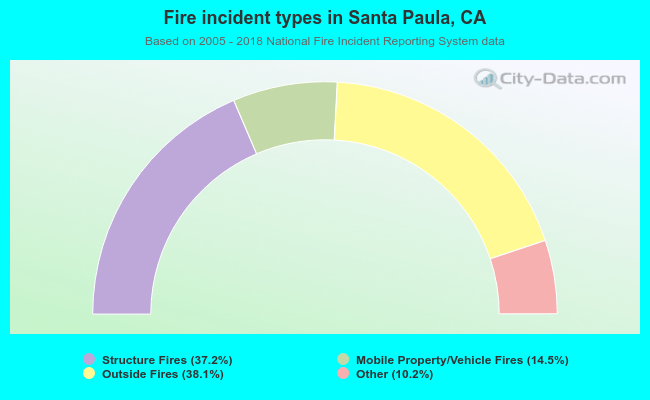 When looking into fire subcategories, the most reports belonged to: Outside Fires (38.1%), and Structure Fires (37.2%).
| Most common first names in Santa Paula, CA among deceased individuals | ||
| Name | Count | Lived (average) |
|---|---|---|
| John | 149 | 75.7 years |
| Mary | 127 | 82.8 years |
| William | 111 | 77.3 years |
| James | 110 | 76.7 years |
| Robert | 88 | 73.1 years |
| Charles | 81 | 77.1 years |
| George | 77 | 78.4 years |
| Maria | 61 | 78.3 years |
| Frank | 58 | 76.6 years |
| Helen | 56 | 84.5 years |
| Most common last names in Santa Paula, CA among deceased individuals | ||
| Last name | Count | Lived (average) |
|---|---|---|
| Garcia | 63 | 74.4 years |
| Brown | 46 | 79.6 years |
| Hernandez | 46 | 75.0 years |
| Smith | 41 | 75.8 years |
| Johnson | 36 | 76.3 years |
| Martinez | 33 | 75.8 years |
| Rodriguez | 31 | 69.8 years |
| Perez | 27 | 72.3 years |
| Lopez | 27 | 68.2 years |
| Davis | 27 | 75.7 years |
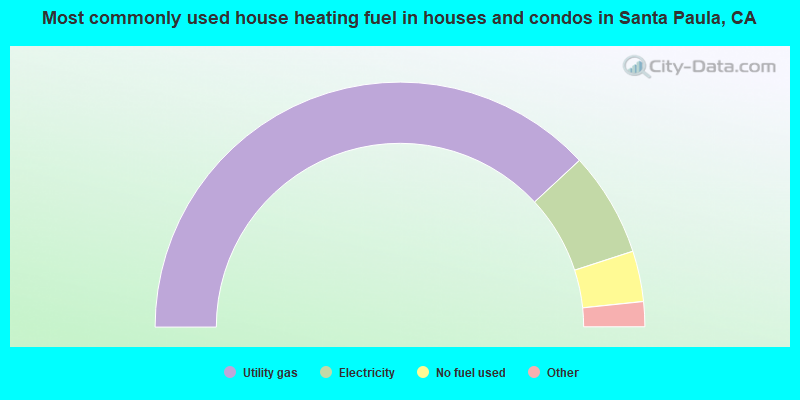
- 76.2%Utility gas
- 13.8%Electricity
- 6.7%No fuel used
- 2.5%Wood
- 0.4%Bottled, tank, or LP gas
- 0.2%Solar energy
- 0.1%Other fuel
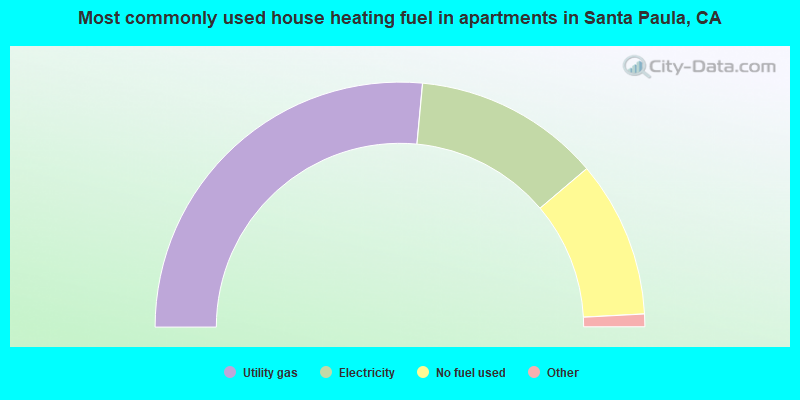
- 53.0%Utility gas
- 24.7%Electricity
- 20.7%No fuel used
- 1.5%Bottled, tank, or LP gas
- 0.1%Other fuel
Santa Paula compared to California state average:
- Unemployed percentage below state average.
- Black race population percentage significantly below state average.
- Hispanic race population percentage above state average.
- Length of stay since moving in significantly above state average.
- Percentage of population with a bachelor's degree or higher below state average.
Santa Paula on our top lists:
- #67 on the list of "Top 101 cities with largest percentage of males in occupations: farming, fishing, and forestry occupations (population 5,000+)"
- #74 on the list of "Top 101 cities with largest percentage of males in industries: agriculture, forestry, fishing and hunting (population 5,000+)"
- #86 on the list of "Top 101 cities with largest percentage of females in industries: agriculture, forestry, fishing and hunting (population 5,000+)"
- #16 on the list of "Top 101 counties with the highest lead air pollution readings in 2012 (µg/m3)"
- #18 on the list of "Top 101 counties with the lowest lead air pollution readings in 2012 (µg/m3)"
- #38 on the list of "Top 101 counties with the highest Particulate Matter (PM10) Annual air pollution readings in 2012 (µg/m3)"
- #44 on the list of "Top 101 counties with the highest surface withdrawal of fresh water for public supply (pop. 50,000+)"
- #44 on the list of "Top 101 counties with the most Other congregations (pop. 50,000+)"

|
|
Total of 47 patent applications in 2008-2024.