River Falls, Wisconsin Submit your own pictures of this city and show them to the world
OSM Map
General Map
Google Map
MSN Map
OSM Map
General Map
Google Map
MSN Map
OSM Map
General Map
Google Map
MSN Map
OSM Map
General Map
Google Map
MSN Map
Please wait while loading the map...
Population in 2022: 16,609 (100% urban, 0% rural). Population change since 2000: +32.2%Males: 7,816 Females: 8,793
March 2022 cost of living index in River Falls: 113.3 (more than average, U.S. average is 100) Percentage of residents living in poverty in 2022: 18.1%for White Non-Hispanic residents , 46.2% for Black residents , 29.0% for Hispanic or Latino residents , 41.0% for other race residents , 10.6% for two or more races residents )
Profiles of local businesses
Business Search - 14 Million verified businesses
Data:
Median household income ($)
Median household income (% change since 2000)
Household income diversity
Ratio of average income to average house value (%)
Ratio of average income to average rent
Median household income ($) - White
Median household income ($) - Black or African American
Median household income ($) - Asian
Median household income ($) - Hispanic or Latino
Median household income ($) - American Indian and Alaska Native
Median household income ($) - Multirace
Median household income ($) - Other Race
Median household income for houses/condos with a mortgage ($)
Median household income for apartments without a mortgage ($)
Races - White alone (%)
Races - White alone (% change since 2000)
Races - Black alone (%)
Races - Black alone (% change since 2000)
Races - American Indian alone (%)
Races - American Indian alone (% change since 2000)
Races - Asian alone (%)
Races - Asian alone (% change since 2000)
Races - Hispanic (%)
Races - Hispanic (% change since 2000)
Races - Native Hawaiian and Other Pacific Islander alone (%)
Races - Native Hawaiian and Other Pacific Islander alone (% change since 2000)
Races - Two or more races (%)
Races - Two or more races (% change since 2000)
Races - Other race alone (%)
Races - Other race alone (% change since 2000)
Racial diversity
Unemployment (%)
Unemployment (% change since 2000)
Unemployment (%) - White
Unemployment (%) - Black or African American
Unemployment (%) - Asian
Unemployment (%) - Hispanic or Latino
Unemployment (%) - American Indian and Alaska Native
Unemployment (%) - Multirace
Unemployment (%) - Other Race
Population density (people per square mile)
Population - Males (%)
Population - Females (%)
Population - Males (%) - White
Population - Males (%) - Black or African American
Population - Males (%) - Asian
Population - Males (%) - Hispanic or Latino
Population - Males (%) - American Indian and Alaska Native
Population - Males (%) - Multirace
Population - Males (%) - Other Race
Population - Females (%) - White
Population - Females (%) - Black or African American
Population - Females (%) - Asian
Population - Females (%) - Hispanic or Latino
Population - Females (%) - American Indian and Alaska Native
Population - Females (%) - Multirace
Population - Females (%) - Other Race
Coronavirus confirmed cases (May 07, 2024)
Deaths caused by coronavirus (May 07, 2024)
Coronavirus confirmed cases (per 100k population) (May 07, 2024)
Deaths caused by coronavirus (per 100k population) (May 07, 2024)
Daily increase in number of cases (May 07, 2024)
Weekly increase in number of cases (May 07, 2024)
Cases doubled (in days) (May 07, 2024)
Hospitalized patients (Apr 18, 2022)
Negative test results (Apr 18, 2022)
Total test results (Apr 18, 2022)
COVID Vaccine doses distributed (per 100k population) (Sep 19, 2023)
COVID Vaccine doses administered (per 100k population) (Sep 19, 2023)
COVID Vaccine doses distributed (Sep 19, 2023)
COVID Vaccine doses administered (Sep 19, 2023)
Likely homosexual households (%)
Likely homosexual households (% change since 2000)
Likely homosexual households - Lesbian couples (%)
Likely homosexual households - Lesbian couples (% change since 2000)
Likely homosexual households - Gay men (%)
Likely homosexual households - Gay men (% change since 2000)
Cost of living index
Median gross rent ($)
Median contract rent ($)
Median monthly housing costs ($)
Median house or condo value ($)
Median house or condo value ($ change since 2000)
Mean house or condo value by units in structure - 1, detached ($)
Mean house or condo value by units in structure - 1, attached ($)
Mean house or condo value by units in structure - 2 ($)
Mean house or condo value by units in structure by units in structure - 3 or 4 ($)
Mean house or condo value by units in structure - 5 or more ($)
Mean house or condo value by units in structure - Boat, RV, van, etc. ($)
Mean house or condo value by units in structure - Mobile home ($)
Median house or condo value ($) - White
Median house or condo value ($) - Black or African American
Median house or condo value ($) - Asian
Median house or condo value ($) - Hispanic or Latino
Median house or condo value ($) - American Indian and Alaska Native
Median house or condo value ($) - Multirace
Median house or condo value ($) - Other Race
Median resident age
Resident age diversity
Median resident age - Males
Median resident age - Females
Median resident age - White
Median resident age - Black or African American
Median resident age - Asian
Median resident age - Hispanic or Latino
Median resident age - American Indian and Alaska Native
Median resident age - Multirace
Median resident age - Other Race
Median resident age - Males - White
Median resident age - Males - Black or African American
Median resident age - Males - Asian
Median resident age - Males - Hispanic or Latino
Median resident age - Males - American Indian and Alaska Native
Median resident age - Males - Multirace
Median resident age - Males - Other Race
Median resident age - Females - White
Median resident age - Females - Black or African American
Median resident age - Females - Asian
Median resident age - Females - Hispanic or Latino
Median resident age - Females - American Indian and Alaska Native
Median resident age - Females - Multirace
Median resident age - Females - Other Race
Commute - mean travel time to work (minutes)
Travel time to work - Less than 5 minutes (%)
Travel time to work - Less than 5 minutes (% change since 2000)
Travel time to work - 5 to 9 minutes (%)
Travel time to work - 5 to 9 minutes (% change since 2000)
Travel time to work - 10 to 19 minutes (%)
Travel time to work - 10 to 19 minutes (% change since 2000)
Travel time to work - 20 to 29 minutes (%)
Travel time to work - 20 to 29 minutes (% change since 2000)
Travel time to work - 30 to 39 minutes (%)
Travel time to work - 30 to 39 minutes (% change since 2000)
Travel time to work - 40 to 59 minutes (%)
Travel time to work - 40 to 59 minutes (% change since 2000)
Travel time to work - 60 to 89 minutes (%)
Travel time to work - 60 to 89 minutes (% change since 2000)
Travel time to work - 90 or more minutes (%)
Travel time to work - 90 or more minutes (% change since 2000)
Marital status - Never married (%)
Marital status - Now married (%)
Marital status - Separated (%)
Marital status - Widowed (%)
Marital status - Divorced (%)
Median family income ($)
Median family income (% change since 2000)
Median non-family income ($)
Median non-family income (% change since 2000)
Median per capita income ($)
Median per capita income (% change since 2000)
Median family income ($) - White
Median family income ($) - Black or African American
Median family income ($) - Asian
Median family income ($) - Hispanic or Latino
Median family income ($) - American Indian and Alaska Native
Median family income ($) - Multirace
Median family income ($) - Other Race
Median year house/condo built
Median year apartment built
Year house built - Built 2005 or later (%)
Year house built - Built 2000 to 2004 (%)
Year house built - Built 1990 to 1999 (%)
Year house built - Built 1980 to 1989 (%)
Year house built - Built 1970 to 1979 (%)
Year house built - Built 1960 to 1969 (%)
Year house built - Built 1950 to 1959 (%)
Year house built - Built 1940 to 1949 (%)
Year house built - Built 1939 or earlier (%)
Average household size
Household density (households per square mile)
Average household size - White
Average household size - Black or African American
Average household size - Asian
Average household size - Hispanic or Latino
Average household size - American Indian and Alaska Native
Average household size - Multirace
Average household size - Other Race
Occupied housing units (%)
Vacant housing units (%)
Owner occupied housing units (%)
Renter occupied housing units (%)
Vacancy status - For rent (%)
Vacancy status - For sale only (%)
Vacancy status - Rented or sold, not occupied (%)
Vacancy status - For seasonal, recreational, or occasional use (%)
Vacancy status - For migrant workers (%)
Vacancy status - Other vacant (%)
Residents with income below the poverty level (%)
Residents with income below 50% of the poverty level (%)
Children below poverty level (%)
Poor families by family type - Married-couple family (%)
Poor families by family type - Male, no wife present (%)
Poor families by family type - Female, no husband present (%)
Poverty status for native-born residents (%)
Poverty status for foreign-born residents (%)
Poverty among high school graduates not in families (%)
Poverty among people who did not graduate high school not in families (%)
Residents with income below the poverty level (%) - White
Residents with income below the poverty level (%) - Black or African American
Residents with income below the poverty level (%) - Asian
Residents with income below the poverty level (%) - Hispanic or Latino
Residents with income below the poverty level (%) - American Indian and Alaska Native
Residents with income below the poverty level (%) - Multirace
Residents with income below the poverty level (%) - Other Race
Air pollution - Air Quality Index (AQI)
Air pollution - CO
Air pollution - NO2
Air pollution - SO2
Air pollution - Ozone
Air pollution - PM10
Air pollution - PM25
Air pollution - Pb
Crime - Murders per 100,000 population
Crime - Rapes per 100,000 population
Crime - Robberies per 100,000 population
Crime - Assaults per 100,000 population
Crime - Burglaries per 100,000 population
Crime - Thefts per 100,000 population
Crime - Auto thefts per 100,000 population
Crime - Arson per 100,000 population
Crime - City-data.com crime index
Crime - Violent crime index
Crime - Property crime index
Crime - Murders per 100,000 population (5 year average)
Crime - Rapes per 100,000 population (5 year average)
Crime - Robberies per 100,000 population (5 year average)
Crime - Assaults per 100,000 population (5 year average)
Crime - Burglaries per 100,000 population (5 year average)
Crime - Thefts per 100,000 population (5 year average)
Crime - Auto thefts per 100,000 population (5 year average)
Crime - Arson per 100,000 population (5 year average)
Crime - City-data.com crime index (5 year average)
Crime - Violent crime index (5 year average)
Crime - Property crime index (5 year average)
1996 Presidential Elections Results (%) - Democratic Party (Clinton)
1996 Presidential Elections Results (%) - Republican Party (Dole)
1996 Presidential Elections Results (%) - Other
2000 Presidential Elections Results (%) - Democratic Party (Gore)
2000 Presidential Elections Results (%) - Republican Party (Bush)
2000 Presidential Elections Results (%) - Other
2004 Presidential Elections Results (%) - Democratic Party (Kerry)
2004 Presidential Elections Results (%) - Republican Party (Bush)
2004 Presidential Elections Results (%) - Other
2008 Presidential Elections Results (%) - Democratic Party (Obama)
2008 Presidential Elections Results (%) - Republican Party (McCain)
2008 Presidential Elections Results (%) - Other
2012 Presidential Elections Results (%) - Democratic Party (Obama)
2012 Presidential Elections Results (%) - Republican Party (Romney)
2012 Presidential Elections Results (%) - Other
2016 Presidential Elections Results (%) - Democratic Party (Clinton)
2016 Presidential Elections Results (%) - Republican Party (Trump)
2016 Presidential Elections Results (%) - Other
2020 Presidential Elections Results (%) - Democratic Party (Biden)
2020 Presidential Elections Results (%) - Republican Party (Trump)
2020 Presidential Elections Results (%) - Other
Ancestries Reported - Arab (%)
Ancestries Reported - Czech (%)
Ancestries Reported - Danish (%)
Ancestries Reported - Dutch (%)
Ancestries Reported - English (%)
Ancestries Reported - French (%)
Ancestries Reported - French Canadian (%)
Ancestries Reported - German (%)
Ancestries Reported - Greek (%)
Ancestries Reported - Hungarian (%)
Ancestries Reported - Irish (%)
Ancestries Reported - Italian (%)
Ancestries Reported - Lithuanian (%)
Ancestries Reported - Norwegian (%)
Ancestries Reported - Polish (%)
Ancestries Reported - Portuguese (%)
Ancestries Reported - Russian (%)
Ancestries Reported - Scotch-Irish (%)
Ancestries Reported - Scottish (%)
Ancestries Reported - Slovak (%)
Ancestries Reported - Subsaharan African (%)
Ancestries Reported - Swedish (%)
Ancestries Reported - Swiss (%)
Ancestries Reported - Ukrainian (%)
Ancestries Reported - United States (%)
Ancestries Reported - Welsh (%)
Ancestries Reported - West Indian (%)
Ancestries Reported - Other (%)
Educational Attainment - No schooling completed (%)
Educational Attainment - Less than high school (%)
Educational Attainment - High school or equivalent (%)
Educational Attainment - Less than 1 year of college (%)
Educational Attainment - 1 or more years of college (%)
Educational Attainment - Associate degree (%)
Educational Attainment - Bachelor's degree (%)
Educational Attainment - Master's degree (%)
Educational Attainment - Professional school degree (%)
Educational Attainment - Doctorate degree (%)
School Enrollment - Nursery, preschool (%)
School Enrollment - Kindergarten (%)
School Enrollment - Grade 1 to 4 (%)
School Enrollment - Grade 5 to 8 (%)
School Enrollment - Grade 9 to 12 (%)
School Enrollment - College undergrad (%)
School Enrollment - Graduate or professional (%)
School Enrollment - Not enrolled in school (%)
School enrollment - Public schools (%)
School enrollment - Private schools (%)
School enrollment - Not enrolled (%)
Median number of rooms in houses and condos
Median number of rooms in apartments
Housing units lacking complete plumbing facilities (%)
Housing units lacking complete kitchen facilities (%)
Density of houses
Urban houses (%)
Rural houses (%)
Households with people 60 years and over (%)
Households with people 65 years and over (%)
Households with people 75 years and over (%)
Households with one or more nonrelatives (%)
Households with no nonrelatives (%)
Population in households (%)
Family households (%)
Nonfamily households (%)
Population in families (%)
Family households with own children (%)
Median number of bedrooms in owner occupied houses
Mean number of bedrooms in owner occupied houses
Median number of bedrooms in renter occupied houses
Mean number of bedrooms in renter occupied houses
Median number of vehichles in owner occupied houses
Mean number of vehichles in owner occupied houses
Median number of vehichles in renter occupied houses
Mean number of vehichles in renter occupied houses
Mortgage status - with mortgage (%)
Mortgage status - with second mortgage (%)
Mortgage status - with home equity loan (%)
Mortgage status - with both second mortgage and home equity loan (%)
Mortgage status - without a mortgage (%)
Average family size
Average family size - White
Average family size - Black or African American
Average family size - Asian
Average family size - Hispanic or Latino
Average family size - American Indian and Alaska Native
Average family size - Multirace
Average family size - Other Race
Geographical mobility - Same house 1 year ago (%)
Geographical mobility - Moved within same county (%)
Geographical mobility - Moved from different county within same state (%)
Geographical mobility - Moved from different state (%)
Geographical mobility - Moved from abroad (%)
Place of birth - Born in state of residence (%)
Place of birth - Born in other state (%)
Place of birth - Native, outside of US (%)
Place of birth - Foreign born (%)
Housing units in structures - 1, detached (%)
Housing units in structures - 1, attached (%)
Housing units in structures - 2 (%)
Housing units in structures - 3 or 4 (%)
Housing units in structures - 5 to 9 (%)
Housing units in structures - 10 to 19 (%)
Housing units in structures - 20 to 49 (%)
Housing units in structures - 50 or more (%)
Housing units in structures - Mobile home (%)
Housing units in structures - Boat, RV, van, etc. (%)
House/condo owner moved in on average (years ago)
Renter moved in on average (years ago)
Year householder moved into unit - Moved in 1999 to March 2000 (%)
Year householder moved into unit - Moved in 1995 to 1998 (%)
Year householder moved into unit - Moved in 1990 to 1994 (%)
Year householder moved into unit - Moved in 1980 to 1989 (%)
Year householder moved into unit - Moved in 1970 to 1979 (%)
Year householder moved into unit - Moved in 1969 or earlier (%)
Means of transportation to work - Drove car alone (%)
Means of transportation to work - Carpooled (%)
Means of transportation to work - Public transportation (%)
Means of transportation to work - Bus or trolley bus (%)
Means of transportation to work - Streetcar or trolley car (%)
Means of transportation to work - Subway or elevated (%)
Means of transportation to work - Railroad (%)
Means of transportation to work - Ferryboat (%)
Means of transportation to work - Taxicab (%)
Means of transportation to work - Motorcycle (%)
Means of transportation to work - Bicycle (%)
Means of transportation to work - Walked (%)
Means of transportation to work - Other means (%)
Working at home (%)
Industry diversity
Most Common Industries - Agriculture, forestry, fishing and hunting, and mining (%)
Most Common Industries - Agriculture, forestry, fishing and hunting (%)
Most Common Industries - Mining, quarrying, and oil and gas extraction (%)
Most Common Industries - Construction (%)
Most Common Industries - Manufacturing (%)
Most Common Industries - Wholesale trade (%)
Most Common Industries - Retail trade (%)
Most Common Industries - Transportation and warehousing, and utilities (%)
Most Common Industries - Transportation and warehousing (%)
Most Common Industries - Utilities (%)
Most Common Industries - Information (%)
Most Common Industries - Finance and insurance, and real estate and rental and leasing (%)
Most Common Industries - Finance and insurance (%)
Most Common Industries - Real estate and rental and leasing (%)
Most Common Industries - Professional, scientific, and management, and administrative and waste management services (%)
Most Common Industries - Professional, scientific, and technical services (%)
Most Common Industries - Management of companies and enterprises (%)
Most Common Industries - Administrative and support and waste management services (%)
Most Common Industries - Educational services, and health care and social assistance (%)
Most Common Industries - Educational services (%)
Most Common Industries - Health care and social assistance (%)
Most Common Industries - Arts, entertainment, and recreation, and accommodation and food services (%)
Most Common Industries - Arts, entertainment, and recreation (%)
Most Common Industries - Accommodation and food services (%)
Most Common Industries - Other services, except public administration (%)
Most Common Industries - Public administration (%)
Occupation diversity
Most Common Occupations - Management, business, science, and arts occupations (%)
Most Common Occupations - Management, business, and financial occupations (%)
Most Common Occupations - Management occupations (%)
Most Common Occupations - Business and financial operations occupations (%)
Most Common Occupations - Computer, engineering, and science occupations (%)
Most Common Occupations - Computer and mathematical occupations (%)
Most Common Occupations - Architecture and engineering occupations (%)
Most Common Occupations - Life, physical, and social science occupations (%)
Most Common Occupations - Education, legal, community service, arts, and media occupations (%)
Most Common Occupations - Community and social service occupations (%)
Most Common Occupations - Legal occupations (%)
Most Common Occupations - Education, training, and library occupations (%)
Most Common Occupations - Arts, design, entertainment, sports, and media occupations (%)
Most Common Occupations - Healthcare practitioners and technical occupations (%)
Most Common Occupations - Health diagnosing and treating practitioners and other technical occupations (%)
Most Common Occupations - Health technologists and technicians (%)
Most Common Occupations - Service occupations (%)
Most Common Occupations - Healthcare support occupations (%)
Most Common Occupations - Protective service occupations (%)
Most Common Occupations - Fire fighting and prevention, and other protective service workers including supervisors (%)
Most Common Occupations - Law enforcement workers including supervisors (%)
Most Common Occupations - Food preparation and serving related occupations (%)
Most Common Occupations - Building and grounds cleaning and maintenance occupations (%)
Most Common Occupations - Personal care and service occupations (%)
Most Common Occupations - Sales and office occupations (%)
Most Common Occupations - Sales and related occupations (%)
Most Common Occupations - Office and administrative support occupations (%)
Most Common Occupations - Natural resources, construction, and maintenance occupations (%)
Most Common Occupations - Farming, fishing, and forestry occupations (%)
Most Common Occupations - Construction and extraction occupations (%)
Most Common Occupations - Installation, maintenance, and repair occupations (%)
Most Common Occupations - Production, transportation, and material moving occupations (%)
Most Common Occupations - Production occupations (%)
Most Common Occupations - Transportation occupations (%)
Most Common Occupations - Material moving occupations (%)
People in Group quarters - Institutionalized population (%)
People in Group quarters - Correctional institutions (%)
People in Group quarters - Federal prisons and detention centers (%)
People in Group quarters - Halfway houses (%)
People in Group quarters - Local jails and other confinement facilities (including police lockups) (%)
People in Group quarters - Military disciplinary barracks (%)
People in Group quarters - State prisons (%)
People in Group quarters - Other types of correctional institutions (%)
People in Group quarters - Nursing homes (%)
People in Group quarters - Hospitals/wards, hospices, and schools for the handicapped (%)
People in Group quarters - Hospitals/wards and hospices for chronically ill (%)
People in Group quarters - Hospices or homes for chronically ill (%)
People in Group quarters - Military hospitals or wards for chronically ill (%)
People in Group quarters - Other hospitals or wards for chronically ill (%)
People in Group quarters - Hospitals or wards for drug/alcohol abuse (%)
People in Group quarters - Mental (Psychiatric) hospitals or wards (%)
People in Group quarters - Schools, hospitals, or wards for the mentally retarded (%)
People in Group quarters - Schools, hospitals, or wards for the physically handicapped (%)
People in Group quarters - Institutions for the deaf (%)
People in Group quarters - Institutions for the blind (%)
People in Group quarters - Orthopedic wards and institutions for the physically handicapped (%)
People in Group quarters - Wards in general hospitals for patients who have no usual home elsewhere (%)
People in Group quarters - Wards in military hospitals for patients who have no usual home elsewhere (%)
People in Group quarters - Juvenile institutions (%)
People in Group quarters - Long-term care (%)
People in Group quarters - Homes for abused, dependent, and neglected children (%)
People in Group quarters - Residential treatment centers for emotionally disturbed children (%)
People in Group quarters - Training schools for juvenile delinquents (%)
People in Group quarters - Short-term care, detention or diagnostic centers for delinquent children (%)
People in Group quarters - Type of juvenile institution unknown (%)
People in Group quarters - Noninstitutionalized population (%)
People in Group quarters - College dormitories (includes college quarters off campus) (%)
People in Group quarters - Military quarters (%)
People in Group quarters - On base (%)
People in Group quarters - Barracks, unaccompanied personnel housing (UPH), (Enlisted/Officer), ;and similar group living quarters for military personnel (%)
People in Group quarters - Transient quarters for temporary residents (%)
People in Group quarters - Military ships (%)
People in Group quarters - Group homes (%)
People in Group quarters - Homes or halfway houses for drug/alcohol abuse (%)
People in Group quarters - Homes for the mentally ill (%)
People in Group quarters - Homes for the mentally retarded (%)
People in Group quarters - Homes for the physically handicapped (%)
People in Group quarters - Other group homes (%)
People in Group quarters - Religious group quarters (%)
People in Group quarters - Dormitories (%)
People in Group quarters - Agriculture workers' dormitories on farms (%)
People in Group quarters - Job Corps and vocational training facilities (%)
People in Group quarters - Other workers' dormitories (%)
People in Group quarters - Crews of maritime vessels (%)
People in Group quarters - Other nonhousehold living situations (%)
People in Group quarters - Other noninstitutional group quarters (%)
Residents speaking English at home (%)
Residents speaking English at home - Born in the United States (%)
Residents speaking English at home - Native, born elsewhere (%)
Residents speaking English at home - Foreign born (%)
Residents speaking Spanish at home (%)
Residents speaking Spanish at home - Born in the United States (%)
Residents speaking Spanish at home - Native, born elsewhere (%)
Residents speaking Spanish at home - Foreign born (%)
Residents speaking other language at home (%)
Residents speaking other language at home - Born in the United States (%)
Residents speaking other language at home - Native, born elsewhere (%)
Residents speaking other language at home - Foreign born (%)
Class of Workers - Employee of private company (%)
Class of Workers - Self-employed in own incorporated business (%)
Class of Workers - Private not-for-profit wage and salary workers (%)
Class of Workers - Local government workers (%)
Class of Workers - State government workers (%)
Class of Workers - Federal government workers (%)
Class of Workers - Self-employed workers in own not incorporated business and Unpaid family workers (%)
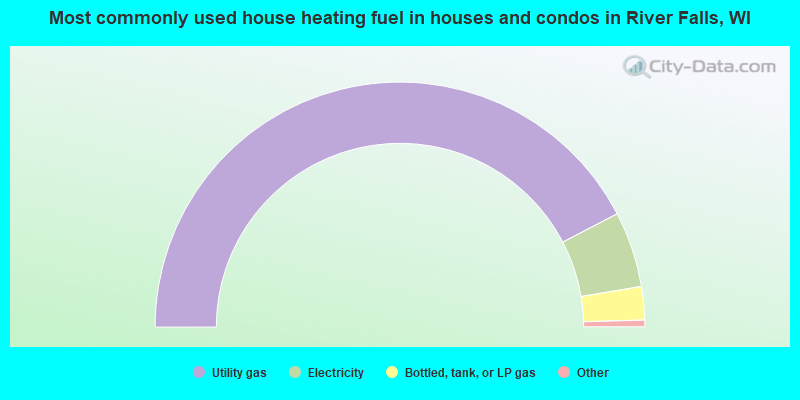
House heating fuel used in houses and condos - Utility gas (%)
House heating fuel used in houses and condos - Bottled, tank, or LP gas (%)
House heating fuel used in houses and condos - Electricity (%)
House heating fuel used in houses and condos - Fuel oil, kerosene, etc. (%)
House heating fuel used in houses and condos - Coal or coke (%)
House heating fuel used in houses and condos - Wood (%)
House heating fuel used in houses and condos - Solar energy (%)
House heating fuel used in houses and condos - Other fuel (%)
House heating fuel used in houses and condos - No fuel used (%)
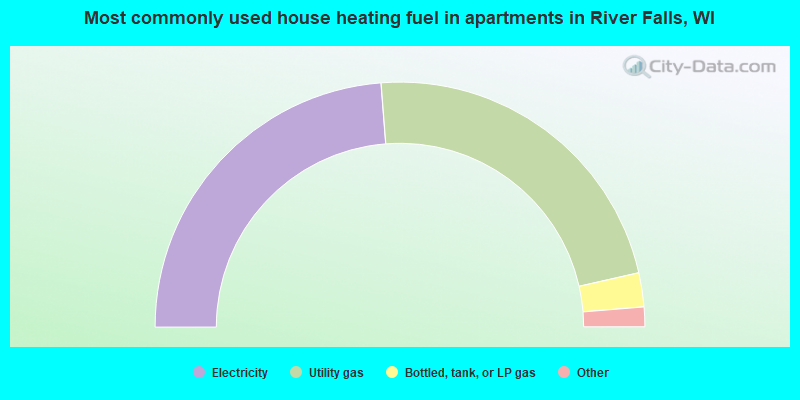
House heating fuel used in apartments - Utility gas (%)
House heating fuel used in apartments - Bottled, tank, or LP gas (%)
House heating fuel used in apartments - Electricity (%)
House heating fuel used in apartments - Fuel oil, kerosene, etc. (%)
House heating fuel used in apartments - Coal or coke (%)
House heating fuel used in apartments - Wood (%)
House heating fuel used in apartments - Solar energy (%)
House heating fuel used in apartments - Other fuel (%)
House heating fuel used in apartments - No fuel used (%)
Armed forces status - In Armed Forces (%)
Armed forces status - Civilian (%)
Armed forces status - Civilian - Veteran (%)
Armed forces status - Civilian - Nonveteran (%)
Fatal accidents locations in years 2005-2021
Fatal accidents locations in 2005
Fatal accidents locations in 2006
Fatal accidents locations in 2007
Fatal accidents locations in 2008
Fatal accidents locations in 2009
Fatal accidents locations in 2010
Fatal accidents locations in 2011
Fatal accidents locations in 2012
Fatal accidents locations in 2013
Fatal accidents locations in 2014
Fatal accidents locations in 2015
Fatal accidents locations in 2016
Fatal accidents locations in 2017
Fatal accidents locations in 2018
Fatal accidents locations in 2019
Fatal accidents locations in 2020
Fatal accidents locations in 2021
Alcohol use - People drinking some alcohol every month (%)
Alcohol use - People not drinking at all (%)
Alcohol use - Average days/month drinking alcohol
Alcohol use - Average drinks/week
Alcohol use - Average days/year people drink much
Audiometry - Average condition of hearing (%)
Audiometry - People that can hear a whisper from across a quiet room (%)
Audiometry - People that can hear normal voice from across a quiet room (%)
Audiometry - Ears ringing, roaring, buzzing (%)
Audiometry - Had a job exposure to loud noise (%)
Audiometry - Had off-work exposure to loud noise (%)
Blood Pressure & Cholesterol - Has high blood pressure (%)
Blood Pressure & Cholesterol - Checking blood pressure at home (%)
Blood Pressure & Cholesterol - Frequently checking blood cholesterol (%)
Blood Pressure & Cholesterol - Has high cholesterol level (%)
Consumer Behavior - Money monthly spent on food at supermarket/grocery store
Consumer Behavior - Money monthly spent on food at other stores
Consumer Behavior - Money monthly spent on eating out
Consumer Behavior - Money monthly spent on carryout/delivered foods
Consumer Behavior - Income spent on food at supermarket/grocery store (%)
Consumer Behavior - Income spent on food at other stores (%)
Consumer Behavior - Income spent on eating out (%)
Consumer Behavior - Income spent on carryout/delivered foods (%)
Current Health Status - General health condition (%)
Current Health Status - Blood donors (%)
Current Health Status - Has blood ever tested for HIV virus (%)
Current Health Status - Left-handed people (%)
Dermatology - People using sunscreen (%)
Diabetes - Diabetics (%)
Diabetes - Had a blood test for high blood sugar (%)
Diabetes - People taking insulin (%)
Diet Behavior & Nutrition - Diet health (%)
Diet Behavior & Nutrition - Milk product consumption (# of products/month)
Diet Behavior & Nutrition - Meals not home prepared (#/week)
Diet Behavior & Nutrition - Meals from fast food or pizza place (#/week)
Diet Behavior & Nutrition - Ready-to-eat foods (#/month)
Diet Behavior & Nutrition - Frozen meals/pizza (#/month)
Drug Use - People that ever used marijuana or hashish (%)
Drug Use - Ever used hard drugs (%)
Drug Use - Ever used any form of cocaine (%)
Drug Use - Ever used heroin (%)
Drug Use - Ever used methamphetamine (%)
Health Insurance - People covered by health insurance (%)
Kidney Conditions-Urology - Avg. # of times urinating at night
Medical Conditions - People with asthma (%)
Medical Conditions - People with anemia (%)
Medical Conditions - People with psoriasis (%)
Medical Conditions - People with overweight (%)
Medical Conditions - Elderly people having difficulties in thinking or remembering (%)
Medical Conditions - People who ever received blood transfusion (%)
Medical Conditions - People having trouble seeing even with glass/contacts (%)
Medical Conditions - People with arthritis (%)
Medical Conditions - People with gout (%)
Medical Conditions - People with congestive heart failure (%)
Medical Conditions - People with coronary heart disease (%)
Medical Conditions - People with angina pectoris (%)
Medical Conditions - People who ever had heart attack (%)
Medical Conditions - People who ever had stroke (%)
Medical Conditions - People with emphysema (%)
Medical Conditions - People with thyroid problem (%)
Medical Conditions - People with chronic bronchitis (%)
Medical Conditions - People with any liver condition (%)
Medical Conditions - People who ever had cancer or malignancy (%)
Mental Health - People who have little interest in doing things (%)
Mental Health - People feeling down, depressed, or hopeless (%)
Mental Health - People who have trouble sleeping or sleeping too much (%)
Mental Health - People feeling tired or having little energy (%)
Mental Health - People with poor appetite or overeating (%)
Mental Health - People feeling bad about themself (%)
Mental Health - People who have trouble concentrating on things (%)
Mental Health - People moving or speaking slowly or too fast (%)
Mental Health - People having thoughts they would be better off dead (%)
Oral Health - Average years since last visit a dentist
Oral Health - People embarrassed because of mouth (%)
Oral Health - People with gum disease (%)
Oral Health - General health of teeth and gums (%)
Oral Health - Average days a week using dental floss/device
Oral Health - Average days a week using mouthwash for dental problem
Oral Health - Average number of teeth
Pesticide Use - Households using pesticides to control insects (%)
Pesticide Use - Households using pesticides to kill weeds (%)
Physical Activity - People doing vigorous-intensity work activities (%)
Physical Activity - People doing moderate-intensity work activities (%)
Physical Activity - People walking or bicycling (%)
Physical Activity - People doing vigorous-intensity recreational activities (%)
Physical Activity - People doing moderate-intensity recreational activities (%)
Physical Activity - Average hours a day doing sedentary activities
Physical Activity - Average hours a day watching TV or videos
Physical Activity - Average hours a day using computer
Physical Functioning - People having limitations keeping them from working (%)
Physical Functioning - People limited in amount of work they can do (%)
Physical Functioning - People that need special equipment to walk (%)
Physical Functioning - People experiencing confusion/memory problems (%)
Physical Functioning - People requiring special healthcare equipment (%)
Prescription Medications - Average number of prescription medicines taking
Preventive Aspirin Use - Adults 40+ taking low-dose aspirin (%)
Reproductive Health - Vaginal deliveries (%)
Reproductive Health - Cesarean deliveries (%)
Reproductive Health - Deliveries resulted in a live birth (%)
Reproductive Health - Pregnancies resulted in a delivery (%)
Reproductive Health - Women breastfeeding newborns (%)
Reproductive Health - Women that had a hysterectomy (%)
Reproductive Health - Women that had both ovaries removed (%)
Reproductive Health - Women that have ever taken birth control pills (%)
Reproductive Health - Women taking birth control pills (%)
Reproductive Health - Women that have ever used Depo-Provera or injectables (%)
Reproductive Health - Women that have ever used female hormones (%)
Sexual Behavior - People 18+ that ever had sex (vaginal, anal, or oral) (%)
Sexual Behavior - Males 18+ that ever had vaginal sex with a woman (%)
Sexual Behavior - Males 18+ that ever performed oral sex on a woman (%)
Sexual Behavior - Males 18+ that ever had anal sex with a woman (%)
Sexual Behavior - Males 18+ that ever had any sex with a man (%)
Sexual Behavior - Females 18+ that ever had vaginal sex with a man (%)
Sexual Behavior - Females 18+ that ever performed oral sex on a man (%)
Sexual Behavior - Females 18+ that ever had anal sex with a man (%)
Sexual Behavior - Females 18+ that ever had any kind of sex with a woman (%)
Sexual Behavior - Average age people first had sex
Sexual Behavior - Average number of female sex partners in lifetime (males 18+)
Sexual Behavior - Average number of female vaginal sex partners in lifetime (males 18+)
Sexual Behavior - Average age people first performed oral sex on a woman (18+)
Sexual Behavior - Average number of woman performed oral sex on in lifetime (18+)
Sexual Behavior - Average number of male sex partners in lifetime (males 18+)
Sexual Behavior - Average number of male anal sex partners in lifetime (males 18+)
Sexual Behavior - Average age people first performed oral sex on a man (18+)
Sexual Behavior - Average number of male oral sex partners in lifetime (18+)
Sexual Behavior - People using protection when performing oral sex (%)
Sexual Behavior - Average number of times people have vaginal or anal sex a year
Sexual Behavior - People having sex without condom (%)
Sexual Behavior - Average number of male sex partners in lifetime (females 18+)
Sexual Behavior - Average number of male vaginal sex partners in lifetime (females 18+)
Sexual Behavior - Average number of female sex partners in lifetime (females 18+)
Sexual Behavior - Circumcised males 18+ (%)
Sleep Disorders - Average hours sleeping at night
Sleep Disorders - People that has trouble sleeping (%)
Smoking-Cigarette Use - People smoking cigarettes (%)
Taste & Smell - People 40+ having problems with smell (%)
Taste & Smell - People 40+ having problems with taste (%)
Taste & Smell - People 40+ that ever had wisdom teeth removed (%)
Taste & Smell - People 40+ that ever had tonsils teeth removed (%)
Taste & Smell - People 40+ that ever had a loss of consciousness because of a head injury (%)
Taste & Smell - People 40+ that ever had a broken nose or other serious injury to face or skull (%)
Taste & Smell - People 40+ that ever had two or more sinus infections (%)
Weight - Average height (inches)
Weight - Average weight (pounds)
Weight - Average BMI
Weight - People that are obese (%)
Weight - People that ever were obese (%)
Weight - People trying to lose weight (%)
According to our research of Wisconsin and other state lists, there were 18 registered sex offenders living in River Falls, Wisconsin as of May 07, 2024 . The ratio of all residents to sex offenders in River Falls is 845 to 1.The ratio of registered sex offenders to all residents in this city is lower than the state average.
Latest news from River Falls, WI collected exclusively by city-data.com from local newspapers, TV, and radio stations
Ancestries: German (32.2%), Irish (9.3%), Norwegian (9.2%), European (5.0%), Scandinavian (4.6%), English (4.5%).
Current Local Time:
Land area: 4.98 square miles.
Population density: 3,338 people per square mile (average).
384 residents are foreign born (1.6% Asia , 0.4% Europe ).
This city:
2.4%Wisconsin:
5.0%
Median real estate property taxes paid for housing units with mortgages in 2022: $4,268 (1.4%)Median real estate property taxes paid for housing units with no mortgage in 2022: $4,248 (1.4%)
Nearest city with pop. 50,000+: St. Paul, MN
Nearest city with pop. 1,000,000+: Chicago, IL
Nearest cities:
Latitude: 44.86 N, Longitude: 92.63 W
Daytime population change due to commuting: -1,715 (-10.6%)Workers who live and work in this city: 3,727 (41.7%)
Single-family new house construction building permits:
2022: 57 buildings , average cost: $275,6002021: 48 buildings , average cost: $248,7002020: 87 buildings , average cost: $216,8002019: 76 buildings , average cost: $193,8002018: 50 buildings , average cost: $192,6002017: 57 buildings , average cost: $169,8002016: 51 buildings , average cost: $168,7002015: 50 buildings , average cost: $164,4002014: 57 buildings , average cost: $156,2002013: 61 buildings , average cost: $137,8002012: 28 buildings , average cost: $125,0002011: 19 buildings , average cost: $140,2002010: 48 buildings , average cost: $149,7002009: 54 buildings , average cost: $134,3002008: 38 buildings , average cost: $134,1002007: 89 buildings , average cost: $134,2002006: 115 buildings , average cost: $128,0002005: 153 buildings , average cost: $136,9002004: 86 buildings , average cost: $179,5002003: 67 buildings , average cost: $151,5002002: 99 buildings , average cost: $127,7002001: 68 buildings , average cost: $125,7002000: 55 buildings , average cost: $139,6001999: 58 buildings , average cost: $118,1001998: 22 buildings , average cost: $141,2001997: 48 buildings , average cost: $116,800Unemployment in December 2023:
Population change in the 1990s: +1,390 (+12.4%).
Most common occupations in River Falls, WI (%)
Both Males Females
Other sales and related occupations, including supervisors (4.3%)
Other management occupations, except farmers and farm managers (3.8%)
Preschool, kindergarten, elementary, and middle school teachers (3.6%)
Other office and administrative support workers, including supervisors (3.4%)
Waiters and waitresses (3.3%)
Other production occupations, including supervisors (3.0%)
Customer service representatives (2.9%)
Material recording, scheduling, dispatching, and distributing workers (4.7%)
Other production occupations, including supervisors (4.6%)
Other sales and related occupations, including supervisors (4.5%)
Other management occupations, except farmers and farm managers (4.3%)
Postsecondary teachers (4.0%)
Building and grounds cleaning and maintenance occupations (4.0%)
Laborers and material movers, hand (3.5%)
Preschool, kindergarten, elementary, and middle school teachers (5.7%)
Waiters and waitresses (5.5%)
Customer service representatives (5.2%)
Secretaries and administrative assistants (4.8%)
Information and record clerks, except customer service representatives (4.8%)
Other office and administrative support workers, including supervisors (4.7%)
Cashiers (4.2%)
Tornado activity:
River Falls-area historical tornado activity is slightly above Wisconsin state average. It is 26% greater than the overall U.S. average.
On 6/4/1958, a category F5 (max. wind speeds 261-318 mph) tornado 14.7 miles away from the River Falls city center killed 21 people and injured 74 people and caused between $5,000,000 and $50,000,000 in damages.
On 5/6/1965, a category F4 (max. wind speeds 207-260 mph) tornado 31.0 miles away from the city center killed 6 people and injured 158 people and caused between $5,000,000 and $50,000,000 in damages.
Earthquake activity:
River Falls-area historical earthquake activity is significantly above Wisconsin state average. It is 61% smaller than the overall U.S. average. On 7/9/1975 at 14:54:15, a magnitude 4.6 (4.6 MB, Class: Light, Intensity: IV - V) earthquake occurred 175.5 miles away from River Falls center On 6/5/1993 at 01:24:53, a magnitude 4.1 (4.1 LG, Depth: 6.2 mi) earthquake occurred 187.2 miles away from River Falls center On 3/4/1983 at 06:32:18, a magnitude 4.6 (4.4 MB, 4.6 LG, 4.4 ML) earthquake occurred 337.3 miles away from River Falls center On 6/28/2004 at 06:10:52, a magnitude 4.2 (4.2 MW, Depth: 6.2 mi) earthquake occurred 300.9 miles away from the city center On 10/20/1995 at 15:57:18, a magnitude 3.7 (3.7 LG, Depth: 3.1 mi, Class: Light, Intensity: II - III) earthquake occurred 215.9 miles away from the city center On 2/9/1994 at 08:45:35, a magnitude 3.1 (3.1 LG, Depth: 3.1 mi) earthquake occurred 116.7 miles away from River Falls center Magnitude types: regional Lg-wave magnitude (LG), body-wave magnitude (MB), local magnitude (ML), moment magnitude (MW) Natural disasters: The number of natural disasters in Pierce County (12) is smaller than the US average (15).Major Disasters (Presidential) Declared: 10Emergencies Declared: 2Floods: 8, Storms: 6, Tornadoes: 5, Heavy Rains: 2, Drought: 1, Flash Flood: 1, Hurricane: 1, Wind: 1, Other: 1 (Note: some incidents may be assigned to more than one category). Hospitals and medical centers in River Falls: RIVER FALLS AREA HSPTL (Voluntary non-profit - Private, 1629 E DIVISION ST) GRACE HEALTHCARE OF RIVER FALLS (1663 E DIVISION ST)
LUTHERAN HOME RIVER FALLS (640 N MAIN ST)
RIVER FALLS AREA HOSP-KINNIC HOME DIV (500 N MAIN ST)
College/University in River Falls: University of Wisconsin-River Falls Full-time enrollment: 5,868; Location: 410 S 3rd St; Public; Website: www.uwrf.edu; Offers Master's degree )
Other colleges/universities with over 2000 students near River Falls:
Inver Hills Community College (about 22 miles; Inver Grove Heights, MN ; Full-time enrollment: 4,049)
Century College (about 22 miles; White Bear Lake, MN ; FT enrollment: 7,393)
Metropolitan State University (about 24 miles; Saint Paul, MN ; FT enrollment: 6,159)
Dakota County Technical College (about 24 miles; Rosemount, MN ; FT enrollment: 2,478)
Saint Paul College (about 25 miles; Saint Paul, MN ; FT enrollment: 4,778)
Concordia University-Saint Paul (about 27 miles; Saint Paul, MN ; FT enrollment: 2,501)
Macalester College (about 28 miles; Saint Paul, MN ; FT enrollment: 2,174)
Public high schools in River Falls: RIVER FALLS HIGH Students: 951, Location: 818 CEMETERY RD, Grades: 9-12)RENAISSANCE CHARTER ACADEMY Students: 47, Location: 211 N FREMONT ST, Grades: 9-12, Charter school )RIVER FALLS ESCHOOL Location: 852 E DIVISION ST, Grades: 6-12, Charter school )
Public elementary/middle schools in River Falls: MEYER MIDDLE Students: 643, Location: 230 N 9TH ST, Grades: 6-8)ROCKY BRANCH ELEMENTARY Students: 452, Location: 1415 BARTOSH LN, Grades: PK-5)GREENWOOD ELEMENTARY Students: 382, Location: 982 E DIVISION ST, Grades: KG-5)RIVER FALLS PUBLIC MONTESSORI ACADEMY Students: 105, Location: 439 W MAPLE ST, Grades: PK-6, Charter school )WESTSIDE ELEMENTARY Location: 1007 W PINE ST, Grades: KG-5)
Private elementary/middle schools in River Falls: ST BRIDGET PARISH SCHOOL Students: 163, Location: 135 E DIVISION ST, Grades: PK-8)
HEARTLAND MONTESSORI SCHOOL Students: 33, Location: N8226 945TH ST, Grades: PK-3)
See full list of schools located in River Falls Library in River Falls: RIVER FALLS PUBLIC LIBRARY Operating income: $974,633; Location: 140 UNION ST.; 78,064 books ; 4,723 e-books ; 10,169 audio materials ; 7,366 video materials ; 2 local licensed databases ; 28 state licensed databases ; 7 other licensed databases ; 180 print serial subscriptions )
User-submitted facts and corrections:
Public high schools- River Falls High School- 818 Cemetery Rd. Students- est. 1000
Grace Mission Nondenominational church needs to be added to your list of churches in River Falls, Wisconsin. Here's the info: Attn: Pastor Jim Grothe Grace Mission Nondenominational Church 214 North Main Street River Falls, WI 54022 (715) 425-0031 http://www.gracemissionrf.org Thanks, Isaac http://www.qcs-rf.com
Notable locations in River Falls: (A) , Stratton Hall (B) , South Hall (C) , Rodli Commons (D) , River Falls Public Library (E) , River Falls City Hall (F) , Prucha Hall (G) , Parker Hall (H) , North Hall (I) , McMillian Hall (J) , May Hall (K) , Klienpell Fine Arts Building (L) , Johnson Hall (M) , Ingram Center (N) , Hillcrest Rest Home (O) , Hathorn Hall (P) , Hathorn Cottage (Q) , Hagestad Student Center (R) , Grimm Hall (S) , Crabtree Hall (T) . Display/hide their locations on the map
Shopping Center: (1) . Display/hide its location on the map
Churches in River Falls include: (A) , Trinity Episcopal Church (B) , Luther Memorial Lutheran Church (C) , First Covenant Church (D) , First Congregational Church (E) , First Baptist Church (F) , Ezekiel Lutheran Church (G) , Apostolic Church (H) . Display/hide their locations on the map
Cemeteries: (1) , Greenwood Cemetery (2) . Display/hide their locations on the map
Reservoirs: (A) , Upper Kinnickinnic 112 Reservoir (B) , Upper Basin 0.34 Reservoir (C) . Display/hide their locations on the map
River: (A) . Display/hide its location on the map
Parks in River Falls include: (1) , Glen Park (2) , Golf View Park (3) , Ramer Field (4) , Tower Park (5) , Wall Amphitheatre (6) , Wells Park (7) , Hoffman Park (8) , Mound Park (9) . Display/hide their locations on the map
Tourist attraction:
Hotels:
Court:
Birthplace of: Frankie Rayder - Female model, Aldrich Ames - (b. 1941), Anna Dodge - Actor, Eli Cottonwood - Professional wrestler, Francis Paul Prucha - Historian, Missy Rayder - Female model, Karyn Bye-Dietz - Ice hockey player, Warren P. Knowles - Politician, Hugh H. Price - Politician, Terry Musser - Politician.
Pierce County has a predicted average indoor radon screening level greater than 4 pCi/L (pico curies per liter) - Highest Potential Drinking water stations with addresses in River Falls that have no violations reported:
RED BARN CAFE AND RED BARN COUNTRY STORE (Population served: 60, Primary Water Source Type: Groundwater)
RUSH RIVER LUTHERAN CHURCH (Address: N8623 CTY. RD. Y Population served: 50, Primary Water Source Type: Groundwater)
ST MARYS CATHOLIC CHURCH (Population served: 26, Primary Water Source Type: Groundwater)
UNITARIAN UNIVERSALIST SOCIETY (Address: N8010 HWY 65 Population served: 25, Primary Water Source Type: Groundwater)
RIVER VALLEY CHRISTIAN CHURCH (Population served: 25, Primary Water Source Type: Groundwater)
Average household size: This city:
2.4 peopleWisconsin:
2.4 people
Percentage of family households: This city:
54.6%Whole state:
64.4%
Percentage of households with unmarried partners: This city:
7.7%Whole state:
7.3%
Likely homosexual households (counted as self-reported same-sex unmarried-partner households)
Lesbian couples: 0.3% of all households Gay men: 0.3% of all households
People in group quarters in River Falls in 2010:
2,396 people in college/university student housing
53 people in nursing facilities/skilled-nursing facilities
37 people in group homes intended for adults
36 people in residential treatment centers for adults
12 people in correctional facilities intended for juveniles
3 people in group homes for juveniles (non-correctional)
2 people in other noninstitutional facilities
People in group quarters in River Falls in 2000:
1,942 people in college dormitories (includes college quarters off campus)
153 people in nursing homes
33 people in homes or halfway houses for drug/alcohol abuse
17 people in other noninstitutional group quarters
2 people in other nonhousehold living situations
Banks with branches in River Falls (2011 data):
The First National Bank of River Falls: The First National Bank Of River Fal, Wellhaven Branch, Uw-River Falls Branch. Info updated 2006/11/03: Bank assets: $264.9 mil, Deposits: $217.0 mil, local headquarters , positive income , Commercial Lending Specialization, 4 total offices , Holding Company: First National Bancorp Of River Falls, Inc.
BMO Harris Bank National Association: River Falls Branch at 103 South Second, branch established on 1934/12/01. Info updated 2011/07/14: Bank assets: $97,264.0 mil, Deposits: $75,624.6 mil, headquarters in Chicago, IL, positive income , 717 total offices , Holding Company: Bank Of Montreal
River Falls State Bank: at 124 South Second Street, branch established on 1949/10/03. Info updated 2006/11/03: Bank assets: $81.9 mil, Deposits: $68.4 mil, local headquarters , positive income , 1 total offices , Holding Company: River Falls Bancshares, Inc.
Security Financial Bank: River Falls Branch at 1561 Commerce Court, branch established on 2005/04/04. Info updated 2008/01/24: Bank assets: $314.9 mil, Deposits: $213.8 mil, headquarters in Durand, WI, positive income , Agricultural Specialization, 3 total offices , Holding Company: Security Financial Services Corporation
Associated Bank, National Association: River Falls N Main Branch at 704 North Main Street, branch established on 1994/01/24. Info updated 2008/09/12: Bank assets: $21,715.0 mil, Deposits: $15,244.4 mil, headquarters in Green Bay, WI, positive income , Commercial Lending Specialization, 282 total offices , Holding Company: Associated Banc-Corp
For population 15 years and over in River Falls:
Never married: 53.9%Now married: 35.5%Separated: 0.2%Widowed: 2.7%Divorced: 7.7% For population 25 years and over in River Falls:
High school or higher: 97.3%Bachelor's degree or higher: 43.8%Graduate or professional degree: 14.1%Unemployed: 6.2%Mean travel time to work (commute): 19.4 minutes
Education Gini index (Inequality in education) Here:
8.7Wisconsin average:
10.4
Religion statistics for River Falls, WI (based on Pierce County data)
Religion Adherents Congregations Mainline Protestant 9,316 29 Catholic 6,790 6 Evangelical Protestant 3,275 20 Other 137 2 None 21,501 -
Source: Clifford Grammich, Kirk Hadaway, Richard Houseal, Dale E.Jones, Alexei Krindatch, Richie Stanley and Richard H.Taylor. 2012. 2010 U.S.Religion Census: Religious Congregations & Membership Study. Association of Statisticians of American Religious Bodies. Jones, Dale E., et al. 2002. Congregations and Membership in the United States 2000. Nashville, TN: Glenmary Research Center. Graphs represent county-level data
Food Environment Statistics: Number of grocery stores : 6Pierce County :
1.51 / 10,000 pop.Wisconsin :
1.86 / 10,000 pop.
Number of convenience stores (with gas) : 15Pierce County :
3.77 / 10,000 pop.Wisconsin :
4.12 / 10,000 pop.
Number of full-service restaurants : 29Here :
7.29 / 10,000 pop.Wisconsin :
8.64 / 10,000 pop.
Adult diabetes rate : This county :
6.4%Wisconsin :
7.6%
Adult obesity rate : This county :
26.7%Wisconsin :
27.5%
Low-income preschool obesity rate : Pierce County :
10.4%Wisconsin :
13.0%
Health and Nutrition: Healthy diet rate : This city:
51.4%Wisconsin:
49.5%
Average overall health of teeth and gums : Here:
52.5%Wisconsin:
46.6%
People feeling badly about themselves : River Falls:
20.8%Wisconsin:
21.4%
People not drinking alcohol at all : River Falls:
10.8%Wisconsin:
10.2%
Average hours sleeping at night : River Falls:
6.9Wisconsin:
6.8
Overweight people : This city:
30.1%Wisconsin:
34.0%
General health condition : Here:
61.6%Wisconsin:
56.3%
Average condition of hearing : This city:
81.9%State:
78.5%
More about Health and Nutrition of River Falls, WI Residents
Local government employment and payroll (March 2022)
Function
Full-time employees
Monthly full-time payroll
Average yearly full-time wage
Part-time employees
Monthly part-time payroll
Police Protection - Officers
23 $160,582 $83,782 0 $0 Streets and Highways
16 $92,754 $69,566 0 $0 Financial Administration
15 $72,883 $58,306 0 $0 Other Government Administration
15 $104,505 $83,604 8 $4,658 Electric Power
10 $80,151 $96,181 0 $0 Housing and Community Development (Local)
7 $46,558 $79,814 0 $0 Water Supply
6 $31,934 $63,868 0 $0 Local Libraries
5 $31,850 $76,440 12 $13,213 Sewerage
3 $19,884 $79,536 0 $0 Other and Unallocable
3 $17,150 $68,600 0 $0 Police - Other
3 $13,954 $55,816 8 $2,927 Firefighters
1 $8,837 $106,044 43 $12,815 Judicial and Legal
1 $4,404 $52,848 1 $1,745 Parks and Recreation
1 $6,258 $75,096 0 $0
Totals for Government
109 $691,705 $76,151 72 $35,358
River Falls government finances - Expenditure in 2018 (per resident):
Construction - General - Other: $3,234,000 ($194.71)
Parks and Recreation: $198,000 ($11.92)Regular Highways: $152,000 ($9.15)Libraries: $22,000 ($1.32)Current Operations - Electric Utilities: $12,699,000 ($764.59)
Police Protection: $3,059,000 ($184.18)Regular Highways: $2,541,000 ($152.99)Sewerage: $2,251,000 ($135.53)Health - Other: $1,502,000 ($90.43)Water Utilities: $1,308,000 ($78.75)Central Staff Services: $1,217,000 ($73.27)Libraries: $1,106,000 ($66.59)General - Other: $1,084,000 ($65.27)Parks and Recreation: $697,000 ($41.97)Solid Waste Management: $692,000 ($41.66)Housing and Community Development: $659,000 ($39.68)Local Fire Protection: $573,000 ($34.50)Financial Administration: $476,000 ($28.66)Judicial and Legal Services: $293,000 ($17.64)Transit Utilities: $205,000 ($12.34)Natural Resources - Other: $55,000 ($3.31)Miscellaneous Commercial Activities - Other: $17,000 ($1.02)Parking Facilities: $4,000 ($0.24)General - Interest on Debt: $771,000 ($46.42)
Other Capital Outlay - Regular Highways: $348,000 ($20.95)
Police Protection: $48,000 ($2.89)Local Fire Protection: $26,000 ($1.57)
River Falls government finances - Revenue in 2018 (per resident):
Charges - Sewerage: $3,356,000 ($202.06)
Other: $1,376,000 ($82.85)Solid Waste Management: $711,000 ($42.81)Regular Highways: $552,000 ($33.23)Parks and Recreation: $126,000 ($7.59)Federal Intergovernmental - Other: $98,000 ($5.90)
Local Intergovernmental - Other: $3,521,000 ($211.99)
Highways: $5,000 ($0.30)Miscellaneous - Rents: $437,000 ($26.31)
General Revenue - Other: $237,000 ($14.27)Fines and Forfeits: $203,000 ($12.22)Special Assessments: $44,000 ($2.65)Interest Earnings: $0 ($0.00)Revenue - Electric Utilities: $13,488,000 ($812.09)
Water Utilities: $1,375,000 ($82.79)State Intergovernmental - General Local Government Support: $2,015,000 ($121.32)
Highways: $614,000 ($36.97)Other: $294,000 ($17.70)Education: $186,000 ($11.20)Transit Utilities: $64,000 ($3.85)Tax - Property: $6,646,000 ($400.14)
Other License: $277,000 ($16.68)Occupation and Business License - Other: $196,000 ($11.80)Other Selective Sales: $133,000 ($8.01)Other: $91,000 ($5.48)
River Falls government finances - Debt in 2018 (per resident):
Long Term Debt - Beginning Outstanding - Unspecified Public Purpose: $20,779,000 ($1251.07)
Outstanding Unspecified Public Purpose: $19,770,000 ($1190.32)Retired Unspecified Public Purpose: $2,222,000 ($133.78)Issue, Unspecified Public Purpose: $1,213,000 ($73.03)
Businesses in River Falls, WI
Name Count Name Count
Ace Hardware 1 McDonald's 1 Burger King 1 Nike 1 Curves 1 Pizza Hut 1 Dairy Queen 1 Sears 1 Domino's Pizza 1 Subway 2 FedEx 1 U-Haul 1 H&R Block 1 UPS 2 Jimmy John's 1 Walgreens 1 Lane Furniture 1 YMCA 1 MasterBrand Cabinets 1
Strongest AM radio stations in River Falls:
WCTS (1030 AM; 50 kW; MAPLEWOOD, MN; Owner: CNTL. BAPT. THEO/AL SEMI MINNEAPOLIS)
WDGY (630 AM; 8 kW; HUDSON, WI; Owner: 630 RADIO, INCORPORATED)
WEVR (1550 AM; 1 kW; RIVER FALLS, WI; Owner: HANTEN BROADCASTING CO. INC.)
KTIS (900 AM; 25 kW; MINNEAPOLIS, MN; Owner: NORTHWESTERN COLLEGE)
KSTP (1500 AM; 50 kW; ST. PAUL, MN; Owner: KSTP-AM, LLC (DELAWARE))
WCCO (830 AM; 50 kW; MINNEAPOLIS, MN; Owner: INFINITY MEDIA CORPORATION)
KFAN (1130 AM; 50 kW; MINNEAPOLIS, MN; Owner: AMFM RADIO LICENSES, L.L.C.)
WMIN (740 AM; daytime; 1 kW; HUDSON, WI; Owner: WRPX, INC.)
WMGT (1220 AM; 5 kW; STILLWATER, MN; Owner: ENDURANCE BROADCASTING, LLC)
WIXK (1590 AM; daytime; 5 kW; NEW RICHMOND, WI; Owner: WIXK-AM, LLC)
WMEQ (880 AM; 10 kW; MENOMONIE, WI; Owner: CAPSTAR TX LIMITED PARTNERSHIP)
KUOM (770 AM; daytime; 5 kW; MINNEAPOLIS, MN)
KKMS (980 AM; 5 kW; RICHFIELD, MN)
Strongest FM radio stations in River Falls:
WEVR-FM (106.3 FM; RIVER FALLS, WI; Owner: HANTEN BROADCASTING COMPANY, INC.)
WRFW (88.7 FM; RIVER FALLS, WI; Owner: BOARD OF REGENTS, UNIV. OF WIS. SYS.)
WXPT (104.1 FM; ST. LOUIS PARK, MN; Owner: THE AUDIO HOUSE, INC.)
KNOW-FM (91.1 FM; MINNEAPOLIS-ST. PAUL, MN; Owner: MINNESOTA PUBLIC RADIO)
WLTE (102.9 FM; MINNEAPOLIS, MN; Owner: INFINITY MEDIA CORPORATION)
KSTP-FM (94.5 FM; ST. PAUL, MN; Owner: KSTP-FM, LLC, A DELAWARE LLC)
KEEY-FM (102.1 FM; ST. PAUL, MN; Owner: AMFM RADIO LICENSES, L.L.C.)
KTIS-FM (98.5 FM; MINNEAPOLIS, MN; Owner: NORTHWESTERN COLLEGE)
KDWB-FM (101.3 FM; RICHFIELD, MN; Owner: AMFM RADIO LICENSES, L.L.C.)
KQRS-FM (92.5 FM; GOLDEN VALLEY, MN; Owner: KQRS, Inc.)
KSJN (99.5 FM; MINNEAPOLIS, MN; Owner: MINNESOTA PUBLIC RADIO)
KXXR (93.7 FM; MINNEAPOLIS, MN; Owner: KQRS, INC.)
WCAL (89.3 FM; NORTHFIELD, MN; Owner: ST. OLAF COLLEGE)
KTCZ-FM (97.1 FM; MINNEAPOLIS, MN; Owner: AMFM RADIO LICENSES, L.L.C.)
WHWC (88.3 FM; MENOMONIE, WI; Owner: STATE OF WISCONSIN - EDUCATIONAL COMMUNICATIONS BOARD)
KQQL (107.9 FM; ANOKA, MN; Owner: AMFM RADIO LICENSES, L.L.C.)
WVSS (90.7 FM; MENOMONIE, WI; Owner: BD. OF REGENTS, UNIVERSITY OF WISCONSIN SYSTEM)
W211AY (90.1 FM; MENOMONIE, WI; Owner: CALVARY CHAPEL OF TWIN FALLS, INC.)
WGVX (105.1 FM; LAKEVILLE, MN; Owner: KQRS, INC.)
K214DF (90.7 FM; GOLDEN VALLEY, MN; Owner: EDUCATIONAL MEDIA FOUNDATION)
TV broadcast stations around River Falls:
W55AP (Channel 55; RIVER FALLS, WI; Owner: STATE OF WISCONSIN - EDUCATIONAL COMMUNICATIONS BOARD)
KMSP-TV (Channel 9; MINNEAPOLIS, MN; Owner: FOX TELEVISION STATIONS, INC.)
KTCA-TV (Channel 2; ST. PAUL, MN; Owner: TWIN CITIES PUBLIC TELEVISION, INC.)
KARE (Channel 11; MINNEAPOLIS, MN; Owner: MULTIMEDIA HOLDINGS CORPORATION)
KSTP-TV (Channel 5; ST. PAUL, MN; Owner: HUBBARD BROADCASTING, INC.)
WCCO-TV (Channel 4; MINNEAPOLIS, MN; Owner: CBS BROADCASTING INC.)
KTCI-TV (Channel 17; ST. PAUL, MN; Owner: TWIN CITIES PUBLIC TELEVISION, INC.)
KSTC-TV (Channel 45; MINNEAPOLIS, MN; Owner: HUBBARD BROADCASTING, INC.)
KMWB (Channel 23; MINNEAPOLIS, MN; Owner: KLGT LICENSEE, LLC)
WFTC (Channel 29; MINNEAPOLIS, MN; Owner: FOX TELEVISION STATIONS, INC.)
K07UI (Channel 7; MINNEAPOLIS, ETC., MN; Owner: WORD OF GOD FELLOWSHIP, INC.)
WHWC-TV (Channel 28; MENOMONIE, WI; Owner: STATE OF WISCONSIN - EDUCATIONAL COMMUNICATIONS BOARD)
K58BS (Channel 58; MINNEAPOLIS, MN; Owner: TRINITY BROADCASTING NETWORK)
K67HG (Channel 67; MINNEAPOLIS, MN; Owner: VENTANA TELEVISION, INC.)
K14KH (Channel 14; MINNEAPOLIS, MN; Owner: THREE ANGELS BROADCASTING NETWORK)
K19ER (Channel 19; ST. PAUL, MN; Owner: CATHOLIC VIEWS BROADCASTS, INC.)
W62BD (Channel 62; MINNEAPOLIS, MN; Owner: WORD OF GOD FELLOWSHIP, INC.)
WBWX-CA (Channel 13; MINNEAPOLIS, MN; Owner: THE BOX WORLDWIDE LLC)
River Falls fatal accident list:
Oct 30, 1999 03:13 PM, Sr-65, Vehicles: 2, Persons: 5, Fatalities: 1Vehicles: 2, Persons: 5, Fatalities: 1Vehicles: 2, Persons: 4, Fatalities: 1Vehicles: 1, Persons: 2, Fatalities: 1
National Bridge Inventory (NBI) Statistics 28 Number of bridges217ft / 65.6m Total length $1,514,000 Total costs124,219 Total average daily traffic6,714 Total average daily truck traffic
New bridges - historical statistics
1 1920-1929 2 1940-1949 1 1950-1959 1 1960-1969 2 1970-1979 1 1980-1989 10 1990-1999 6 2000-2009 3 2010-2019 1 2020-2022
See full National Bridge Inventory statistics for River Falls, WI
Home Mortgage Disclosure Act Aggregated Statistics For Year 2009(Based on 2 partial tracts) A) FHA, FSA/RHS & VA B) Conventional C) Refinancings D) Home Improvement Loans E) Loans on Dwellings For 5+ Families F) Non-occupant Loans on G) Loans On Manufactured Number Average Value Number Average Value Number Average Value Number Average Value Number Average Value Number Average Value Number Average Value
LOANS ORIGINATED 25 $165,151 30 $126,959 194 $153,137 4 $50,485 2 $827,380 9 $101,286 1 $110,780 APPLICATIONS APPROVED, NOT ACCEPTED 1 $73,600 3 $122,917 9 $189,352 0 $0 0 $0 1 $84,440 0 $0 APPLICATIONS DENIED 5 $121,454 2 $163,760 36 $191,465 2 $13,765 0 $0 3 $201,427 0 $0 APPLICATIONS WITHDRAWN 2 $165,970 8 $166,144 38 $186,596 1 $103,740 0 $0 3 $162,193 0 $0 FILES CLOSED FOR INCOMPLETENESS 1 $117,750 0 $0 2 $296,865 0 $0 0 $0 0 $0 0 $0
Aggregated Statistics For Year 2008(Based on 2 partial tracts) A) FHA, FSA/RHS & VA B) Conventional C) Refinancings D) Home Improvement Loans E) Loans on Dwellings For 5+ Families F) Non-occupant Loans on G) Loans On Manufactured Number Average Value Number Average Value Number Average Value Number Average Value Number Average Value Number Average Value Number Average Value
LOANS ORIGINATED 19 $177,340 40 $146,733 87 $155,396 9 $48,696 4 $717,952 16 $141,060 0 $0 APPLICATIONS APPROVED, NOT ACCEPTED 1 $151,660 4 $122,878 14 $171,357 0 $0 0 $0 1 $134,020 0 $0 APPLICATIONS DENIED 2 $170,905 4 $133,168 31 $162,484 1 $24,770 0 $0 3 $206,507 1 $23,240 APPLICATIONS WITHDRAWN 2 $162,350 11 $196,608 20 $194,228 2 $115,820 0 $0 2 $251,965 0 $0 FILES CLOSED FOR INCOMPLETENESS 0 $0 0 $0 3 $167,077 0 $0 0 $0 0 $0 0 $0
Aggregated Statistics For Year 2007(Based on 2 partial tracts) A) FHA, FSA/RHS & VA B) Conventional C) Refinancings D) Home Improvement Loans E) Loans on Dwellings For 5+ Families F) Non-occupant Loans on G) Loans On Manufactured Number Average Value Number Average Value Number Average Value Number Average Value Number Average Value Number Average Value Number Average Value
LOANS ORIGINATED 10 $173,724 60 $139,393 77 $150,248 17 $53,531 2 $585,380 21 $140,476 0 $0 APPLICATIONS APPROVED, NOT ACCEPTED 0 $0 3 $123,240 14 $132,774 2 $146,555 0 $0 2 $142,545 0 $0 APPLICATIONS DENIED 0 $0 12 $104,022 27 $158,214 4 $117,898 0 $0 7 $139,706 3 $44,417 APPLICATIONS WITHDRAWN 0 $0 12 $172,415 15 $175,565 0 $0 0 $0 3 $139,077 0 $0 FILES CLOSED FOR INCOMPLETENESS 0 $0 1 $115,430 3 $140,147 1 $50,300 0 $0 1 $119,250 0 $0
Aggregated Statistics For Year 2006(Based on 2 partial tracts) A) FHA, FSA/RHS & VA B) Conventional C) Refinancings D) Home Improvement Loans E) Loans on Dwellings For 5+ Families F) Non-occupant Loans on G) Loans On Manufactured Number Average Value Number Average Value Number Average Value Number Average Value Number Average Value Number Average Value Number Average Value
LOANS ORIGINATED 10 $170,968 99 $139,481 77 $136,954 15 $34,231 1 $1,612,360 29 $157,926 0 $0 APPLICATIONS APPROVED, NOT ACCEPTED 0 $0 10 $115,497 14 $155,730 3 $69,447 0 $0 3 $140,910 1 $26,340 APPLICATIONS DENIED 0 $0 19 $135,232 54 $180,480 7 $69,670 0 $0 7 $192,596 2 $112,495 APPLICATIONS WITHDRAWN 0 $0 11 $113,170 30 $181,753 3 $85,310 0 $0 2 $178,960 0 $0 FILES CLOSED FOR INCOMPLETENESS 0 $0 2 $210,590 5 $163,266 2 $47,390 0 $0 2 $239,415 0 $0
Aggregated Statistics For Year 2005(Based on 2 partial tracts) A) FHA, FSA/RHS & VA B) Conventional C) Refinancings D) Home Improvement Loans E) Loans on Dwellings For 5+ Families F) Non-occupant Loans on G) Loans On Manufactured Number Average Value Number Average Value Number Average Value Number Average Value Number Average Value Number Average Value Number Average Value
LOANS ORIGINATED 5 $208,098 114 $154,896 132 $136,872 11 $26,444 3 $704,190 25 $133,914 0 $0 APPLICATIONS APPROVED, NOT ACCEPTED 1 $147,970 7 $136,894 9 $145,120 1 $15,490 0 $0 2 $132,475 0 $0 APPLICATIONS DENIED 2 $147,100 15 $116,032 49 $153,653 6 $78,047 0 $0 3 $98,520 4 $41,312 APPLICATIONS WITHDRAWN 0 $0 16 $136,540 39 $158,665 2 $74,920 0 $0 6 $135,055 0 $0 FILES CLOSED FOR INCOMPLETENESS 0 $0 1 $23,240 15 $149,843 1 $183,590 0 $0 1 $194,570 0 $0
Aggregated Statistics For Year 2004(Based on 2 partial tracts) A) FHA, FSA/RHS & VA B) Conventional C) Refinancings D) Home Improvement Loans E) Loans on Dwellings For 5+ Families F) Non-occupant Loans on G) Loans On Manufactured Number Average Value Number Average Value Number Average Value Number Average Value Number Average Value Number Average Value Number Average Value
LOANS ORIGINATED 5 $153,520 100 $150,134 137 $149,255 25 $49,132 3 $478,553 23 $138,448 0 $0 APPLICATIONS APPROVED, NOT ACCEPTED 0 $0 7 $184,613 8 $150,979 2 $47,875 0 $0 0 $0 1 $27,890 APPLICATIONS DENIED 0 $0 7 $136,610 41 $159,374 4 $43,762 0 $0 3 $129,373 0 $0 APPLICATIONS WITHDRAWN 1 $123,950 10 $160,969 31 $169,706 0 $0 0 $0 2 $130,925 0 $0 FILES CLOSED FOR INCOMPLETENESS 1 $132,760 1 $257,930 5 $201,550 1 $106,850 0 $0 1 $139,450 0 $0
Aggregated Statistics For Year 2003(Based on 2 partial tracts) A) FHA, FSA/RHS & VA B) Conventional C) Refinancings D) Home Improvement Loans E) Loans on Dwellings For 5+ Families F) Non-occupant Loans on Number Average Value Number Average Value Number Average Value Number Average Value Number Average Value Number Average Value
LOANS ORIGINATED 4 $136,860 87 $144,817 344 $130,952 12 $27,540 5 $647,332 36 $115,958 APPLICATIONS APPROVED, NOT ACCEPTED 0 $0 9 $120,592 12 $132,181 1 $8,520 1 $677,860 2 $75,920 APPLICATIONS DENIED 1 $310,450 10 $139,786 41 $153,792 3 $34,280 0 $0 3 $110,230 APPLICATIONS WITHDRAWN 1 $126,280 10 $132,162 35 $160,759 0 $0 0 $0 6 $117,157 FILES CLOSED FOR INCOMPLETENESS 0 $0 0 $0 2 $177,265 1 $7,750 0 $0 1 $189,800
Aggregated Statistics For Year 2002(Based on 2 partial tracts) A) FHA, FSA/RHS & VA B) Conventional C) Refinancings D) Home Improvement Loans E) Loans on Dwellings For 5+ Families F) Non-occupant Loans on Number Average Value Number Average Value Number Average Value Number Average Value Number Average Value Number Average Value
LOANS ORIGINATED 15 $153,375 82 $149,778 276 $120,206 26 $41,603 2 $684,835 27 $117,279 APPLICATIONS APPROVED, NOT ACCEPTED 0 $0 11 $113,326 22 $101,183 3 $9,523 1 $275,790 4 $129,148 APPLICATIONS DENIED 1 $106,130 8 $106,939 32 $127,386 0 $0 1 $166,560 4 $212,462 APPLICATIONS WITHDRAWN 1 $211,870 12 $155,853 17 $112,698 0 $0 0 $0 4 $90,405 FILES CLOSED FOR INCOMPLETENESS 0 $0 0 $0 5 $162,842 1 $11,620 1 $774,700 0 $0
Aggregated Statistics For Year 2001(Based on 2 partial tracts) A) FHA, FSA/RHS & VA B) Conventional C) Refinancings D) Home Improvement Loans E) Loans on Dwellings For 5+ Families F) Non-occupant Loans on Number Average Value Number Average Value Number Average Value Number Average Value Number Average Value Number Average Value
LOANS ORIGINATED 7 $144,007 67 $151,357 199 $114,487 22 $19,273 4 $634,175 22 $131,911 APPLICATIONS APPROVED, NOT ACCEPTED 0 $0 4 $131,795 12 $115,948 2 $14,480 0 $0 0 $0 APPLICATIONS DENIED 0 $0 4 $93,572 20 $111,330 3 $14,267 0 $0 1 $193,670 APPLICATIONS WITHDRAWN 0 $0 3 $92,390 19 $109,056 1 $1,550 1 $226,210 5 $98,660 FILES CLOSED FOR INCOMPLETENESS 0 $0 1 $131,700 1 $131,700 1 $42,610 0 $0 0 $0
Aggregated Statistics For Year 2000(Based on 2 partial tracts) A) FHA, FSA/RHS & VA B) Conventional C) Refinancings D) Home Improvement Loans F) Non-occupant Loans on Number Average Value Number Average Value Number Average Value Number Average Value Number Average Value
LOANS ORIGINATED 4 $119,535 64 $125,859 63 $90,196 26 $24,299 15 $89,739 APPLICATIONS APPROVED, NOT ACCEPTED 0 $0 3 $75,220 5 $63,950 1 $27,000 0 $0 APPLICATIONS DENIED 0 $0 12 $65,135 22 $96,763 2 $77,415 5 $93,894 APPLICATIONS WITHDRAWN 0 $0 7 $118,857 10 $97,857 1 $89,870 1 $93,850 FILES CLOSED FOR INCOMPLETENESS 0 $0 0 $0 1 $109,490 0 $0 0 $0
Aggregated Statistics For Year 1999(Based on 2 partial tracts) A) FHA, FSA/RHS & VA B) Conventional C) Refinancings D) Home Improvement Loans E) Loans on Dwellings For 5+ Families F) Non-occupant Loans on Number Average Value Number Average Value Number Average Value Number Average Value Number Average Value Number Average Value
LOANS ORIGINATED 12 $115,228 72 $114,823 64 $93,680 25 $21,267 3 $234,997 10 $104,700 APPLICATIONS APPROVED, NOT ACCEPTED 0 $0 7 $79,269 9 $41,272 3 $25,980 0 $0 0 $0 APPLICATIONS DENIED 1 $139,730 13 $68,070 16 $70,459 4 $36,518 0 $0 0 $0 APPLICATIONS WITHDRAWN 0 $0 2 $128,695 17 $76,246 5 $62,706 0 $0 1 $41,340 FILES CLOSED FOR INCOMPLETENESS 0 $0 1 $96,380 4 $115,638 0 $0 0 $0 0 $0
Detailed HMDA statistics for the following Tracts:
9603.00
, 9604.00
Private Mortgage Insurance Companies Aggregated Statistics For Year 2009(Based on 2 partial tracts) A) Conventional B) Refinancings Number Average Value Number Average Value
LOANS ORIGINATED 3 $176,923 7 $161,859 APPLICATIONS APPROVED, NOT ACCEPTED 2 $105,860 1 $118,530 APPLICATIONS DENIED 2 $118,835 0 $0 APPLICATIONS WITHDRAWN 1 $37,190 0 $0 FILES CLOSED FOR INCOMPLETENESS 0 $0 0 $0
Aggregated Statistics For Year 2008(Based on 2 partial tracts) A) Conventional B) Refinancings Number Average Value Number Average Value
LOANS ORIGINATED 13 $172,720 6 $191,955 APPLICATIONS APPROVED, NOT ACCEPTED 2 $121,830 2 $113,880 APPLICATIONS DENIED 0 $0 0 $0 APPLICATIONS WITHDRAWN 0 $0 1 $175,060 FILES CLOSED FOR INCOMPLETENESS 0 $0 0 $0
Aggregated Statistics For Year 2007(Based on 2 partial tracts) A) Conventional B) Refinancings C) Non-occupant Loans on Number Average Value Number Average Value Number Average Value
LOANS ORIGINATED 19 $159,301 7 $171,470 1 $176,960 APPLICATIONS APPROVED, NOT ACCEPTED 2 $153,475 1 $106,910 0 $0 APPLICATIONS DENIED 0 $0 0 $0 0 $0 APPLICATIONS WITHDRAWN 1 $195,220 0 $0 0 $0 FILES CLOSED FOR INCOMPLETENESS 0 $0 1 $167,340 0 $0
Aggregated Statistics For Year 2006(Based on 2 partial tracts) A) Conventional B) Refinancings Number Average Value Number Average Value
LOANS ORIGINATED 18 $164,803 8 $187,636 APPLICATIONS APPROVED, NOT ACCEPTED 1 $183,510 0 $0 APPLICATIONS DENIED 0 $0 0 $0 APPLICATIONS WITHDRAWN 0 $0 0 $0 FILES CLOSED FOR INCOMPLETENESS 0 $0 0 $0
Aggregated Statistics For Year 2005(Based on 2 partial tracts) A) Conventional B) Refinancings Number Average Value Number Average Value
LOANS ORIGINATED 22 $167,750 8 $149,989 APPLICATIONS APPROVED, NOT ACCEPTED 1 $168,300 1 $149,480 APPLICATIONS DENIED 0 $0 0 $0 APPLICATIONS WITHDRAWN 0 $0 0 $0 FILES CLOSED FOR INCOMPLETENESS 0 $0 0 $0
Aggregated Statistics For Year 2004(Based on 2 partial tracts) A) Conventional B) Refinancings C) Non-occupant Loans on Number Average Value Number Average Value Number Average Value
LOANS ORIGINATED 19 $161,378 12 $161,632 1 $107,960 APPLICATIONS APPROVED, NOT ACCEPTED 3 $184,510 2 $192,515 0 $0 APPLICATIONS DENIED 0 $0 0 $0 0 $0 APPLICATIONS WITHDRAWN 0 $0 2 $113,895 0 $0 FILES CLOSED FOR INCOMPLETENESS 0 $0 0 $0 0 $0
Aggregated Statistics For Year 2003(Based on 2 partial tracts) A) Conventional B) Refinancings C) Non-occupant Loans on Number Average Value Number Average Value Number Average Value
LOANS ORIGINATED 36 $156,342 21 $182,625 3 $146,957 APPLICATIONS APPROVED, NOT ACCEPTED 3 $173,947 2 $180,705 1 $122,400 APPLICATIONS DENIED 1 $145,640 0 $0 0 $0 APPLICATIONS WITHDRAWN 0 $0 2 $123,485 0 $0 FILES CLOSED FOR INCOMPLETENESS 0 $0 0 $0 0 $0
Aggregated Statistics For Year 2002(Based on 2 partial tracts) A) Conventional B) Refinancings C) Non-occupant Loans on Number Average Value Number Average Value Number Average Value
LOANS ORIGINATED 37 $163,801 17 $157,962 2 $134,580 APPLICATIONS APPROVED, NOT ACCEPTED 3 $116,507 3 $140,203 0 $0 APPLICATIONS DENIED 0 $0 0 $0 0 $0 APPLICATIONS WITHDRAWN 1 $147,970 0 $0 0 $0 FILES CLOSED FOR INCOMPLETENESS 0 $0 0 $0 0 $0
Aggregated Statistics For Year 2001(Based on 2 partial tracts) A) Conventional B) Refinancings C) Non-occupant Loans on Number Average Value Number Average Value Number Average Value
LOANS ORIGINATED 25 $153,698 9 $141,633 2 $92,965 APPLICATIONS APPROVED, NOT ACCEPTED 1 $114,660 1 $132,470 0 $0 APPLICATIONS DENIED 0 $0 0 $0 0 $0 APPLICATIONS WITHDRAWN 0 $0 1 $96,060 0 $0 FILES CLOSED FOR INCOMPLETENESS 0 $0 0 $0 0 $0
Aggregated Statistics For Year 2000(Based on 2 partial tracts) A) Conventional B) Refinancings C) Non-occupant Loans on Number Average Value Number Average Value Number Average Value
LOANS ORIGINATED 16 $128,522 4 $143,040 2 $69,725 APPLICATIONS APPROVED, NOT ACCEPTED 2 $218,650 0 $0 0 $0 APPLICATIONS DENIED 0 $0 2 $100,710 0 $0 APPLICATIONS WITHDRAWN 0 $0 0 $0 0 $0 FILES CLOSED FOR INCOMPLETENESS 0 $0 0 $0 0 $0
Aggregated Statistics For Year 1999(Based on 2 partial tracts) A) Conventional B) Refinancings C) Non-occupant Loans on Number Average Value Number Average Value Number Average Value
LOANS ORIGINATED 14 $129,371 3 $102,157 1 $88,310 APPLICATIONS APPROVED, NOT ACCEPTED 1 $74,440 0 $0 0 $0 APPLICATIONS DENIED 0 $0 0 $0 0 $0 APPLICATIONS WITHDRAWN 0 $0 0 $0 0 $0 FILES CLOSED FOR INCOMPLETENESS 0 $0 0 $0 0 $0
Detailed PMIC statistics for the following Tracts:
9603.00
, 9604.00 Fire-safe hotels and motels in River Falls, Wisconsin:
Super 8 Motel River Falls, 1207 St Croix St, River Falls, Wisconsin 54022 Phone: (715) 425-8388, Fax: (715) 425-7103
Country Inn By Carlson, 1525 Commerce St, River Falls, Wisconsin 54022 Phone: (715) 425-9500, Fax: (715) 425-9200
Americas Best Value Inn, 708 N Main St, River Falls, Wisconsin 54022 Phone: (715) 425-6767, Fax: (715) 425-6464
Best Western Plus Campus Inn, 100 Spring St, River Falls, Wisconsin 54022 Phone: (715) 425-1045
All 4 fire-safe hotels and motels in River Falls, Wisconsin River Falls compared to Wisconsin state average:
Unemployed percentage below state average. Black race population percentage significantly below state average. Hispanic race population percentage below state average. Median age significantly below state average. Foreign-born population percentage below state average. Length of stay since moving in above state average. House age below state average. Number of college students significantly above state average. Percentage of population with a bachelor's degree or higher above state average. River Falls on our top lists :
#71 on the list of "Top 101 cities with the most people taking a bicycle to work (population 5,000+)"
#84 on the list of "Top 101 cities with the most people walking to work (population 5,000+)"
#90 on the list of "Top 101 cities with the least people living the same house as 1 year ago (population 5,000+))"
Top Patent Applicants
Christian S. Nielsen (31)
Greg Fuchs (19)
James M. Henry (18)
Bryon A. Merrill (17)
Nick A. Youker (16)
Randy Westlund (15)
John E. Thomas (14)
Randy W. Westlund (13)
Gregory L. Zwadlo (12)
Panu K. Zoller (10)
Total of 425 patent applications in 2008-2024.

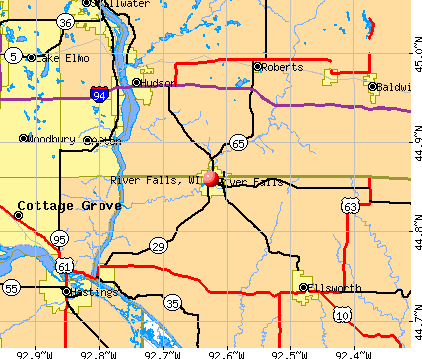


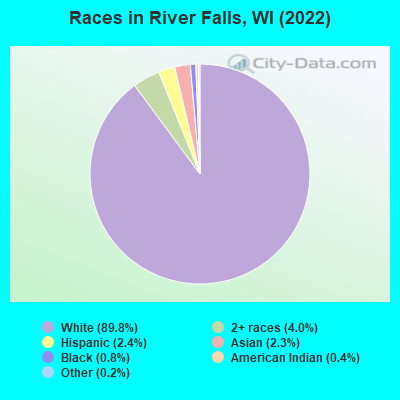
 Recent articles from our blog. Our writers, many of them Ph.D. graduates or candidates, create easy-to-read articles on a wide variety of topics.

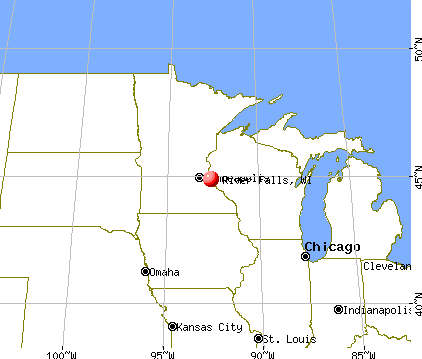
 (24.9 miles
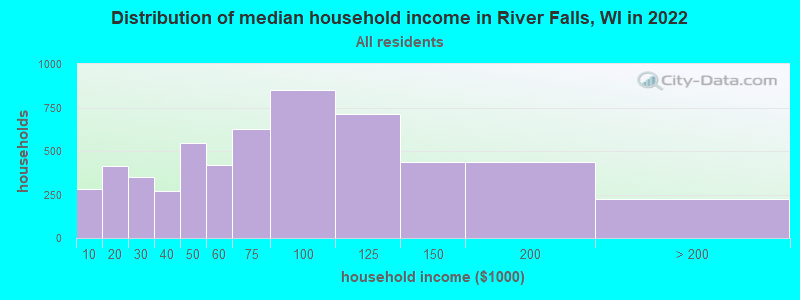
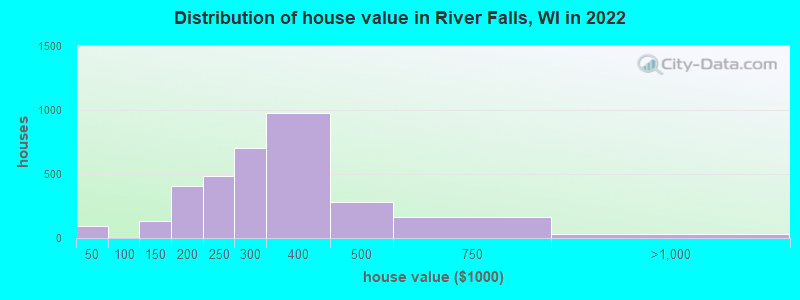

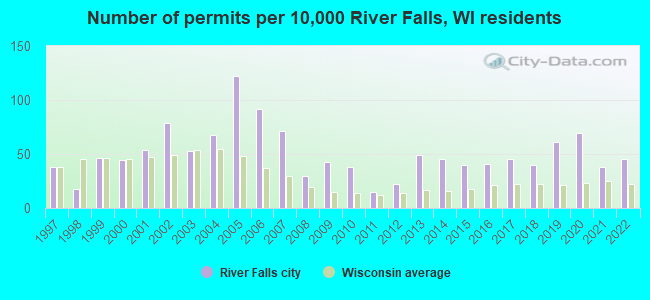
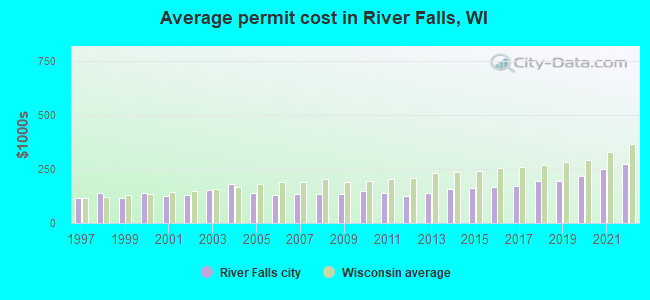
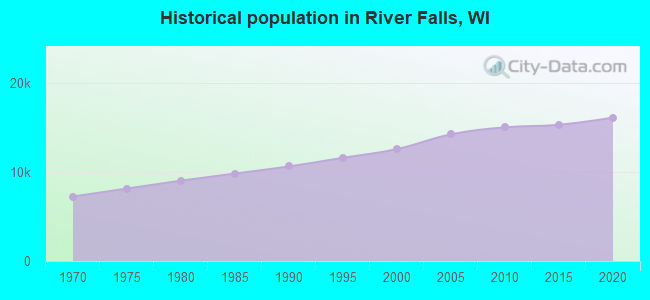
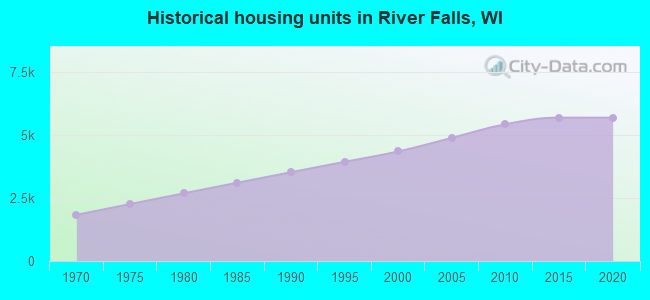
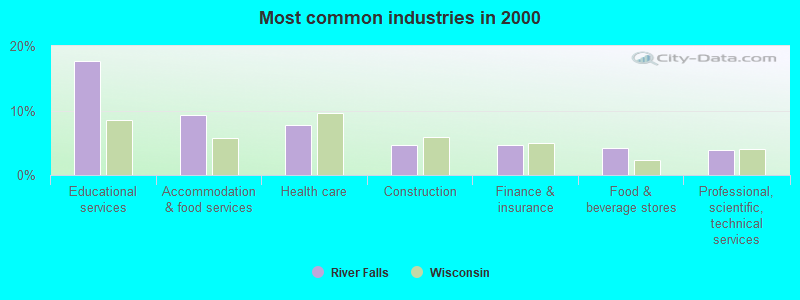
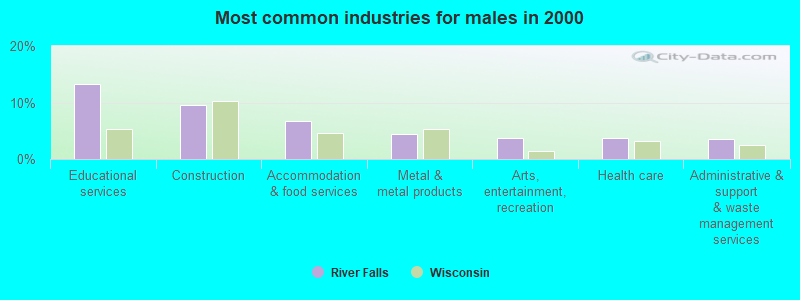
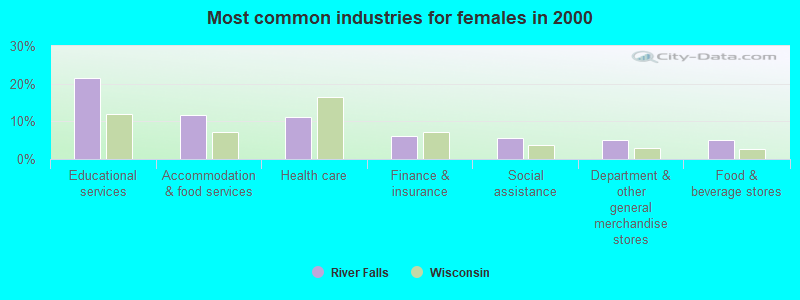
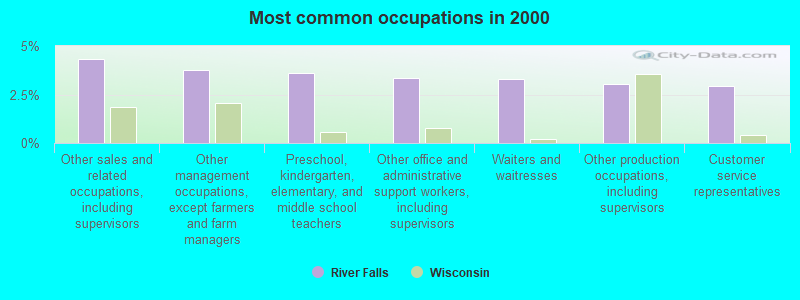
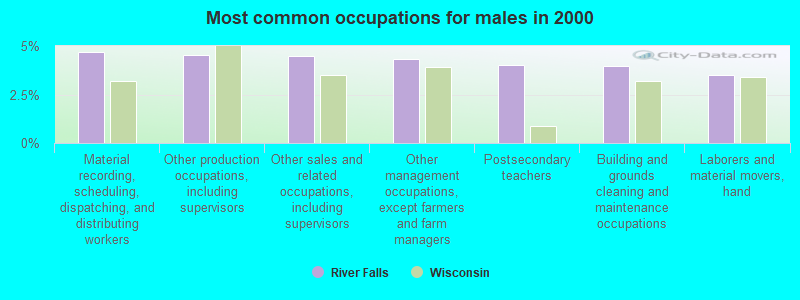
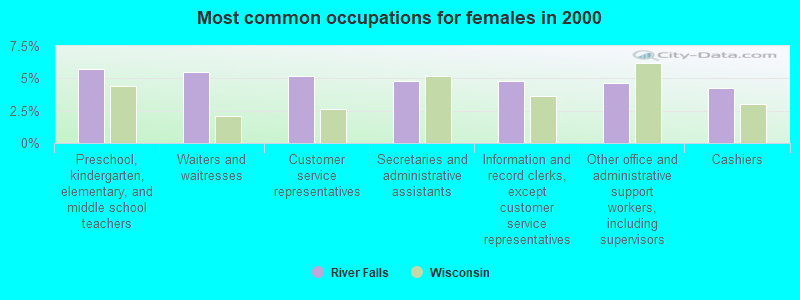
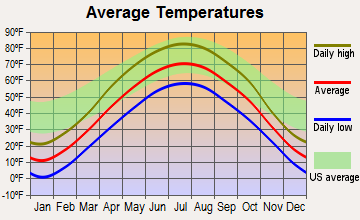
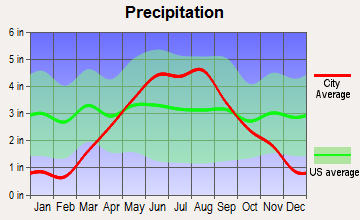
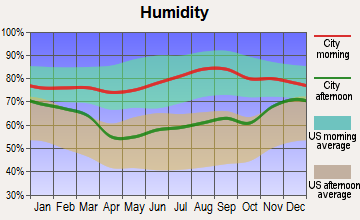
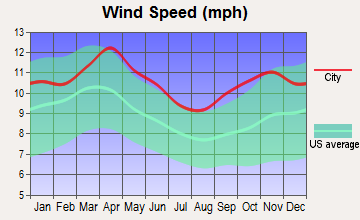
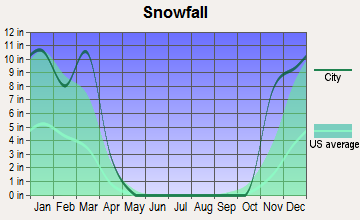
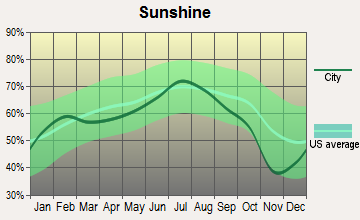
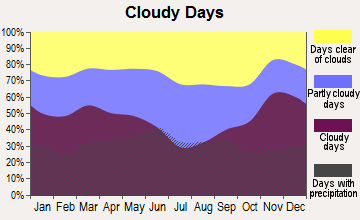


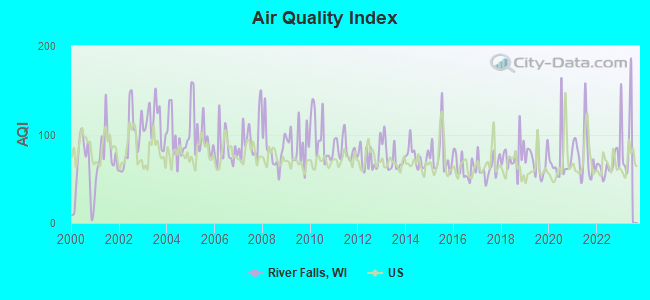
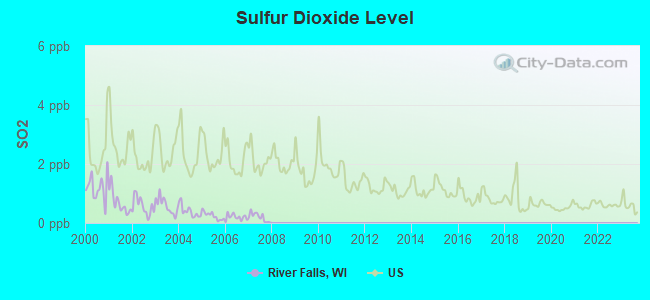
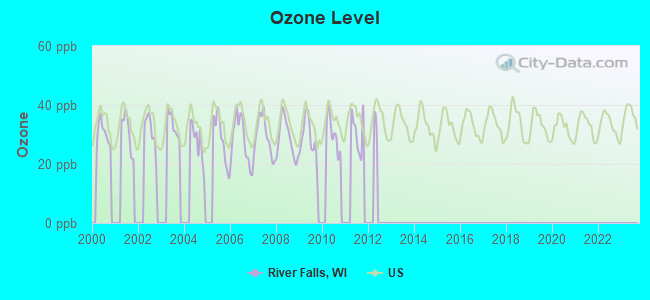
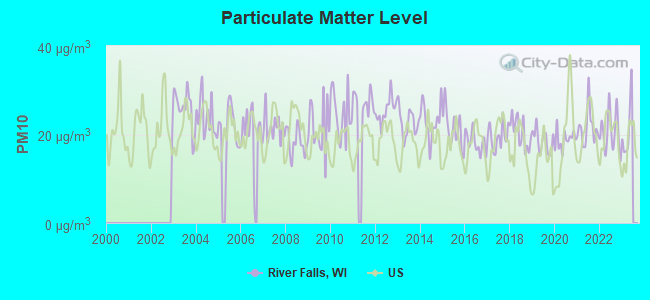
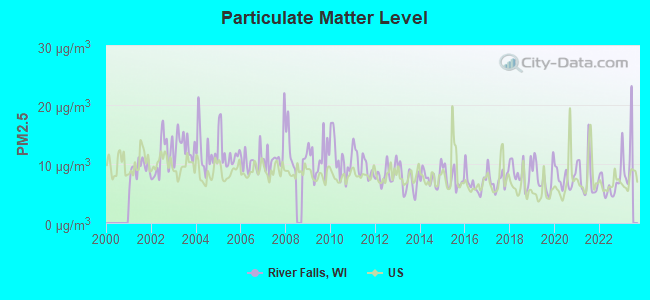
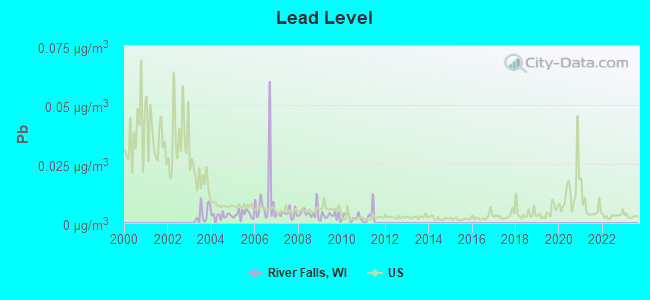
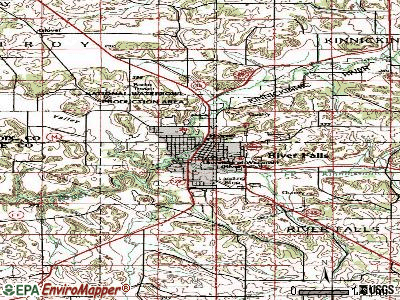
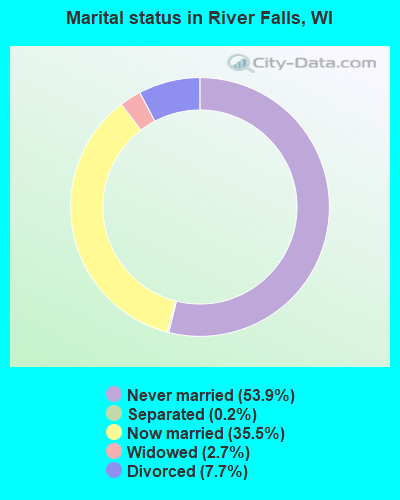
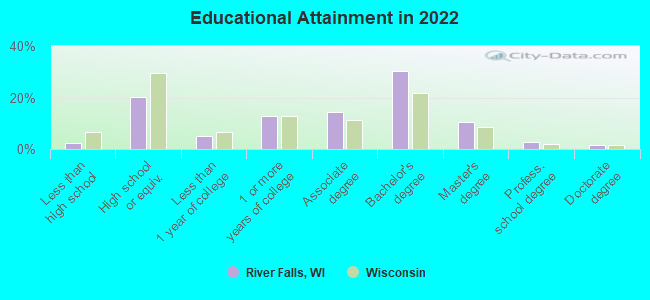
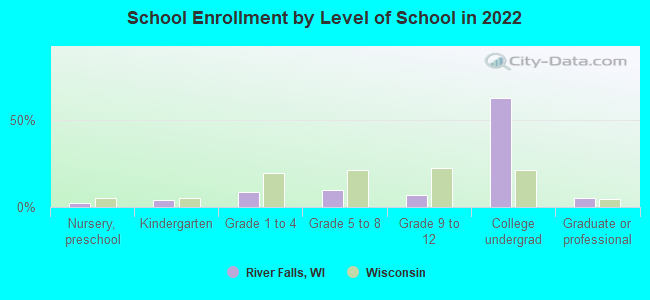
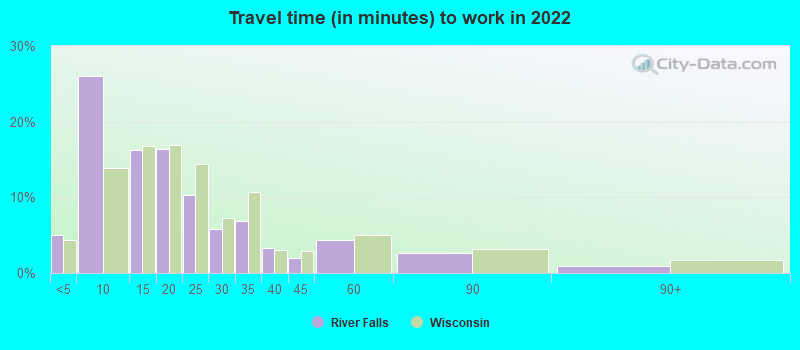
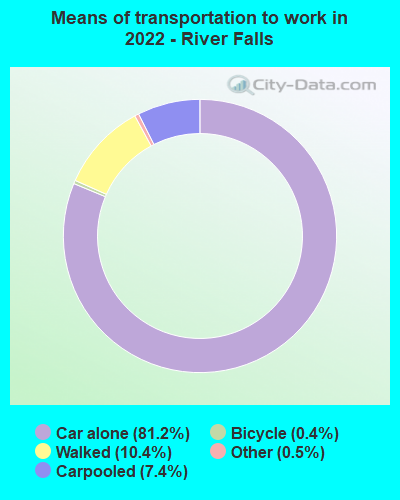
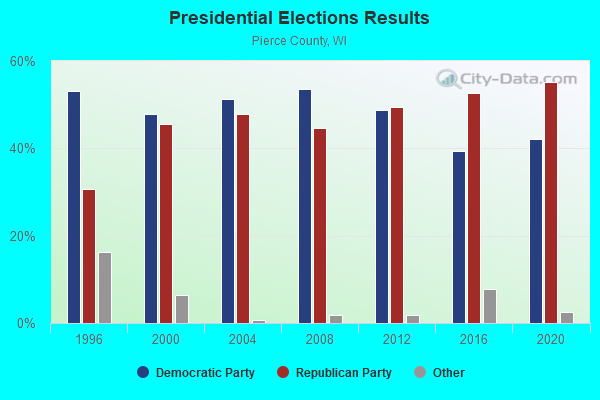
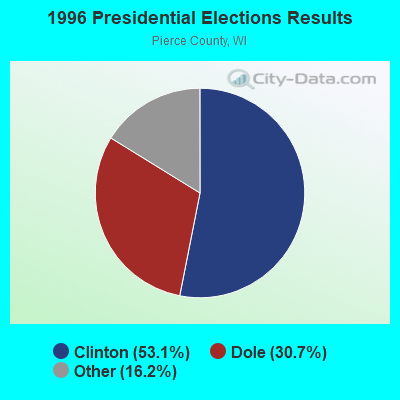
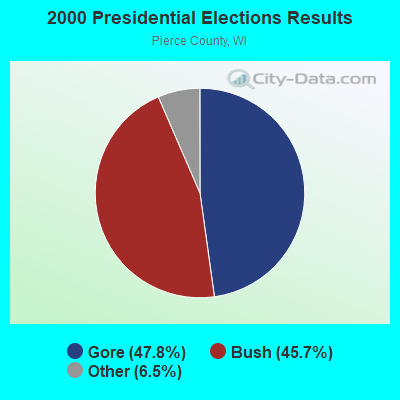
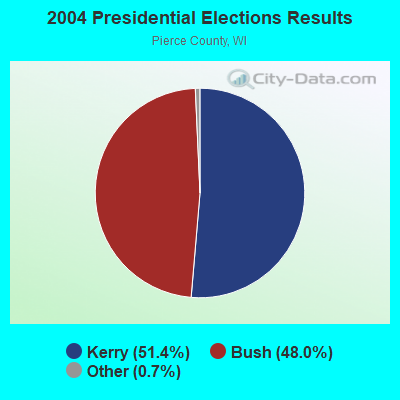
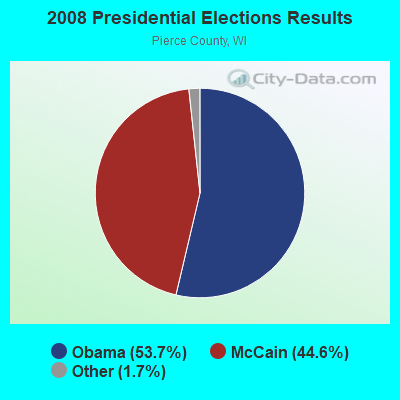
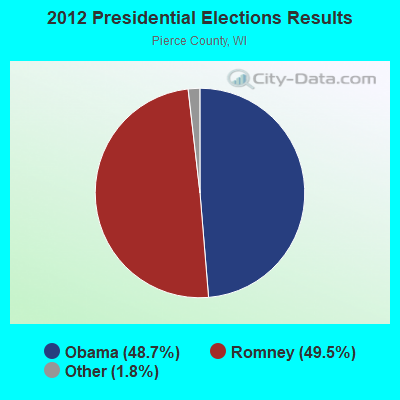
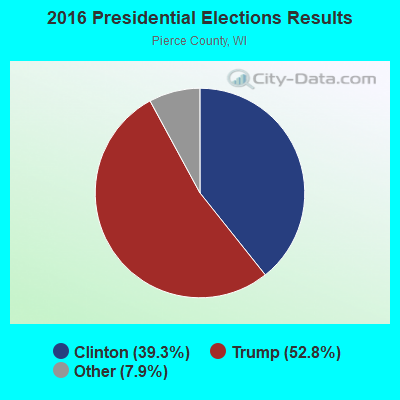
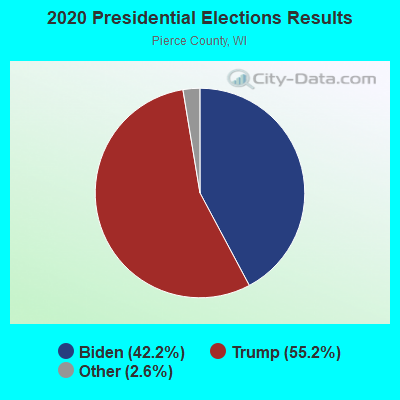
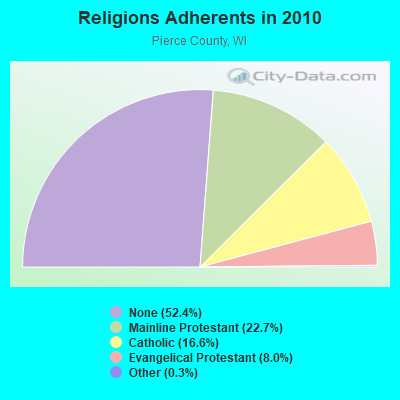
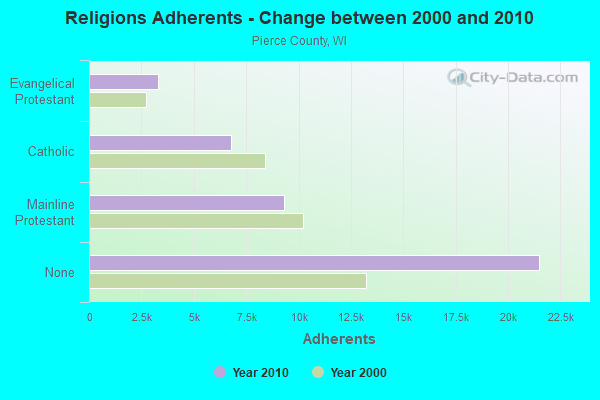
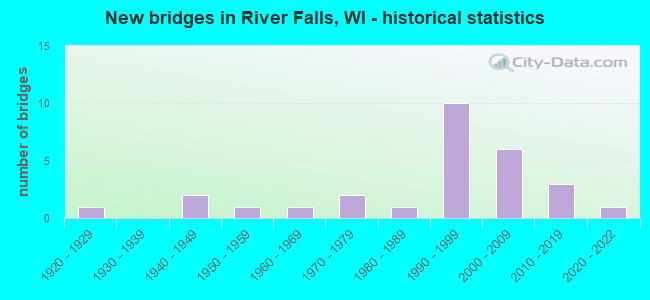
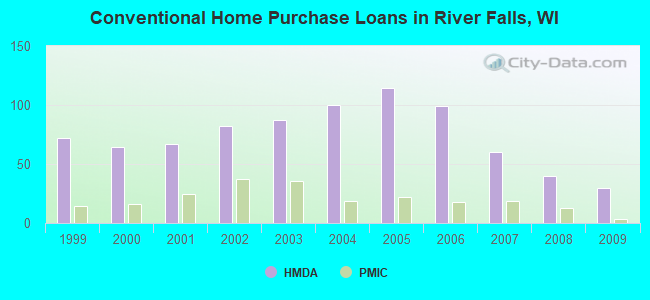
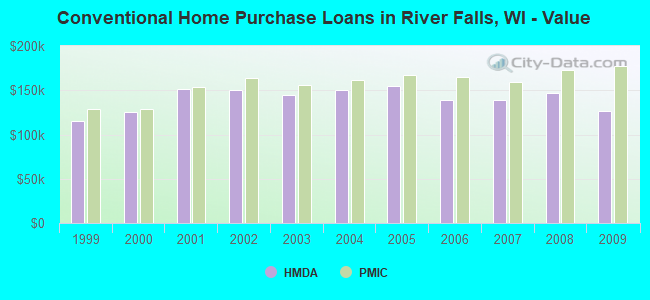
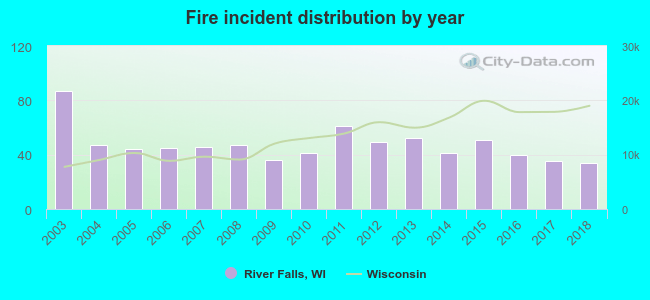 Based on the data from the years 2003 - 2018 the average number of fire incidents per year is 47. The highest number of fires - 87 took place in 2003, and the least - 34 in 2018. The data has a decreasing trend.
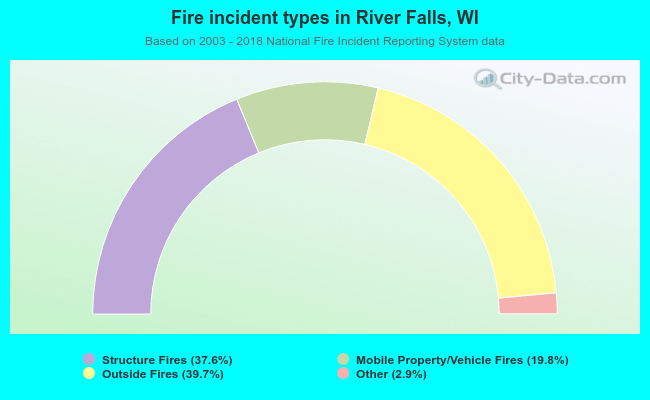 When looking into fire subcategories, the most incidents belonged to: Outside Fires (39.7%), and Structure Fires (37.6%).