Pine Valley, Wisconsin
Submit your own pictures of this town and show them to the world
- OSM Map
- Google Map
- MSN Map
Population change since 2000: +3.2%
 |
| Males: 612 | |
| Females: 545 |
| Median resident age: | 44.5 years |
| Wisconsin median age: | 42.6 years |
Zip codes: 54456.
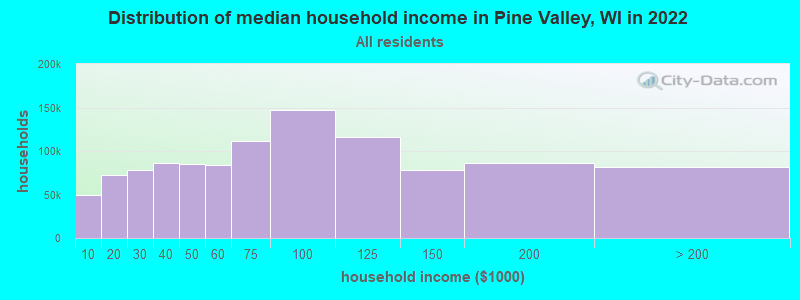
| Pine Valley: | $67,706 |
| WI: | $70,996 |
Estimated per capita income in 2022: $36,767 (it was $18,736 in 2000)
Pine Valley town income, earnings, and wages data
Estimated median house or condo value in 2022: $190,082 (it was $80,400 in 2000)
| Pine Valley: | $190,082 |
| WI: | $252,800 |
Mean prices in 2022: all housing units: $219,245; detached houses: $223,709; townhouses or other attached units: $302,988; in 2-unit structures: $128,535; in 3-to-4-unit structures: $94,848; in 5-or-more-unit structures: $472,971; mobile homes: $106,493; occupied boats, rvs, vans, etc.: over $1,000,000
Detailed information about poverty and poor residents in Pine Valley, WI


- 1,11095.9%White alone
- 171.5%Hispanic
- 141.2%American Indian alone
- 70.6%Two or more races
- 60.5%Asian alone
- 20.2%Black alone
- 10.09%Native Hawaiian and Other
Pacific Islander alone
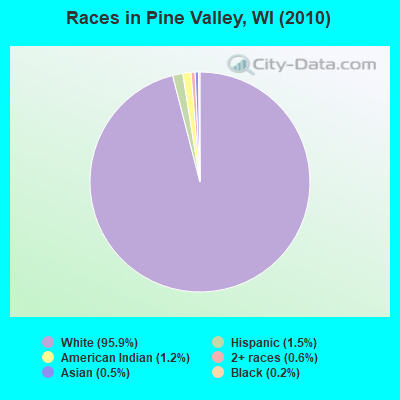
Races in Pine Valley detailed stats: ancestries, foreign born residents, place of birth
 Recent articles from our blog. Our writers, many of them Ph.D. graduates or candidates, create easy-to-read articles on a wide variety of topics.
Ancestries: German (57.9%), Irish (9.2%), English (8.9%), Norwegian (8.2%), United States (4.9%), Polish (3.7%).
Current Local Time: CST time zone
Land area: 33.3 square miles.
Population density: 35 people per square mile (very low).
19 residents are foreign born
| This town: | 1.7% |
| Wisconsin: | 3.6% |
| Pine Valley town: | 2.0% ($1,601) |
| Wisconsin: | 2.0% ($2,245) |
Nearest city with pop. 50,000+: Eau Claire, WI  (46.8 miles , pop. 61,704).
Nearest city with pop. 200,000+: Madison, WI (119.0 miles , pop. 208,054).
Nearest city with pop. 1,000,000+: Chicago, IL (239.0 miles , pop. 2,896,016).
Nearest cities:
), ), ), ), ), Latitude: 44.55 N, Longitude: 90.61 W
Area code commonly used in this area: 715
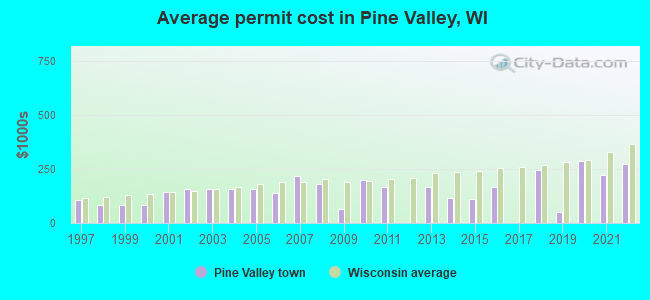
Single-family new house construction building permits:
- 2022: 6 buildings, average cost: $273,300
- 2021: 2 buildings, average cost: $225,000
- 2020: 3 buildings, average cost: $288,300
- 2019: 1 building, cost: $50,000
- 2018: 2 buildings, average cost: $244,500
- 2016: 2 buildings, average cost: $167,000
- 2015: 2 buildings, average cost: $111,100
- 2014: 2 buildings, average cost: $116,000
- 2013: 1 building, cost: $165,000
- 2011: 3 buildings, average cost: $165,300
- 2010: 4 buildings, average cost: $198,800
- 2009: 3 buildings, average cost: $66,300
- 2008: 4 buildings, average cost: $181,500
- 2007: 5 buildings, average cost: $217,000
- 2006: 9 buildings, average cost: $137,400
- 2005: 15 buildings, average cost: $159,300
- 2004: 16 buildings, average cost: $159,300
- 2003: 16 buildings, average cost: $159,300
- 2002: 15 buildings, average cost: $159,300
- 2001: 10 buildings, average cost: $142,000
- 2000: 7 buildings, average cost: $85,400
- 1999: 8 buildings, average cost: $85,400
- 1998: 8 buildings, average cost: $85,400
- 1997: 6 buildings, average cost: $108,000

| Here: | 2.8% |
| Wisconsin: | 2.7% |
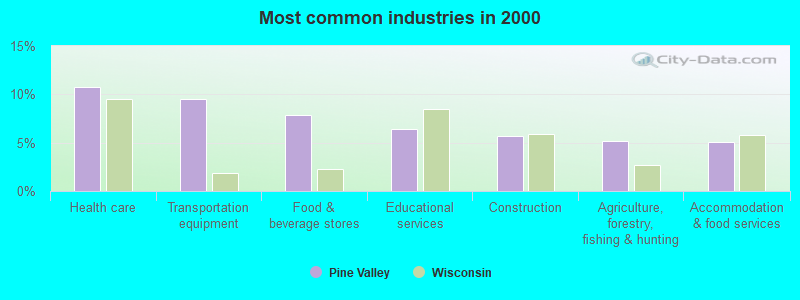
- Health care (10.8%)
- Transportation equipment (9.5%)
- Food & beverage stores (7.8%)
- Educational services (6.4%)
- Construction (5.7%)
- Agriculture, forestry, fishing & hunting (5.2%)
- Accommodation & food services (5.0%)
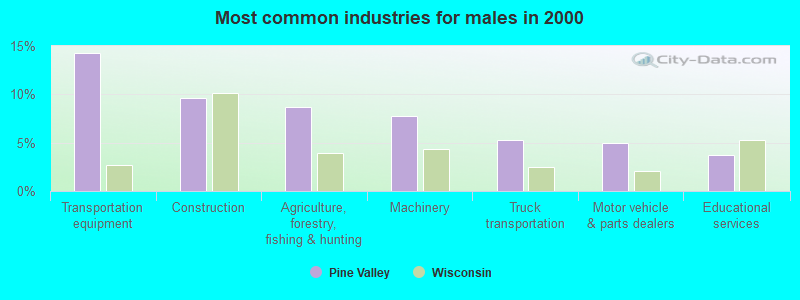
- Transportation equipment (14.3%)
- Construction (9.6%)
- Agriculture, forestry, fishing & hunting (8.7%)
- Machinery (7.8%)
- Truck transportation (5.3%)
- Motor vehicle & parts dealers (5.0%)
- Educational services (3.7%)
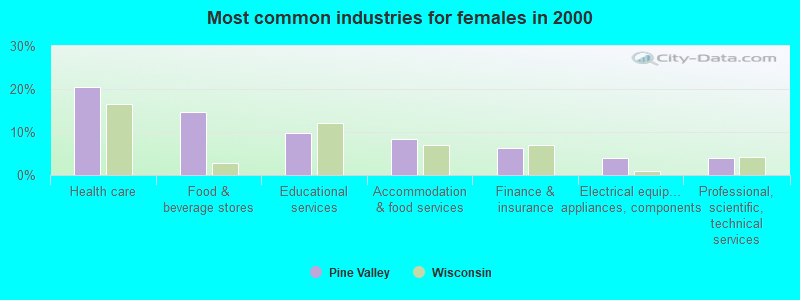
- Health care (20.5%)
- Food & beverage stores (14.6%)
- Educational services (9.8%)
- Accommodation & food services (8.3%)
- Finance & insurance (6.3%)
- Electrical equipment, appliances, components (3.9%)
- Professional, scientific, technical services (3.9%)
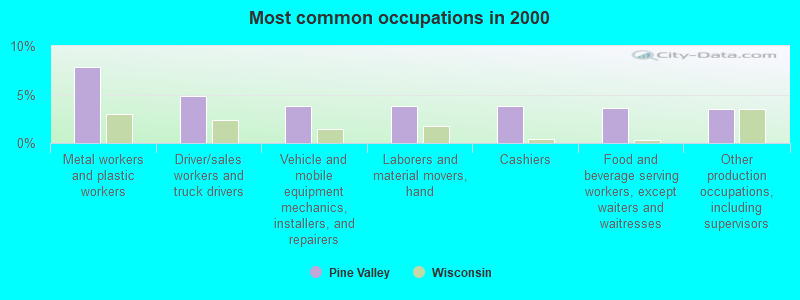
- Metal workers and plastic workers (7.8%)
- Driver/sales workers and truck drivers (4.9%)
- Vehicle and mobile equipment mechanics, installers, and repairers (3.8%)
- Laborers and material movers, hand (3.8%)
- Cashiers (3.8%)
- Food and beverage serving workers, except waiters and waitresses (3.6%)
- Other production occupations, including supervisors (3.5%)
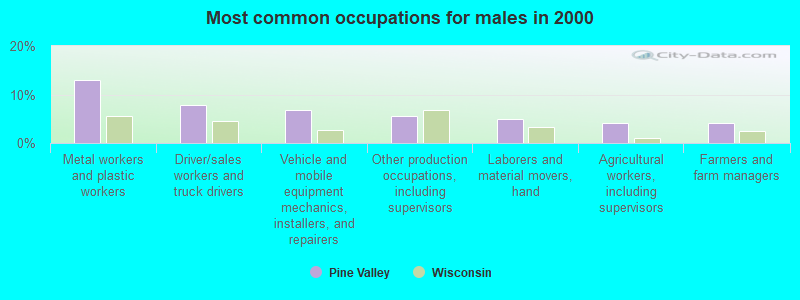
- Metal workers and plastic workers (13.0%)
- Driver/sales workers and truck drivers (7.8%)
- Vehicle and mobile equipment mechanics, installers, and repairers (6.8%)
- Other production occupations, including supervisors (5.6%)
- Laborers and material movers, hand (5.0%)
- Agricultural workers, including supervisors (4.0%)
- Farmers and farm managers (4.0%)
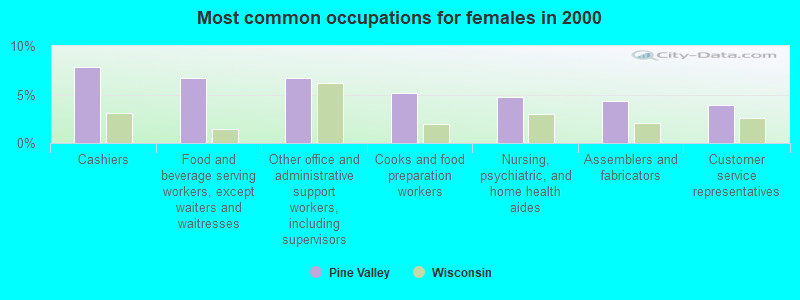
- Cashiers (7.9%)
- Food and beverage serving workers, except waiters and waitresses (6.7%)
- Other office and administrative support workers, including supervisors (6.7%)
- Cooks and food preparation workers (5.1%)
- Nursing, psychiatric, and home health aides (4.7%)
- Assemblers and fabricators (4.3%)
- Customer service representatives (3.9%)
Average climate in Pine Valley, Wisconsin
Based on data reported by over 4,000 weather stations


(lower is better)
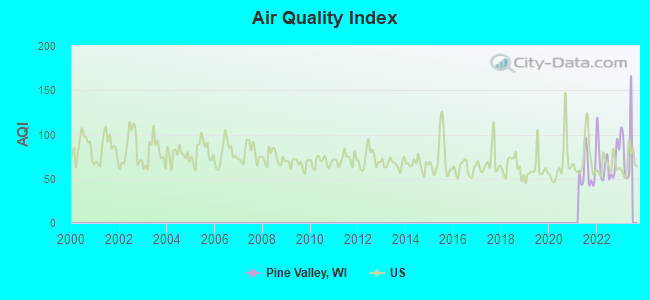
Air Quality Index (AQI) level in 2022 was 69.9. This is about average.
| City: | 69.9 |
| U.S.: | 72.6 |
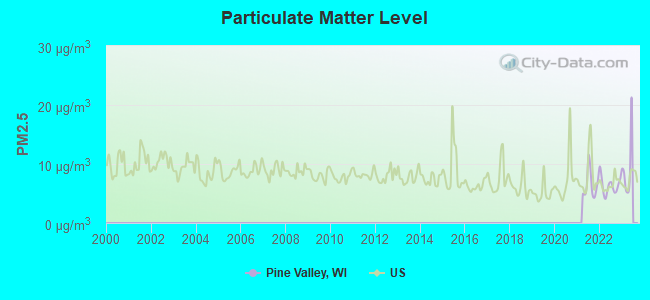
Particulate Matter (PM2.5) [µg/m3] level in 2022 was 6.34. This is better than average. Closest monitor was 17.5 miles away from the city center.
| City: | 6.34 |
| U.S.: | 8.11 |
Tornado activity:
Pine Valley-area historical tornado activity is near Wisconsin state average. It is 8% greater than the overall U.S. average.
On 6/4/1958, a category F4 (max. wind speeds 207-260 mph) tornado 35.5 miles away from the Pine Valley town center killed 4 people and injured 3 people and caused between $500,000 and $5,000,000 in damages.
On 5/26/1959, a category F3 (max. wind speeds 158-206 mph) tornado 14.7 miles away from the town center injured 2 people and caused between $50,000 and $500,000 in damages.
Earthquake activity:
Pine Valley-area historical earthquake activity is significantly above Wisconsin state average. It is 15% greater than the overall U.S. average.On 7/9/1975 at 14:54:15, a magnitude 4.6 (4.6 MB, Class: Light, Intensity: IV - V) earthquake occurred 275.8 miles away from the city center
On 6/28/2004 at 06:10:52, a magnitude 4.2 (4.2 MW, Depth: 6.2 mi) earthquake occurred 230.9 miles away from the city center
On 4/18/2008 at 09:36:59, a magnitude 5.4 (5.1 MB, 4.8 MS, 5.4 MW, 5.2 MW, Class: Moderate, Intensity: VI - VII) earthquake occurred 445.0 miles away from the city center
On 6/10/1987 at 23:48:54, a magnitude 5.1 (4.9 MB, 4.4 MS, 4.6 MS, 5.1 LG) earthquake occurred 420.8 miles away from Pine Valley center
On 2/10/2010 at 09:59:35, a magnitude 3.8 (3.8 MW, Depth: 6.2 mi, Class: Light, Intensity: II - III) earthquake occurred 208.1 miles away from Pine Valley center
On 4/18/2008 at 09:36:59, a magnitude 5.2 (5.2 MW, Depth: 8.9 mi) earthquake occurred 445.0 miles away from the city center
Magnitude types: regional Lg-wave magnitude (LG), body-wave magnitude (MB), surface-wave magnitude (MS), moment magnitude (MW)
Natural disasters:
The number of natural disasters in Clark County (14) is near the US average (15).Major Disasters (Presidential) Declared: 11
Emergencies Declared: 2
Causes of natural disasters: Floods: 11, Storms: 10, Tornadoes: 4, Winds: 3, Drought: 1, Heavy Rain: 1, Hurricane: 1, Mudslide: 1, Other: 1 (Note: some incidents may be assigned to more than one category).
Colleges/universities with over 2000 students nearest to Pine Valley:
- Mid-State Technical College (about 43 miles; Wisconsin Rapids, WI; Full-time enrollment: 2,128)
- University of Wisconsin-Eau Claire (about 47 miles; Eau Claire, WI; FT enrollment: 10,143)
- Chippewa Valley Technical College (about 47 miles; Eau Claire, WI; FT enrollment: 4,038)
- University of Wisconsin-Stevens Point (about 52 miles; Stevens Point, WI; FT enrollment: 9,089)
- Northcentral Technical College (about 57 miles; Wausau, WI; FT enrollment: 3,356)
- University of Wisconsin-La Crosse (about 60 miles; La Crosse, WI; FT enrollment: 9,837)
- Western Technical College (about 60 miles; La Crosse, WI; FT enrollment: 3,377)
Points of interest:
Notable locations in Pine Valley: Neillsville Wastewater Treatment Facility (A), Neillsville Municipal Ambulance Service (B), Neillsville Area Fire Department (C). Display/hide their locations on the map
Churches in Pine Valley include: Assembly of God Church (A), Bible Baptist Church (B), Calvary Lutheran Church (C), Kingdom Hall of Jehovahs Witnesses (D), Living Hope Evangelical Church (E), Saint Johns Evangelical Lutheran Church (F), Saint Marys Catholic Church (G), Zion Church (H). Display/hide their locations on the map
Cemeteries: Neillsville City Cemetery (1), North Pine Valley Cemetery (2), Saint Marys Cemetery (3). Display/hide their locations on the map
Creeks: Jack Creek (A), Spooner Creek (B), Cawley Creek (C), O'Neill Creek (D), Cunningham Creek (E), Conlan Creek (F). Display/hide their locations on the map
Parks in Pine Valley include: Clark County Fairgrounds (1), Fountain Park (2), Listeman Arboretum (3), Marguerite Listeman Park (4), Northside Park (5), Schuster Park (6), Tock Memorial Field (7). Display/hide their locations on the map
| This town: | 2.5 people |
| Wisconsin: | 2.4 people |
| This town: | 76.4% |
| Whole state: | 64.4% |
| This town: | 4.1% |
| Whole state: | 7.3% |
No gay or lesbian households reported
| This town: | 6.1% |
| Whole state: | 8.7% |
| This town: | 0.9% |
| Whole state: | 3.7% |
For population 15 years and over in Pine Valley:
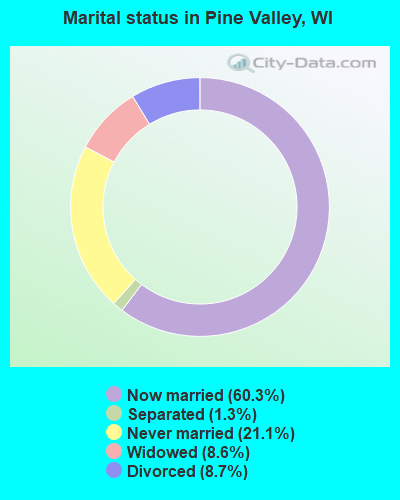
- Never married: 21.1%
- Now married: 60.3%
- Separated: 1.3%
- Widowed: 8.6%
- Divorced: 8.7%
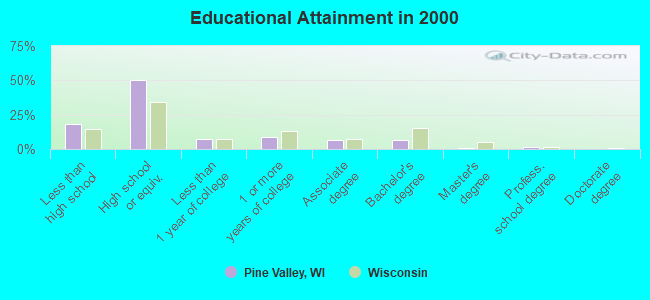
For population 25 years and over in Pine Valley:
- High school or higher: 81.7%
- Bachelor's degree or higher: 9.3%
- Graduate or professional degree: 3.0%
- Unemployed: 5.9%
- Mean travel time to work (commute): 18.6 minutes
| Here: | 9.8 |
| Wisconsin average: | 11.0 |
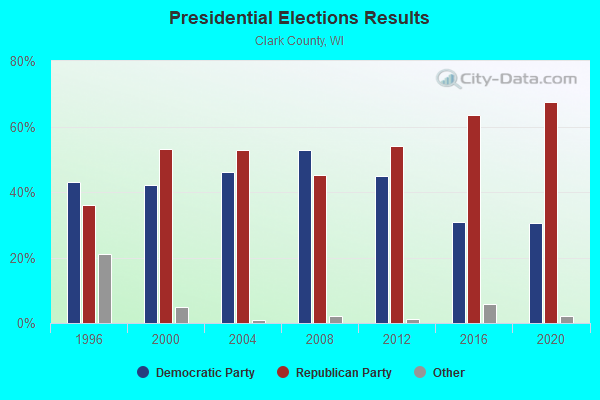
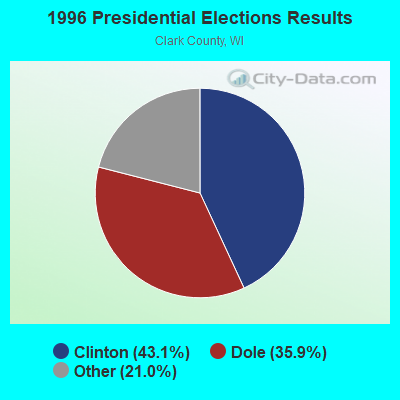
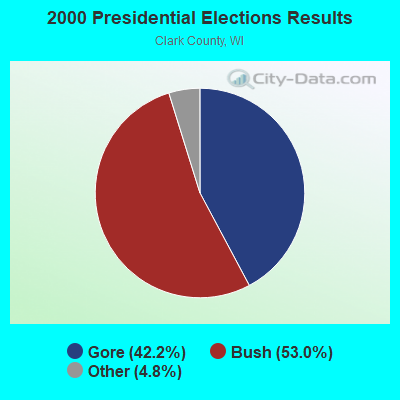
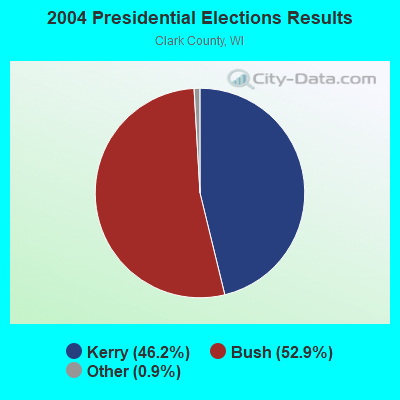
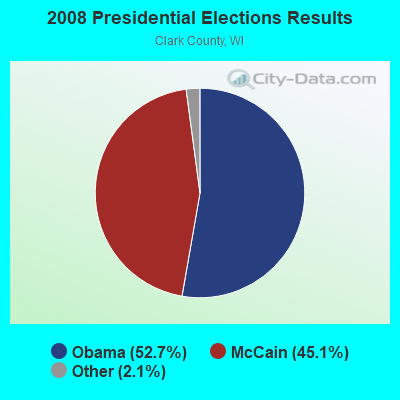
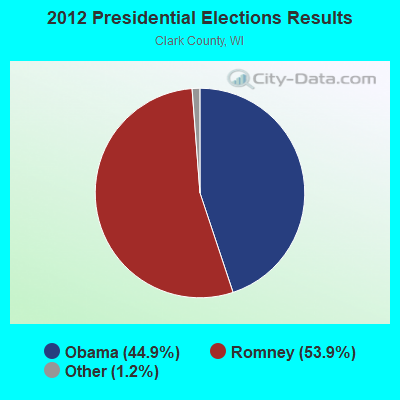
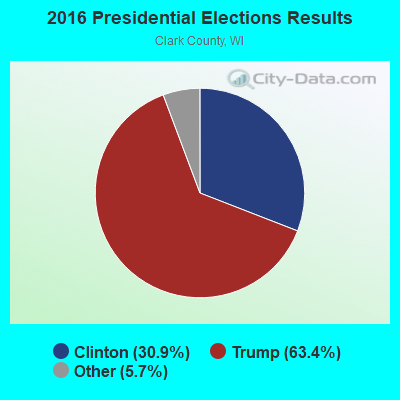
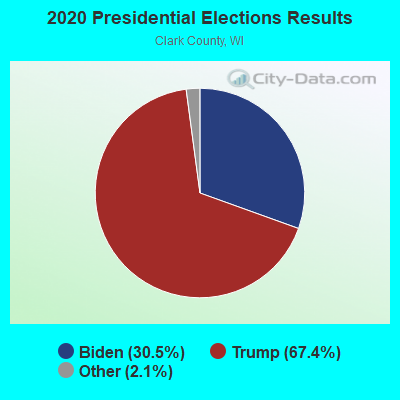
Graphs represent county-level data. Detailed 2008 Election Results
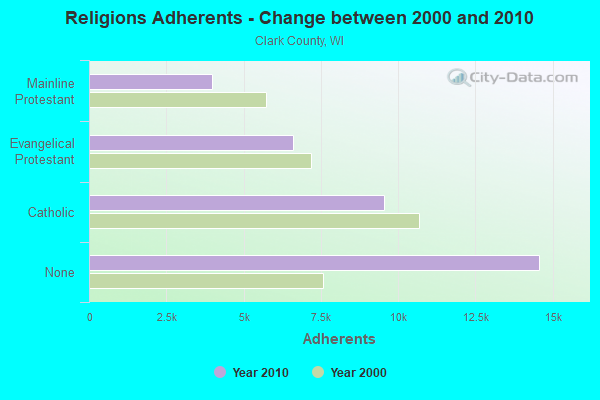
Religion statistics for Pine Valley, WI (based on Clark County data)
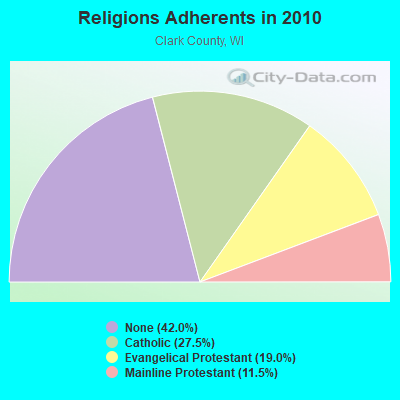
| Religion | Adherents | Congregations |
|---|---|---|
| Catholic | 9,535 | 9 |
| Evangelical Protestant | 6,594 | 41 |
| Mainline Protestant | 3,981 | 25 |
| Other | 7 | 5 |
| Orthodox | - | - |
| None | 14,573 | - |
Food Environment Statistics:
| Clark County: | 2.69 / 10,000 pop. |
| Wisconsin: | 1.86 / 10,000 pop. |
| Clark County: | 5.38 / 10,000 pop. |
| Wisconsin: | 4.12 / 10,000 pop. |
| This county: | 7.78 / 10,000 pop. |
| State: | 8.64 / 10,000 pop. |
| Clark County: | 7.9% |
| State: | 7.6% |
| Clark County: | 28.3% |
| Wisconsin: | 27.5% |
| Clark County: | 16.2% |
| State: | 13.0% |
Strongest AM radio stations in Pine Valley:
- WCCN (1370 AM; 5 kW; NEILLSVILLE, WI; Owner: CENTRAL WISCONSIN BROADCASTING, INC.)
- WSPT (1010 AM; 50 kW; STEVENS POINT, WI)
- WSAU (550 AM; 20 kW; WAUSAU, WI; Owner: WRIG, INC.)
- WLBL (930 AM; 5 kW; AUBURNDALE, WI; Owner: STATE OF WISCONSIN - EDUCATIONAL COMMUNICATIONS BOARD)
- WCTS (1030 AM; 50 kW; MAPLEWOOD, MN; Owner: CNTL. BAPT. THEO/AL SEMI MINNEAPOLIS)
- WNAM (1280 AM; 50 kW; NEENAH-MENASHA, WI; Owner: CUMULUS LICENSING CORP.)
- WEBC (560 AM; 50 kW; DULUTH, MN)
- WAYY (790 AM; 5 kW; EAU CLAIRE, WI; Owner: MAVERICK MEDIA OF EAU CLAIRE LICENSE LLC)
- WCCO (830 AM; 50 kW; MINNEAPOLIS, MN; Owner: INFINITY MEDIA CORPORATION)
- WMEQ (880 AM; 10 kW; MENOMONIE, WI; Owner: CAPSTAR TX LIMITED PARTNERSHIP)
- WRIG (1390 AM; 10 kW; SCHOFIELD, WI; Owner: WRIG, INC.)
- WFHR (1320 AM; 5 kW; WISCONSIN RAPIDS, WI; Owner: WISCONSIN RAPIDS BROADCASTING, LLC)
- KFAN (1130 AM; 50 kW; MINNEAPOLIS, MN; Owner: AMFM RADIO LICENSES, L.L.C.)
Strongest FM radio stations in Pine Valley:
- WCCN-FM (107.5 FM; NEILLSVILLE, WI; Owner: CENTRAL WISCONSIN B/CG INC.)
- WAXX (104.5 FM; EAU CLAIRE, WI; Owner: MAVERICK MEDIA OF EAU CLAIRE LICENSE LLC)
- WGLX-FM (103.3 FM; WISCONSIN RAPIDS, WI; Owner: WISCONSIN RAPIDS BROADCASTING, LLC)
- WLJY (106.5 FM; MARSHFIELD, WI; Owner: NEWRADIO GROUP, LLC)
- WWIS-FM (99.7 FM; BLACK RIVER FALLS, WI; Owner: WWIS RADIO, INC.)
- WOSQ (92.3 FM; SPENCER, WI; Owner: NEWRADIO GROUP, LLC)
TV broadcast stations around Pine Valley:
- WEAU-TV (Channel 13; EAU CLAIRE, WI; Owner: WEAU LICENSEE CORP.)
- WDLS-LP (Channel 35; TOMAH, WI; Owner: MAGNUM RADIO, INC.)
- WKBT (Channel 8; LA CROSSE, WI; Owner: QUEENB TELEVISION, LLC)
- W24BV (Channel 24; WHITING, WI; Owner: MS COMMUNICATIONS, LLC)
- National Bridge Inventory (NBI) Statistics
- 9Number of bridges
- 79ft / 23.7mTotal length
- $315,000Total costs
- 9,069Total average daily traffic
- 717Total average daily truck traffic
- 13,571Total future (year 2039) average daily traffic
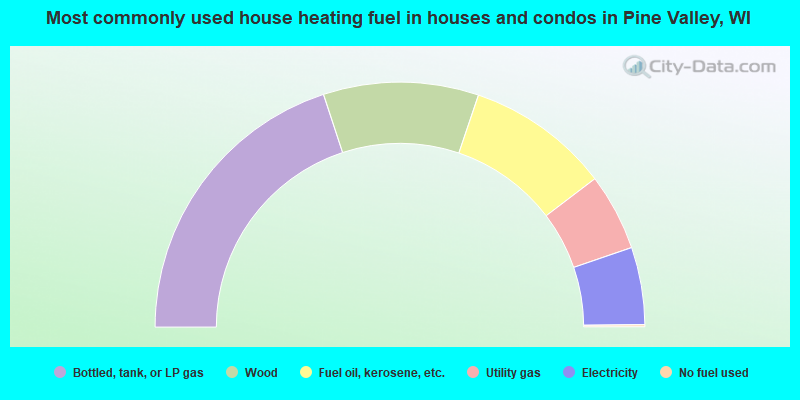
- 39.9%Bottled, tank, or LP gas
- 20.5%Wood
- 18.9%Fuel oil, kerosene, etc.
- 10.2%Utility gas
- 10.2%Electricity
- 0.3%No fuel used
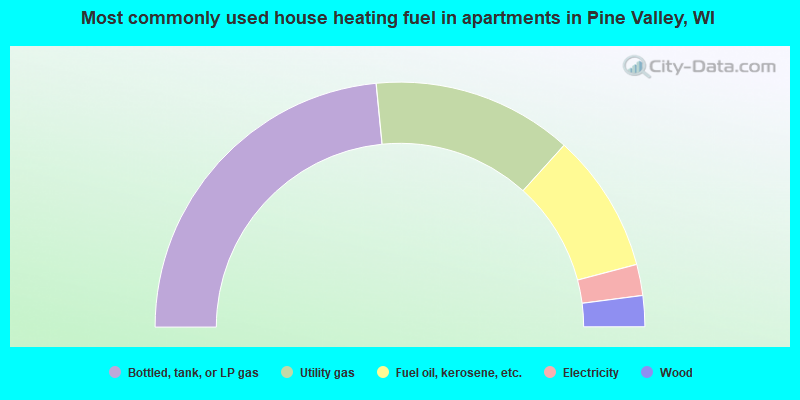
- 46.9%Bottled, tank, or LP gas
- 26.5%Utility gas
- 18.4%Fuel oil, kerosene, etc.
- 4.1%Electricity
- 4.1%Wood
Pine Valley compared to Wisconsin state average:
- Unemployed percentage below state average.
- Black race population percentage significantly below state average.
- Hispanic race population percentage significantly below state average.
- Foreign-born population percentage significantly below state average.
- Renting percentage significantly below state average.
- Length of stay since moving in significantly above state average.
- Number of rooms per house significantly below state average.
- House age significantly below state average.
- Percentage of population with a bachelor's degree or higher significantly below state average.