Panhandle, Texas
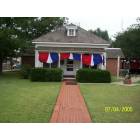
Panhandle: Square House Museum, Panhandle, Texas
Panhandle: Frontal View of Coronodo Hotel in California
- add
your
Submit your own pictures of this town and show them to the world
- OSM Map
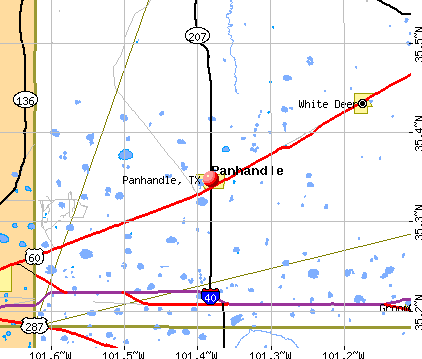
- General Map
- Google Map
- MSN Map
Population change since 2000: -8.8%
 |
| Males: 1,241 | |
| Females: 1,120 |
| Median resident age: | 43.8 years |
| Texas median age: | 35.6 years |
Zip codes: 79068.
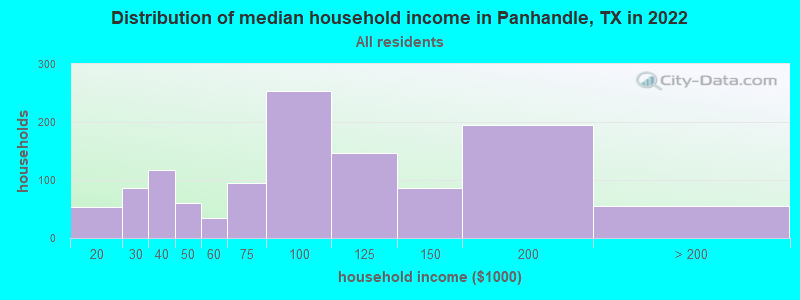
| Panhandle: | $83,005 |
| TX: | $72,284 |
Estimated per capita income in 2022: $41,269 (it was $21,640 in 2000)
Panhandle town income, earnings, and wages data
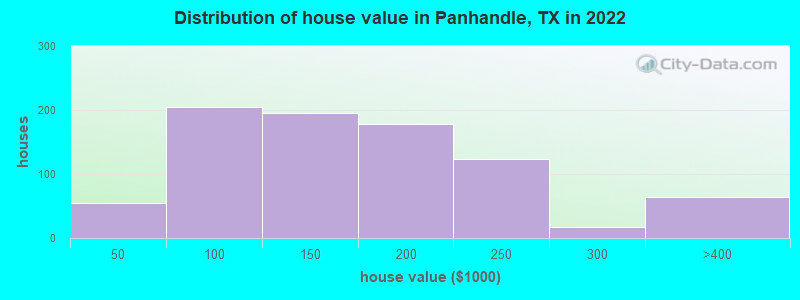
Estimated median house or condo value in 2022: $156,677 (it was $54,400 in 2000)
| Panhandle: | $156,677 |
| TX: | $275,400 |
Mean prices in 2022: all housing units: $162,539; detached houses: $166,271; mobile homes: $102,047
Median gross rent in 2022: $985.
(8.3% for White Non-Hispanic residents, 2.4% for Hispanic or Latino residents, 4.5% for two or more races residents)
Detailed information about poverty and poor residents in Panhandle, TX
Compare current foreclosures near your location:
| Photo | Address | Area | Beds / Baths | Price | Details |
|---|---|---|---|---|---|

|
#1
E 21st Ave
Columbus, OH 43211
|
1,061 sq. feet
|
1 baths 3 beds |
$179,900
|
show details |

|
#2
S High St
Columbus, OH 43207
|
1,678 sq. feet
|
2 baths 4 beds |
$31,900
|
show details |

|
#3
Bayberry Cir
Columbus, OH 43207
|
1,564 sq. feet
|
1 baths 3 beds |
$127,500
|
show details |

|
#4
Armada Rd
Columbus, OH 43232
|
1,028 sq. feet
|
1 baths 4 beds |
show details | |

|
#5
Grasmere Ave
Columbus, OH 43211
|
720 sq. feet
|
1 baths 2 beds |
show details | |

|
#6
Safford Ave
Columbus, OH 43223
|
784 sq. feet
|
1 baths 2 beds |
show details | |

|
#7
Scottwood Rd
Columbus, OH 43227
|
1,008 sq. feet
|
1 baths 3 beds |
show details | |

|
#8
Summertree Ln
Westerville, OH 43081
|
2,496 sq. feet
|
2 baths 3 beds |
show details | |

|
#9
Derrer Rd -872
Columbus, OH 43204
|
1,667 sq. feet
|
2 baths 5 beds |
show details | |

|
#10
Wrexham Ave
Columbus, OH 43223
|
1,235 sq. feet
|
1 baths 3 beds |
show details |
| Photo | Address | Area | Beds / Baths | Price | Details |
|---|---|---|---|---|---|

|
#11
Lehner Rd
Columbus, OH 43224
|
1,628 sq. feet
|
2 baths 4 beds |
show details | |

|
#12
Fahlander Dr N
Columbus, OH 43229
|
1,338 sq. feet
|
2 baths 3 beds |
show details | |

|
#13
High Free Pike
West Jefferson, OH 43162
|
1,216 sq. feet
|
2 baths 4 beds |
show details | |

|
#14
S Richardson Ave
Columbus, OH 43204
|
1,520 sq. feet
|
2 baths 3 beds |
show details | |

|
#15
Brookstone Dr
Westerville, OH 43082
|
1,783 sq. feet
|
3 baths 3 beds |
show details | |

|
#16
E Howard Rd
Columbus, OH 43207
|
1,056 sq. feet
|
1 baths 3 beds |
show details | |

|
#17
Midland Ave
Columbus, OH 43223
|
1,518 sq. feet
|
1 baths 2 beds |
show details | |

|
#18
Marshrun Dr
Grove City, OH 43123
|
2,036 sq. feet
|
2 baths 4 beds |
show details | |

|
#19
N Roys Ave
Columbus, OH 43204
|
1,248 sq. feet
|
2 baths 3 beds |
show details | |

|
#20
Meadowbrook Dr
Columbus, OH 43207
|
1,752 sq. feet
|
2 baths 4 beds |
show details |
| Photo | Address | Area | Beds / Baths | Price | Details |
|---|---|---|---|---|---|

|
#21
Stoneybrook Blvd # 21a
Hilliard, OH 43026
|
1,231 sq. feet
|
2 baths 3 beds |
show details | |

|
#22
Mink St SW
Pataskala, OH 43062
|
1,442 sq. feet
|
1 baths 3 beds |
show details | |

|
#23
London Groveport Rd
Grove City, OH 43123
|
816 sq. feet
|
1 baths 2 beds |
show details | |

|
#24
Glenmate Ct
Columbus, OH 43223
|
1,050 sq. feet
|
1 baths 3 beds |
show details | |

|
#25
Gladys Rd
Columbus, OH 43228
|
832 sq. feet
|
1 baths 3 beds |
show details | |

|
#26
Striebel Ct
Columbus, OH 43227
|
925 sq. feet
|
1 baths 3 beds |
show details | |

|
#27
N 18th St
Columbus, OH 43203
|
1,690 sq. feet
|
1 baths 4 beds |
show details | |

|
#28
Fergus Rd
Grove City, OH 43123
|
3,312 sq. feet
|
2 baths 4 beds |
show details | |

|
#29
Chester Rd
Columbus, OH 43221
|
3,300 sq. feet
|
4 baths 5 beds |
show details | |

|
#30
Sleeping Meadow Dr
New Albany, OH 43054
|
3,211 sq. feet
|
2 baths 4 beds |
show details |
| Photo | Address | Area | Beds / Baths | Price | Details |
|---|---|---|---|---|---|

|
#31
E Welch Ave
Columbus, OH 43207
|
1,864 sq. feet
|
2 baths 4 beds |
show details | |

|
#32
Kingsglen Dr
Grove City, OH 43123
|
1,635 sq. feet
|
2 baths 4 beds |
show details | |

|
#33
S Hague Ave
Columbus, OH 43204
|
979 sq. feet
|
1 baths 2 beds |
show details | |

|
#34
Ashgrove Dr
Grove City, OH 43123
|
1,772 sq. feet
|
2 baths 4 beds |
show details | |

|
#35
Chidley St
Galloway, OH 43119
|
1,502 sq. feet
|
1 baths 3 beds |
show details | |

|
#36
Hildreth Ave
Columbus, OH 43203
|
1,798 sq. feet
|
2 baths 4 beds |
show details | |

|
#37
Fairfield Ave
Columbus, OH 43203
|
984 sq. feet
|
1 baths 2 beds |
show details | |

|
#38
Ratify Blvd
Columbus, OH 43207
|
1,356 sq. feet
|
2 baths 3 beds |
show details | |

|
#39
Andrus Ave
Columbus, OH 43227
|
1,264 sq. feet
|
1 baths 3 beds |
show details | |

|
#40
Berrywood Dr
Columbus, OH 43220
|
1,182 sq. feet
|
1 baths 2 beds |
show details |
| Photo | Address | Area | Beds / Baths | Price | Details |
|---|---|---|---|---|---|

|
#41
Simpson Dr
Columbus, OH 43227
|
1,104 sq. feet
|
1 baths 3 beds |
show details | |

|
#42
Nantucket Ave
Columbus, OH 43235
|
1,864 sq. feet
|
2 baths 3 beds |
show details | |

|
#43
Bostwick Rd
Columbus, OH 43227
|
1,284 sq. feet
|
1 baths 4 beds |
show details | |

|
#44
Messner Dr
Hilliard, OH 43026
|
832 sq. feet
|
1 baths 2 beds |
show details | |

|
#45
Camhurst Ct
Galloway, OH 43119
|
1,969 sq. feet
|
2 baths 3 beds |
show details | |

|
#46
Illinois Ave
Westerville, OH 43081
|
1,120 sq. feet
|
1 baths 3 beds |
show details | |

|
#47
Renford Ct
Powell, OH 43065
|
1,795 sq. feet
|
1 baths 3 beds |
show details | |

|
#48
Casa Blvd
Grove City, OH 43123
|
1,002 sq. feet
|
1 baths 2 beds |
show details | |

|
#49
Mango Ln
Hilliard, OH 43026
|
1,024 sq. feet
|
1 baths 2 beds |
show details | |

|
Check over 1 million property listings on Foreclosure.com!
|
browse all offers | |||


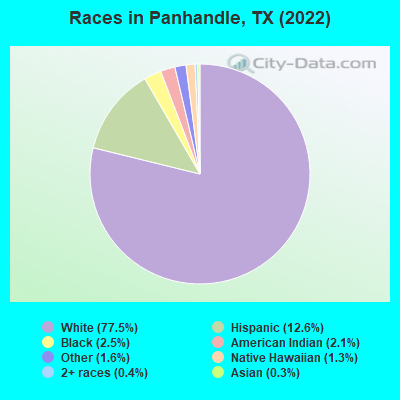
- 2,18177.5%White alone
- 35412.6%Hispanic
- 692.5%Black alone
- 592.1%American Indian alone
- 461.6%Other race alone
- 361.3%Native Hawaiian and Other
Pacific Islander alone - 120.4%Two or more races
- 80.3%Asian alone
Races in Panhandle detailed stats: ancestries, foreign born residents, place of birth
According to our research of Texas and other state lists, there were 12 registered sex offenders living in Panhandle, Texas as of May 09, 2024.
The ratio of all residents to sex offenders in Panhandle is 216 to 1.
Type |
2009 |
2010 |
2011 |
2012 |
2013 |
2014 |
2015 |
2016 |
2017 |
2018 |
2019 |
2020 |
2021 |
2022 |
|---|---|---|---|---|---|---|---|---|---|---|---|---|---|---|
| Murders (per 100,000) | 0 (0.0) | 0 (0.0) | 0 (0.0) | 0 (0.0) | 0 (0.0) | 0 (0.0) | 0 (0.0) | 0 (0.0) | 0 (0.0) | 1 (42.8) | 0 (0.0) | 0 (0.0) | 0 (0.0) | 0 (0.0) |
| Rapes (per 100,000) | 0 (0.0) | 0 (0.0) | 0 (0.0) | 1 (39.7) | 0 (0.0) | 0 (0.0) | 0 (0.0) | 0 (0.0) | 1 (42.4) | 0 (0.0) | 0 (0.0) | 0 (0.0) | 0 (0.0) | 0 (0.0) |
| Robberies (per 100,000) | 0 (0.0) | 0 (0.0) | 0 (0.0) | 0 (0.0) | 0 (0.0) | 0 (0.0) | 0 (0.0) | 0 (0.0) | 0 (0.0) | 0 (0.0) | 0 (0.0) | 0 (0.0) | 0 (0.0) | 0 (0.0) |
| Assaults (per 100,000) | 3 (121.3) | 5 (203.9) | 3 (119.8) | 0 (0.0) | 5 (205.1) | 0 (0.0) | 3 (128.5) | 10 (430.8) | 9 (381.7) | 10 (427.9) | 7 (301.5) | 2 (87.0) | 0 (0.0) | 0 (0.0) |
| Burglaries (per 100,000) | 4 (161.7) | 5 (203.9) | 7 (279.6) | 5 (198.4) | 3 (123.1) | 7 (300.2) | 4 (171.3) | 4 (172.3) | 2 (84.8) | 7 (299.5) | 12 (516.8) | 4 (174.1) | 0 (0.0) | 0 (0.0) |
| Thefts (per 100,000) | 20 (808.4) | 20 (815.7) | 9 (359.4) | 1 (39.7) | 3 (123.1) | 10 (428.8) | 7 (299.8) | 9 (387.8) | 8 (339.3) | 6 (256.7) | 8 (344.5) | 7 (304.6) | 3 (133.0) | 1 (43.3) |
| Auto thefts (per 100,000) | 1 (40.4) | 3 (122.3) | 1 (39.9) | 4 (158.7) | 1 (41.0) | 3 (128.6) | 2 (85.7) | 0 (0.0) | 1 (42.4) | 2 (85.6) | 5 (215.3) | 3 (130.5) | 4 (177.3) | 0 (0.0) |
| Arson (per 100,000) | 0 (0.0) | 0 (0.0) | 0 (0.0) | 0 (0.0) | 0 (0.0) | 0 (0.0) | 0 (0.0) | 0 (0.0) | 0 (0.0) | 0 (0.0) | 0 (0.0) | 0 (0.0) | 0 (0.0) | 0 (0.0) |
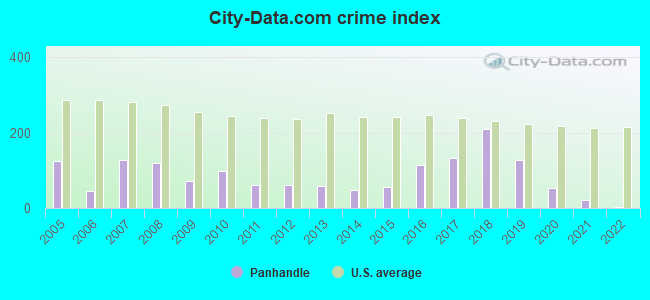
| City-Data.com crime index | 71.1 | 97.5 | 61.1 | 59.9 | 57.8 | 48.5 | 56.5 | 113.7 | 133.2 | 209.2 | 127.5 | 52.2 | 19.5 | 1.7 |
The City-Data.com crime index weighs serious crimes and violent crimes more heavily. Higher means more crime, U.S. average is 246.1. It adjusts for the number of visitors and daily workers commuting into cities.
Crime rate in Panhandle detailed stats: murders, rapes, robberies, assaults, burglaries, thefts, arson
Full-time law enforcement employees in 2021, including police officers: 4 (4 officers - 4 male; 0 female).
| Officers per 1,000 residents here: | 1.77 |
| Texas average: | 2.07 |
 Recent articles from our blog. Our writers, many of them Ph.D. graduates or candidates, create easy-to-read articles on a wide variety of topics.

 | Who likes Panhandle weather? (18 replies) |
| Texas; is it part of the South or the Southwest? (391 replies) |
| Challenging the notion that South Texas isn't Southern (145 replies) |
| The Midlands of the "American Nations" in the Texas Panhandle (3 replies) |
| What are Texans' stance on Kansas? (55 replies) |
| Is Amarillo right for me? (29 replies) |
Latest news from Panhandle, TX collected exclusively by city-data.com from local newspapers, TV, and radio stations
Ancestries: German (23.6%), Irish (8.6%), English (8.1%), American (3.6%), Scotch-Irish (2.2%), Polish (1.9%).
Current Local Time: CST time zone
Elevation: 3456 feet
Land area: 2.13 square miles.
Population density: 1,109 people per square mile (low).
103 residents are foreign born (2.6% Latin America, 0.7% Asia).
| This town: | 3.7% |
| Texas: | 17.1% |
Median real estate property taxes paid for housing units with mortgages in 2022: $2,745 (1.4%)
Median real estate property taxes paid for housing units with no mortgage in 2022: $1,768 (1.4%)
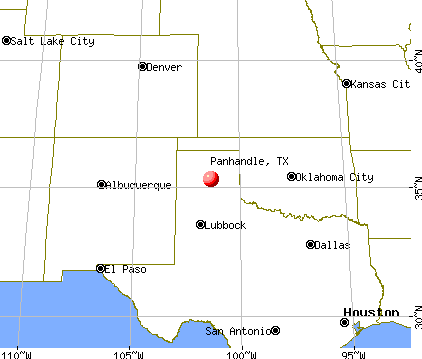
Nearest city with pop. 50,000+: Amarillo, TX  (28.1 miles , pop. 173,627).
Nearest city with pop. 200,000+: Oklahoma City, OK (217.0 miles , pop. 506,132).
Nearest city with pop. 1,000,000+: Dallas, TX (316.7 miles , pop. 1,188,580).
Nearest cities:
), ), ), ), Latitude: 35.35 N, Longitude: 101.38 W
Area code: 806

Panhandle, Texas accommodation & food services, arts - Economy and Business Data
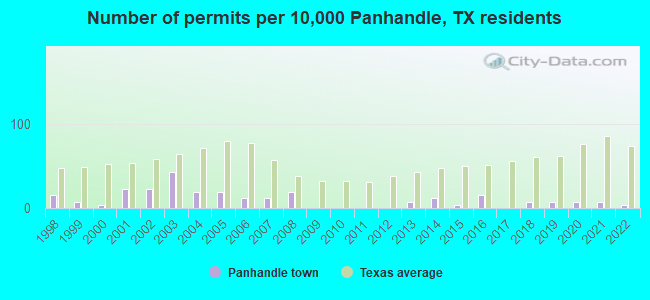
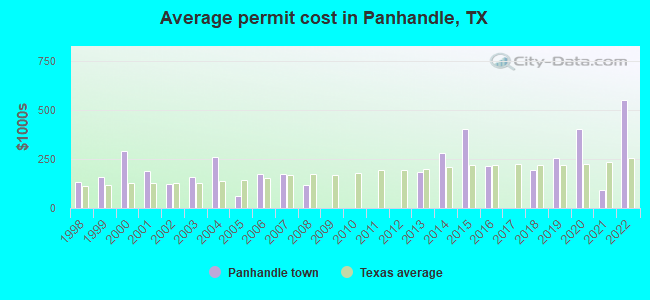
Single-family new house construction building permits:
- 2022: 1 building, cost: $550,000
- 2021: 2 buildings, average cost: $92,000
- 2020: 2 buildings, average cost: $400,000
- 2019: 2 buildings, average cost: $253,000
- 2018: 2 buildings, average cost: $191,500
- 2016: 4 buildings, average cost: $213,600
- 2015: 1 building, cost: $401,000
- 2014: 3 buildings, average cost: $277,700
- 2013: 2 buildings, average cost: $181,000
- 2008: 5 buildings, average cost: $117,700
- 2007: 3 buildings, average cost: $171,200
- 2006: 3 buildings, average cost: $171,200
- 2005: 5 buildings, average cost: $59,500
- 2004: 5 buildings, average cost: $259,800
- 2003: 11 buildings, average cost: $158,700
- 2002: 6 buildings, average cost: $122,500
- 2001: 6 buildings, average cost: $186,800
- 2000: 1 building, cost: $291,000
- 1999: 2 buildings, average cost: $156,000
- 1998: 4 buildings, average cost: $130,000
| Here: | 2.5% |
| Texas: | 3.5% |
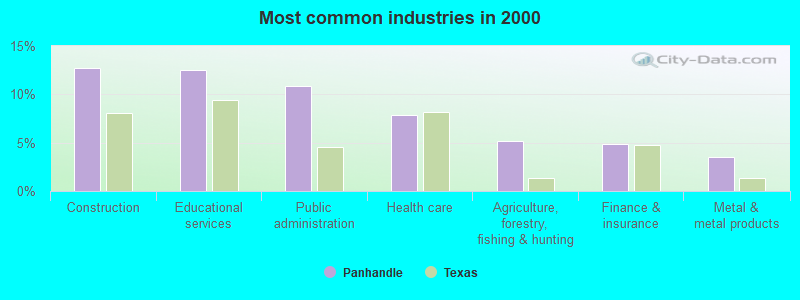
- Construction (12.7%)
- Educational services (12.5%)
- Public administration (10.9%)
- Health care (7.8%)
- Agriculture, forestry, fishing & hunting (5.2%)
- Finance & insurance (4.9%)
- Metal & metal products (3.5%)
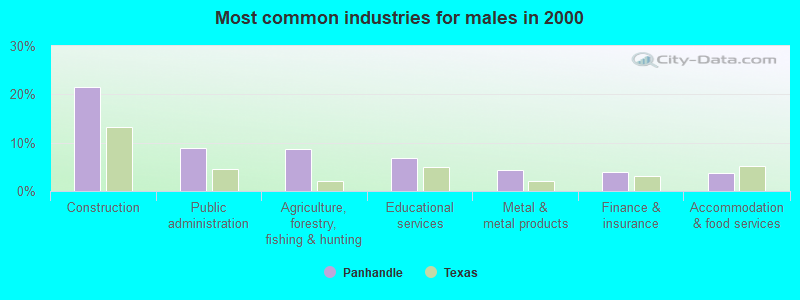
- Construction (21.5%)
- Public administration (8.9%)
- Agriculture, forestry, fishing & hunting (8.7%)
- Educational services (6.9%)
- Metal & metal products (4.4%)
- Finance & insurance (4.0%)
- Accommodation & food services (3.7%)
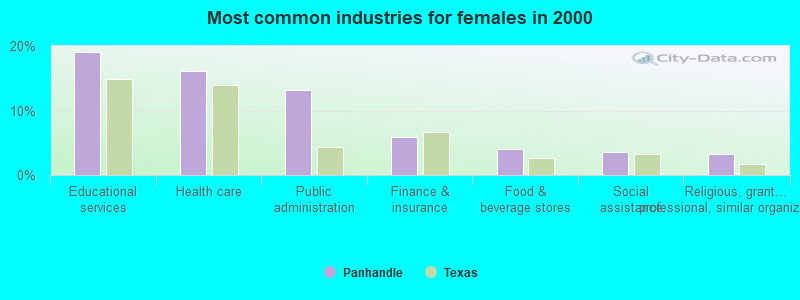
- Educational services (19.0%)
- Health care (16.1%)
- Public administration (13.2%)
- Finance & insurance (5.8%)
- Food & beverage stores (4.1%)
- Social assistance (3.5%)
- Religious, grantmaking, civic, professional, similar organizations (3.3%)
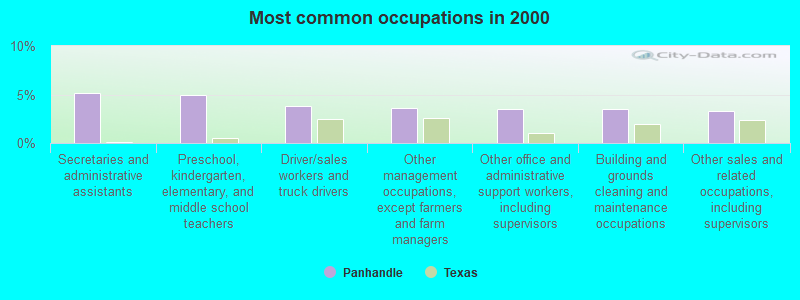
- Secretaries and administrative assistants (5.1%)
- Preschool, kindergarten, elementary, and middle school teachers (5.0%)
- Driver/sales workers and truck drivers (3.8%)
- Other management occupations, except farmers and farm managers (3.6%)
- Other office and administrative support workers, including supervisors (3.5%)
- Building and grounds cleaning and maintenance occupations (3.5%)
- Other sales and related occupations, including supervisors (3.3%)
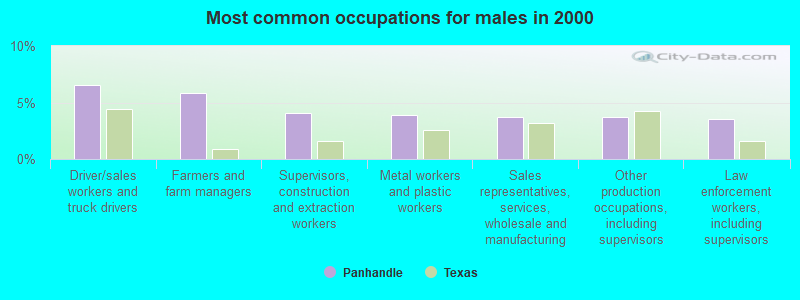
- Driver/sales workers and truck drivers (6.5%)
- Farmers and farm managers (5.9%)
- Supervisors, construction and extraction workers (4.0%)
- Metal workers and plastic workers (3.9%)
- Sales representatives, services, wholesale and manufacturing (3.7%)
- Other production occupations, including supervisors (3.7%)
- Law enforcement workers, including supervisors (3.5%)
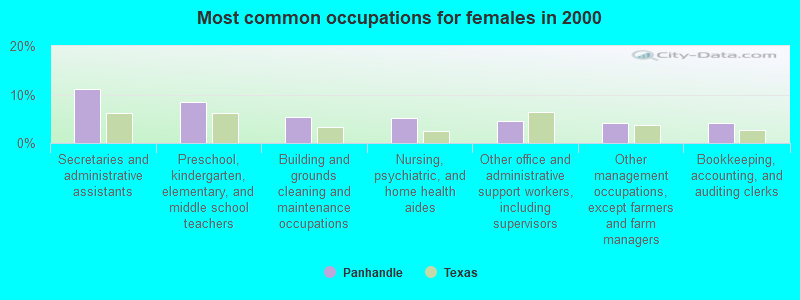
- Secretaries and administrative assistants (11.1%)
- Preschool, kindergarten, elementary, and middle school teachers (8.5%)
- Building and grounds cleaning and maintenance occupations (5.4%)
- Nursing, psychiatric, and home health aides (5.2%)
- Other office and administrative support workers, including supervisors (4.5%)
- Other management occupations, except farmers and farm managers (4.1%)
- Bookkeeping, accounting, and auditing clerks (4.1%)
Average climate in Panhandle, Texas
Based on data reported by over 4,000 weather stations


|
|

(lower is better)
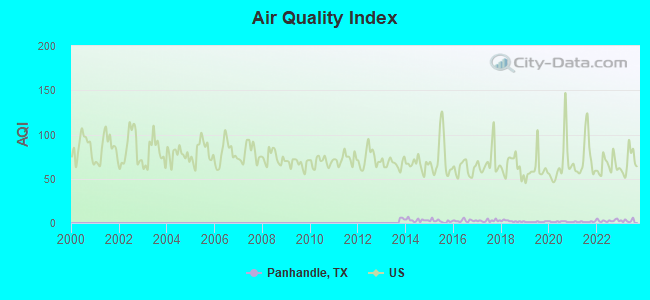
Air Quality Index (AQI) level in 2023 was 2.74. This is significantly better than average.
| City: | 2.74 |
| U.S.: | 72.56 |
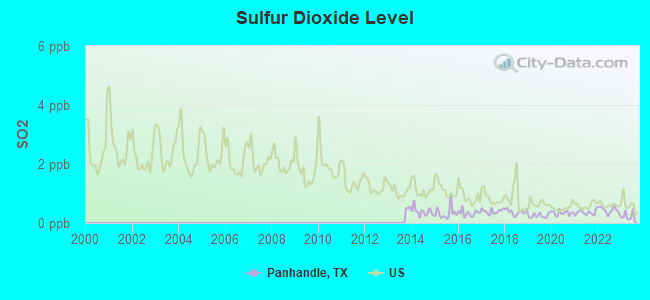
Sulfur Dioxide (SO2) [ppb] level in 2023 was 0.249. This is significantly better than average. Closest monitor was 20.8 miles away from the city center.
| City: | 0.249 |
| U.S.: | 1.515 |
Tornado activity:
Panhandle-area historical tornado activity is slightly above Texas state average. It is 81% greater than the overall U.S. average.
On 6/27/1992, a category F4 (max. wind speeds 207-260 mph) tornado 13.8 miles away from the Panhandle town center injured 7 people and caused between $5,000,000 and $50,000,000 in damages.
On 6/8/1995, a category F4 tornado 23.0 miles away from the town center injured 7 people and caused between $5,000,000 and $50,000,000 in damages.
Earthquake activity:
Panhandle-area historical earthquake activity is significantly above Texas state average. It is 570% greater than the overall U.S. average.On 9/3/2016 at 12:02:44, a magnitude 5.8 (5.8 MW, Depth: 3.5 mi, Class: Moderate, Intensity: VI - VII) earthquake occurred 260.4 miles away from Panhandle center
On 6/16/1978 at 11:46:54, a magnitude 5.3 (4.4 MB, 4.6 UK, 5.3 ML) earthquake occurred 164.1 miles away from Panhandle center
On 11/6/2011 at 03:53:10, a magnitude 5.7 (5.7 MW, Depth: 3.2 mi) earthquake occurred 260.5 miles away from the city center
On 2/13/2016 at 17:07:06, a magnitude 5.1 (5.1 MW, Depth: 5.2 mi) earthquake occurred 169.3 miles away from Panhandle center
On 8/23/2011 at 05:46:18, a magnitude 5.3 (5.3 MW, Depth: 2.5 mi) earthquake occurred 220.0 miles away from the city center
On 2/15/1974 at 13:33:49, a magnitude 4.6 (4.5 MB, 4.6 LG, Class: Light, Intensity: IV - V) earthquake occurred 88.6 miles away from Panhandle center
Magnitude types: regional Lg-wave magnitude (LG), body-wave magnitude (MB), local magnitude (ML), moment magnitude (MW)
Natural disasters:
The number of natural disasters in Carson County (8) is smaller than the US average (15).Major Disasters (Presidential) Declared: 3
Emergencies Declared: 4
Causes of natural disasters: Hurricanes: 3, Fires: 2, Storm: 1, Tornado: 1, Winter Storm: 1, Other: 1 (Note: some incidents may be assigned to more than one category).

Hospitals and medical centers in Panhandle:
Airports located in Panhandle:
- Panhandle-Carson County Airport (T45) (Runways: 1, Itinerant Ops: 100, Local Ops: 3,200)
- Stamps Field Airport (3TE5) (Runways: 1)
Colleges/universities with over 2000 students nearest to Panhandle:
- Amarillo College (about 29 miles; Amarillo, TX; Full-time enrollment: 6,622)
- West Texas A & M University (about 40 miles; Canyon, TX; FT enrollment: 6,820)
- Wayland Baptist University (about 83 miles; Plainview, TX; FT enrollment: 5,526)
- Texas Tech University Health Sciences Center (about 125 miles; Lubbock, TX; FT enrollment: 3,269)
- Western Oklahoma State College (about 126 miles; Altus, OK; FT enrollment: 2,054)
- Texas Tech University (about 126 miles; Lubbock, TX; FT enrollment: 29,251)
- South Plains College (about 135 miles; Levelland, TX; FT enrollment: 7,007)
Public high school in Panhandle:
- PANHANDLE H S (Students: 166, Location: 106 W 11TH ST, Grades: 9-12)
Public elementary/middle schools in Panhandle:
- PANHANDLE EL (Students: 331, Location: 106 W 9TH ST, Grades: PK-5)
- PANHANDLE J H (Students: 199, Location: 1001 ELSIE AVE, Grades: 6-8)
Points of interest:
Notable locations in Panhandle: Panhandle Fire Department (A), Carson County Square House Museum (B), Panhandle Volunteer Emergency Medical Services (C). Display/hide their locations on the map
Parks in Panhandle include: Panther Stadium (1), Rotary Park (2). Display/hide their locations on the map
Drinking water stations with addresses in Panhandle and their reported violations in the past:
CONWAY RESTAURANT & MOTEL (Population served: 40, Groundwater):Past monitoring violations:
- 2 routine major monitoring violations
- One regular monitoring violation
Drinking water stations with addresses in Panhandle that have no violations reported:
- CONWAY INN & RESTAURANT (Population served: 45, Primary Water Source Type: Groundwater)
| This town: | 2.6 people |
| Texas: | 2.8 people |
| This town: | 74.4% |
| Whole state: | 69.9% |
| This town: | 3.6% |
| Whole state: | 6.0% |
Likely homosexual households (counted as self-reported same-sex unmarried-partner households)
- Lesbian couples: 0.0% of all households
- Gay men: 0.3% of all households
People in group quarters in Panhandle in 2010:
- 47 people in nursing facilities/skilled-nursing facilities
- 18 people in other noninstitutional facilities
- 6 people in local jails and other municipal confinement facilities
People in group quarters in Panhandle in 2000:
- 52 people in nursing homes
- 20 people in religious group quarters
- 18 people in local jails and other confinement facilities (including police lockups)
- 9 people in other noninstitutional group quarters
Banks with branches in Panhandle (2011 data):
- InterBank: Borger Branch at 400 N Main, branch established on 1997/12/04. Info updated 2011/08/30: Bank assets: $1,842.7 mil, Deposits: $1,589.2 mil, headquarters in Oklahoma City, OK, positive income, Agricultural Specialization, 33 total offices, Holding Company: Olney Bancshares Of Texas, Inc.
- Happy State Bank: Third And Euclid Branch at Third And Euclid Streets, branch established on 1927/05/06. Info updated 2011/07/12: Bank assets: $1,840.0 mil, Deposits: $1,625.4 mil, headquarters in Happy, TX, positive income, Agricultural Specialization, 29 total offices, Holding Company: Happy Bancshares, Inc.
For population 15 years and over in Panhandle:
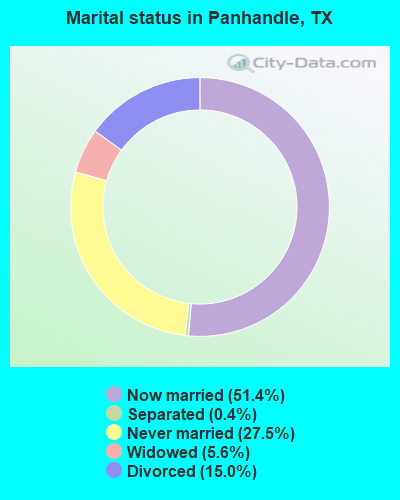
- Never married: 27.5%
- Now married: 51.4%
- Separated: 0.4%
- Widowed: 5.6%
- Divorced: 15.0%
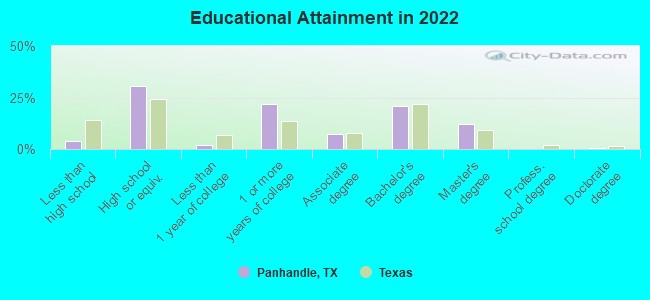
For population 25 years and over in Panhandle:
- High school or higher: 95.1%
- Bachelor's degree or higher: 32.1%
- Graduate or professional degree: 12.1%
- Unemployed: 2.4%
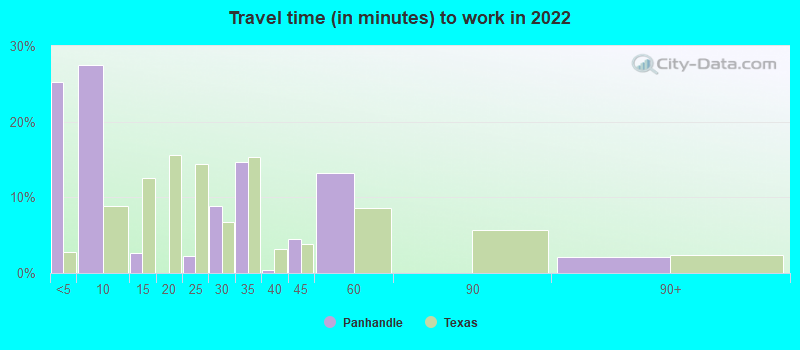
- Mean travel time to work (commute): 14.8 minutes
| Here: | 9.2 |
| Texas average: | 14.0 |
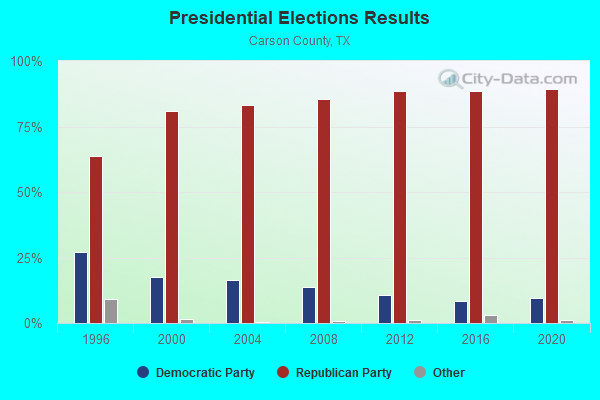
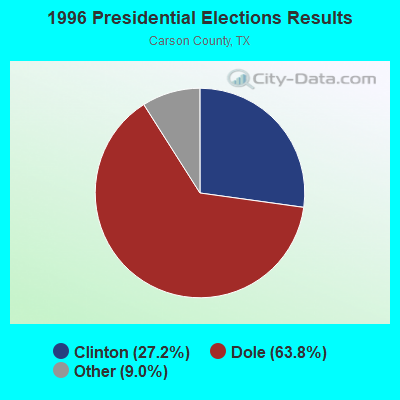
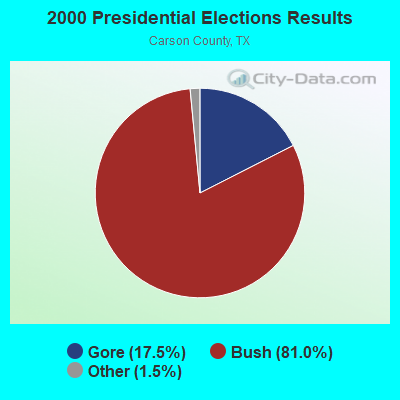
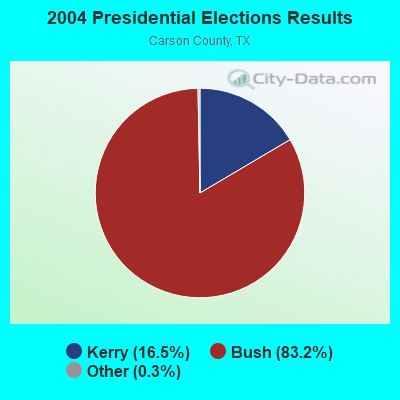
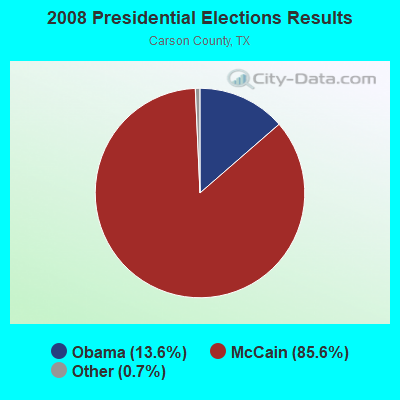
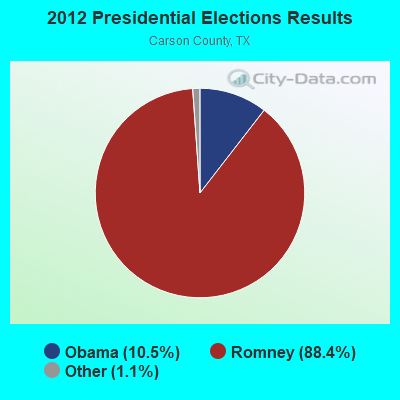
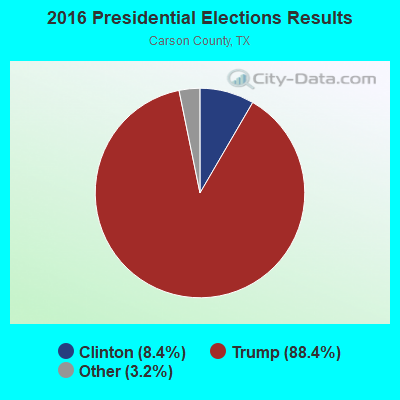
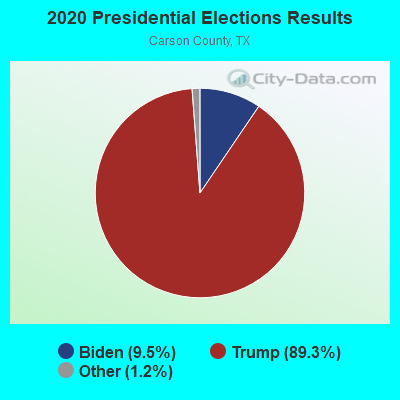
Graphs represent county-level data. Detailed 2008 Election Results
Religion statistics for Panhandle, TX (based on Carson County data)
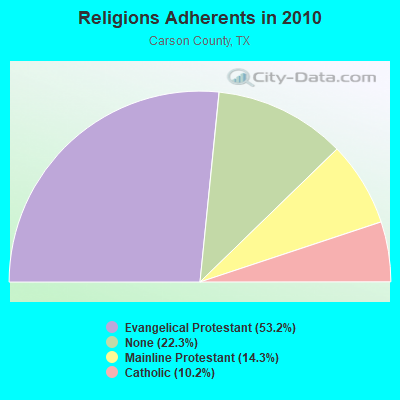
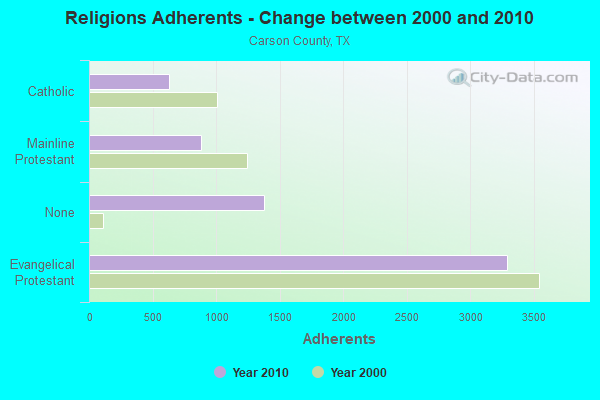
| Religion | Adherents | Congregations |
|---|---|---|
| Evangelical Protestant | 3,289 | 13 |
| Mainline Protestant | 882 | 3 |
| Catholic | 628 | 3 |
| Other | 2 | - |
| None | 1,381 | - |
Food Environment Statistics:
| Here: | 3.17 / 10,000 pop. |
| Texas: | 1.47 / 10,000 pop. |
| This county: | 1.58 / 10,000 pop. |
| Texas: | 1.11 / 10,000 pop. |
| This county: | 6.33 / 10,000 pop. |
| Texas: | 3.95 / 10,000 pop. |
| Here: | 9.50 / 10,000 pop. |
| State: | 6.13 / 10,000 pop. |
| This county: | 10.5% |
| State: | 8.9% |
| Here: | 27.2% |
| State: | 26.6% |
Health and Nutrition:
| Panhandle: | 51.1% |
| Texas: | 48.6% |
| Here: | 48.3% |
| State: | 47.4% |
| Panhandle: | 28.8 |
| Texas: | 28.5 |
| Here: | 21.9% |
| State: | 20.6% |
| This city: | 10.8% |
| State: | 10.3% |
| Panhandle: | 6.9 |
| Texas: | 6.8 |
| This city: | 35.2% |
| Texas: | 33.1% |
| This city: | 56.7% |
| Texas: | 56.2% |
| This city: | 77.0% |
| Texas: | 80.7% |
More about Health and Nutrition of Panhandle, TX Residents
| Local government employment and payroll (March 2022) | |||||
| Function | Full-time employees | Monthly full-time payroll | Average yearly full-time wage | Part-time employees | Monthly part-time payroll |
|---|---|---|---|---|---|
| Other Government Administration | 6 | $33,473 | $66,946 | 0 | $0 |
| Police Protection - Officers | 5 | $23,475 | $56,340 | 0 | $0 |
| Parks and Recreation | 5 | $12,022 | $28,853 | 0 | $0 |
| Solid Waste Management | 1 | $5,309 | $63,708 | 0 | $0 |
| Health | 1 | $4,687 | $56,244 | 0 | $0 |
| Other and Unallocable | 0 | $0 | 8 | $31,574 | |
| Totals for Government | 18 | $78,966 | $52,644 | 8 | $31,574 |
Panhandle government finances - Expenditure in 2017 (per resident):
- Construction - Regular Highways: $62,000 ($26.26)
- Current Operations - Central Staff Services: $430,000 ($182.13)
Police Protection: $215,000 ($91.06)
General - Other: $138,000 ($58.45)
Health - Other: $50,000 ($21.18)
Judicial and Legal Services: $47,000 ($19.91)
Local Fire Protection: $10,000 ($4.24)
- General - Interest on Debt: $74,000 ($31.34)
- Other Capital Outlay - Air Transportation: $6,000 ($2.54)
Parks and Recreation: $5,000 ($2.12)
- Total Salaries and Wages: $702,000 ($297.33)
Panhandle government finances - Revenue in 2017 (per resident):
- Charges - Solid Waste Management: $328,000 ($138.92)
Sewerage: $320,000 ($135.54)
Parks and Recreation: $14,000 ($5.93)
- Miscellaneous - General Revenue - Other: $74,000 ($31.34)
Fines and Forfeits: $12,000 ($5.08)
- Revenue - Water Utilities: $601,000 ($254.55)
- State Intergovernmental - General Local Government Support: $146,000 ($61.84)
Health and Hospitals: $122,000 ($51.67)
- Tax - Property: $470,000 ($199.07)
General Sales and Gross Receipts: $166,000 ($70.31)
Public Utilities Sales: $147,000 ($62.26)
Other License: $14,000 ($5.93)
Panhandle government finances - Debt in 2017 (per resident):
- Long Term Debt - Beginning Outstanding - Unspecified Public Purpose: $1,846,000 ($781.87)
Outstanding Unspecified Public Purpose: $1,846,000 ($781.87)
Panhandle government finances - Cash and Securities in 2017 (per resident):
- Other Funds - Cash and Securities: $400,000 ($169.42)
| Businesses in Panhandle, TX | ||||
| Name | Count | Name | Count | |
|---|---|---|---|---|
| Dairy Queen | 1 | Subway | 1 | |
| FedEx | 1 | UPS | 1 | |
Strongest AM radio stations in Panhandle:
- KGNC (710 AM; 10 kW; AMARILLO, TX; Owner: MCC RADIO, LLC)
- KTNZ (1010 AM; 5 kW; AMARILLO, TX; Owner: AMIGO RADIO, LTD.)
- KIXZ (940 AM; 5 kW; AMARILLO, TX; Owner: CAPSTAR TX LIMITED PARTNERSHIP)
- KGYN (1210 AM; 50 kW; GUYMON, OK; Owner: TELNS BROADCASTING COMPANY, INC.)
- KPUR (1440 AM; 5 kW; AMARILLO, TX; Owner: CUMULUS LICENSING CORP.)
- KICA (980 AM; 50 kW; CLOVIS, NM; Owner: BROADCAST ENTERTAINMENT CORPORATION)
- KMUL (1380 AM; 50 kW; MULESHOE, TX; Owner: BROADCAST ENTERTAINMENT CORPORATION)
- KQTY (1490 AM; 1 kW; BORGER, TX; Owner: ZIA BROADCASTING COMPANY)
- KINF (1020 AM; 50 kW; ROSWELL, NM; Owner: JAMES CRYSTAL HOLDINGS OF NEW MEXICO, INC.)
- KGRO (1230 AM; 1 kW; PAMPA, TX; Owner: PAMPA BROADCASTERS, INC.)
- KKOB (770 AM; 50 kW; ALBUQUERQUE, NM; Owner: CITADEL BROADCASTING COMPANY)
- KRMG (740 AM; 50 kW; TULSA, OK; Owner: CXR HOLDINGS, INC.)
- KIJN (1060 AM; daytime; 10 kW; FARWELL, TX; Owner: METROPOLITIAN RADIO GROUP, INC.)
Strongest FM radio stations in Panhandle:
- KQFX (104.3 FM; BORGER, TX; Owner: AMIGO RADIO, LTD.)
- KZRK-FM (107.9 FM; CANYON, TX; Owner: CUMULUS LICENSING CORP.)
- KMXJ-FM (94.1 FM; AMARILLO, TX; Owner: CAPSTAR TX LIMITED PARTNERSHIP)
- KXGL (100.9 FM; AMARILLO, TX; Owner: FEUER/MCCORD COMMUNICATIONS, INC.)
- KGNC-FM (97.9 FM; AMARILLO, TX; Owner: MCC RADIO, LLC)
- KACV-FM (89.9 FM; AMARILLO, TX; Owner: AMARILLO JUNIOR COLLEGE DISTRICT)
- KATP (101.9 FM; AMARILLO, TX; Owner: AMFM RADIO LICENSES, L.L.C.)
- KARX (95.7 FM; CLAUDE, TX; Owner: CUMULUS LICENSING CORP)
- KQIZ-FM (93.1 FM; AMARILLO, TX; Owner: CUMULUS LICENSING CORP.)
- KMML-FM (96.9 FM; AMARILLO, TX; Owner: CAPSTAR TX LIMITED PARTNERSHIP)
- KAEZ (105.7 FM; AMARILLO, TX; Owner: KXOJ, INC.)
- KXRI (91.9 FM; AMARILLO, TX; Owner: EDUCATIONAL MEDIA FOUNDATION)
- KAVO (91.5 FM; BORGER, TX; Owner: AMERICAN FAMILY ASSOCIATION)
- KAXH (90.9 FM; PAMPA, TX; Owner: AMERICAN FAMILY ASSOCIATION)
TV broadcast stations around Panhandle:
- KACV-TV (Channel 2; AMARILLO, TX; Owner: AMARILLO JUNIOR COLLEGE DISTRICT)
- KVII-TV (Channel 7; AMARILLO, TX; Owner: NVG-AMARILLO, LLC)
- KCIT (Channel 14; AMARILLO, TX; Owner: MISSION BROADCASTING OF AMARILLO LICENSE, INC.)
- KFDA-TV (Channel 10; AMARILLO, TX; Owner: PANHANDLE TELECASTING CO.)
- KAMR-TV (Channel 4; AMARILLO, TX; Owner: QUORUM OF AMARILLO LICENSE, LLC)
- KTMO-LP (Channel 36; AMARILLO, TX; Owner: ADELANTE TELEVISION LIMITED PARTNERSHIP)
- KCPN-LP (Channel 33; AMARILLO, TX; Owner: MISSION BROADCASTING OF AMARILLO LICENSE, INC.)
- KEAT-LP (Channel 22; AMARILLO, TX; Owner: KUVN LICENSE PARTNERSHIP, L.P.)
- K25GI (Channel 25; AMARILLO, TX; Owner: NATIONAL MINORITY T.V., INC.)
- KTXD-LP (Channel 43; AMARILLO, TX; Owner: TIGER EYE BROADCASTING CORPORATION)
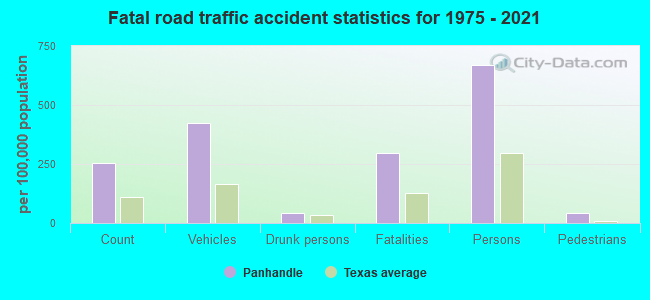
Panhandle fatal accident list:
Oct 31, 2003 05:00 PM, Chester, Vehicles: 2, Persons: 4, Fatalities: 1
Aug 29, 1996 08:05 AM, Fm293, Vehicles: 1, Persons: 1, Fatalities: 1
May 1, 1987 01:10 PM, 60w, Vehicles: 2, Persons: 3, Fatalities: 1
Aug 8, 1984 08:06 PM, 60, Vehicles: 2, Persons: 3, Fatalities: 1, Drunk persons involved: 1
Oct 4, 1981 09:07 AM, Vehicles: 2, Persons: 3, Fatalities: 2
FCC Registered Antenna Towers: 159 (See the full list of FCC Registered Antenna Towers)
FCC Registered Private Land Mobile Towers: 1 (See the full list of FCC Registered Private Land Mobile Towers in Panhandle, TX)
FCC Registered Broadcast Land Mobile Towers: 15 (See the full list of FCC Registered Broadcast Land Mobile Towers)
FCC Registered Microwave Towers: 25 (See the full list of FCC Registered Microwave Towers in this town)
FCC Registered Amateur Radio Licenses: 12 (See the full list of FCC Registered Amateur Radio Licenses in Panhandle)
FAA Registered Aircraft: 15 (See the full list of FAA Registered Aircraft in Panhandle)
2004 - 2018 National Fire Incident Reporting System (NFIRS) incidents
- Fire incident types reported to NFIRS in Panhandle, TX
- 36668.0%Outside Fires
- 7113.2%Mobile Property/Vehicle Fires
- 519.5%Other
- 509.3%Structure Fires
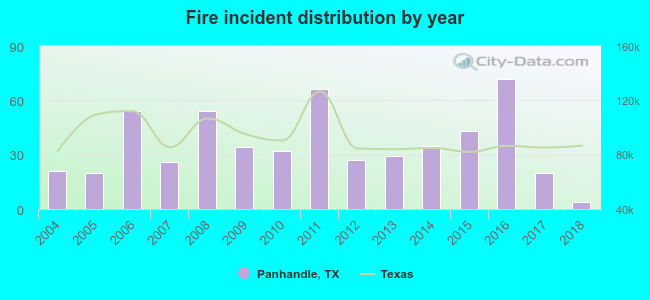 According to the data from the years 2004 - 2018 the average number of fire incidents per year is 36. The highest number of reported fires - 72 took place in 2016, and the least - 4 in 2018. The data has a declining trend.
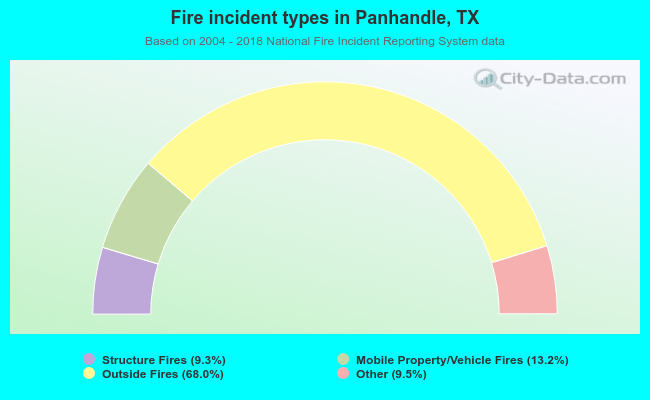 When looking into fire subcategories, the most reports belonged to: Outside Fires (68.0%), and Mobile Property/Vehicle Fires (13.2%).
| Most common first names in Panhandle, TX among deceased individuals | ||
| Name | Count | Lived (average) |
|---|---|---|
| James | 26 | 71.8 years |
| John | 24 | 77.3 years |
| William | 22 | 77.1 years |
| Mary | 20 | 81.2 years |
| George | 14 | 71.8 years |
| Robert | 12 | 68.2 years |
| Thomas | 10 | 79.7 years |
| Helen | 9 | 76.7 years |
| Ruby | 9 | 83.3 years |
| Joseph | 9 | 81.6 years |
| Most common last names in Panhandle, TX among deceased individuals | ||
| Last name | Count | Lived (average) |
|---|---|---|
| Smith | 14 | 77.1 years |
| Williams | 13 | 81.1 years |
| Bender | 11 | 77.8 years |
| Miller | 10 | 73.3 years |
| Meaker | 9 | 80.0 years |
| Cummings | 8 | 88.5 years |
| Brown | 8 | 80.1 years |
| Anderson | 6 | 71.4 years |
| Baker | 5 | 80.6 years |
| Johnson | 5 | 83.8 years |
Panhandle compared to Texas state average:
- Median house value below state average.
- Unemployed percentage significantly below state average.
- Black race population percentage significantly below state average.
- Hispanic race population percentage significantly below state average.
- Median age significantly above state average.
- Foreign-born population percentage significantly below state average.
- Renting percentage significantly below state average.
- Length of stay since moving in significantly above state average.
- House age significantly above state average.
- Number of college students significantly below state average.
Panhandle on our top lists:
- #85 on the list of "Top 101 cities with the largest percentage of people in religious group quarters (population 1,000+)"
- #95 on the list of "Top 101 cities with the most residents born in Chile (population 500+)"
- #32 on the list of "Top 101 counties with highest percentage of residents voting for Romney (Republican) in the 2012 Presidential Election"

|
Total of 5 patent applications in 2008-2024.