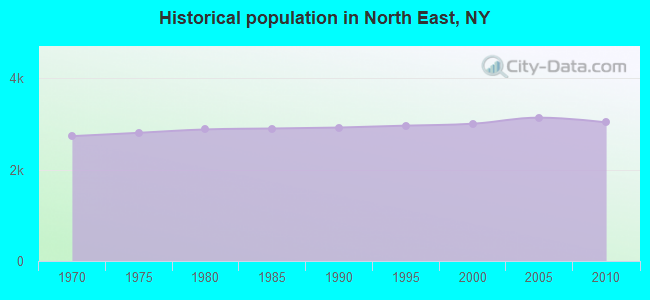
North East, New York
Submit your own pictures of this town and show them to the world
- OSM Map
- Google Map
- MSN Map
Population change since 2000: +1.0%
 |
| Males: 1,540 | |
| Females: 1,491 |
| Median resident age: | 45.2 years |
| New York median age: | 40.7 years |
Zip codes: 12546.
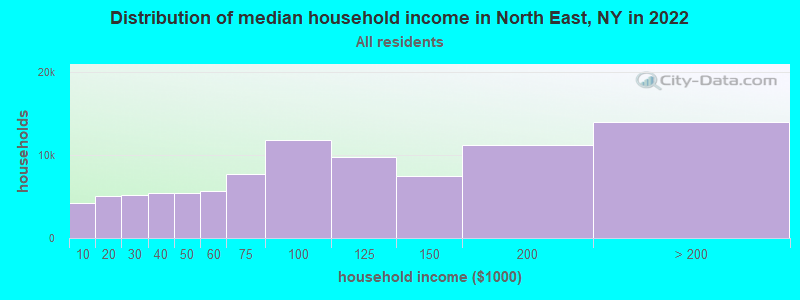
| North East: | $71,974 |
| NY: | $79,557 |
Estimated per capita income in 2022: $50,966 (it was $24,650 in 2000)
North East town income, earnings, and wages data
Estimated median house or condo value in 2022: $318,630 (it was $128,200 in 2000)
| North East: | $318,630 |
| NY: | $400,400 |
Mean prices in 2022: all housing units: $414,214; detached houses: $452,020; townhouses or other attached units: $307,694; in 2-unit structures: $268,927; in 3-to-4-unit structures: $222,482; in 5-or-more-unit structures: $275,815; mobile homes: $90,593
Detailed information about poverty and poor residents in North East, NY


- 2,59485.6%White alone
- 2759.1%Hispanic
- 742.4%Black alone
- 381.3%Two or more races
- 321.1%Asian alone
- 150.5%Other race alone
- 20.07%American Indian alone
- 10.03%Native Hawaiian and Other
Pacific Islander alone
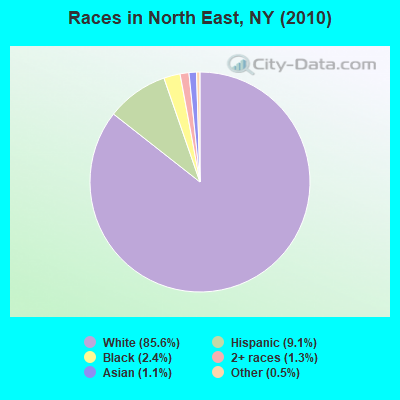
Races in North East detailed stats: ancestries, foreign born residents, place of birth
 Recent articles from our blog. Our writers, many of them Ph.D. graduates or candidates, create easy-to-read articles on a wide variety of topics.
Ancestries: German (19.4%), Irish (19.0%), Italian (14.3%), English (13.4%), United States (4.8%), Dutch (4.8%).
Current Local Time: EST time zone
Land area: 43.4 square miles.
Population density: 70 people per square mile (very low).
142 residents are foreign born (3.1% Europe, 0.8% Latin America).
| This town: | 4.7% |
| New York: | 20.4% |
| North East town: | 2.2% ($2,786) |
| New York: | 1.9% ($2,847) |
Nearest city with pop. 50,000+: Bristol, CT  (35.6 miles , pop. 60,062).
Nearest city with pop. 200,000+: Bronx, NY (78.1 miles , pop. 1,332,650).
Nearest cities:
), ), )Latitude: 41.95 N, Longitude: 73.53 W
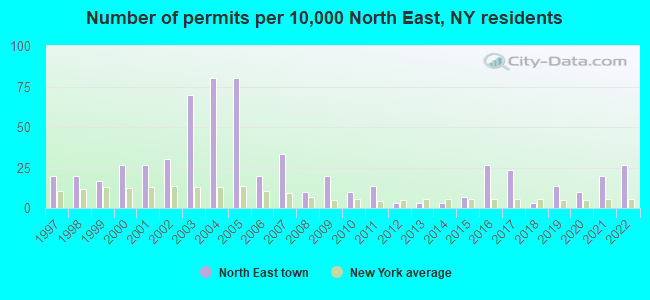
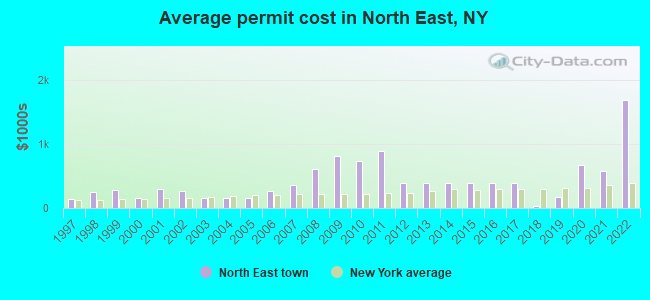
Single-family new house construction building permits:
- 2022: 8 buildings, average cost: $1,688,100
- 2021: 6 buildings, average cost: $585,000
- 2020: 3 buildings, average cost: $666,900
- 2019: 4 buildings, average cost: $170,900
- 2018: 1 building, cost: $27,500
- 2017: 7 buildings, average cost: $382,700
- 2016: 8 buildings, average cost: $382,700
- 2015: 2 buildings, average cost: $385,000
- 2014: 1 building, cost: $385,000
- 2013: 1 building, cost: $385,000
- 2012: 1 building, cost: $385,000
- 2011: 4 buildings, average cost: $895,300
- 2010: 3 buildings, average cost: $741,700
- 2009: 6 buildings, average cost: $815,000
- 2008: 3 buildings, average cost: $609,600
- 2007: 10 buildings, average cost: $358,500
- 2006: 6 buildings, average cost: $265,700
- 2005: 24 buildings, average cost: $161,100
- 2004: 24 buildings, average cost: $161,100
- 2003: 21 buildings, average cost: $163,200
- 2002: 9 buildings, average cost: $264,900
- 2001: 8 buildings, average cost: $295,300
- 2000: 8 buildings, average cost: $158,700
- 1999: 5 buildings, average cost: $274,700
- 1998: 6 buildings, average cost: $243,300
- 1997: 6 buildings, average cost: $135,200
| Here: | 3.6% |
| New York: | 4.4% |
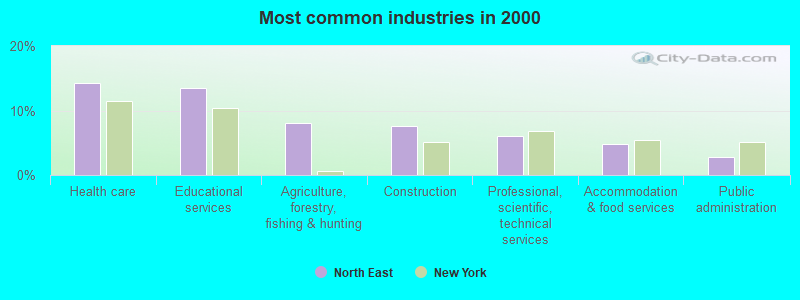
- Health care (14.3%)
- Educational services (13.5%)
- Agriculture, forestry, fishing & hunting (8.0%)
- Construction (7.6%)
- Professional, scientific, technical services (6.1%)
- Accommodation & food services (4.8%)
- Public administration (2.8%)
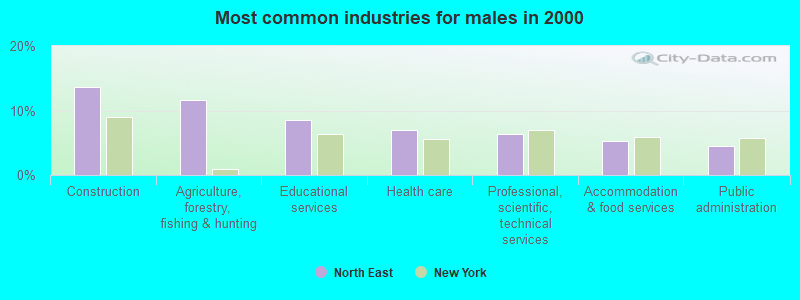
- Construction (13.7%)
- Agriculture, forestry, fishing & hunting (11.7%)
- Educational services (8.6%)
- Health care (7.0%)
- Professional, scientific, technical services (6.4%)
- Accommodation & food services (5.3%)
- Public administration (4.4%)
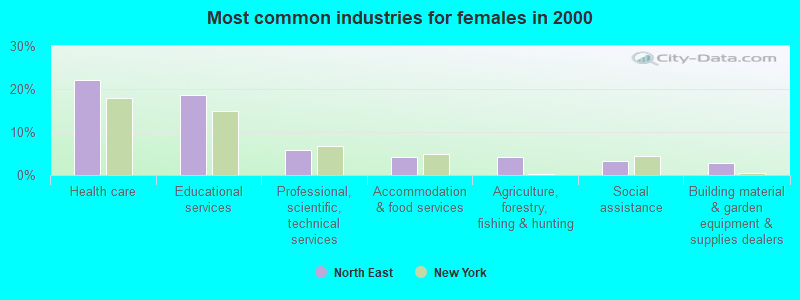
- Health care (22.0%)
- Educational services (18.7%)
- Professional, scientific, technical services (5.8%)
- Accommodation & food services (4.3%)
- Agriculture, forestry, fishing & hunting (4.1%)
- Social assistance (3.3%)
- Building material & garden equipment & supplies dealers (2.9%)
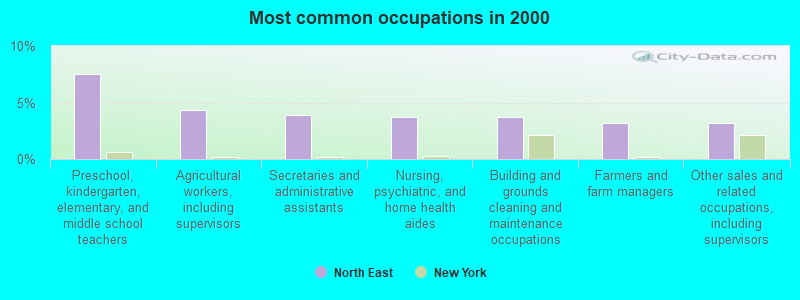
- Preschool, kindergarten, elementary, and middle school teachers (7.6%)
- Agricultural workers, including supervisors (4.3%)
- Secretaries and administrative assistants (3.9%)
- Nursing, psychiatric, and home health aides (3.7%)
- Building and grounds cleaning and maintenance occupations (3.7%)
- Farmers and farm managers (3.2%)
- Other sales and related occupations, including supervisors (3.1%)
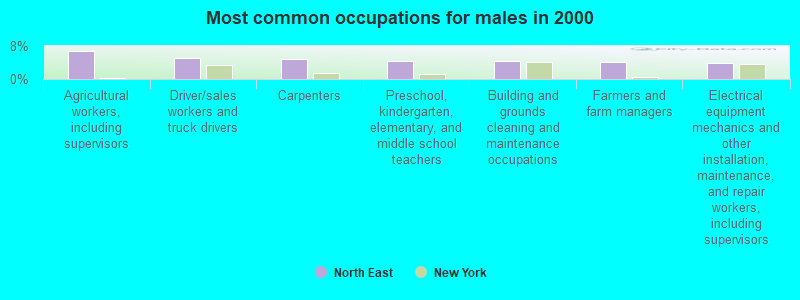
- Agricultural workers, including supervisors (6.9%)
- Driver/sales workers and truck drivers (5.1%)
- Carpenters (4.8%)
- Preschool, kindergarten, elementary, and middle school teachers (4.4%)
- Building and grounds cleaning and maintenance occupations (4.3%)
- Farmers and farm managers (4.2%)
- Electrical equipment mechanics and other installation, maintenance, and repair workers, including supervisors (3.9%)
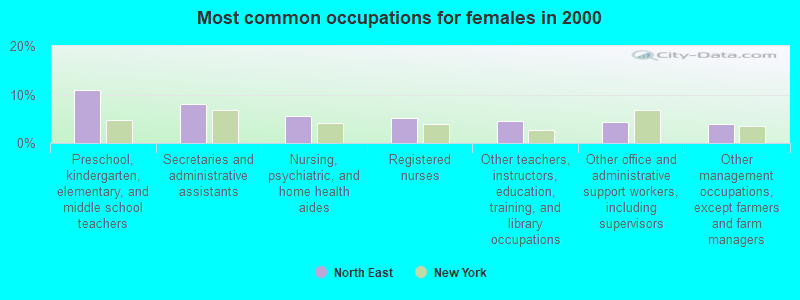
- Preschool, kindergarten, elementary, and middle school teachers (10.9%)
- Secretaries and administrative assistants (8.0%)
- Nursing, psychiatric, and home health aides (5.5%)
- Registered nurses (5.1%)
- Other teachers, instructors, education, training, and library occupations (4.5%)
- Other office and administrative support workers, including supervisors (4.4%)
- Other management occupations, except farmers and farm managers (3.9%)
Average climate in North East, New York
Based on data reported by over 4,000 weather stations


(lower is better)
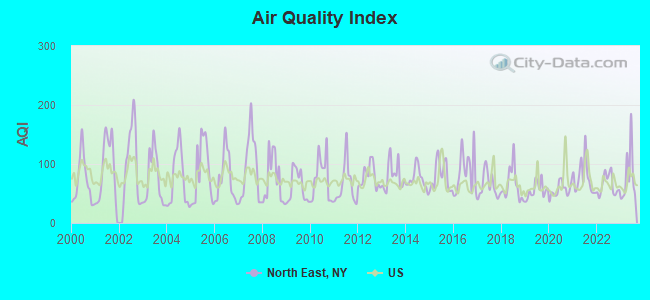
Air Quality Index (AQI) level in 2023 was 79.4. This is about average.
| City: | 79.4 |
| U.S.: | 72.6 |
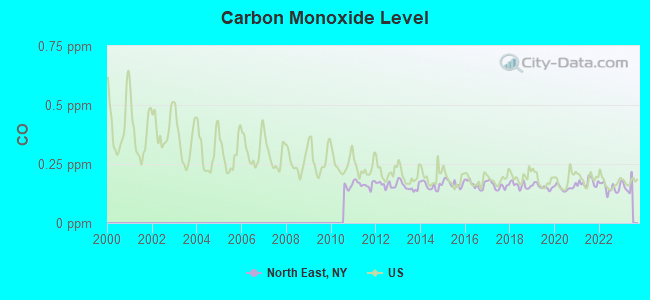
Carbon Monoxide (CO) [ppm] level in 2022 was 0.149. This is significantly better than average. Closest monitor was 11.2 miles away from the city center.
| City: | 0.149 |
| U.S.: | 0.251 |
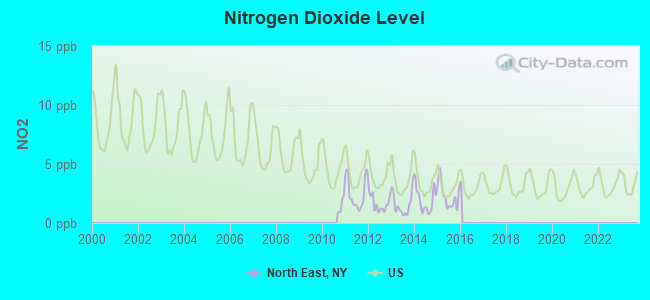
Nitrogen Dioxide (NO2) [ppb] level in 2015 was 2.27. This is significantly better than average. Closest monitor was 11.2 miles away from the city center.
| City: | 2.27 |
| U.S.: | 5.11 |
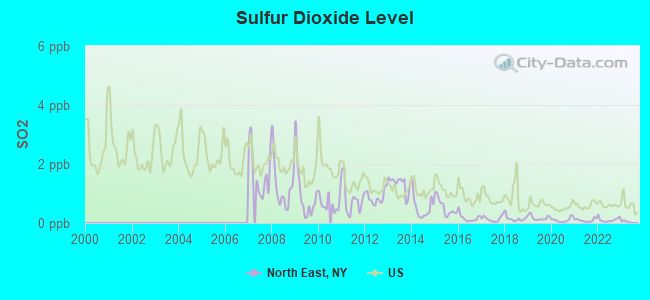
Sulfur Dioxide (SO2) [ppb] level in 2022 was 0.109. This is significantly better than average. Closest monitor was 11.2 miles away from the city center.
| City: | 0.109 |
| U.S.: | 1.515 |
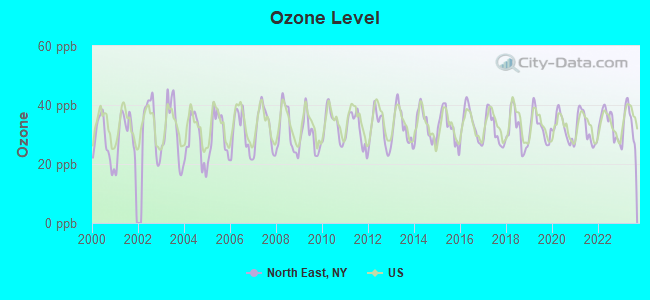
Ozone [ppb] level in 2023 was 33.4. This is about average. Closest monitor was 14.6 miles away from the city center.
| City: | 33.4 |
| U.S.: | 33.3 |
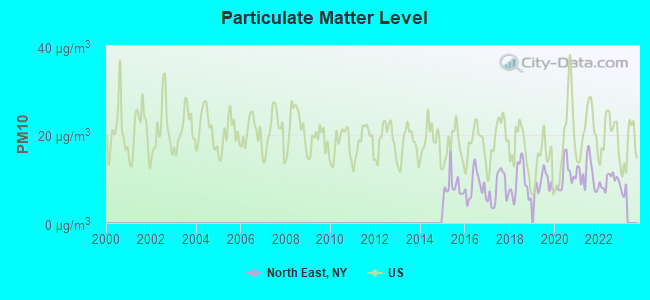
Particulate Matter (PM10) [µg/m3] level in 2022 was 9.49. This is significantly better than average. Closest monitor was 14.6 miles away from the city center.
| City: | 9.49 |
| U.S.: | 19.21 |
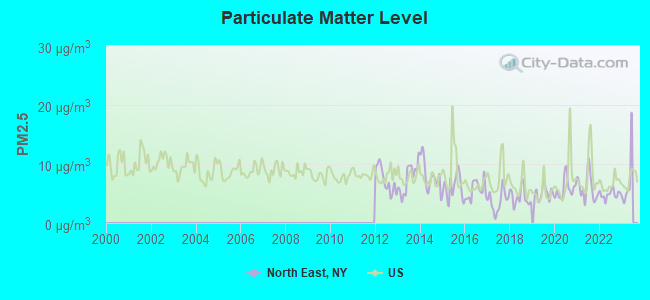
Particulate Matter (PM2.5) [µg/m3] level in 2022 was 4.86. This is significantly better than average. Closest monitor was 14.6 miles away from the city center.
| City: | 4.86 |
| U.S.: | 8.11 |
Tornado activity:
North East-area historical tornado activity is significantly above New York state average. It is 22% smaller than the overall U.S. average.
On 5/29/1995, a category F4 (max. wind speeds 207-260 mph) tornado 18.3 miles away from the North East town center killed 3 people and injured 24 people and caused between $5,000,000 and $50,000,000 in damages.
On 8/28/1973, a category F4 tornado 23.7 miles away from the town center killed 4 people and injured 36 people and caused between $5,000,000 and $50,000,000 in damages.
Earthquake activity:
North East-area historical earthquake activity is significantly above New York state average. It is 68% smaller than the overall U.S. average.On 10/7/1983 at 10:18:46, a magnitude 5.3 (5.1 MB, 5.3 LG, 5.1 ML, Class: Moderate, Intensity: VI - VII) earthquake occurred 144.8 miles away from the city center
On 4/20/2002 at 10:50:47, a magnitude 5.3 (5.3 ML, Depth: 3.0 mi) earthquake occurred 177.7 miles away from the city center
On 4/20/2002 at 10:50:47, a magnitude 5.2 (5.2 MB, 4.2 MS, 5.2 MW, 5.0 MW) earthquake occurred 176.0 miles away from North East center
On 1/19/1982 at 00:14:42, a magnitude 4.7 (4.5 MB, 4.7 MD, 4.5 LG, Class: Light, Intensity: IV - V) earthquake occurred 145.4 miles away from the city center
On 8/23/2011 at 17:51:04, a magnitude 5.8 (5.8 MW, Depth: 3.7 mi) earthquake occurred 364.1 miles away from North East center
On 10/16/2012 at 23:12:25, a magnitude 4.7 (4.7 ML, Depth: 10.0 mi) earthquake occurred 185.2 miles away from North East center
Magnitude types: regional Lg-wave magnitude (LG), body-wave magnitude (MB), duration magnitude (MD), local magnitude (ML), surface-wave magnitude (MS), moment magnitude (MW)
Natural disasters:
The number of natural disasters in Dutchess County (19) is greater than the US average (15).Major Disasters (Presidential) Declared: 12
Emergencies Declared: 6
Causes of natural disasters: Storms: 5, Floods: 4, Hurricanes: 4, Blizzards: 2, Snowstorms: 2, Winter Storms: 2, Power Outage: 1, Water Shortage: 1, Other: 3 (Note: some incidents may be assigned to more than one category).
Hospitals and medical centers near North East:
- SHARON HOSPITAL Acute Care Hospitals (about 5 miles away; SHARON, CT)
- SHARON HEALTH CARE CENTER (Nursing Home, about 6 miles away; SHARON, CT)
- NOBLE HORIZONS (Nursing Home, about 7 miles away; SALISBURY, CT)
- GEER NURSING AND REHABILITATIO (Nursing Home, about 10 miles away; CANAAN, CT)
- TACONIC DDSO (Hospital, about 12 miles away; WASSAIC, NY)
- LIFESPIRE, INC (Hospital, about 12 miles away; WOODSIDE, NY)
- KENT, LTD, THE (Nursing Home, about 16 miles away; KENT, CT)
Airports located in North East:
- Winchell Mountain Airport (41NK) (Runways: 1)
Colleges/universities with over 2000 students nearest to North East:
- Bard College (about 21 miles; Annandale-On-Hudson, NY; Full-time enrollment: 3,137)
- Dutchess Community College (about 25 miles; Poughkeepsie, NY; FT enrollment: 6,554)
- Culinary Institute of America (about 25 miles; Hyde Park, NY; FT enrollment: 3,869)
- Marist College (about 27 miles; Poughkeepsie, NY; FT enrollment: 5,536)
- Vassar College (about 27 miles; Poughkeepsie, NY; FT enrollment: 2,469)
- Ulster County Community College (about 32 miles; Stone Ridge, NY; FT enrollment: 2,207)
- State University of New York at New Paltz (about 33 miles; New Paltz, NY; FT enrollment: 7,319)
Points of interest:
Notable locations in North East: Perry Corners (A), Silamar Farm (B), Driftways Farm (C), North East - Millerton Library (D), Millerton Fire Department (E). Display/hide their locations on the map
Churches in North East include: North East Baptist Church (A), Millerton Methodist Church (B), Faith Bible Chapel (C), First Church of Christ Scientist (D), Kingdom Hall of Jehovahs Witnesses (E). Display/hide their locations on the map
Cemeteries: Irondale Cemetery (1), Bryan Cemetery (2), The Square Cemetery (3). Display/hide their locations on the map
Lakes: Rudd Pond (A), Indian Lake (B), Riga Lake (C), Grass Pond (D). Display/hide their locations on the map
Streams, rivers, and creeks: Bean River (A), Sawmill Brook (B). Display/hide their locations on the map
Park in North East: Coleman Station Historic District (1). Display/hide its location on the map
Birthplace of: Timothy T. Lockwood - Politician.
| This town: | 2.4 people |
| New York: | 2.6 people |
| This town: | 63.1% |
| Whole state: | 63.5% |
| This town: | 8.7% |
| Whole state: | 6.8% |
Likely homosexual households (counted as self-reported same-sex unmarried-partner households)
- Lesbian couples: 0.2% of all households
- Gay men: 1.2% of all households
| This town: | 12.3% |
| Whole state: | 14.6% |
| This town: | 4.7% |
| Whole state: | 7.4% |
5 people in emergency and transitional shelters (with sleeping facilities) for people experiencing homelessness in 2010
121 people in other noninstitutional group quarters in 2000
14 people in homes for the mentally retarded in 2000
For population 15 years and over in North East:
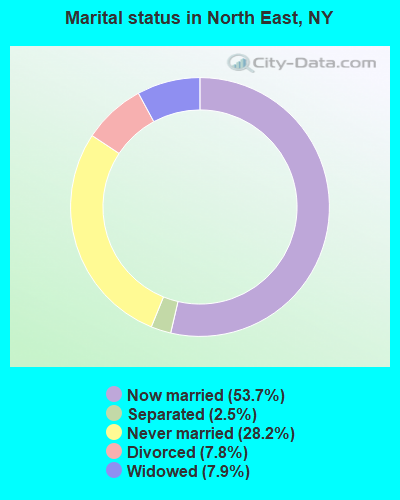
- Never married: 28.2%
- Now married: 53.7%
- Separated: 2.5%
- Widowed: 7.9%
- Divorced: 7.8%
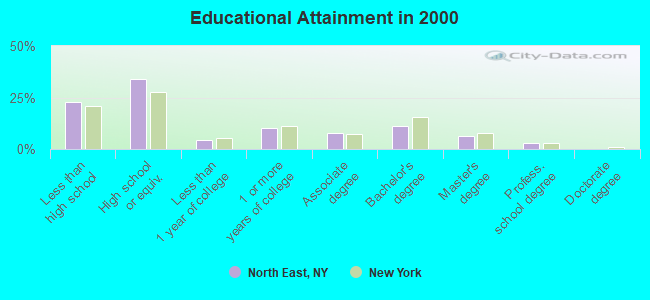
For population 25 years and over in North East:
- High school or higher: 77.2%
- Bachelor's degree or higher: 20.6%
- Graduate or professional degree: 9.5%
- Unemployed: 7.6%
- Mean travel time to work (commute): 22.7 minutes
| Here: | 12.4 |
| New York average: | 14.2 |
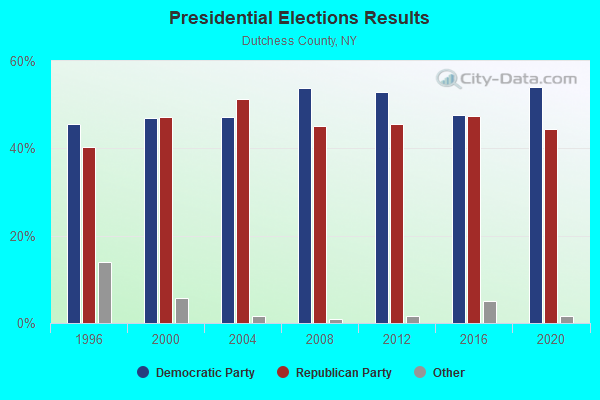
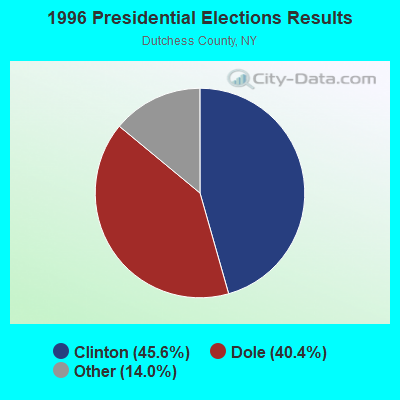
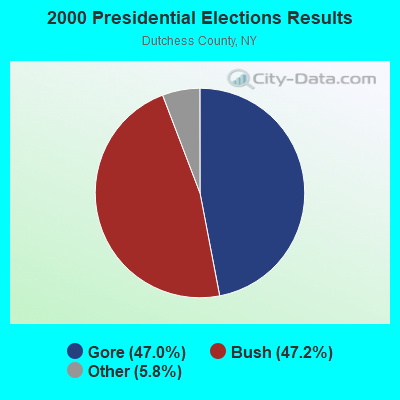
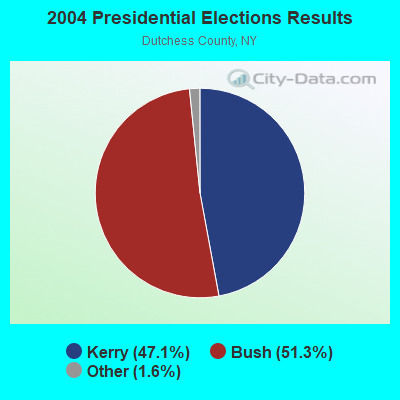
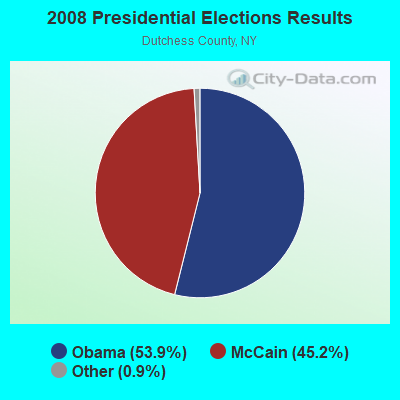
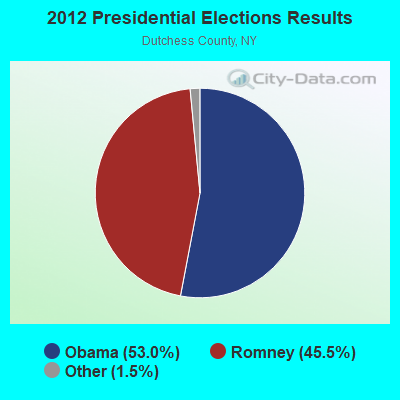
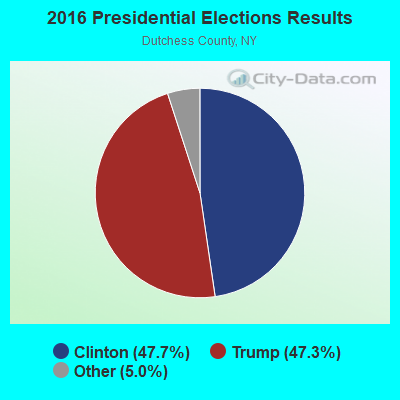

Graphs represent county-level data. Detailed 2008 Election Results
Religion statistics for North East, NY (based on Dutchess County data)
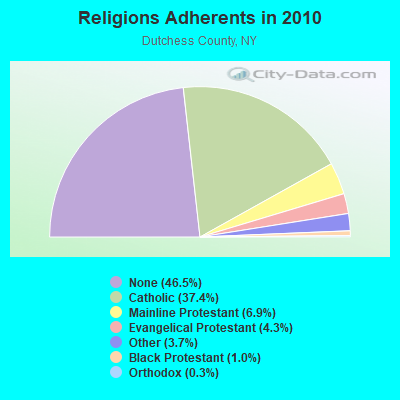
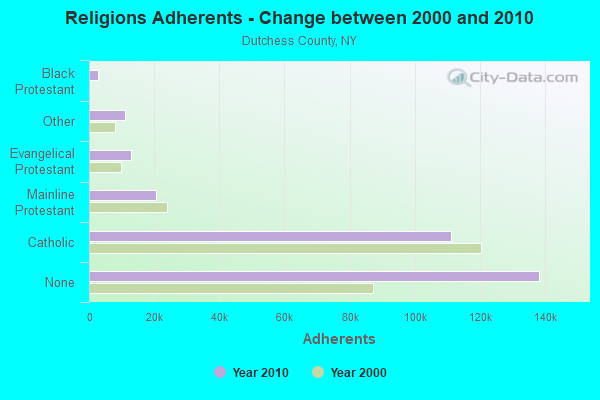
| Religion | Adherents | Congregations |
|---|---|---|
| Catholic | 111,112 | 22 |
| Mainline Protestant | 20,556 | 87 |
| Evangelical Protestant | 12,799 | 69 |
| Other | 10,970 | 28 |
| Black Protestant | 2,898 | 11 |
| Orthodox | 854 | 5 |
| None | 138,299 | - |
Food Environment Statistics:
| Dutchess County: | 3.42 / 10,000 pop. |
| New York: | 4.13 / 10,000 pop. |
| Dutchess County: | 0.10 / 10,000 pop. |
| State: | 0.06 / 10,000 pop. |
| This county: | 1.16 / 10,000 pop. |
| New York: | 0.92 / 10,000 pop. |
| Dutchess County: | 2.63 / 10,000 pop. |
| New York: | 1.68 / 10,000 pop. |
| Dutchess County: | 10.33 / 10,000 pop. |
| New York: | 8.82 / 10,000 pop. |
| Dutchess County: | 8.1% |
| State: | 8.2% |
| This county: | 24.4% |
| State: | 23.8% |
| This county: | 13.4% |
| New York: | 15.6% |
Strongest AM radio stations in North East:
- WKZE (1020 AM; daytime; 2 kW; SHARON, CT; Owner: JOHNSON DEVELOPMENT, INC.)
- WNNZ (640 AM; 50 kW; WESTFIELD, MA; Owner: CLEAR CHANNEL BROADCASTING LICENSES, INC.)
- WTIC (1080 AM; 50 kW; HARTFORD, CT; Owner: INFINITY RADIO OPERATIONS INC.)
- WGY (810 AM; 50 kW; SCHENECTADY, NY; Owner: CLEAR CHANNEL BROADCASTING LICENSES, INC.)
- WFAN (660 AM; 50 kW; NEW YORK, NY; Owner: INFINITY BROADCASTING OPERATIONS, INC.)
- WMCA (570 AM; 50 kW; NEW YORK, NY; Owner: SALEM MEDIA OF NEW YORK, LLC)
- WPTR (1540 AM; 50 kW; ALBANY, NY; Owner: KIMTRON, INC.)
- WABC (770 AM; 50 kW; NEW YORK, NY; Owner: WABC-AM RADIO, INC.)
- WGHQ (920 AM; 5 kW; KINGSTON, NY; Owner: CLEVELAND RADIO LICENSES, LLC)
- WCBS (880 AM; 50 kW; NEW YORK, NY; Owner: INFINITY BROADCASTING OPERATIONS, INC.)
- WOR (710 AM; 50 kW; NEW YORK, NY; Owner: BUCKLEY BROADCASTING CORPORATION)
- WCRN (830 AM; 50 kW; WORCESTER, MA; Owner: CARTER BROADCASTING CORPORATION)
- WSBS (860 AM; 3 kW; GREAT BARRINGTON, MA; Owner: BERKSHIRE BROADCASTING CO., INC.)
Strongest FM radio stations in North East:
- WKZE-FM (98.1 FM; SALISBURY, CT; Owner: JOHNSON DEVELOPMENT, INC.)
- WQQQ (103.3 FM; SHARON, CT; Owner: THE RIDGEFIELD BROADCASTING CORPORATION)
- WAMQ (105.1 FM; GREAT BARRINGTON, MA; Owner: WAMC)
- WPDH (101.5 FM; POUGHKEEPSIE, NY; Owner: CUMULUS LICENSING CORP.)
- W206AW (89.1 FM; PAWLING, NY; Owner: SOUND OF LIFE, INC.)
- WAMK (90.9 FM; KINGSTON, NY; Owner: W A M C)
- WFGB (89.7 FM; KINGSTON, NY; Owner: SOUND OF LIFE, INC.)
- WRNQ (92.1 FM; POUGHKEEPSIE, NY; Owner: CLEAR CHANNEL BROADCASTING LICENSES, INC.)
- WFNP (88.7 FM; ROSENDALE, NY; Owner: STATE UNIVERSITY OF NEW YORK)
- WRHV (88.7 FM; POUGHKEEPSIE, NY; Owner: WMHT EDUCATIONAL TELECOMMUNICATIONS)
- WHVP (91.1 FM; HUDSON, NY; Owner: SOUND OF LIFE, INC.)
- W218AV (91.5 FM; WARREN, CT; Owner: MONROE BOARD OF EDUCATION)
- WCZX (97.7 FM; HYDE PARK, NY; Owner: CUMULUS LICENSING CORP.)
- WRRB (96.9 FM; ARLINGTON, NY; Owner: CUMULUS LICENSING CORP.)
- WBWZ (93.3 FM; NEW PALTZ, NY; Owner: CLEVELAND RADIO LICENSES, LLC)
- WRWD-FM (107.3 FM; HIGHLAND, NY; Owner: CLEVELAND RADIO LICENSES, LLC)
- WAMC-FM (90.3 FM; ALBANY, NY; Owner: WAMC)
- WFKP (99.3 FM; ELLENVILLE, NY; Owner: CLEAR CHANNEL BROADCASTING LICENSES, INC.)
- WSPK (104.7 FM; POUGHKEEPSIE, NY; Owner: 6 JOHNSON ROAD LICENSES, INC.)
- WRCH (100.5 FM; NEW BRITAIN, CT; Owner: INFINITY RADIO OPERATIONS INC.)
TV broadcast stations around North East:
- WTIC-TV (Channel 61; HARTFORD, CT; Owner: TRIBUNE TELEVISION COMPANY)
- W11BJ (Channel 11; HARTFORD, CT; Owner: COMMUNICATIONS SITE MANAGEMENT LLC)
- WTXX (Channel 20; WATERBURY, CT; Owner: WTXX INC.)
- WUVN (Channel 18; HARTFORD, CT; Owner: ENTRAVISION HOLDINGS, LLC)
- WVIT (Channel 30; NEW BRITAIN, CT; Owner: OUTLET BROADCASTING, INC)
- WEDH (Channel 24; HARTFORD, CT; Owner: CONNECTICUT PUBLIC BROADCASTING, INC.)
- WTBY (Channel 54; POUGHKEEPSIE, NY; Owner: TRINITY BROADCASTING OF NEW YORK, INC.)
- National Bridge Inventory (NBI) Statistics
- 11Number of bridges
- 33ft / 9.7mTotal length
- $4,790,000Total costs
- 2,820Total average daily traffic
- 143Total average daily truck traffic
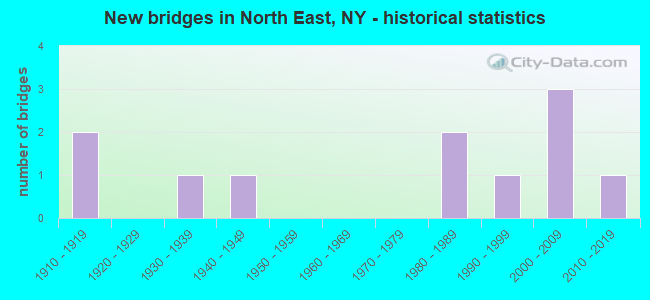
- New bridges - historical statistics
- 21910-1919
- 11930-1939
- 11940-1949
- 21980-1989
- 11990-1999
- 32000-2009
- 12010-2019
FCC Registered Broadcast Land Mobile Towers:
1- Silver Mountain 1000 S Smithfield Rd On Perotti Rd (Lat: 41.918139 Lon: -73.572361), Call Sign: WRJ454,
Assigned Frequencies: 453.775 MHz, 458.775 MHz, Grant Date: 02/27/2015, Expiration Date: 04/10/2025, Registrant: Town Of North East, 19 North Maple Avenue, Millerton, NY 12546, Phone: (518) 789-3658, Fax: (518) 789-3399
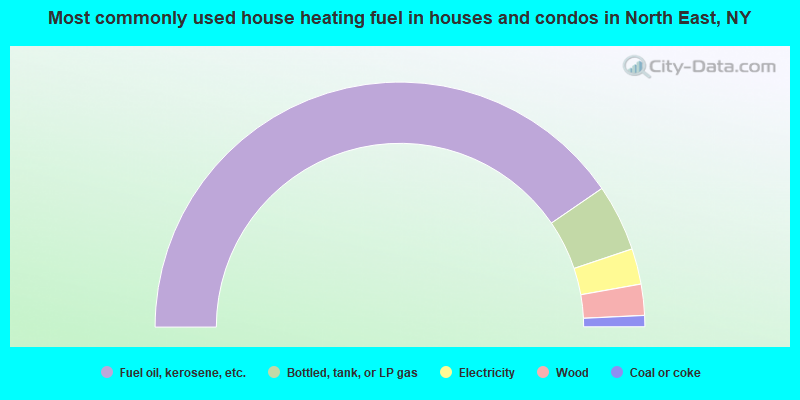
- 80.8%Fuel oil, kerosene, etc.
- 8.8%Bottled, tank, or LP gas
- 4.7%Electricity
- 4.1%Wood
- 1.5%Coal or coke
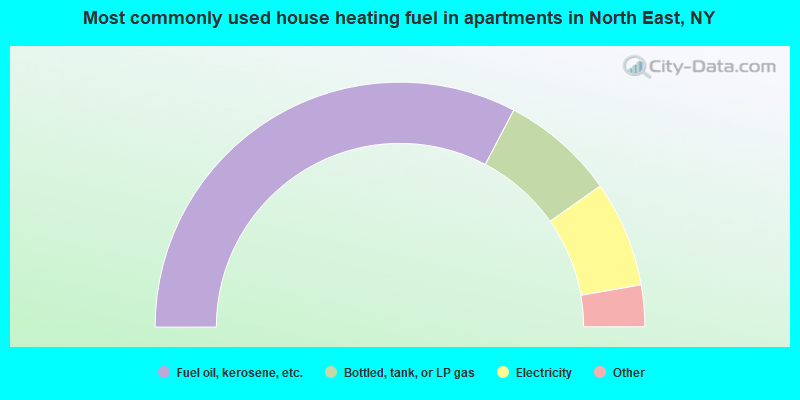
- 65.4%Fuel oil, kerosene, etc.
- 15.1%Bottled, tank, or LP gas
- 14.0%Electricity
- 3.8%Wood
- 1.6%Utility gas
North East compared to New York state average:
- Unemployed percentage below state average.
- Black race population percentage significantly below state average.
- Hispanic race population percentage below state average.
- Median age above state average.
- Foreign-born population percentage significantly below state average.
- Length of stay since moving in significantly above state average.
- Number of rooms per house significantly below state average.
- House age significantly below state average.
North East on our top lists:
- #43 on the list of "Top 101 cities with the largest percentage of people in other noninstitutional group quarters (population 1,000+)"
- #3 on the list of "Top 101 counties with the largest decrease in the number of infant deaths per 1000 residents 2000-2006 to 2007-2013 (pop. 50,000+)"
- #4 on the list of "Top 101 counties with the lowest number of infant deaths per 1000 residents 2007-2013 (pop. 50,000+)"
- #28 on the list of "Top 101 counties with the lowest number of births per 1000 residents 2007-2013"
- #49 on the list of "Top 101 counties with the largest decrease in the number of births per 1000 residents 2000-2006 to 2007-2013 (pop 50,000+)"