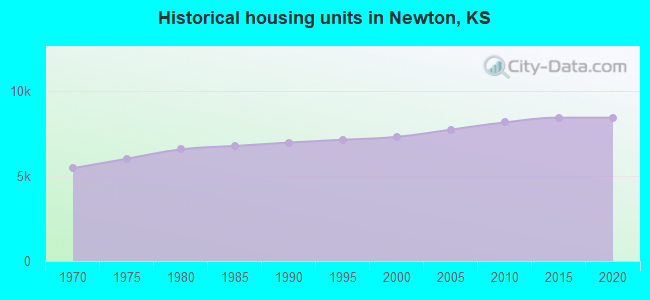
Newton, Kansas
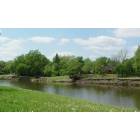
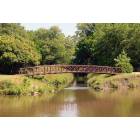
Newton: Sand Creek - Bike and Walking Path
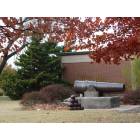
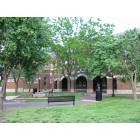
Newton: Military Park - cannon - Newton Public Library
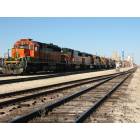
Newton: Burlington Northern - Santa Fe RR
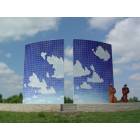
Newton: Blue Sky Monument - Centenial Park
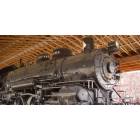
Newton: Old 1880 - Military Park
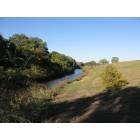
Newton: Sand Creek
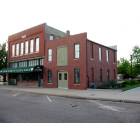
Newton: Art Gallery
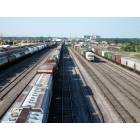
Newton: Sand Creek Rail Yards
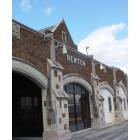
Newton: Newton Station - Main Street
Newton: Sand Creek
Newton: Newton Station - AmTrac
- see
17
more - add
your
Submit your own pictures of this city and show them to the world
- OSM Map
- General Map
- Google Map
- MSN Map
Population change since 2000: +7.0%
 |
| Males: 9,272 | |
| Females: 9,120 |
| Median resident age: | 40.6 years |
| Kansas median age: | 37.6 years |
Zip codes: 67117.
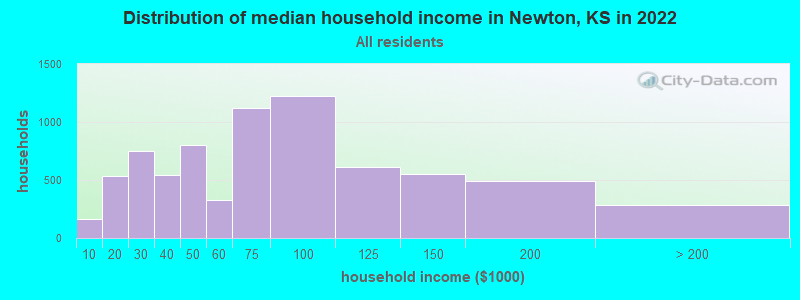
| Newton: | $65,744 |
| KS: | $68,925 |
Estimated per capita income in 2022: $32,032 (it was $18,529 in 2000)
Newton city income, earnings, and wages data
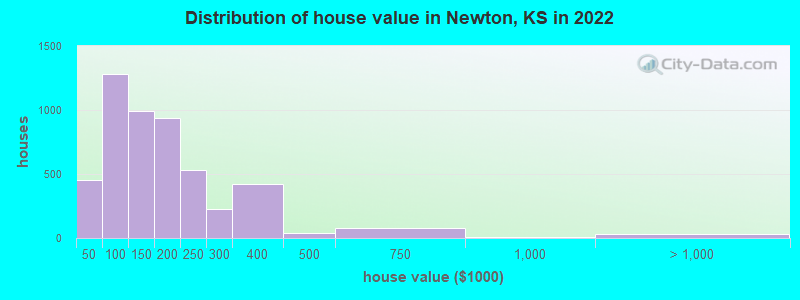
Estimated median house or condo value in 2022: $150,175 (it was $67,800 in 2000)
| Newton: | $150,175 |
| KS: | $206,600 |
Mean prices in 2022: all housing units: $183,980; detached houses: $190,439; townhouses or other attached units: $128,239; in 2-unit structures: $134,235; in 5-or-more-unit structures: $149,579; mobile homes: $59,265
Median gross rent in 2022: $866.
(9.5% for White Non-Hispanic residents, 49.9% for Black residents, 15.2% for Hispanic or Latino residents, 17.2% for other race residents, 12.8% for two or more races residents)
Detailed information about poverty and poor residents in Newton, KS


Compare current foreclosures near Newton, KS:
| Photo | Address | Area | Beds / Baths | Price | Details |
|---|---|---|---|---|---|

|
#1
W Broadway St
Newton, KS 67114
|
1,580 sq. feet
|
2 baths 4 beds |
show details | |

|
#2
E 5th St
Newton, KS 67114
|
3,140 sq. feet
|
3 baths 4 beds |
show details | |

|
#3
Central Ave
Newton, KS 67114
|
1,502 sq. feet
|
2 baths 4 beds |
show details | |

|
#4
W Broadway St
Newton, KS 67114
|
1,592 sq. feet
|
2 baths 2 beds |
show details | |

|
#5
E 7th St
Newton, KS 67114
|
1,064 sq. feet
|
1 baths 3 beds |
show details | |

|
#6
Berry Ave
Newton, KS 67114
|
984 sq. feet
|
1 baths 2 beds |
show details | |

|
#7
N High St
Newton, KS 67114
|
989 sq. feet
|
1 baths 2 beds |
show details | |

|
#8
E 7th St
Newton, KS 67114
|
1,331 sq. feet
|
1 baths 4 beds |
show details | |

|
#9
E 8th St
Newton, KS 67114
|
1,010 sq. feet
|
1 baths 2 beds |
show details | |

|
#10
N Walnut St
Newton, KS 67114
|
1,500 sq. feet
|
1 baths 3 beds |
show details |
| Photo | Address | Area | Beds / Baths | Price | Details |
|---|---|---|---|---|---|

|
#11
W Broadway St
Newton, KS 67114
|
825 sq. feet
|
1 baths 2 beds |
show details | |

|
#12
Windward Dr
Newton, KS 67114
|
1,293 sq. feet
|
3 baths 3 beds |
show details | |

|
#13
N Anderson Ave
Newton, KS 67114
|
1,488 sq. feet
|
2 baths 4 beds |
show details | |

|
#14
S Poplar St
Newton, KS 67114
|
- sq. feet
|
- baths - beds |
show details | |

|
#15
Meadowbrook Dr Apt 306
Newton, KS 67114
|
- sq. feet
|
- baths - beds |
show details | |

|
#16
W 15th St
Newton, KS 67114
|
- sq. feet
|
- baths - beds |
show details | |

|
#17
NE 12th St
Newton, KS 67114
|
- sq. feet
|
- baths - beds |
show details | |

|
#18
Windward Ct
Newton, KS 67114
|
- sq. feet
|
- baths - beds |
show details | |

|
#19
Springlake Dr
Newton, KS 67114
|
- sq. feet
|
- baths - beds |
show details | |

|
#20
W 8th St
Newton, KS 67114
|
- sq. feet
|
- baths - beds |
show details |
| Photo | Address | Area | Beds / Baths | Price | Details |
|---|---|---|---|---|---|

|
#21
N Elm St
Newton, KS 67114
|
- sq. feet
|
- baths - beds |
show details | |

|
#22
E 12th St # 7
Newton, KS 67114
|
- sq. feet
|
- baths - beds |
show details | |

|
#23
Old Main St Apt 204
Newton, KS 67114
|
- sq. feet
|
- baths - beds |
show details | |

|
#24
N Poplar St
Newton, KS 67114
|
- sq. feet
|
- baths - beds |
show details | |

|
#25
E 5th St
Newton, KS 67114
|
- sq. feet
|
- baths - beds |
show details | |

|
#26
Old Main St Apt 205
Newton, KS 67114
|
- sq. feet
|
- baths - beds |
show details | |

|
#27
W 3rd St
Newton, KS 67114
|
- sq. feet
|
- baths - beds |
show details | |

|
#28
Gayle Ct
Valley Center, KS 67147
|
1,308 sq. feet
|
2 baths 3 beds |
show details | |

|
#29
N Wedel Ave
Moundridge, KS 67107
|
836 sq. feet
|
1 baths 2 beds |
show details | |

|
#30
E Cambridge St
Wichita, KS 67219
|
918 sq. feet
|
2 baths 3 beds |
show details |
| Photo | Address | Area | Beds / Baths | Price | Details |
|---|---|---|---|---|---|

|
#31
N Dexter Ave
Valley Center, KS 67147
|
1,080 sq. feet
|
1 baths 3 beds |
show details | |

|
#32
N Dexter Ave
Valley Center, KS 67147
|
1,488 sq. feet
|
1 baths 4 beds |
show details | |

|
#33
Deerfield Cir
Valley Center, KS 67147
|
1,084 sq. feet
|
3 baths 4 beds |
show details | |

|
#34
Mclaughlin Dr
Valley Center, KS 67147
|
1,337 sq. feet
|
2 baths 3 beds |
show details | |

|
#35
N Burns Ave
Valley Center, KS 67147
|
960 sq. feet
|
1 baths 3 beds |
show details | |

|
#36
N Streeter Ave
Hesston, KS 67062
|
1,431 sq. feet
|
1 baths 3 beds |
show details | |

|
#37
N Randall Dr
Wichita, KS 67219
|
1,839 sq. feet
|
1 baths 3 beds |
show details | |

|
#38
30th
Peabody, KS 66866
|
1,680 sq. feet
|
1 baths 3 beds |
show details | |

|
#39
Hymer Dr
Sedgwick, KS 67135
|
1,312 sq. feet
|
2 baths 3 beds |
show details | |

|
#40
S Halstead Rd
Halstead, KS 67056
|
1,283 sq. feet
|
1 baths 1 beds |
show details |
| Photo | Address | Area | Beds / Baths | Price | Details |
|---|---|---|---|---|---|

|
#41
S Dexter Ave
Valley Center, KS 67147
|
1,152 sq. feet
|
2 baths 3 beds |
show details | |

|
#42
S 2nd Ave
Walton, KS 67151
|
884 sq. feet
|
1 baths 2 beds |
show details | |

|
#43
Jasper Ct
North Newton, KS 67117
|
1,456 sq. feet
|
2 baths 3 beds |
show details | |

|
#44
S Dexter Ave
Valley Center, KS 67147
|
1,621 sq. feet
|
1 baths 3 beds |
show details | |

|
#45
S Stoneridge St
Valley Center, KS 67147
|
1,204 sq. feet
|
2 baths 2 beds |
show details | |

|
#46
E Ford St Apt 210
Valley Center, KS 67147
|
- sq. feet
|
- baths - beds |
show details | |

|
#47
N Arapaho Dr
Wichita, KS 67219
|
- sq. feet
|
- baths - beds |
show details | |

|
#48
E 3rd St
Peabody, KS 66866
|
- sq. feet
|
- baths - beds |
show details | |

|
#49
E 69th Ct N
Wichita, KS 67219
|
- sq. feet
|
- baths - beds |
show details | |

|
Check over 1 million property listings on Foreclosure.com!
|
browse all offers | |||


- 13,43172.5%White alone
- 3,73620.2%Hispanic
- 9245.0%Two or more races
- 3862.1%Black alone
- 1130.6%Other race alone
- 270.1%Asian alone
- 150.08%Native Hawaiian and Other
Pacific Islander alone - 80.04%American Indian alone
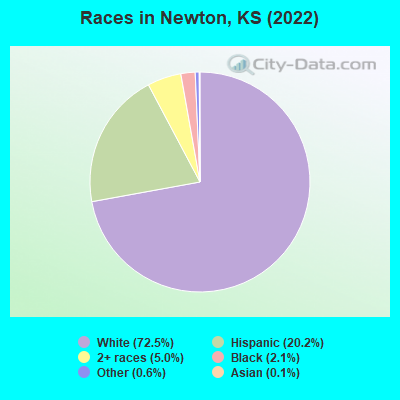
Races in Newton detailed stats: ancestries, foreign born residents, place of birth
According to our research of Kansas and other state lists, there were 80 registered sex offenders living in Newton, Kansas as of July 02, 2024.
The ratio of all residents to sex offenders in Newton is 240 to 1.
The ratio of registered sex offenders to all residents in this city is near the state average.
Type |
2009 |
2010 |
2011 |
2012 |
2013 |
2014 |
2015 |
2016 |
2017 |
2018 |
2019 |
2020 |
2021 |
2022 |
|---|---|---|---|---|---|---|---|---|---|---|---|---|---|---|
| Murders (per 100,000) | 0 (0.0) | 0 (0.0) | 0 (0.0) | 0 (0.0) | 0 (0.0) | 0 (0.0) | 0 (0.0) | 0 (0.0) | 2 (10.5) | 0 (0.0) | 1 (5.3) | 0 (0.0) | 2 (10.7) | 0 (0.0) |
| Rapes (per 100,000) | 10 (55.0) | 16 (83.6) | 10 (51.9) | 15 (77.6) | 29 (151.1) | 16 (83.8) | 19 (99.5) | 18 (93.6) | 22 (115.2) | 24 (127.5) | 22 (117.7) | 14 (74.3) | 27 (144.3) | 26 (141.8) |
| Robberies (per 100,000) | 5 (27.5) | 5 (26.1) | 7 (36.4) | 4 (20.7) | 8 (41.7) | 9 (47.1) | 8 (41.9) | 3 (15.6) | 8 (41.9) | 9 (47.8) | 9 (48.1) | 4 (21.2) | 6 (32.1) | 6 (32.7) |
| Assaults (per 100,000) | 67 (368.6) | 74 (386.8) | 88 (457.0) | 100 (517.4) | 88 (458.4) | 93 (486.9) | 63 (329.8) | 82 (426.5) | 90 (471.3) | 102 (541.7) | 61 (326.3) | 79 (419.5) | 89 (475.8) | 86 (469.0) |
| Burglaries (per 100,000) | 127 (698.8) | 83 (433.8) | 102 (529.8) | 141 (729.5) | 128 (666.8) | 127 (665.0) | 136 (711.9) | 114 (592.9) | 94 (492.3) | 93 (493.9) | 77 (411.8) | 68 (361.1) | 61 (326.1) | 142 (774.4) |
| Thefts (per 100,000) | 331 (1,821) | 332 (1,735) | 293 (1,522) | 508 (2,628) | 521 (2,714) | 339 (1,775) | 521 (2,727) | 484 (2,517) | 570 (2,985) | 441 (2,342) | 317 (1,695) | 330 (1,753) | 376 (2,010) | 321 (1,751) |
| Auto thefts (per 100,000) | 27 (148.6) | 18 (94.1) | 20 (103.9) | 27 (139.7) | 21 (109.4) | 18 (94.2) | 21 (109.9) | 23 (119.6) | 25 (130.9) | 39 (207.1) | 22 (117.7) | 27 (143.4) | 34 (181.8) | 28 (152.7) |
| Arson (per 100,000) | 6 (33.0) | 5 (26.1) | 5 (26.0) | 2 (10.3) | 5 (26.0) | 1 (5.2) | 2 (10.5) | 4 (20.8) | 8 (41.9) | 8 (42.5) | 7 (37.4) | 7 (37.2) | 6 (32.1) | 2 (10.9) |
| City-Data.com crime index | 259.6 | 259.4 | 250.1 | 339.1 | 389.0 | 303.6 | 325.8 | 316.7 | 384.3 | 369.5 | 290.6 | 256.6 | 359.4 | 353.5 |
The City-Data.com crime index weighs serious crimes and violent crimes more heavily. Higher means more crime, U.S. average is 246.1. It adjusts for the number of visitors and daily workers commuting into cities.
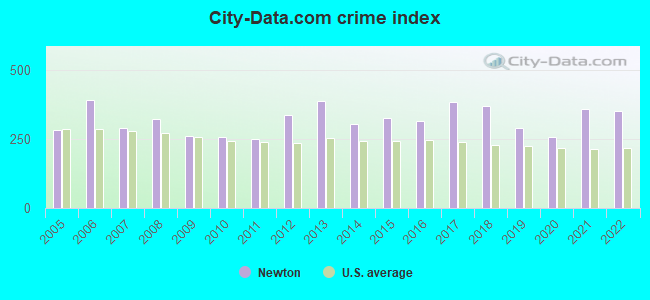
Crime rate in Newton detailed stats: murders, rapes, robberies, assaults, burglaries, thefts, arson
Full-time law enforcement employees in 2020, including police officers: 42 (38 officers - 32 male; 6 female).
| Officers per 1,000 residents here: | 2.02 |
| Kansas average: | 2.66 |
 Recent articles from our blog. Our writers, many of them Ph.D. graduates or candidates, create easy-to-read articles on a wide variety of topics.

 | Newton - Skyview Apartment Homes (0 replies) |
| Moving from Newton KS to Park City KS. How is it to live in? (0 replies) |
| Newton KS: who provides internet/cable besides Cox? (4 replies) |
| Possible Kansas relocation (17 replies) |
| Kansas Passes New Budget With Tax Increases (88 replies) |
| Considering Hays, Kansas...the good, the bad, the ugly (80 replies) |
Latest news from Newton, KS collected exclusively by city-data.com from local newspapers, TV, and radio stations
Ancestries: German (23.7%), American (9.6%), English (7.1%), Irish (4.7%), European (3.0%), Eastern European (1.5%).
Current Local Time: CST time zone
Incorporated in 1872
Elevation: 1448 feet
Land area: 9.58 square miles.
Population density: 1,919 people per square mile (low).
736 residents are foreign born (2.8% Latin America, 0.7% Europe).
| This city: | 4.0% |
| Kansas: | 7.1% |
Median real estate property taxes paid for housing units with mortgages in 2022: $2,642 (1.6%)
Median real estate property taxes paid for housing units with no mortgage in 2022: $1,827 (1.5%)
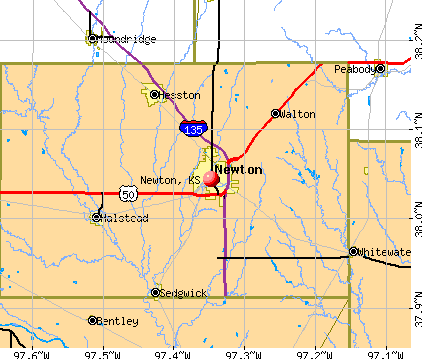
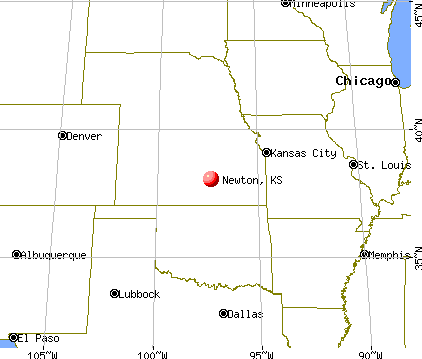
Nearest city with pop. 50,000+: Wichita, KS  (24.6 miles , pop. 344,284).
Nearest city with pop. 1,000,000+: Dallas, TX (364.1 miles , pop. 1,188,580).
Nearest cities:
), ), ), ), ), )Latitude: 38.04 N, Longitude: 97.35 W
Daytime population change due to commuting: +297 (+1.6%)
Workers who live and work in this city: 5,437 (57.6%)
Area code: 316

Newton, Kansas accommodation & food services, waste management - Economy and Business Data
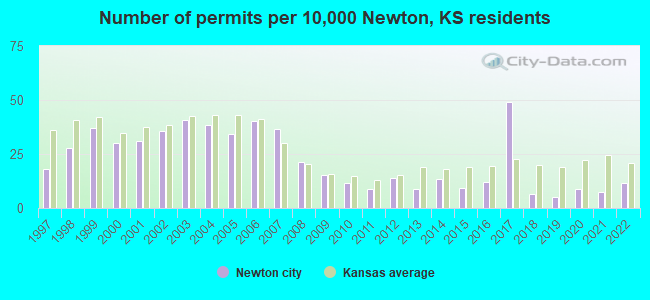
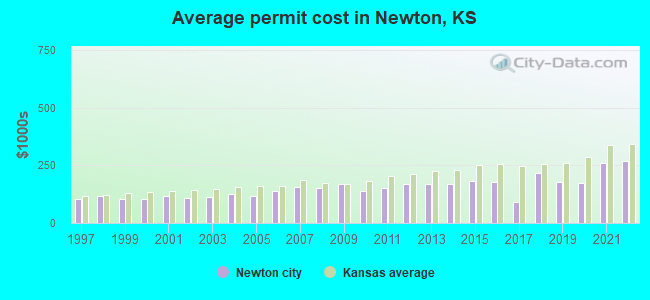
Single-family new house construction building permits:
- 2022: 20 buildings, average cost: $266,600
- 2021: 13 buildings, average cost: $259,700
- 2020: 15 buildings, average cost: $173,600
- 2019: 9 buildings, average cost: $176,800
- 2018: 11 buildings, average cost: $218,300
- 2017: 84 buildings, average cost: $90,300
- 2016: 21 buildings, average cost: $176,300
- 2015: 16 buildings, average cost: $180,700
- 2014: 23 buildings, average cost: $167,200
- 2013: 15 buildings, average cost: $169,100
- 2012: 24 buildings, average cost: $170,400
- 2011: 15 buildings, average cost: $150,300
- 2010: 20 buildings, average cost: $139,100
- 2009: 26 buildings, average cost: $170,500
- 2008: 37 buildings, average cost: $153,100
- 2007: 63 buildings, average cost: $155,600
- 2006: 69 buildings, average cost: $140,200
- 2005: 59 buildings, average cost: $119,000
- 2004: 66 buildings, average cost: $124,000
- 2003: 70 buildings, average cost: $111,500
- 2002: 61 buildings, average cost: $109,800
- 2001: 53 buildings, average cost: $114,600
- 2000: 52 buildings, average cost: $105,400
- 1999: 64 buildings, average cost: $104,300
- 1998: 48 buildings, average cost: $116,400
- 1997: 31 buildings, average cost: $101,600
| Here: | 4.2% |
| Kansas: | 2.0% |
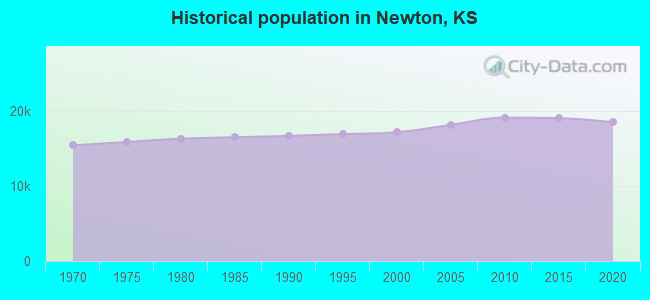
Population change in the 1990s: +382 (+2.3%).
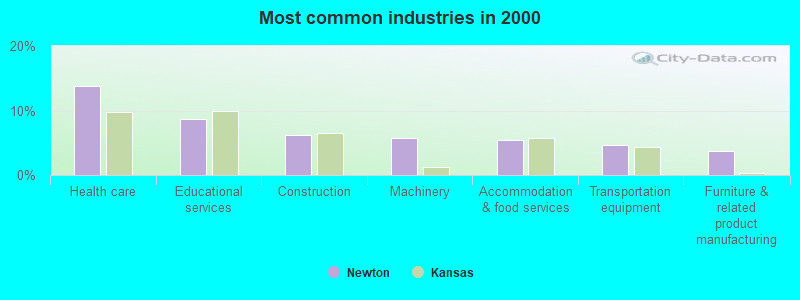
- Health care (13.7%)
- Educational services (8.6%)
- Construction (6.1%)
- Machinery (5.7%)
- Accommodation & food services (5.5%)
- Transportation equipment (4.6%)
- Furniture & related product manufacturing (3.7%)
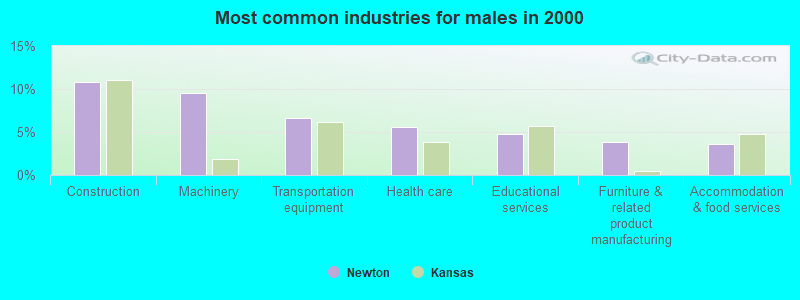
- Construction (10.8%)
- Machinery (9.5%)
- Transportation equipment (6.6%)
- Health care (5.6%)
- Educational services (4.7%)
- Furniture & related product manufacturing (3.9%)
- Accommodation & food services (3.6%)
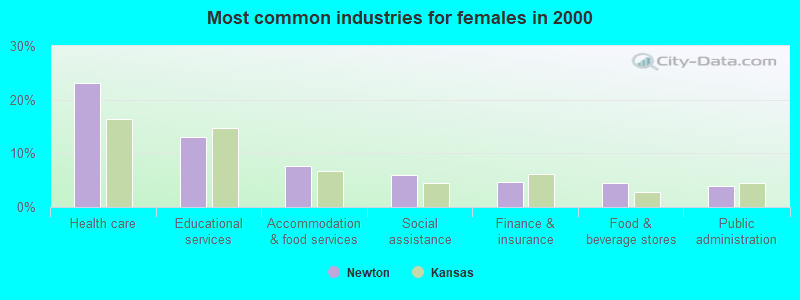
- Health care (23.1%)
- Educational services (13.1%)
- Accommodation & food services (7.6%)
- Social assistance (5.9%)
- Finance & insurance (4.7%)
- Food & beverage stores (4.5%)
- Public administration (4.0%)
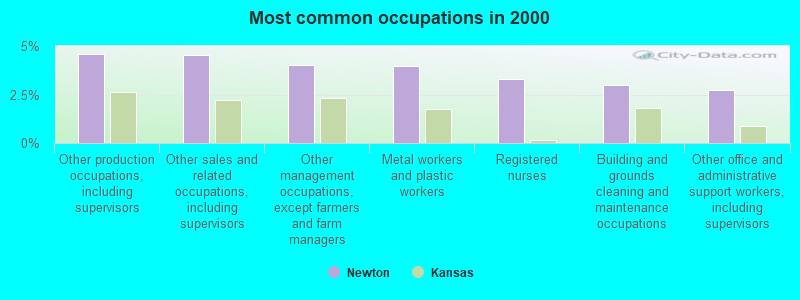
- Other production occupations, including supervisors (4.6%)
- Other sales and related occupations, including supervisors (4.5%)
- Other management occupations, except farmers and farm managers (4.0%)
- Metal workers and plastic workers (3.9%)
- Registered nurses (3.3%)
- Building and grounds cleaning and maintenance occupations (3.0%)
- Other office and administrative support workers, including supervisors (2.7%)
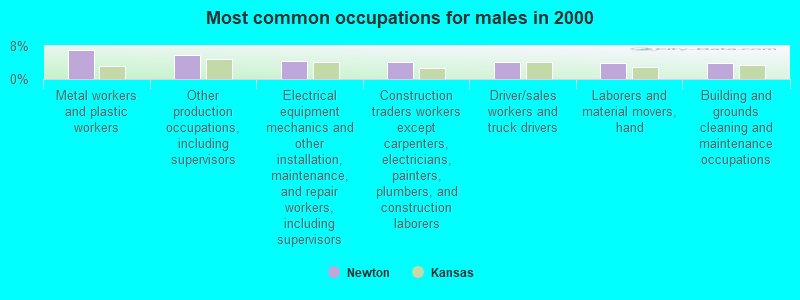
- Metal workers and plastic workers (7.1%)
- Other production occupations, including supervisors (5.8%)
- Electrical equipment mechanics and other installation, maintenance, and repair workers, including supervisors (4.4%)
- Construction traders workers except carpenters, electricians, painters, plumbers, and construction laborers (4.1%)
- Driver/sales workers and truck drivers (4.0%)
- Laborers and material movers, hand (3.9%)
- Building and grounds cleaning and maintenance occupations (3.9%)
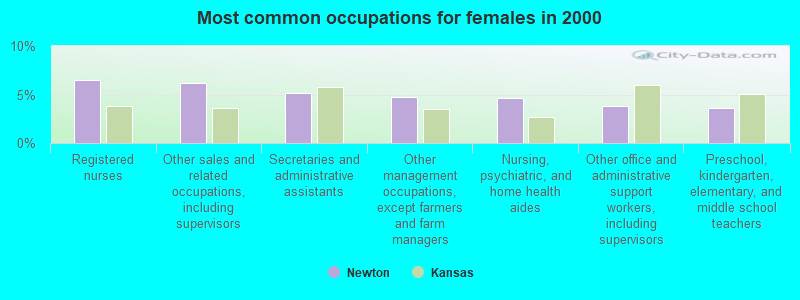
- Registered nurses (6.5%)
- Other sales and related occupations, including supervisors (6.2%)
- Secretaries and administrative assistants (5.1%)
- Other management occupations, except farmers and farm managers (4.7%)
- Nursing, psychiatric, and home health aides (4.7%)
- Other office and administrative support workers, including supervisors (3.8%)
- Preschool, kindergarten, elementary, and middle school teachers (3.6%)
Average climate in Newton, Kansas
Based on data reported by over 4,000 weather stations


|
|

(lower is better)
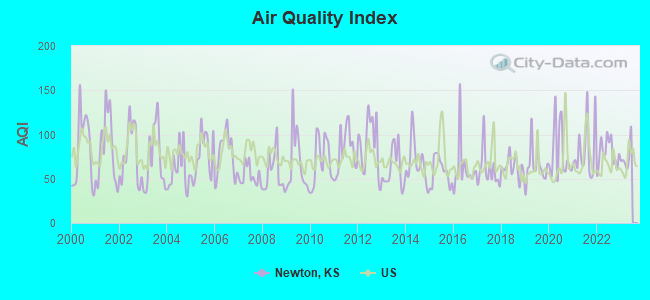
Air Quality Index (AQI) level in 2022 was 79.1. This is about average.
| City: | 79.1 |
| U.S.: | 72.6 |
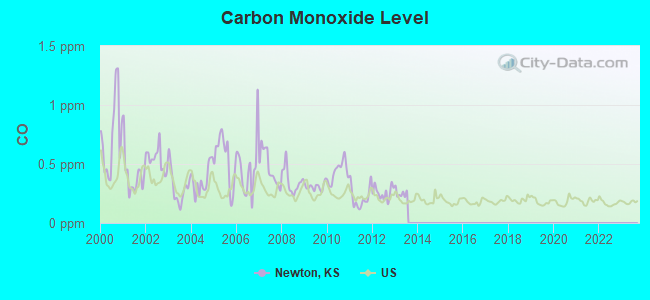
Carbon Monoxide (CO) [ppm] level in 2013 was 0.252. This is about average. Closest monitor was 23.7 miles away from the city center.
| City: | 0.252 |
| U.S.: | 0.251 |
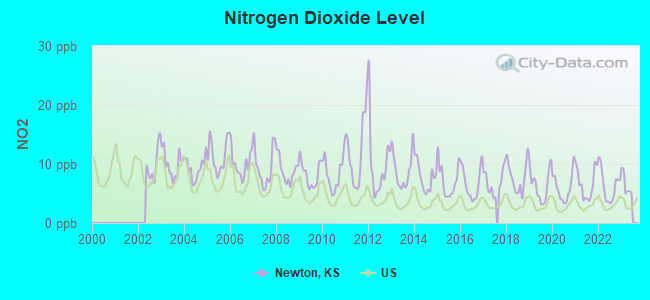
Nitrogen Dioxide (NO2) [ppb] level in 2022 was 6.32. This is worse than average. Closest monitor was 20.4 miles away from the city center.
| City: | 6.32 |
| U.S.: | 5.11 |
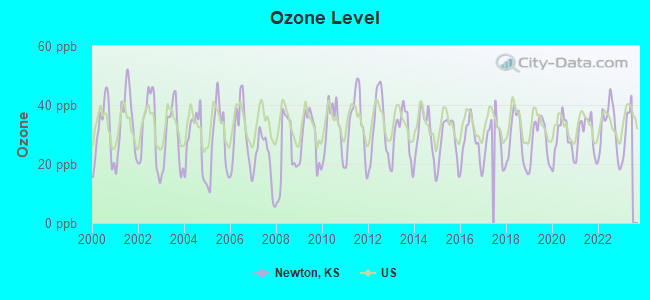
Ozone [ppb] level in 2022 was 32.4. This is about average. Closest monitor was 18.9 miles away from the city center.
| City: | 32.4 |
| U.S.: | 33.3 |
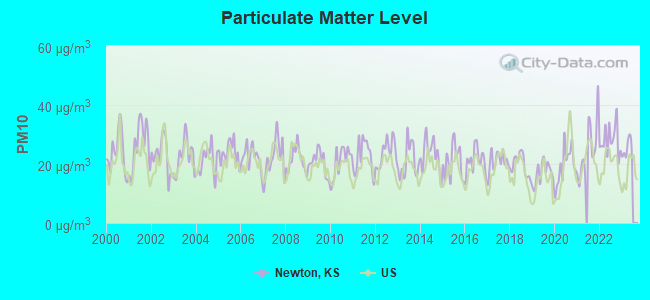
Particulate Matter (PM10) [µg/m3] level in 2022 was 28.1. This is significantly worse than average. Closest monitor was 23.2 miles away from the city center.
| City: | 28.1 |
| U.S.: | 19.2 |
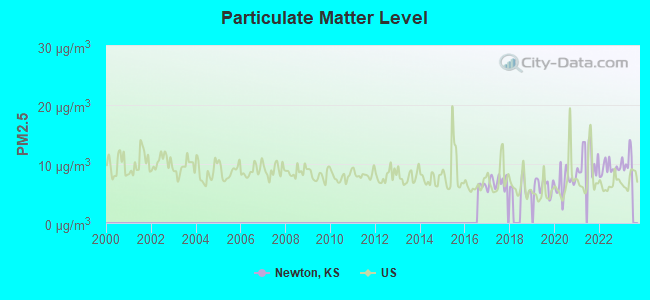
Particulate Matter (PM2.5) [µg/m3] level in 2022 was 9.24. This is about average. Closest monitor was 23.7 miles away from the city center.
| City: | 9.24 |
| U.S.: | 8.11 |
Tornado activity:
Newton-area historical tornado activity is near Kansas state average. It is 97% greater than the overall U.S. average.
On 3/13/1990, a category F5 (max. wind speeds 261-318 mph) tornado 8.6 miles away from the Newton city center killed one person and caused between $5,000,000 and $50,000,000 in damages.
On 3/13/1990, a category F5 tornado 9.5 miles away from the city center killed one person and injured 60 people and caused between $5,000,000 and $50,000,000 in damages.
Earthquake activity:
Newton-area historical earthquake activity is significantly above Kansas state average. It is 769% greater than the overall U.S. average.On 9/3/2016 at 12:02:44, a magnitude 5.8 (5.8 MW, Depth: 3.5 mi, Class: Moderate, Intensity: VI - VII) earthquake occurred 114.3 miles away from the city center
On 11/6/2011 at 03:53:10, a magnitude 5.7 (5.7 MW, Depth: 3.2 mi) earthquake occurred 176.7 miles away from the city center
On 11/12/2014 at 21:40:00, a magnitude 4.9 (4.9 MW, Depth: 2.5 mi, Class: Light, Intensity: IV - V) earthquake occurred 55.5 miles away from the city center
On 2/13/2016 at 17:07:06, a magnitude 5.1 (5.1 MW, Depth: 5.2 mi) earthquake occurred 131.0 miles away from the city center
On 1/19/2020 at 19:08:42, a magnitude 4.5 (4.5 MW, Depth: 3.1 mi) earthquake occurred 34.1 miles away from Newton center
On 11/7/2016 at 01:44:24, a magnitude 5.0 (5.0 MW, Depth: 2.8 mi) earthquake occurred 145.2 miles away from the city center
Magnitude types: moment magnitude (MW)
Natural disasters:
The number of natural disasters in Harvey County (20) is greater than the US average (15).Major Disasters (Presidential) Declared: 14
Emergencies Declared: 3
Causes of natural disasters: Floods: 13, Storms: 11, Tornadoes: 7, Winds: 5, Winter Storms: 4, Explosion: 1, Heavy Rain: 1, Hurricane: 1, Landslide: 1, Mudslide: 1, Snow: 1, Snowstorm: 1, Other: 1 (Note: some incidents may be assigned to more than one category).
Hospitals and medical centers in Newton:
- AXTELL CHRISTIAN HOSPITAL (provides emergency services, 209 E BROADWAY)
- NEWTON MEDICAL CENTER (Voluntary non-profit - Private, 600 MEDICAL CENTER DRIVE)
- PRAIRIE VIEW INC (1901 E FIRST STREET PO BOX 467)
- ASBURY PARK (200 SW 14TH)
- KANSAS CHRISTIAN HOME (1035 SE 3RD ST)
- NEWTON MEDICAL CENTER SNF (600 MEDICAL CENTER DR)
- NEWTON PRESBYTERIAN MANOR (1200 E 7TH ST)
- NEWTON DIALYSIS CENTER (1223 WASHINGTON RD.)
- RENAL CARE GROUP - NEWTON (625 MEDICAL CENTER DR.)
- CENTRAL HOMECARE AND HOSPICE INC (606 NORTH MAINE SUTE 202)
Airports located in Newton:
- Newton-City-County Airport (EWK) (Runways: 2, Air Taxi Ops: 700, Itinerant Ops: 25,675, Local Ops: 38,519, Military Ops: 150)
Colleges/universities with over 2000 students nearest to Newton:
- Wichita Area Technical College (about 21 miles; Wichita, KS; Full-time enrollment: 2,220)
- Wichita State University (about 23 miles; Wichita, KS; FT enrollment: 11,743)
- Friends University (about 26 miles; Wichita, KS; FT enrollment: 2,024)
- Newman University (about 26 miles; Wichita, KS; FT enrollment: 2,066)
- Wichita Technical Institute (about 27 miles; Wichita, KS; FT enrollment: 2,015)
- Butler Community College (about 31 miles; El Dorado, KS; FT enrollment: 6,676)
- Hutchinson Community College (about 32 miles; Hutchinson, KS; FT enrollment: 4,174)
Public high school in Newton:
- NEWTON SR HIGH (Students: 1,114, Location: 900 WEST 12TH, Grades: 9-12)
Private high schools in Newton:
Public elementary/middle schools in Newton:
- SLATE CREEK ELEMENTARY (Students: 482, Location: 901 E. 4TH, Grades: PK-4)
- SOUTH BREEZE ELEMENTARY (Students: 456, Location: 1020 OLD MAIN, Grades: PK-4)
- CHISHOLM MIDDLE SCHOOL (Students: 414, Location: 900 E. FIRST, Grades: 7-8)
- NORTHRIDGE ELEMENTARY (Students: 297, Location: 1900 WINDSOR DR., Grades: PK-4)
- SANTA FE 5/6 CENTER (Location: 130 W. BROADWAY, Grades: 5-6)
- SUNSET ELEMENTARY (Location: 619 BOYD, Grades: PK-4)
Private elementary/middle school in Newton:
User-submitted facts and corrections:
- Hertler Regional Medical Center is actually spelled "Hertzler". Also, as of April 2004, it is no longer in existence. added by Ruth
- Hertler Regional Medical Center is actually spelled \"Hertzler\". Also, as of April 2004, it is no longer in existence.
added by Ruth
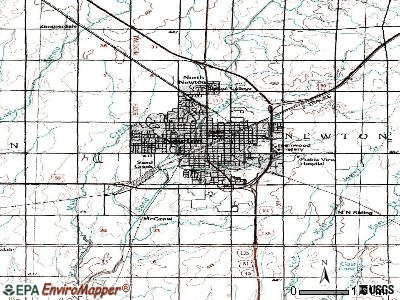
Points of interest:
Notable locations in Newton: Newton Amtrak Station (A), Newton Wastewater Plant (B), Newton Waterworks (C), Newton Country Club (D), Team Marketing Alliance Grain Elevator Number 29 (E), The Village Center (F), Kansas Highway Patrol Troop F (G), Newton Police Department (H), Harvey County Sheriff's Department (I), Harvey County Courthouse (J), Newton Fire and Emergency Medical Services Station 2 (K), Newton Fire and Emergency Medical Services Station 1 (L), Harvey County Sheriff's Department Detention Center (M), Harvey County Health Department (N), Harvey County Historical Society (O), Newton Public Library (P), Kansas Sports Museum (Q), Newton City Hall (R), Newton Recreation Center (S), Newton Area Chamber of Commerce and Visitor's Bureau (T). Display/hide their locations on the map
Shopping Center: Cedar Village Shopping Center (1). Display/hide its location on the map
Churches in Newton include: Community Church of God (A), First Baptist Church (B), Kingdom Hall of Jehovah's Witnesses (C), Columbus Avenue Church of Christ (D), Trinity Heights United Methodist Church (E), First United Methodist Church (F), First Mennonite Church (G), First Missionary Church (H), Grace Community Church (I). Display/hide their locations on the map
Cemeteries: Greenwood Cemetery (1), Saint Mary's Cemetery (2). Display/hide their locations on the map
Parks in Newton include: Themian Park (1), Washington Park (2). Display/hide their locations on the map
Tourist attractions: Kauffman Museum (27 Main North) (1), Dial-A-Story (Cultural Attractions- Events- & Facilities; Newton Public Librar) (2), Warkentin House (Cultural Attractions- Events- & Facilities; 211 East 1st Street) (3), Newton City - Historical Museum (Cultural Attractions- Events- & Facilities; 203 North Main Street) (4), Caregivers Of Kansas (1020 S Kansas Ave #122) (5), Newton Convention & Visitors Bureau (500 North Main Street Suite 101) (6), MTS Travel (Tours & Charters; 717 North Main Street) (7). Display/hide their approximate locations on the map
Hotels: Newton-Days Inn (105 Manchester Ave) (1), Best Value Inn (1620 East 2nd Street) (2), Super 8 Hotel (1620 East 2nd Street) (3), Best Western Red Coach Inns (1301 East 1st Street) (4), Newton Super 8 Motel (1620 E 2nd St) (5), Newell Ambest Truck Plaza (200 Manchester Avenue) (6), Best Western Red Coach Inn (1301 East 1st) (7). Display/hide their approximate locations on the map
Courts: Harvey County - Court Services Probation (Court House) (1), Harvey County - District Court- Traffic Court Probate (Court House) (2), Kansas State - District Court Offices- Employment Security Division- Newton- Department Of Comm (116 East 6th Street) (3), Harvey County - District Court- Civil Domestic Small Claims (Court House) (4), Harvey County - District Court- Juvenile Marriage Licenses (Court House) (5), Harvey County - District Court- Casa (Court House) (6), Harvey County - District Court- Clerk Of The District Court (Court House) (7), Harvey County - District Court- Criminal (Court House) (8), Newton City - Municipal Court- City Attorney (201 East 6th Street) (9). Display/hide their approximate locations on the map
Birthplace of: Emil Haury - Archaeologist, Jesse M. Unruh - Politician, Kimberly J. Mueller - Judge, Patrick Miller (soldier) - Recipient of the Purple Heart medal, Rachel deBenedet - Actor, Tom Adair - Songwriter, Tony Clark - 2005 Major League Baseball player (Arizona Diamondbacks, born: Jun 15, 1972), Travis Hughes - 2005 Major League Baseball player (Washington Nationals, born: May 25, 1978), Waldo Rudolph Wedel - Archaeologist, Dustin Richardson - Baseball player.
| This city: | 2.5 people |
| Kansas: | 2.5 people |
| This city: | 66.5% |
| Whole state: | 66.0% |
| This city: | 6.1% |
| Whole state: | 5.8% |
Likely homosexual households (counted as self-reported same-sex unmarried-partner households)
- Lesbian couples: 0.4% of all households
- Gay men: 0.1% of all households
People in group quarters in Newton in 2010:
- 215 people in nursing facilities/skilled-nursing facilities
- 102 people in local jails and other municipal confinement facilities
- 84 people in residential treatment centers for juveniles (non-correctional)
- 24 people in residential treatment centers for adults
- 18 people in group homes intended for adults
- 17 people in emergency and transitional shelters (with sleeping facilities) for people experiencing homelessness
People in group quarters in Newton in 2000:
- 320 people in nursing homes
- 82 people in local jails and other confinement facilities (including police lockups)
- 74 people in residential treatment centers for emotionally disturbed children
- 37 people in hospitals or wards for drug/alcohol abuse
- 34 people in homes or halfway houses for drug/alcohol abuse
- 5 people in other group homes
- 4 people in mental (psychiatric) hospitals or wards
Banks with branches in Newton (2011 data):
- The Midland National Bank of Newton: Washington Road Branch, Presbyterian Manor Branch, West Fifth Street Branch, The Midland National Bank Of Newton. Info updated 2006/11/03: Bank assets: $132.2 mil, Deposits: $116.2 mil, local headquarters, positive income, Commercial Lending Specialization, 6 total offices, Holding Company: Midland Financial Corporation
- First Bank of Newton: Newton Branch, First Bank Of Newton, First Bank - Dillons Branch Bank. Info updated 2006/11/03: Bank assets: $154.4 mil, Deposits: $142.7 mil, local headquarters, positive income, Commercial Lending Specialization, 4 total offices, Holding Company: First Newton Bankshares, Inc.
- The Citizens State Bank: - Newton Bra at 2315 South Kansas Avenue, branch established on 2006/12/15; Wal-Mart Supercenter Branch at 1701 South Kansas Avenue, branch established on 2005/02/28. Info updated 2006/11/03: Bank assets: $243.9 mil, Deposits: $207.1 mil, headquarters in Moundridge, KS, positive income, Agricultural Specialization, 10 total offices, Holding Company: Goering Management Company, Llc
- Bank of America, National Association: Newton Auto Branch at 1225 Main Street, branch established on 1974/05/20. Info updated 2009/11/18: Bank assets: $1,451,969.3 mil, Deposits: $1,077,176.8 mil, headquarters in Charlotte, NC, positive income, 5782 total offices, Holding Company: Bank Of America Corporation
- Bank of the West: Newton at 100 West Twelfth, branch established on 1925/01/01. Info updated 2009/11/16: Bank assets: $62,408.3 mil, Deposits: $43,995.2 mil, headquarters in San Francisco, CA, positive income, 647 total offices, Holding Company: Bnp Paribas
- Central National Bank: Newton Branch at 626 North Main, branch established on 1991/10/28. Info updated 2006/11/03: Bank assets: $889.7 mil, Deposits: $775.7 mil, headquarters in Junction City, KS, positive income, Agricultural Specialization, 35 total offices, Holding Company: Central Of Kansas, Inc.
For population 15 years and over in Newton:
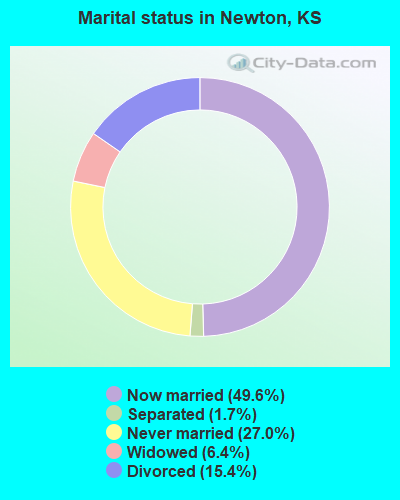
- Never married: 27.0%
- Now married: 49.6%
- Separated: 1.7%
- Widowed: 6.4%
- Divorced: 15.4%
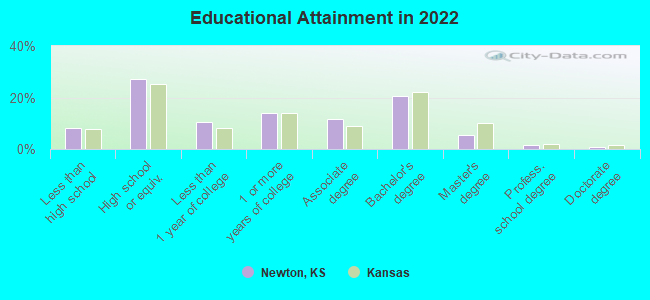
For population 25 years and over in Newton:
- High school or higher: 91.3%
- Bachelor's degree or higher: 27.7%
- Graduate or professional degree: 7.3%
- Unemployed: 3.9%
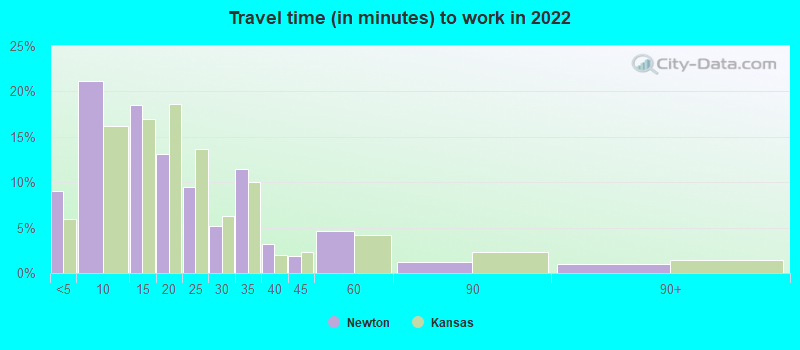
- Mean travel time to work (commute): 18.2 minutes
| Here: | 10.0 |
| Kansas average: | 11.5 |
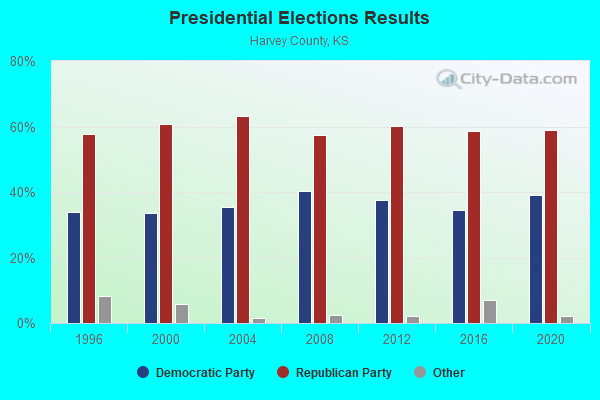
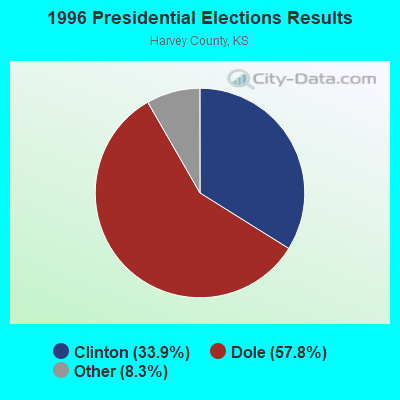
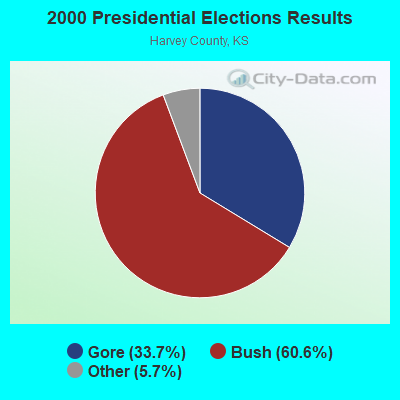
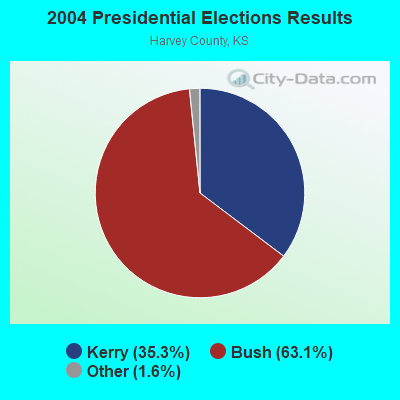
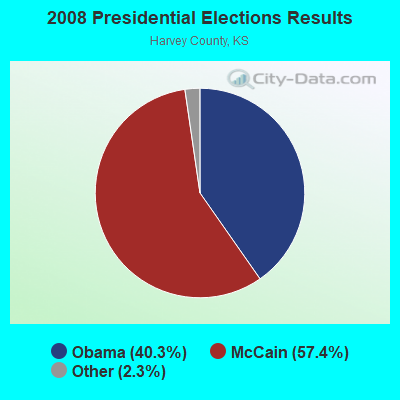
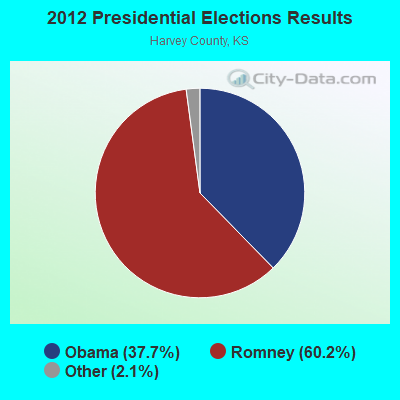
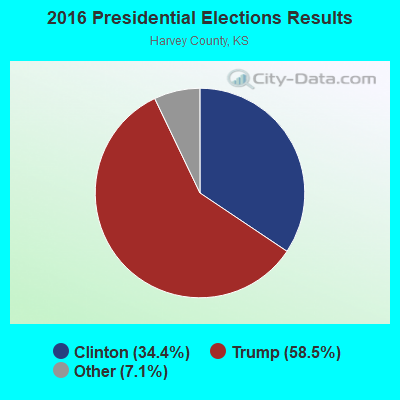
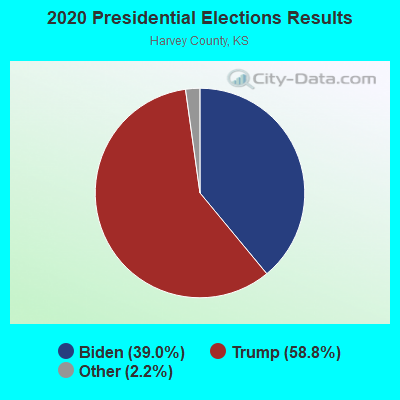
Graphs represent county-level data. Detailed 2008 Election Results
Religion statistics for Newton, KS (based on Harvey County data)
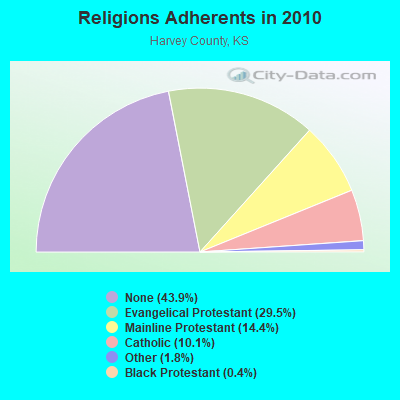
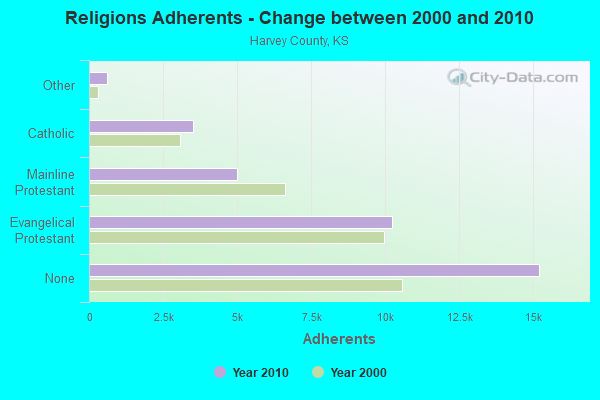
| Religion | Adherents | Congregations |
|---|---|---|
| Evangelical Protestant | 10,235 | 48 |
| Mainline Protestant | 5,000 | 20 |
| Catholic | 3,500 | 3 |
| Other | 611 | 2 |
| Black Protestant | 124 | 1 |
| None | 15,214 | - |
Food Environment Statistics:
| This county: | 2.09 / 10,000 pop. |
| Kansas: | 1.96 / 10,000 pop. |
| This county: | 0.30 / 10,000 pop. |
| Kansas: | 0.20 / 10,000 pop. |
| Harvey County: | 0.30 / 10,000 pop. |
| Kansas: | 0.51 / 10,000 pop. |
| Harvey County: | 2.99 / 10,000 pop. |
| State: | 3.84 / 10,000 pop. |
| Harvey County: | 6.57 / 10,000 pop. |
| Kansas: | 7.33 / 10,000 pop. |
| This county: | 8.6% |
| State: | 8.1% |
| Harvey County: | 27.9% |
| Kansas: | 27.9% |
| This county: | 13.8% |
| State: | 13.4% |
Health and Nutrition:
| Here: | 49.7% |
| Kansas: | 49.2% |
| Newton: | 46.9% |
| Kansas: | 46.3% |
| Newton: | 28.6 |
| State: | 28.6 |
| Here: | 20.6% |
| State: | 21.2% |
| Here: | 10.4% |
| State: | 10.5% |
| Here: | 6.9 |
| Kansas: | 6.8 |
| Newton: | 34.2% |
| Kansas: | 33.5% |
| Newton: | 56.0% |
| Kansas: | 56.0% |
| Here: | 78.3% |
| State: | 78.6% |
More about Health and Nutrition of Newton, KS Residents
| Local government employment and payroll (March 2022) | |||||
| Function | Full-time employees | Monthly full-time payroll | Average yearly full-time wage | Part-time employees | Monthly part-time payroll |
|---|---|---|---|---|---|
| Firefighters | 50 | $285,867 | $68,608 | 0 | $0 |
| Police Protection - Officers | 35 | $220,472 | $75,590 | 0 | $0 |
| Streets and Highways | 19 | $74,040 | $46,762 | 0 | $0 |
| Other and Unallocable | 18 | $82,358 | $54,905 | 0 | $0 |
| Parks and Recreation | 14 | $61,791 | $52,964 | 3 | $745 |
| Water Supply | 14 | $69,783 | $59,814 | 0 | $0 |
| Financial Administration | 9 | $50,201 | $66,935 | 0 | $0 |
| Sewerage | 9 | $79,439 | $105,919 | 0 | $0 |
| Other Government Administration | 8 | $61,064 | $91,596 | 0 | $0 |
| Solid Waste Management | 8 | $34,688 | $52,032 | 0 | $0 |
| Airports | 5 | $27,088 | $65,011 | 0 | $0 |
| Judicial and Legal | 5 | $36,932 | $88,637 | 1 | $70 |
| Police - Other | 3 | $13,102 | $52,408 | 4 | $973 |
| Correction | 3 | $12,088 | $48,352 | 0 | $0 |
| Housing and Community Development (Local) | 1 | $3,890 | $46,680 | 0 | $0 |
| Fire - Other | 0 | $0 | 1 | $259 | |
| Totals for Government | 201 | $1,112,804 | $66,436 | 9 | $2,047 |
Newton government finances - Expenditure in 2021 (per resident):
- Construction - General - Other: $2,161,000 ($117.50)
- Current Operations - Local Fire Protection: $5,625,000 ($305.84)
Police Protection: $4,602,000 ($250.22)
Regular Highways: $3,110,000 ($169.10)
Central Staff Services: $2,349,000 ($127.72)
Parks and Recreation: $2,300,000 ($125.05)
Water Utilities: $2,262,000 ($122.99)
Sewerage: $1,559,000 ($84.77)
Libraries: $1,522,000 ($82.75)
Housing and Community Development: $1,421,000 ($77.26)
Air Transportation: $1,324,000 ($71.99)
Judicial and Legal Services: $967,000 ($52.58)
Financial Administration: $922,000 ($50.13)
General Public Buildings: $371,000 ($20.17)
General - Other: $331,000 ($18.00)
- General - Interest on Debt: $2,271,000 ($123.48)
- Other Capital Outlay - General - Other: $2,066,000 ($112.33)
Sewerage: $234,000 ($12.72)
Water Utilities: $207,000 ($11.25)
Libraries: $185,000 ($10.06)
Police Protection: $26,000 ($1.41)
Parks and Recreation: $10,000 ($0.54)
- Total Salaries and Wages: $5,496,000 ($298.83)
Newton government finances - Revenue in 2021 (per resident):
- Charges - Sewerage: $7,361,000 ($400.23)
Other: $2,086,000 ($113.42)
Solid Waste Management: $1,973,000 ($107.27)
Air Transportation: $1,150,000 ($62.53)
Housing and Community Development: $392,000 ($21.31)
Miscellaneous Commercial Activities: $5,000 ($0.27)
- Federal Intergovernmental - Housing and Community Development: $1,338,000 ($72.75)
Air Transportation: $201,000 ($10.93)
- Miscellaneous - Interest Earnings: $1,671,000 ($90.85)
Special Assessments: $1,328,000 ($72.21)
General Revenue - Other: $881,000 ($47.90)
Fines and Forfeits: $711,000 ($38.66)
- Revenue - Water Utilities: $4,614,000 ($250.87)
- State Intergovernmental - Other: $763,000 ($41.49)
General Local Government Support: $536,000 ($29.14)
Highways: $418,000 ($22.73)
Sewerage: $17,000 ($0.92)
- Tax - Property: $9,795,000 ($532.57)
General Sales and Gross Receipts: $5,544,000 ($301.44)
Public Utilities Sales: $1,757,000 ($95.53)
Other Selective Sales: $285,000 ($15.50)
Other License: $229,000 ($12.45)
Newton government finances - Debt in 2021 (per resident):
- Long Term Debt - Beginning Outstanding - Unspecified Public Purpose: $67,568,000 ($3673.77)
Outstanding Unspecified Public Purpose: $61,350,000 ($3335.69)
Beginning Outstanding - Public Debt for Private Purpose: $16,869,000 ($917.19)
Outstanding Nonguaranteed - Industrial Revenue: $16,166,000 ($878.97)
Retired Unspecified Public Purpose: $6,218,000 ($338.08)
Retired Nonguaranteed - Public Debt for Private Purpose: $703,000 ($38.22)
Newton government finances - Cash and Securities in 2021 (per resident):
- Other Funds - Cash and Securities: $27,867,000 ($1515.17)
- Sinking Funds - Cash and Securities: $16,310,000 ($886.80)
| Businesses in Newton, KS | ||||
| Name | Count | Name | Count | |
|---|---|---|---|---|
| Ace Hardware | 1 | Kroger | 3 | |
| Applebee's | 1 | La-Z-Boy | 1 | |
| Arby's | 1 | Lane Furniture | 2 | |
| AutoZone | 1 | Little Caesars Pizza | 1 | |
| Best Western | 1 | Long John Silver's | 1 | |
| Burger King | 1 | MasterBrand Cabinets | 2 | |
| Chevrolet | 1 | McDonald's | 2 | |
| Comfort Inn | 1 | Papa John's Pizza | 1 | |
| Cricket Wireless | 1 | Pizza Hut | 1 | |
| Curves | 1 | RadioShack | 1 | |
| Dairy Queen | 1 | Rue21 | 1 | |
| Days Inn | 1 | SONIC Drive-In | 2 | |
| DressBarn | 1 | Sears | 1 | |
| Dressbarn | 1 | Subway | 2 | |
| Econo Lodge | 1 | T-Mobile | 2 | |
| Famous Footwear | 1 | Taco Bell | 1 | |
| FedEx | 2 | U-Haul | 3 | |
| Ford | 1 | UPS | 4 | |
| GameStop | 1 | Walgreens | 1 | |
| H&R Block | 1 | Walmart | 1 | |
| Jones New York | 1 | Wendy's | 1 | |
| KFC | 1 | |||
Strongest AM radio stations in Newton:
- KJRG (950 AM; 0 kW; NEWTON, KS)
- KFTI (1070 AM; 10 kW; WICHITA, KS; Owner: JOURNAL BROADCAST CORPORATION)
- KMYR (1410 AM; 5 kW; WICHITA, KS; Owner: AGAPE COMMUNICATIONS, INC.)
- KQAM (1480 AM; 5 kW; WICHITA, KS; Owner: ABC, INC.)
- KFH (1330 AM; 5 kW; WICHITA, KS; Owner: ENTERCOM WICHITA LICENSE, LLC)
- KRMG (740 AM; 50 kW; TULSA, OK; Owner: CXR HOLDINGS, INC.)
- WHB (810 AM; 50 kW; KANSAS CITY, MO; Owner: UNION BROADCASTING, INC.)
- KFAQ (1170 AM; 50 kW; TULSA, OK; Owner: JOURNAL BROADCAST CORPORATION)
- KRVN (880 AM; 50 kW; LEXINGTON, NE; Owner: NEBRASKA RURAL RADIO ASSOCIATION)
- KSAL (1150 AM; 5 kW; SALINA, KS; Owner: EBC INC.)
- KNSS (1240 AM; 1 kW; WICHITA, KS; Owner: ENTERCOM WICHITA LICENSE, LLC)
- KOIL (1020 AM; 50 kW; PLATTSMOUTH, NE; Owner: WAITT RADIO, INC.)
- KGGF (690 AM; 10 kW; COFFEYVILLE, KS; Owner: KGGF-KUSN, INC.)
Strongest FM radio stations in Newton:
- KMXW (92.3 FM; NEWTON, KS; Owner: JOURNAL BROADCAST CORPORATION)
- KCFN (91.1 FM; WICHITA, KS; Owner: AMERICAN FAMILY ASSOCIATION)
- KFDI-FM (101.3 FM; WICHITA, KS; Owner: JOURNAL BROADCAST CORPORATION)
- KBCU (88.1 FM; NORTH NEWTON, KS; Owner: BETHEL COLLEGE)
- KZSN (102.1 FM; HUTCHINSON, KS; Owner: CAPSTAR TX LIMITED PARTNERSHIP)
- KICT-FM (95.1 FM; WICHITA, KS; Owner: JOURNAL BROADCAST CORPORATION)
- KRBB (97.9 FM; WICHITA, KS; Owner: CAPSTAR TX LIMITED PARTNERSHIP)
- KFBZ (105.3 FM; HAYSVILLE, KS; Owner: ENTERCOM WICHITA LICENSE, LLC)
- KEYN-FM (103.7 FM; WICHITA, KS; Owner: ENTERCOM WICHITA LICENSE, LLC)
- KHCC-FM (90.1 FM; HUTCHINSON, KS; Owner: HUTCHINSON COMMUNITY JR. COLLEGE)
- KKRD (107.3 FM; WICHITA, KS; Owner: CAPSTAR TX LIMITED PARTNERSHIP)
- KYQQ (106.5 FM; ARKANSAS CITY, KS; Owner: JOURNAL BROADCAST CORPORATION)
- KMUW (89.1 FM; WICHITA, KS; Owner: WICHITA STATE UNIVERSITY)
- KRZZ-FM (96.3 FM; DERBY, KS; Owner: CAPSTAR TX LIMITED PARTNERSHIP)
- KTLI (99.1 FM; EL DORADO, KS; Owner: ADONAI RADIO GROUP, INC.)
- KFXJ (104.5 FM; AUGUSTA, KS; Owner: JOURNAL BROADCAST CORPORATION)
- KXKU (106.1 FM; LYONS, KS; Owner: AD ASTRA PER ASPERA B/CING, INC.)
TV broadcast stations around Newton:
- KSCC (Channel 36; HUTCHINSON, KS; Owner: MERCURY BROADCASTING COMPANY, INC.)
- KSNW (Channel 3; WICHITA, KS; Owner: EMMIS TELEVISION LICENSE CORPORATION OF WICHITA)
- KWCH-TV (Channel 12; HUTCHINSON, KS; Owner: MEDIA GENERAL BROADCASTING OF SO. CAROLINA HOLDINGS, INC.)
- KWCV (Channel 33; WICHITA, KS; Owner: WLBB BROADCASTING, L.L.C.)
- KSAS-TV (Channel 24; WICHITA, KS; Owner: CLEAR CHANNEL BROADCASTING LICENSES, INC.)
- KAKE-TV (Channel 10; WICHITA, KS; Owner: GRAY MIDAMERICA TV LICENSEE CORP.)
- KPTS (Channel 8; HUTCHINSON, KS; Owner: KANSAS PUBLIC TELECOMMUNICATIONS SERVICE, INC.)
- KCTU-LP (Channel 55; WICHITA, KS; Owner: RIVER CITY BROADCASTING CORP.)
- KSMI-LP (Channel 51; WICHITA, KS; Owner: RIVER CITY BROADCASTING CORP.)
- KTQW-LP (Channel 53; WICHITA, KS; Owner: KNOWLEDGE L.C.)
- KFVT-LP (Channel 40; WICHITA, KS; Owner: LOCKE SUPPLY CO.)
- K59DA (Channel 59; WICHITA, KS; Owner: TRINITY BROADCASTING NETWORK)
- K15DD (Channel 15; WICHITA, KS; Owner: VENTANA TELEVISION, INC.)
- National Bridge Inventory (NBI) Statistics
- 129Number of bridges
- 1,837ft / 560mTotal length
- $1,903,000Total costs
- 467,908Total average daily traffic
- 84,723Total average daily truck traffic
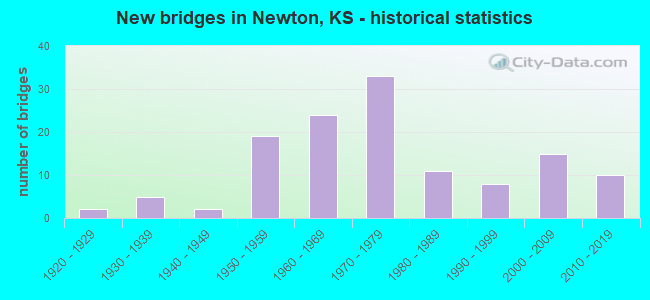
- New bridges - historical statistics
- 21920-1929
- 51930-1939
- 21940-1949
- 191950-1959
- 241960-1969
- 331970-1979
- 111980-1989
- 81990-1999
- 152000-2009
- 102010-2019
FCC Registered Antenna Towers: 119 (See the full list of FCC Registered Antenna Towers)
FCC Registered Commercial Land Mobile Towers: 3 (See the full list of FCC Registered Commercial Land Mobile Towers in Newton, KS)
FCC Registered Private Land Mobile Towers: 1 (See the full list of FCC Registered Private Land Mobile Towers)
FCC Registered Broadcast Land Mobile Towers: 33 (See the full list of FCC Registered Broadcast Land Mobile Towers)
FCC Registered Microwave Towers: 38 (See the full list of FCC Registered Microwave Towers in this town)
FCC Registered Paging Towers: 2 (See the full list of FCC Registered Paging Towers)
FCC Registered Maritime Coast & Aviation Ground Towers: 4 (See the full list of FCC Registered Maritime Coast & Aviation Ground Towers)
FCC Registered Amateur Radio Licenses: 125 (See the full list of FCC Registered Amateur Radio Licenses in Newton)
FAA Registered Aircraft Manufacturers and Dealers: 6 (See the full list of FAA Registered Manufacturers and Dealers in Newton)
FAA Registered Aircraft: 47 (See the full list of FAA Registered Aircraft)
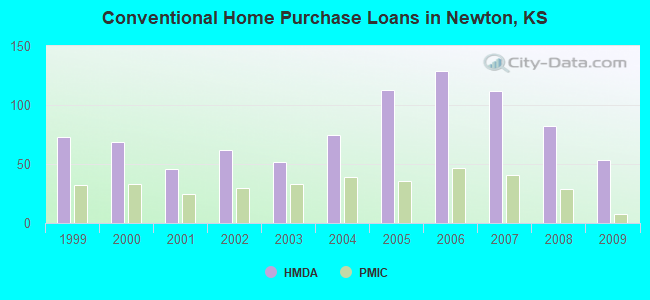
| Home Mortgage Disclosure Act Aggregated Statistics For Year 2009 (Based on 6 partial tracts) | ||||||||||||||
| A) FHA, FSA/RHS & VA Home Purchase Loans | B) Conventional Home Purchase Loans | C) Refinancings | D) Home Improvement Loans | E) Loans on Dwellings For 5+ Families | F) Non-occupant Loans on < 5 Family Dwellings (A B C & D) | G) Loans On Manufactured Home Dwelling (A B C & D) | ||||||||
|---|---|---|---|---|---|---|---|---|---|---|---|---|---|---|
| Number | Average Value | Number | Average Value | Number | Average Value | Number | Average Value | Number | Average Value | Number | Average Value | Number | Average Value | |
| LOANS ORIGINATED | 34 | $96,136 | 53 | $78,607 | 116 | $93,943 | 26 | $36,636 | 1 | $225,700 | 31 | $57,665 | 1 | $36,900 |
| APPLICATIONS APPROVED, NOT ACCEPTED | 1 | $31,310 | 3 | $81,183 | 5 | $132,182 | 1 | $15,030 | 0 | $0 | 0 | $0 | 1 | $42,190 |
| APPLICATIONS DENIED | 4 | $115,588 | 8 | $69,305 | 23 | $94,410 | 12 | $11,828 | 1 | $176,400 | 3 | $34,377 | 1 | $89,670 |
| APPLICATIONS WITHDRAWN | 4 | $88,572 | 1 | $171,760 | 25 | $96,885 | 3 | $15,360 | 0 | $0 | 1 | $31,700 | 0 | $0 |
| FILES CLOSED FOR INCOMPLETENESS | 1 | $70,800 | 0 | $0 | 3 | $90,377 | 0 | $0 | 0 | $0 | 0 | $0 | 0 | $0 |
Detailed HMDA statistics for the following Tracts: 0301.00 , 0302.00, 0303.00, 0304.00, 0306.00
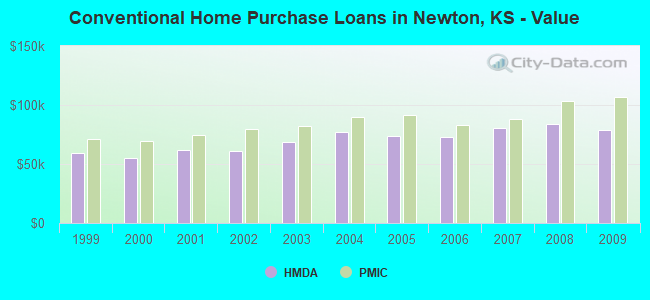
| Private Mortgage Insurance Companies Aggregated Statistics For Year 2009 (Based on 6 partial tracts) | ||||||
| A) Conventional Home Purchase Loans | B) Refinancings | C) Non-occupant Loans on < 5 Family Dwellings (A & B) | ||||
|---|---|---|---|---|---|---|
| Number | Average Value | Number | Average Value | Number | Average Value | |
| LOANS ORIGINATED | 8 | $106,765 | 8 | $117,839 | 1 | $41,020 |
| APPLICATIONS APPROVED, NOT ACCEPTED | 1 | $234,860 | 2 | $108,665 | 0 | $0 |
| APPLICATIONS DENIED | 0 | $0 | 1 | $79,260 | 0 | $0 |
| APPLICATIONS WITHDRAWN | 0 | $0 | 0 | $0 | 0 | $0 |
| FILES CLOSED FOR INCOMPLETENESS | 0 | $0 | 0 | $0 | 0 | $0 |
Detailed PMIC statistics for the following Tracts: 0301.00 , 0302.00, 0303.00, 0304.00, 0306.00
2002 - 2018 National Fire Incident Reporting System (NFIRS) incidents
- Fire incident types reported to NFIRS in Newton, KS
- 83952.5%Outside Fires
- 47729.8%Structure Fires
- 20412.8%Mobile Property/Vehicle Fires
- 794.9%Other
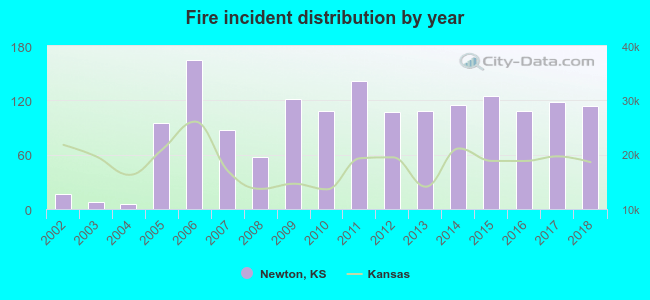 Based on the data from the years 2002 - 2018 the average number of fire incidents per year is 94. The highest number of reported fire incidents - 164 took place in 2006, and the least - 5 in 2004. The data has an increasing trend.
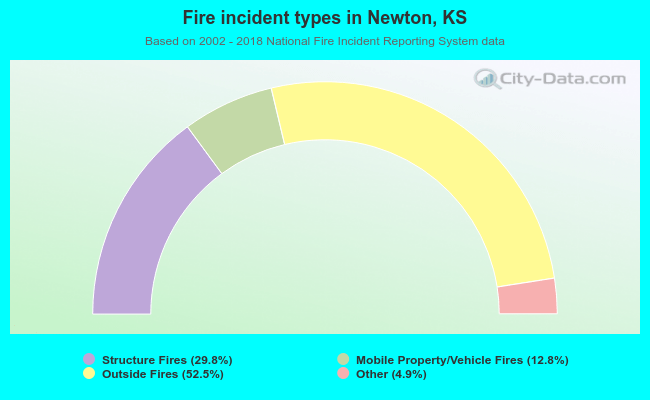 When looking into fire subcategories, the most incidents belonged to: Outside Fires (52.5%), and Structure Fires (29.8%).
Fire-safe hotels and motels in Newton, Kansas:
- Econo Lodge, 1620 E 2ND St, Newton, Kansas 67114 , Phone: (316) 283-7611, Fax: (316) 283-1140
- Holiday Inn Express And Suites, 1430 E Broadway Ct, Newton, Kansas 67114 , Phone: (316) 804-7040, Fax: (316) 804-7074
| Most common first names in Newton, KS among deceased individuals | ||
| Name | Count | Lived (average) |
|---|---|---|
| John | 148 | 79.8 years |
| Mary | 138 | 82.6 years |
| William | 101 | 78.9 years |
| Helen | 83 | 83.0 years |
| Anna | 81 | 85.4 years |
| Ruth | 75 | 83.6 years |
| James | 69 | 71.3 years |
| Henry | 69 | 81.7 years |
| Charles | 65 | 77.2 years |
| Robert | 63 | 74.8 years |
| Most common last names in Newton, KS among deceased individuals | ||
| Last name | Count | Lived (average) |
|---|---|---|
| Schmidt | 104 | 79.2 years |
| Smith | 75 | 75.9 years |
| Unruh | 67 | 82.7 years |
| Miller | 63 | 74.9 years |
| Regier | 48 | 82.4 years |
| Schroeder | 37 | 81.2 years |
| Brown | 33 | 81.3 years |
| Davis | 32 | 81.6 years |
| Voth | 31 | 79.4 years |
| Jones | 31 | 82.1 years |
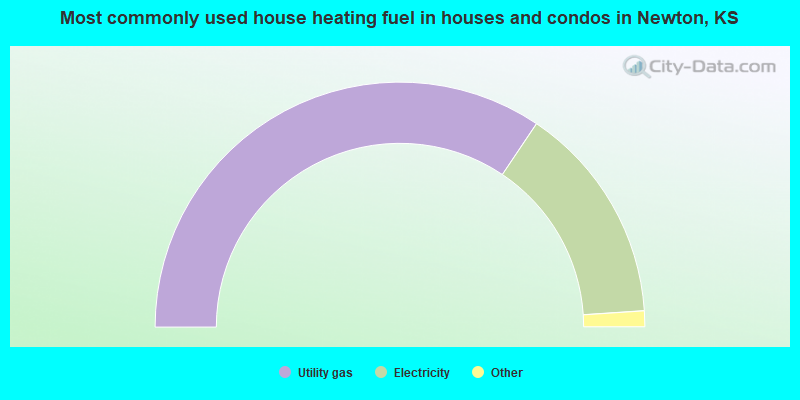
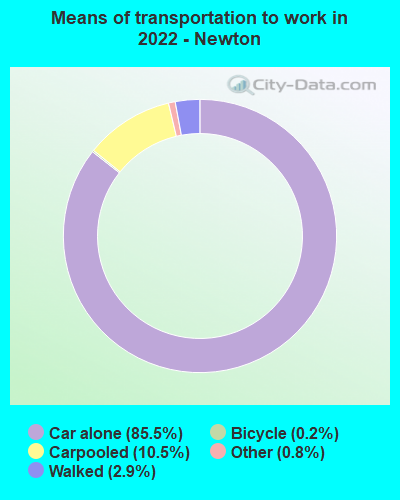
- 68.9%Utility gas
- 29.1%Electricity
- 1.7%Wood
- 0.3%Bottled, tank, or LP gas
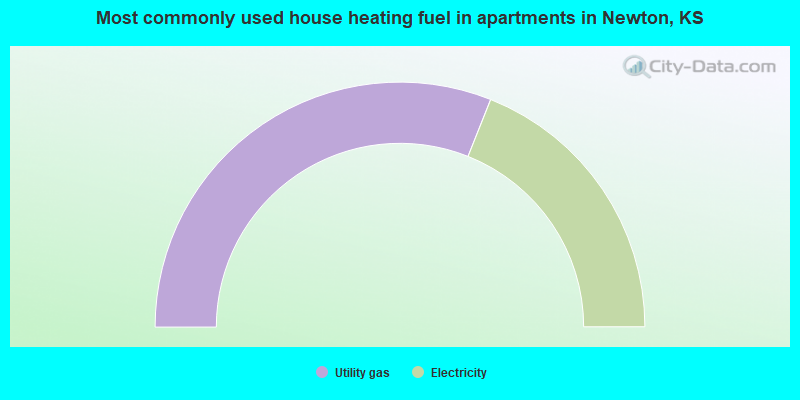
- 62.1%Utility gas
- 37.9%Electricity
Newton compared to Kansas state average:
- Unemployed percentage significantly below state average.
- Black race population percentage below state average.
- Foreign-born population percentage below state average.
- Length of stay since moving in above state average.
Newton on our top lists:
- #47 on the list of "Top 101 cities with the largest percentage of people in residential treatment centers for emotionally disturbed children (population 1,000+)"
- #78 on the list of "Top 101 cities with the largest percentage of people in hospitals or wards for drug/alcohol abuse (population 1,000+)"
- #33 (67117) on the list of "Top 101 zip codes with the largest charity contributions deductions as a percentage of AGI in 2012 (pop 1,000+)"

|
|
Total of 149 patent applications in 2008-2024.