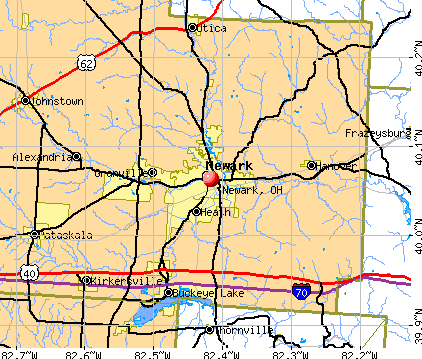
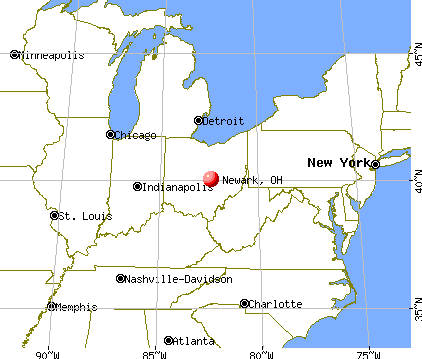
Newark, Ohio
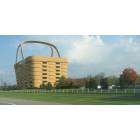
Newark: Longaberger Basket Building Rt. 16, Newark Ohio

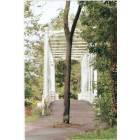
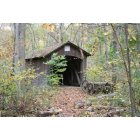
Newark: Dawes

Newark: Midland Theater, Newark Ohio - Mark Twain Bronze Statue
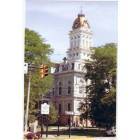
Newark: Licking County Courthouuse in Newark, Ohio
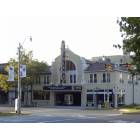
Newark: Midland Theater Downtown Newark, Ohio

Newark: Bronze Statues Downtown Newark, Ohio

Newark: Courthouse Downtown Newark, Ohio
Newark: Bike Path Bridge over Racoon Creek - Newark,Ohio

Newark: The Japanese Gardens at Dawes Arboretum
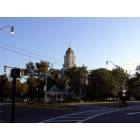
Newark: Courthouse Downtown Newark, Ohio
Newark: Boy Scout Bridge
- see
13
more - add
your
Submit your own pictures of this city and show them to the world
- OSM Map
- General Map
- Google Map
- MSN Map
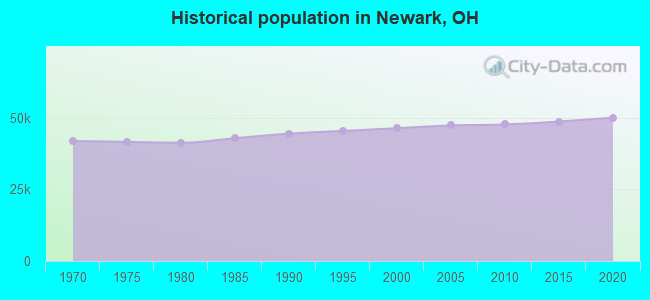
Population change since 2000: +9.7%
 |
| Males: 24,737 | |
| Females: 26,026 |
| Median resident age: | 38.8 years |
| Ohio median age: | 39.9 years |
Zip codes: 43055.
| Newark: | $54,957 |
| OH: | $65,720 |
Estimated per capita income in 2022: $31,041 (it was $17,819 in 2000)
Newark city income, earnings, and wages data
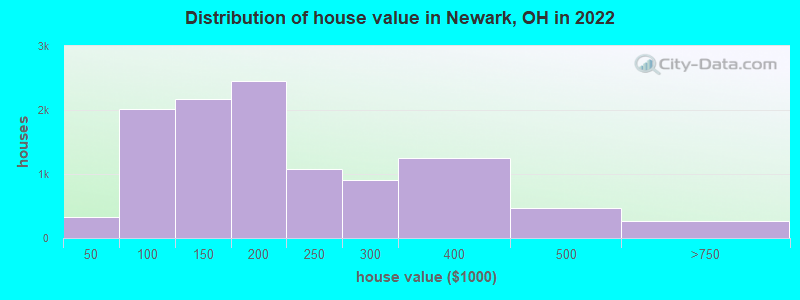
Estimated median house or condo value in 2022: $185,855 (it was $84,900 in 2000)
| Newark: | $185,855 |
| OH: | $204,100 |
Mean prices in 2022: all housing units: $191,981; detached houses: $192,474; townhouses or other attached units: $244,845; in 2-unit structures: $162,573; in 3-to-4-unit structures: $211,891; in 5-or-more-unit structures: $100,821; mobile homes: $45,646
Median gross rent in 2022: $863.
(14.7% for White Non-Hispanic residents, 44.2% for Black residents, 14.9% for Hispanic or Latino residents, 1.7% for American Indian residents, 100.0% for Native Hawaiian and other Pacific Islander residents, 11.3% for other race residents, 28.0% for two or more races residents)
Detailed information about poverty and poor residents in Newark, OH

Compare current foreclosures in Newark, OH:
| Photo | Address | Area | Beds / Baths | Price | Details |
|---|---|---|---|---|---|

|
#1
Cypress Dr
Newark, OH 43055
|
960 sq. feet
|
1 baths 3 beds |
show details | |

|
#2
Decrow Ave
Newark, OH 43055
|
1,116 sq. feet
|
2 baths 3 beds |
show details | |

|
#3
Rosehill Ave
Newark, OH 43055
|
1,827 sq. feet
|
1 baths 3 beds |
show details | |

|
#4
Boyleston Ave
Newark, OH 43055
|
1,385 sq. feet
|
1 baths 3 beds |
show details | |

|
#5
Moull St
Newark, OH 43055
|
1,192 sq. feet
|
1 baths 3 beds |
show details | |

|
#6
S 26th St
Newark, OH 43055
|
988 sq. feet
|
1 baths 2 beds |
show details | |

|
#7
Neal Ave
Newark, OH 43055
|
1,338 sq. feet
|
1 baths 2 beds |
show details | |

|
#8
S 30th St
Newark, OH 43055
|
1,093 sq. feet
|
1 baths 2 beds |
show details | |

|
#9
N Pine St
Newark, OH 43055
|
1,408 sq. feet
|
1 baths 2 beds |
show details | |

|
#10
W Main St
Newark, OH 43055
|
1,978 sq. feet
|
1 baths 4 beds |
show details |
| Photo | Address | Area | Beds / Baths | Price | Details |
|---|---|---|---|---|---|

|
#11
Marion Rd
Newark, OH 43055
|
1,352 sq. feet
|
2 baths 3 beds |
show details | |

|
#12
Harlech Dr
Newark, OH 43055
|
1,916 sq. feet
|
2 baths 4 beds |
show details | |

|
#13
Granville Rd
Newark, OH 43055
|
1,682 sq. feet
|
2 baths 2 beds |
show details | |

|
#14
Parkway Dr
Newark, OH 43055
|
2,080 sq. feet
|
2 baths 3 beds |
show details | |

|
#15
New Haven Ave
Newark, OH 43055
|
900 sq. feet
|
1 baths 2 beds |
show details | |

|
#16
Midway Dr
Newark, OH 43055
|
1,370 sq. feet
|
2 baths 2 beds |
show details | |

|
#17
Cumberland St
Newark, OH 43055
|
1,213 sq. feet
|
1 baths 3 beds |
show details | |

|
#18
S 35th St
Newark, OH 43055
|
938 sq. feet
|
1 baths 3 beds |
show details | |

|
#19
Western Ave
Newark, OH 43055
|
1,834 sq. feet
|
1 baths 4 beds |
show details | |

|
#20
Clarendon St
Newark, OH 43055
|
952 sq. feet
|
1 baths 2 beds |
show details |
| Photo | Address | Area | Beds / Baths | Price | Details |
|---|---|---|---|---|---|

|
#21
Independence Dr
Newark, OH 43055
|
1,838 sq. feet
|
2 baths 4 beds |
show details | |

|
#22
Sherwood Downs Rd E
Newark, OH 43055
|
1,992 sq. feet
|
2 baths 4 beds |
show details | |

|
#23
Wilkins Run Rd NE
Newark, OH 43055
|
2,052 sq. feet
|
2 baths 3 beds |
show details | |

|
#24
Reynolds Rd
Newark, OH 43055
|
1,946 sq. feet
|
1 baths 3 beds |
show details | |

|
#25
Pheasant Run Dr
Newark, OH 43055
|
1,710 sq. feet
|
2 baths 4 beds |
show details | |

|
#26
N Quentin Rd
Newark, OH 43055
|
966 sq. feet
|
2 baths 4 beds |
show details | |

|
#27
N Lake Dr
Newark, OH 43055
|
1,204 sq. feet
|
1 baths 3 beds |
show details | |

|
#28
Boyleston Ave
Newark, OH 43055
|
1,165 sq. feet
|
1 baths 3 beds |
show details | |

|
#29
Harding Ct
Newark, OH 43055
|
1,948 sq. feet
|
1 baths 3 beds |
show details | |

|
#30
Granville St
Newark, OH 43055
|
2,148 sq. feet
|
2 baths 3 beds |
show details |
| Photo | Address | Area | Beds / Baths | Price | Details |
|---|---|---|---|---|---|

|
#31
Courtney Dr
Newark, OH 43055
|
1,280 sq. feet
|
1 baths 3 beds |
show details | |

|
#32
Mount Vernon Rd
Newark, OH 43055
|
1,832 sq. feet
|
1 baths 3 beds |
show details | |

|
#33
S Hunters Dr
Newark, OH 43055
|
1,983 sq. feet
|
2 baths 3 beds |
show details | |

|
#34
Sunrise Dr
Newark, OH 43055
|
1,077 sq. feet
|
2 baths 2 beds |
show details | |

|
#35
W Locust St
Newark, OH 43055
|
1,636 sq. feet
|
2 baths 3 beds |
show details | |

|
#36
Horns Hill Rd
Newark, OH 43055
|
2,414 sq. feet
|
2 baths 3 beds |
show details | |

|
#37
Abby Dr
Newark, OH 43055
|
1,624 sq. feet
|
3 baths 4 beds |
show details | |

|
#38
Sherwood Downs Rd S
Newark, OH 43055
|
2,132 sq. feet
|
2 baths 3 beds |
show details | |

|
#39
W Church St
Newark, OH 43055
|
2,100 sq. feet
|
2 baths 2 beds |
show details | |

|
#40
N 10th St
Newark, OH 43055
|
1,107 sq. feet
|
1 baths 2 beds |
show details |
| Photo | Address | Area | Beds / Baths | Price | Details |
|---|---|---|---|---|---|

|
#41
Fairmont Ave
Newark, OH 43055
|
720 sq. feet
|
1 baths 2 beds |
show details | |

|
#42
Eutreva Dr
Newark, OH 43055
|
2,086 sq. feet
|
2 baths 4 beds |
show details | |

|
#43
Central Ave
Newark, OH 43055
|
1,833 sq. feet
|
1 baths 3 beds |
show details | |

|
#44
Sherwood Downs Rd S
Newark, OH 43055
|
1,540 sq. feet
|
1 baths 3 beds |
show details | |

|
#45
Clarendon St
Newark, OH 43055
|
1,400 sq. feet
|
1 baths 3 beds |
show details | |

|
#46
Northpointe Ln
Newark, OH 43055
|
1,528 sq. feet
|
3 baths 3 beds |
show details | |

|
#47
Central Ave
Newark, OH 43055
|
1,090 sq. feet
|
1 baths 2 beds |
show details | |

|
#48
N Fulton Ave
Newark, OH 43055
|
672 sq. feet
|
1 baths 2 beds |
show details | |

|
#49
Lisa Cir
Newark, OH 43055
|
1,384 sq. feet
|
1 baths 3 beds |
show details | |

|
Check over 1 million property listings on Foreclosure.com!
|
browse all offers | |||


- 42,78884.3%White alone
- 4,0668.0%Two or more races
- 1,4342.8%Hispanic
- 1,1802.3%Black alone
- 5571.1%Asian alone
- 3740.7%Other race alone
- 760.1%American Indian alone
- 220.04%Native Hawaiian and Other
Pacific Islander alone
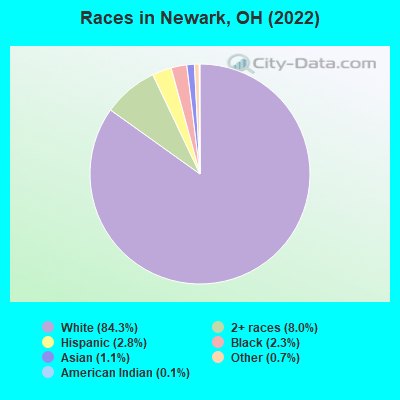
Races in Newark detailed stats: ancestries, foreign born residents, place of birth
According to our research of Ohio and other state lists, there were 187 registered sex offenders living in Newark, Ohio as of May 04, 2024.
The ratio of all residents to sex offenders in Newark is 260 to 1.
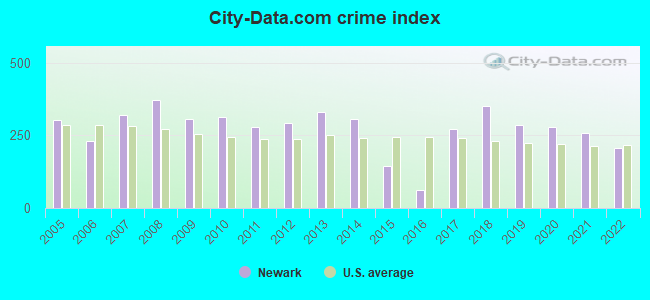
The City-Data.com crime index weighs serious crimes and violent crimes more heavily. Higher means more crime, U.S. average is 246.1. It adjusts for the number of visitors and daily workers commuting into cities.
- means the value is smaller than the state average.- means the value is about the same as the state average.
- means the value is bigger than the state average.
- means the value is much bigger than the state average.
Crime rate in Newark detailed stats: murders, rapes, robberies, assaults, burglaries, thefts, arson
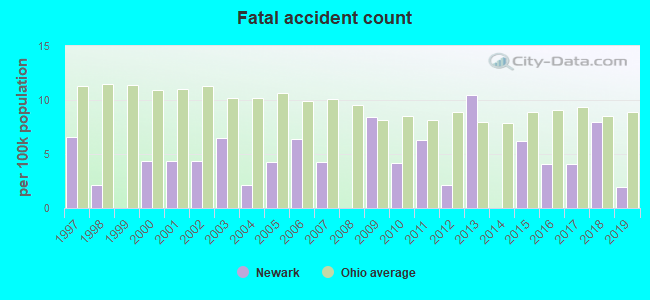
Full-time law enforcement employees in 2021, including police officers: 87 (76 officers - 68 male; 8 female).
| Officers per 1,000 residents here: | 1.49 |
| Ohio average: | 2.31 |
 Recent articles from our blog. Our writers, many of them Ph.D. graduates or candidates, create easy-to-read articles on a wide variety of topics.

 | Will Newark Officially Become It's Own MSA? (1 reply) |
| Will Columbus become largest Ohio metro? (887 replies) |
| Will Columbus, OH surpass Indianapolis, IN in population in the next 20 years? (174 replies) |
| Newark Population Reaches 49,134 in 2016 (9 replies) |
| Heath/Newark (2 replies) |
| Best Special Education schools on Northwest suburbs to Newark? (3 replies) |
Latest news from Newark, OH collected exclusively by city-data.com from local newspapers, TV, and radio stations
Ancestries: American (17.2%), German (17.0%), English (10.5%), Irish (9.5%), Italian (4.6%), Scottish (3.5%).
Current Local Time: EST time zone
Incorporated in 1997
Elevation: 829 feet
Land area: 19.6 square miles.
Population density: 2,596 people per square mile (average).
1,218 residents are foreign born (1.0% Asia, 0.8% Latin America, 0.3% Europe).
| This city: | 2.4% |
| Ohio: | 4.9% |
Median real estate property taxes paid for housing units with mortgages in 2022: $2,032 (1.1%)
Median real estate property taxes paid for housing units with no mortgage in 2022: $1,668 (0.9%)
Nearest city with pop. 50,000+: Columbus, OH  (30.9 miles , pop. 711,470).
Nearest city with pop. 1,000,000+: Chicago, IL (301.1 miles , pop. 2,896,016).
Nearest cities:
), ), ), ), ), )Latitude: 40.06 N, Longitude: 82.42 W
Daytime population change due to commuting: -220 (-0.4%)
Workers who live and work in this city: 10,512 (44.9%)
Area code: 740
Newark tourist attractions:
Newark, Ohio accommodation & food services, waste management - Economy and Business Data
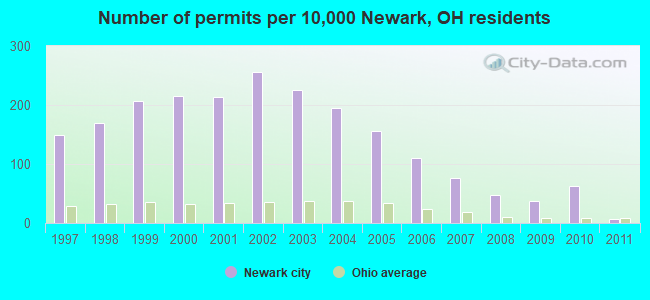
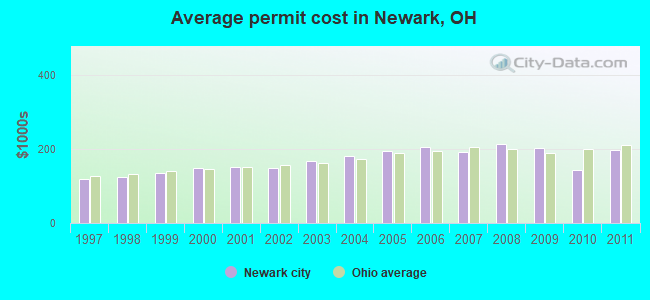
Single-family new house construction building permits:
- 2011: 27 buildings, average cost: $196,500
- 2010: 289 buildings, average cost: $142,300
- 2009: 177 buildings, average cost: $203,000
- 2008: 218 buildings, average cost: $212,100
- 2007: 356 buildings, average cost: $191,700
- 2006: 508 buildings, average cost: $205,500
- 2005: 722 buildings, average cost: $194,600
- 2004: 903 buildings, average cost: $180,000
- 2003: 1041 buildings, average cost: $167,000
- 2002: 1184 buildings, average cost: $149,400
- 2001: 985 buildings, average cost: $151,400
- 2000: 994 buildings, average cost: $147,500
- 1999: 958 buildings, average cost: $135,200
- 1998: 789 buildings, average cost: $125,200
- 1997: 689 buildings, average cost: $118,300
| Here: | 3.0% |
| Ohio: | 3.1% |
Population change in the 1990s: +1,546 (+3.5%).
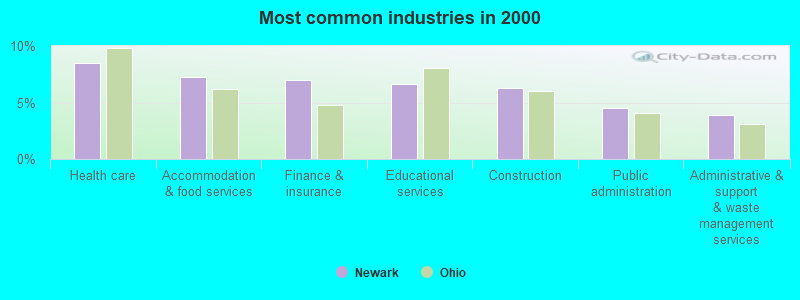
- Health care (8.5%)
- Accommodation & food services (7.2%)
- Finance & insurance (7.0%)
- Educational services (6.6%)
- Construction (6.3%)
- Public administration (4.5%)
- Administrative & support & waste management services (3.9%)
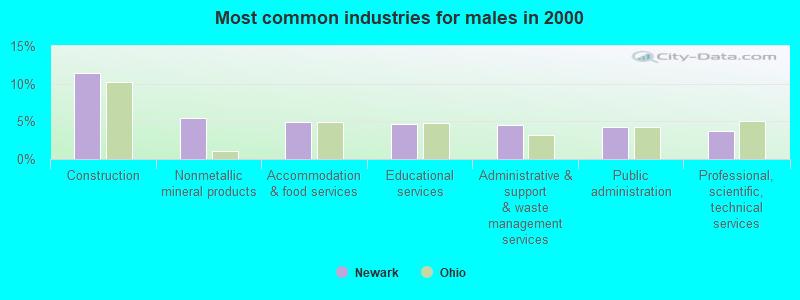
- Construction (11.5%)
- Nonmetallic mineral products (5.4%)
- Accommodation & food services (5.0%)
- Educational services (4.6%)
- Administrative & support & waste management services (4.5%)
- Public administration (4.2%)
- Professional, scientific, technical services (3.7%)
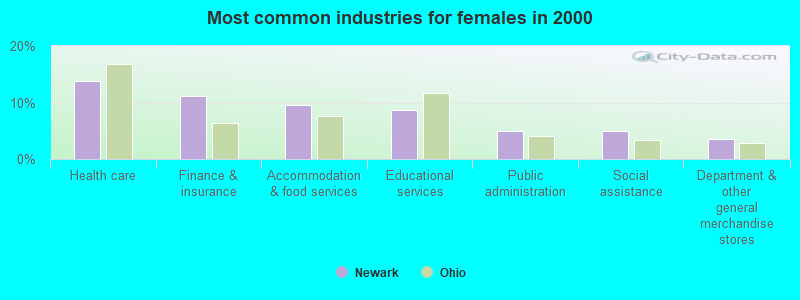
- Health care (13.8%)
- Finance & insurance (11.1%)
- Accommodation & food services (9.6%)
- Educational services (8.7%)
- Public administration (4.9%)
- Social assistance (4.9%)
- Department & other general merchandise stores (3.6%)
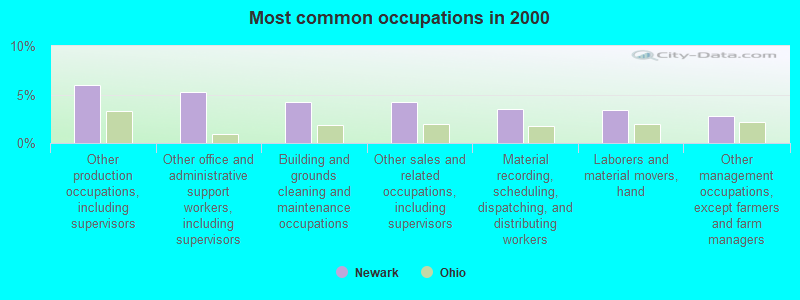
- Other production occupations, including supervisors (6.0%)
- Other office and administrative support workers, including supervisors (5.2%)
- Building and grounds cleaning and maintenance occupations (4.3%)
- Other sales and related occupations, including supervisors (4.2%)
- Material recording, scheduling, dispatching, and distributing workers (3.5%)
- Laborers and material movers, hand (3.4%)
- Other management occupations, except farmers and farm managers (2.8%)
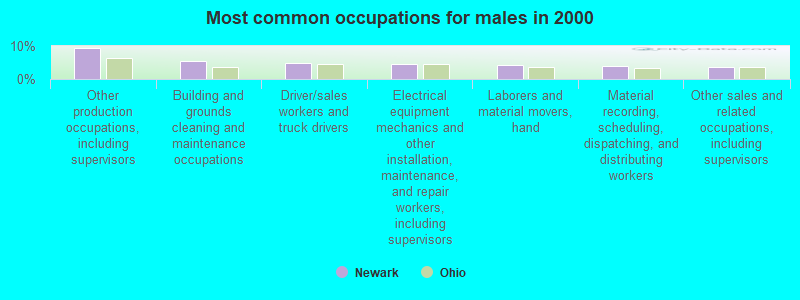
- Other production occupations, including supervisors (9.3%)
- Building and grounds cleaning and maintenance occupations (5.4%)
- Driver/sales workers and truck drivers (5.0%)
- Electrical equipment mechanics and other installation, maintenance, and repair workers, including supervisors (4.7%)
- Laborers and material movers, hand (4.4%)
- Material recording, scheduling, dispatching, and distributing workers (3.9%)
- Other sales and related occupations, including supervisors (3.6%)

- Other office and administrative support workers, including supervisors (8.3%)
- Secretaries and administrative assistants (5.0%)
- Other sales and related occupations, including supervisors (4.9%)
- Cashiers (4.7%)
- Preschool, kindergarten, elementary, and middle school teachers (3.6%)
- Information and record clerks, except customer service representatives (3.3%)
- Customer service representatives (3.3%)
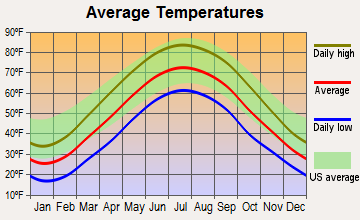
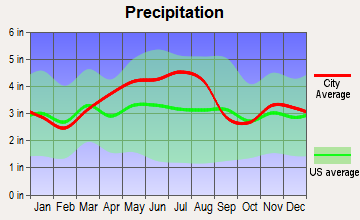
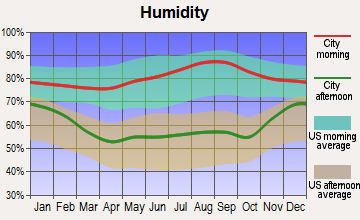
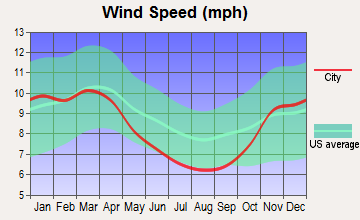
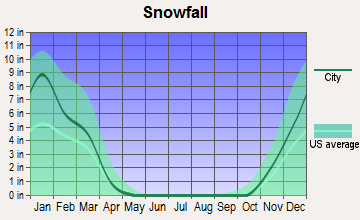
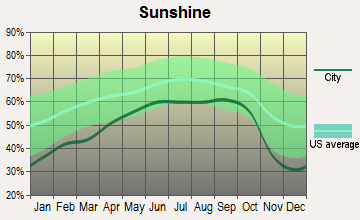
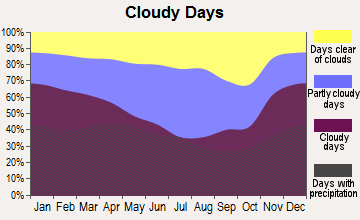
Average climate in Newark, Ohio
Based on data reported by over 4,000 weather stations
|
|


(lower is better)
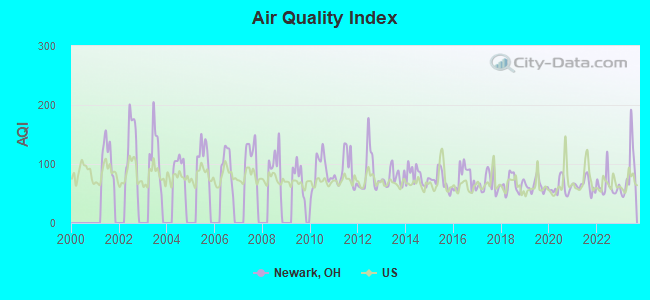
Air Quality Index (AQI) level in 2023 was 86.3. This is about average.
| City: | 86.3 |
| U.S.: | 72.6 |
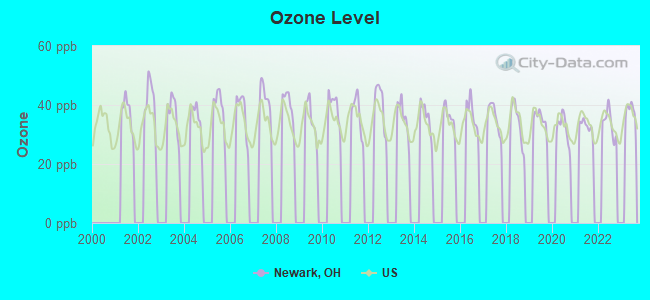
Ozone [ppb] level in 2022 was 33.8. This is about average. Closest monitor was 19.6 miles away from the city center.
| City: | 33.8 |
| U.S.: | 33.3 |
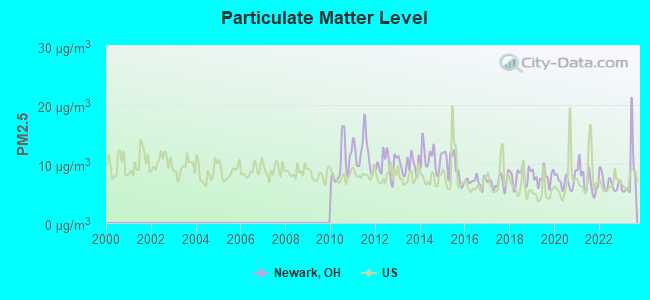
Particulate Matter (PM2.5) [µg/m3] level in 2023 was 8.34. This is about average. Closest monitor was 21.2 miles away from the city center.
| City: | 8.34 |
| U.S.: | 8.11 |
Tornado activity:
Newark-area historical tornado activity is slightly below Ohio state average. It is 4% greater than the overall U.S. average.
On 5/10/1973, a category F3 (max. wind speeds 158-206 mph) tornado 10.9 miles away from the Newark city center injured 8 people and caused between $500 and $5000 in damages.
On 5/31/1985, a category F3 tornado 17.7 miles away from the city center killed one person and injured 20 people and caused between $5,000,000 and $50,000,000 in damages.
Earthquake activity:
Newark-area historical earthquake activity is significantly above Ohio state average. It is 15% smaller than the overall U.S. average.On 9/25/1998 at 19:52:52, a magnitude 5.2 (4.8 MB, 4.3 MS, 5.2 LG, 4.5 MW, Depth: 3.1 mi, Class: Moderate, Intensity: VI - VII) earthquake occurred 144.8 miles away from the city center
On 7/27/1980 at 18:52:21, a magnitude 5.2 (5.1 MB, 4.7 MS, 5.0 UK, 5.2 UK) earthquake occurred 152.4 miles away from Newark center
On 8/23/2011 at 17:51:04, a magnitude 5.8 (5.8 MW, Depth: 3.7 mi) earthquake occurred 283.2 miles away from the city center
On 1/31/1986 at 16:46:43, a magnitude 5.0 (5.0 MB) earthquake occurred 125.1 miles away from Newark center
On 7/12/1986 at 08:19:37, a magnitude 4.5 (4.5 MB, Class: Light, Intensity: IV - V) earthquake occurred 108.2 miles away from Newark center
On 9/7/1988 at 02:28:09, a magnitude 4.6 (4.5 MB, 4.6 LG) earthquake occurred 154.2 miles away from the city center
Magnitude types: regional Lg-wave magnitude (LG), body-wave magnitude (MB), surface-wave magnitude (MS), moment magnitude (MW)
Natural disasters:
The number of natural disasters in Licking County (15) is near the US average (15).Major Disasters (Presidential) Declared: 11
Emergencies Declared: 3
Causes of natural disasters: Storms: 9, Floods: 7, Tornadoes: 3, Mudslides: 2, Winds: 2, Blizzard: 1, Heavy Rain: 1, Hurricane: 1, Landslide: 1, Snow: 1, Snowstorm: 1, Tropical Depression: 1, Winter Storm: 1, Other: 1 (Note: some incidents may be assigned to more than one category).
Main business address for: PARK NATIONAL CORP /OH/ (NATIONAL COMMERCIAL BANKS).
Hospitals in Newark:
- CSS HOME II (1960 REDDINGTON ROAD)
- CSS HOME V (899 WELLS AVENUE)
- HOSPICE OF CENTRAL OHIO (2269 CHERRY VALLEY ROAD)
- LICKING MEMORIAL HOSPITAL (Voluntary non-profit - Private, provides emergency services, 1320 WEST MAIN STREET)
- MEDICAL CENTER OF NEWARK LLC (provides emergency services, 2000 TAMARACK ROAD)
- NEWARK SURGERY CENTER (2000 TAMARACK ROAD)
- SHEPHERD HILL HOSPITAL (200 MESSIMER DR, PO BOX 1067)
Nursing Homes in Newark:
- ARLINGTON CARE CENTER (98 SOUTH 30TH STREET)
- AUTUMN CARE CENTER (151 PRICE ROAD)
- AUTUMN HEALTHCARE OF NEWARK (17 FORRY STREET)
- FLINT RIDGE NRSG AND REHAB CTR (1450 WEST MAIN STREET)
- HOPEWELL SKILLED VILLLA (75 MCMILLEN DR)
- KINDRED TRANSITIONAL CARE AND REHAB-NEWARK (75 MCMILLEN DRIVE)
- NEWARK HEALTH CARE CENTER (75-85 MCMILLEN DR)
Dialysis Facilities in Newark:
Home Health Centers in Newark:
Heliports located in Newark:
Colleges/Universities in Newark:
- Central Ohio Technical College (Full-time enrollment: 2,995; Location: 1179 University Drive; Public; Website: www.cotc.edu)
- Ohio State University-Newark Campus (Full-time enrollment: 2,028; Location: 1179 University Dr; Public; Website: www.newark.osu.edu; Offers Master's degree)
- Career and Technology Education Centers of Licking County (Full-time enrollment: 204; Location: 150 Price Rd; Public; Website: www.c-tec.edu)
Other colleges/universities with over 2000 students near Newark:
- Denison University (about 6 miles; Granville, OH; Full-time enrollment: 2,268)
- Zane State College (about 22 miles; Zanesville, OH; FT enrollment: 2,200)
- Otterbein University (about 28 miles; Westerville, OH; FT enrollment: 2,933)
- Ohio Dominican University (about 29 miles; Columbus, OH; FT enrollment: 2,045)
- Capital University (about 29 miles; Columbus, OH; FT enrollment: 3,029)
- DeVry University-Ohio (about 30 miles; Columbus, OH; FT enrollment: 3,896)
- Columbus State Community College (about 31 miles; Columbus, OH; FT enrollment: 24,488)
Public high schools in Newark:
- NEWARK HIGH SCHOOL (Students: 1,556, Location: 314 GRANVILLE ST, Grades: 9-12)
- LICKING VALLEY HIGH SCHOOL (Students: 716, Location: 100 HAINSVIEW DR, Grades: 9-12)
- NEWARK DIGITAL ACADEMY (Students: 192, Location: 255 WOODS AVE, Grades: 1-12, Charter school)
- CAREER AND TECHNOLOGY EDUCATIONAL CENTERS (Location: 150 PRICE RD, Grades: 7-12)
Private high schools in Newark:
Biggest public elementary/middle schools in Newark:
- LICKING VALLEY ELEMENTARY SCHOOL (Students: 881, Location: 1510 LICKING VALLEY RD NE, Grades: KG-5)
- LICKING VALLEY MIDDLE SCHOOL (Students: 498, Location: 1379 LICKING VALLEY RD, Grades: 6-8)
- NEWTON ELEMENTARY SCHOOL (Students: 496, Location: 6645 MOUNT VERNON RD, Grades: KG-6)
- JOHN CLEM ELEMENTARY SCHOOL (Students: 473, Location: 475 JEFFERSON RD, Grades: KG-5)
- MCGUFFEY ELEMENTARY SCHOOL (Students: 454, Location: 130 GREEN WAVE DR, Grades: PK-5)
- CHERRY VALLEY ELEMENTARY SCHOOL (Students: 436, Location: 1040 W MAIN ST, Grades: PK-5)
- BEN FRANKLIN ELEMENTARY SCHOOL (Students: 312, Location: 533 BEACON RD, Grades: PK-5)
- LIBERTY MIDDLE SCHOOL (Location: 1055 EVANS BLVD, Grades: 6-8)
- HERITAGE MIDDLE SCHOOL (Location: 600 ARLINGTON AVE, Grades: 6-8)
- HILLVIEW ELEMENTARY SCHOOL (Location: 1927 HORNS HILL RD, Grades: PK-5)
Private elementary/middle schools in Newark:
User-submitted facts and corrections:
- Strong FM Station 96.3 added by Misty
Points of interest:
Notable locations in Newark: Mound Builders Country Club (A), Licking Springs Golf Course (B), Newark Water Works (C), Soldiers and Sailors Memorial Building (D), Newark Municipal Building (E), Licking County Historical Society (F), Licking County Childrens Home (G), City of Newark Division of Fire and Emergency Medical Services Station 3 (H), City of Newark Division of Fire and Emergency Medical Services Station 2 (I), Courtesy Ambulance (J), Newark Township Fire Department (K), Licking County Courthouse (L), City of Newark Division of Fire and Emergency Medical Services Station 1 Headquarters (M), City of Newark Division of Fire and Emergency Medical Services Station 4 (N), Newark Public Library (O). Display/hide their locations on the map
Shopping Centers: Indian Valley Mall Shopping Center (1), Newark Plaza Shopping Center (2), Dugway Shopping Center (3). Display/hide their locations on the map
Main business address in Newark: PARK NATIONAL CORP /OH/ (A). Display/hide its location on the map
Churches in Newark include: Western Avenue Primitive Baptist Church (A), Standard Church of Christ (B), Sixth Street Church of God (C), Shiloh Baptist Church (D), Seventh Day Adventist Church (E), Second Baptist Church (F), Pine Street Christian Union Church (G), Oneness Apostolic Church (H), Ohev Israel Temple (I). Display/hide their locations on the map
Cemetery: Cedar Hill Cemetery (1). Display/hide its location on the map
Reservoir: Newark Low Head Reservoir (A). Display/hide its location on the map
Streams, rivers, and creeks: North Fork Licking River (A), Log Pond Run (B), Cedar Run (C), Raccoon Creek (D), South Fork Licking River (E), Quarry Run (F). Display/hide their locations on the map
Parks in Newark include: Hudson Avenue Historic District (1), Octagon State Memorial (2), Levin Park (3), Evans Family Park (4), Denman Park (5), Edwards Field (6), Everett Park (7), Arnold Park (8), White Field (9). Display/hide their locations on the map
Tourist attractions: Heisey Collectors of America Inc (Cultural Attractions- Events- & Facilities; 169 West Church Street) (1), Emerson R Miller Branch (Cultural Attractions- Events- & Facilities; 990 West Main Street) (2), Historical Society Museum Veterans Park (5 North 6th Street) (3), AAA Travel Agency (Tours & Charters; 130 West Main Street) (4). Display/hide their approximate locations on the map
Hotels: Courtyard by Marriott (500 Highland Boulevard) (1), Cherry Valley Lodge (2299 Cherry Valley Lodge Road) (2). Display/hide their approximate locations on the map
Courts: Licking County - Common Pleas Court- Probate Juvenile Court Division (743 East Main Street) (1), Licking County - Common Pleas Court- Legal Division- Jury Commissioner (75 East Main Street) (2), Licking County Offices - Common Pleas Court- Probate Juvenile Court- Family Intervention Serv (743 East Main Street) (3), Licking County Offices - Licking County Municipal Court- Judicial Dept.-- Jury Commissi (40 West Main Street) (4), Licking County - Municipal Court- Judicial Department- Small Claims C (40 West Main Street) (5), Licking County - Municipal Court- Judicial Department- Probation Depart (40 West Main Street) (6), Licking County - Judge Craig Baldwin Court Investigator- Common Pleas C (75 East Main Street) (7), Licking County - Municipal Court- Judicial Department (40 West Main Street) (8), Licking County - Municipal Court- Judicial Department- Juror Call-In (40 West Main Street) (9). Display/hide their approximate locations on the map
Birthplace of: Clarence Hudson White - Photographer, Andy Merrill - Voice actor, Charles R. Woods - Union Army general, Don Muhlbach - 2005 NFL player (Detroit Lions, born: Aug 17, 1981), Edward James Roye - President of Liberia, Fred Schaus - Basketball player-coach, Harry C. Beasley - Navy Medal of Honor recipient, James F. Wilson - Politician, John Clem - Union Union Army soldier, Jon Hendricks - Jazz singer.
Drinking water stations with addresses in Newark and their reported violations in the past:
THE CHURCH OF GOD AT NEWARK, OHIO PWS (Population served: 60, Groundwater):Past health violations:COUNTRY HILLS MHP (Population served: 48, Groundwater):Past monitoring violations:
- MCL, Monthly (TCR) - In NOV-2010, Contaminant: Coliform. Follow-up actions: St Public Notif requested (FEB-08-2011), St Violation/Reminder Notice (FEB-08-2011), St Public Notif received (MAR-11-2011), St Compliance achieved (MAY-24-2011)
- MCL, Monthly (TCR) - Between JUL-2006 and SEP-2006, Contaminant: Coliform. Follow-up actions: St Public Notif requested (SEP-27-2006), St Violation/Reminder Notice (SEP-27-2006), St Compliance achieved (JAN-27-2007)
- MCL, Acute (TCR) - Between JUL-2006 and SEP-2006, Contaminant: Coliform. Follow-up actions: St Public Notif requested (SEP-27-2006), St Violation/Reminder Notice (SEP-27-2006), St Compliance achieved (JAN-27-2007)
- Monitoring, Repeat Major (TCR) - Between OCT-2010 and DEC-2010, Contaminant: Coliform (TCR). Follow-up actions: St Violation/Reminder Notice (FEB-22-2011), St Public Notif requested (FEB-22-2011), St Compliance achieved (MAY-24-2011)
- Monitoring, Repeat Major (TCR) - Between JUL-2006 and SEP-2006, Contaminant: Coliform (TCR). Follow-up actions: St Public Notif requested (SEP-27-2006), St Violation/Reminder Notice (SEP-27-2006), St Compliance achieved (JAN-27-2007)
- One minor monitoring violation
- One regular monitoring violation
Past monitoring violations:
- Monitoring and Reporting (DBP) - Between JAN-2013 and SEP-2013, Contaminant: TTHM. Follow-up actions: St Violation/Reminder Notice (NOV-20-2013), St Public Notif requested (NOV-20-2013)
- Monitoring and Reporting (DBP) - Between JAN-2013 and SEP-2013, Contaminant: Total Haloacetic Acids (HAA5). Follow-up actions: St Violation/Reminder Notice (NOV-20-2013), St Public Notif requested (NOV-20-2013)
- Lead Consumer Notice - In DEC-31-2012, Contaminant: Lead and Copper Rule. Follow-up actions: St Violation/Reminder Notice (FEB-01-2013), St Compliance achieved (FEB-11-2013)
- One minor monitoring violation
Drinking water stations with addresses in Newark that have no violations reported:
- THE VINEYARD OF LICKING COUNTY PWS (Population served: 109, Primary Water Source Type: Groundwater)
| This city: | 2.4 people |
| Ohio: | 2.4 people |
| This city: | 60.8% |
| Whole state: | 65.0% |
| This city: | 9.5% |
| Whole state: | 6.8% |
Likely homosexual households (counted as self-reported same-sex unmarried-partner households)
- Lesbian couples: 0.4% of all households
- Gay men: 0.2% of all households
People in group quarters in Newark in 2010:
- 486 people in nursing facilities/skilled-nursing facilities
- 235 people in local jails and other municipal confinement facilities
- 172 people in college/university student housing
- 44 people in group homes intended for adults
- 32 people in emergency and transitional shelters (with sleeping facilities) for people experiencing homelessness
- 29 people in correctional residential facilities
- 13 people in other noninstitutional facilities
People in group quarters in Newark in 2000:
- 611 people in nursing homes
- 197 people in local jails and other confinement facilities (including police lockups)
- 70 people in other noninstitutional group quarters
- 15 people in homes or halfway houses for drug/alcohol abuse
- 14 people in homes for the mentally retarded
- 14 people in other group homes
- 5 people in religious group quarters
Banks with most branches in Newark (2011 data):
- The Park National Bank: at 50 North Third Street, 0504 Dugway Branch, 0527 Kroger - Deo Drive, 0512 Mcmillen Park Branch, 0507 Eastland Branch, 0511 North 21st Street Branch. Info updated 2008/09/29: Bank assets: $6,281.7 mil, Deposits: $4,611.6 mil, local headquarters, positive income, Commercial Lending Specialization, 123 total offices, Holding Company: Park National Corporation
- The Huntington National Bank: Newark Dt Branch, Hebron Road Branch, Newark Branch. Info updated 2012/04/02: Bank assets: $54,183.4 mil, Deposits: $44,300.3 mil, headquarters in Columbus, OH, positive income, Commercial Lending Specialization, 878 total offices, Holding Company: Huntington Bancshares Incorporated
- JPMorgan Chase Bank, National Association: North Newark Branch, Newark Loan Production Branch, Newark Main Branch. Info updated 2011/11/10: Bank assets: $1,811,678.0 mil, Deposits: $1,190,738.0 mil, headquarters in Columbus, OH, positive income, International Specialization, 5577 total offices, Holding Company: Jpmorgan Chase & Co.
- PNC Bank, National Association: Church Street Branch at 68 West Church Street, branch established on 1865/01/01; Northtowne Branch at 1760 North 21st Street, branch established on 1972/10/16. Info updated 2012/03/20: Bank assets: $263,309.6 mil, Deposits: $197,343.0 mil, headquarters in Wilmington, DE, positive income, Commercial Lending Specialization, 3085 total offices, Holding Company: Pnc Financial Services Group, Inc., The
- First Federal Savings and Loan Association: First Federal Savings And Loan Assoc at 2 North Second St, branch established on 1934/08/01; Newark Branch at 1475 North 21st Street, branch established on 2006/01/23. Info updated 2011/07/21: Bank assets: $176.6 mil, Deposits: $136.5 mil, local headquarters, negative income in the last year, Mortgage Lending Specialization, 6 total offices
- Woodforest National Bank: Newark Walmart Branch at 1315 North 21st Street, branch established on 2008/03/15. Info updated 2011/05/10: Bank assets: $3,488.9 mil, Deposits: $3,097.6 mil, headquarters in Houston, TX, positive income, Commercial Lending Specialization, 766 total offices, Holding Company: Woodforest Financial Group Employee Stock Ownership Plan (With 401(K) Provisions)
- Heartland Bank: Newark Branch at 6 North Park Place, branch established on 1983/05/01. Info updated 2006/11/03: Bank assets: $570.7 mil, Deposits: $493.0 mil, headquarters in Gahanna, OH, positive income, Commercial Lending Specialization, 13 total offices, Holding Company: Heartland Banccorp
- Fifth Third Bank: Newark Branch at 1235 N 21st St, branch established on 1900/01/01. Info updated 2009/10/05: Bank assets: $114,540.4 mil, Deposits: $89,689.1 mil, headquarters in Cincinnati, OH, positive income, Commercial Lending Specialization, 1378 total offices, Holding Company: Fifth Third Bancorp
- Ohio Heritage Bank: Newark Branch at 1180 North 21st Street, branch established on 2006/02/20. Info updated 2006/11/03: Bank assets: $270.2 mil, Deposits: $184.5 mil, headquarters in Coshocton, OH, positive income, Mortgage Lending Specialization, 6 total offices, Holding Company: Ohio Heritage Bancorp, Inc.
For population 15 years and over in Newark:
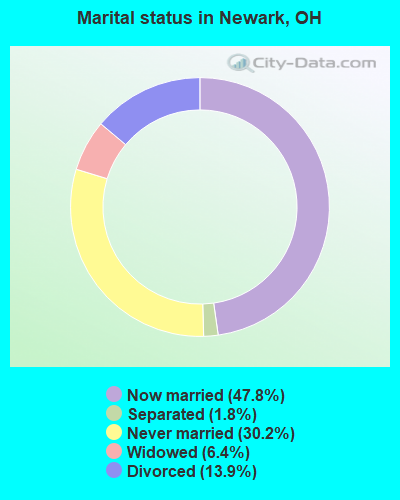
- Never married: 30.2%
- Now married: 47.8%
- Separated: 1.8%
- Widowed: 6.4%
- Divorced: 13.9%
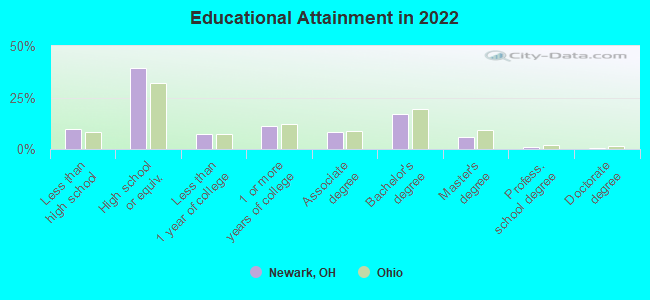
For population 25 years and over in Newark:
- High school or higher: 91.4%
- Bachelor's degree or higher: 22.8%
- Graduate or professional degree: 6.8%
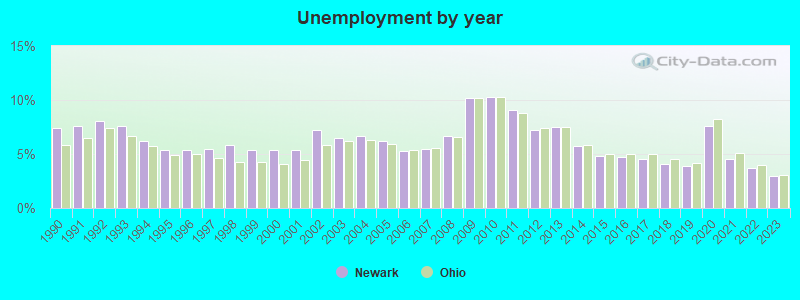
- Unemployed: 5.3%
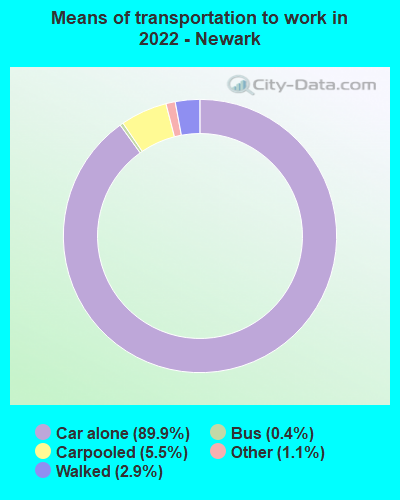
- Mean travel time to work (commute): 19.9 minutes
| Here: | 9.5 |
| Ohio average: | 11.0 |

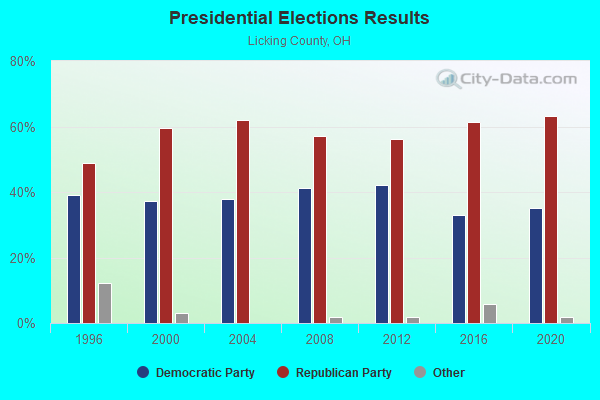
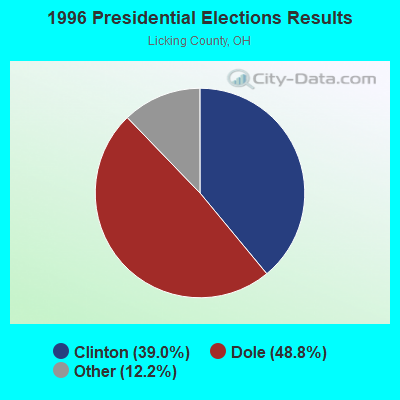
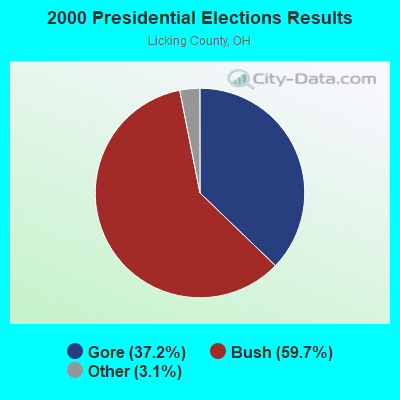
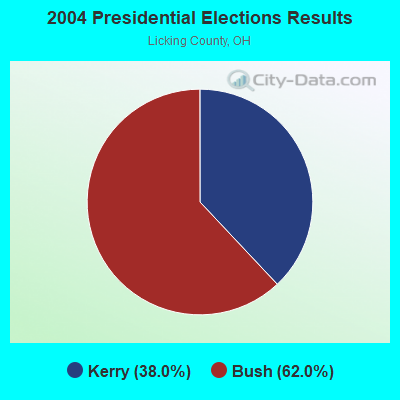
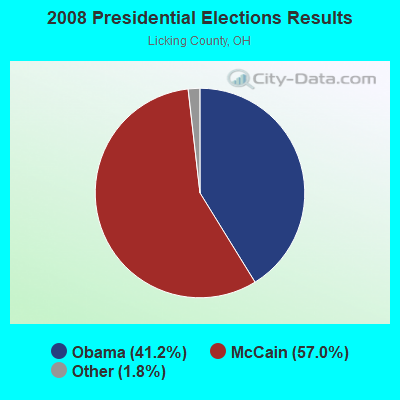
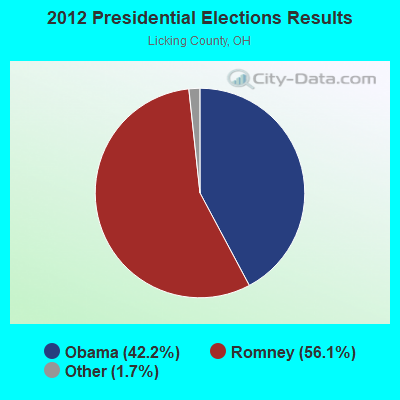
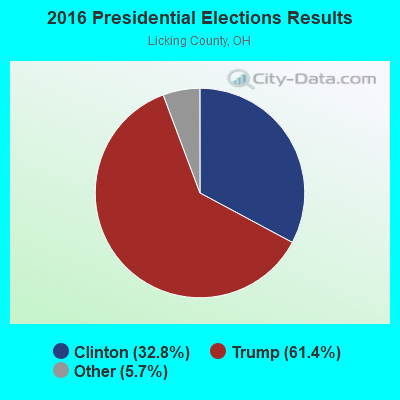
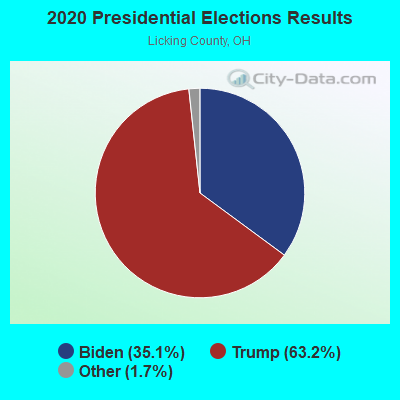
Graphs represent county-level data. Detailed 2008 Election Results
Religion statistics for Newark, OH (based on Licking County data)
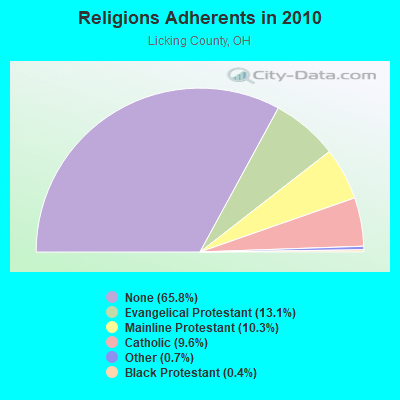
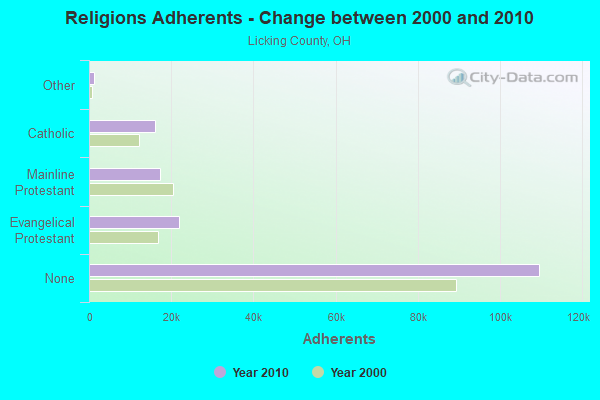
| Religion | Adherents | Congregations |
|---|---|---|
| Evangelical Protestant | 21,879 | 97 |
| Mainline Protestant | 17,189 | 82 |
| Catholic | 16,000 | 7 |
| Other | 1,167 | 6 |
| Black Protestant | 697 | 3 |
| None | 109,560 | - |
Food Environment Statistics:
| This county: | 1.60 / 10,000 pop. |
| Ohio: | 1.89 / 10,000 pop. |
| Licking County: | 0.13 / 10,000 pop. |
| State: | 0.13 / 10,000 pop. |
| Licking County: | 0.64 / 10,000 pop. |
| Ohio: | 1.25 / 10,000 pop. |
| Licking County: | 3.13 / 10,000 pop. |
| Ohio: | 2.93 / 10,000 pop. |
| This county: | 4.40 / 10,000 pop. |
| Ohio: | 6.25 / 10,000 pop. |
| Licking County: | 11.1% |
| Ohio: | 10.3% |
| Licking County: | 30.1% |
| Ohio: | 29.1% |
| This county: | 12.7% |
| Ohio: | 11.9% |
Health and Nutrition:
| Here: | 49.8% |
| Ohio: | 50.4% |
| Here: | 46.5% |
| Ohio: | 47.8% |
| This city: | 29.1 |
| Ohio: | 28.7 |
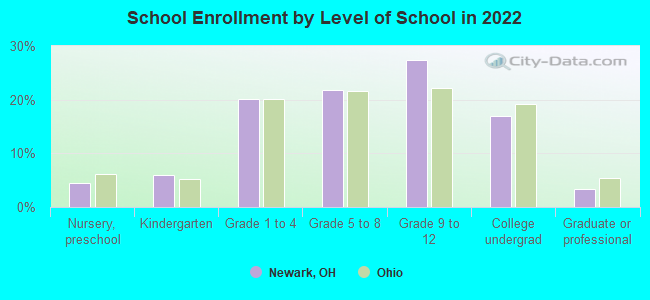
| Newark: | 21.0% |
| Ohio: | 20.6% |
| This city: | 11.6% |
| Ohio: | 10.4% |
| Here: | 6.8 |
| Ohio: | 6.8 |
| Newark: | 35.7% |
| Ohio: | 34.3% |
| This city: | 56.5% |
| Ohio: | 57.0% |
| Here: | 78.0% |
| Ohio: | 79.1% |
More about Health and Nutrition of Newark, OH Residents
| Local government employment and payroll (March 2022) | |||||
| Function | Full-time employees | Monthly full-time payroll | Average yearly full-time wage | Part-time employees | Monthly part-time payroll |
|---|---|---|---|---|---|
| Firefighters | 79 | $459,481 | $69,795 | 0 | $0 |
| Police Protection - Officers | 66 | $408,481 | $74,269 | 0 | $0 |
| Local Libraries | 52 | $281,939 | $65,063 | 0 | $0 |
| Judicial and Legal | 43 | $120,271 | $33,564 | 0 | $0 |
| Water Supply | 23 | $136,813 | $71,381 | 0 | $0 |
| Streets and Highways | 23 | $120,271 | $62,750 | 0 | $0 |
| Solid Waste Management | 23 | $119,557 | $62,378 | 0 | $0 |
| Financial Administration | 16 | $36,910 | $27,683 | 0 | $0 |
| Other Government Administration | 15 | $31,893 | $25,514 | 0 | $0 |
| Police - Other | 12 | $44,228 | $44,228 | 0 | $0 |
| Fire - Other | 1 | $3,912 | $46,944 | 0 | $0 |
| Totals for Government | 353 | $1,763,756 | $59,958 | 0 | $0 |
Newark government finances - Expenditure in 2021 (per resident):
- Construction - Sewerage: $13,746,000 ($270.79)
Regular Highways: $4,019,000 ($79.17)
Water Utilities: $660,000 ($13.00)
Judicial and Legal Services: $7,000 ($0.14)
Parks and Recreation: $1,000 ($0.02)
- Current Operations - Local Fire Protection: $9,015,000 ($177.59)
Police Protection: $8,739,000 ($172.15)
Sewerage: $8,053,000 ($158.64)
Water Utilities: $5,615,000 ($110.61)
General - Other: $4,228,000 ($83.29)
Judicial and Legal Services: $3,644,000 ($71.78)
Regular Highways: $3,028,000 ($59.65)
Financial Administration: $2,679,000 ($52.77)
Corrections - Other: $998,000 ($19.66)
Parks and Recreation: $762,000 ($15.01)
Central Staff Services: $738,000 ($14.54)
Housing and Community Development: $683,000 ($13.45)
Protective Inspection and Regulation - Other: $450,000 ($8.86)
General Public Buildings: $355,000 ($6.99)
Health - Other: $106,000 ($2.09)
Miscellaneous Commercial Activities - Other: $17,000 ($0.33)
- General - Interest on Debt: $1,323,000 ($26.06)
- Intergovernmental to State - Sewerage: $3,212,000 ($63.27)
Water Utilities: $579,000 ($11.41)
Regular Highways: $461,000 ($9.08)
- Other Capital Outlay - Regular Highways: $687,000 ($13.53)
General - Other: $394,000 ($7.76)
Local Fire Protection: $212,000 ($4.18)
Financial Administration: $199,000 ($3.92)
Sewerage: $52,000 ($1.02)
Police Protection: $51,000 ($1.00)
Protective Inspection and Regulation - Other: $44,000 ($0.87)
Judicial and Legal Services: $35,000 ($0.69)
Corrections - Other: $23,000 ($0.45)
General Public Building: $21,000 ($0.41)
Central Staff Services: $3,000 ($0.06)
- Water Utilities - Interest on Debt: $287,000 ($5.65)
Newark government finances - Revenue in 2021 (per resident):
- Charges - Sewerage: $12,126,000 ($238.87)
Other: $2,690,000 ($52.99)
Miscellaneous Commercial Activities: $5,000 ($0.10)
- Federal Intergovernmental - Housing and Community Development: $846,000 ($16.67)
Health and Hospitals: $144,000 ($2.84)
- Miscellaneous - General Revenue - Other: $2,113,000 ($41.62)
Donations From Private Sources: $1,440,000 ($28.37)
Interest Earnings: $1,181,000 ($23.26)
Fines and Forfeits: $485,000 ($9.55)
Special Assessments: $105,000 ($2.07)
Sale of Property: $68,000 ($1.34)
- Revenue - Water Utilities: $6,684,000 ($131.67)
- State Intergovernmental - Sewerage: $10,324,000 ($203.38)
Highways: $4,147,000 ($81.69)
General Local Government Support: $2,035,000 ($40.09)
Other: $1,263,000 ($24.88)
- Tax - Individual Income: $24,729,000 ($487.15)
Property: $3,572,000 ($70.37)
Motor Vehicle License: $1,114,000 ($21.95)
Public Utilities Sales: $543,000 ($10.70)
Other License: $107,000 ($2.11)
Newark government finances - Debt in 2021 (per resident):
- Long Term Debt - Beginning Outstanding - Unspecified Public Purpose: $43,535,000 ($857.61)
Outstanding Unspecified Public Purpose: $40,735,000 ($802.45)
Retired Unspecified Public Purpose: $2,800,000 ($55.16)
Newark government finances - Cash and Securities in 2021 (per resident):
- Bond Funds - Cash and Securities: $5,702,000 ($112.33)
- Other Funds - Cash and Securities: $49,358,000 ($972.32)
- Sinking Funds - Cash and Securities: $3,319,000 ($65.38)
| Businesses in Newark, OH | ||||
| Name | Count | Name | Count | |
|---|---|---|---|---|
| AMF Bowling | 1 | Kroger | 1 | |
| AT&T | 1 | La-Z-Boy | 1 | |
| Advance Auto Parts | 1 | Little Caesars Pizza | 1 | |
| Arby's | 2 | Marriott | 1 | |
| AutoZone | 1 | MasterBrand Cabinets | 8 | |
| Burger King | 1 | McDonald's | 4 | |
| CVS | 3 | Meijer | 1 | |
| Carson Pirie Scott | 1 | Nike | 1 | |
| Chevrolet | 1 | Nissan | 1 | |
| Circle K | 4 | Panda Express | 1 | |
| Curves | 1 | Pizza Hut | 2 | |
| Dairy Queen | 1 | Starbucks | 1 | |
| Decora Cabinetry | 4 | Steak 'n Shake | 1 | |
| Domino's Pizza | 1 | T-Mobile | 1 | |
| FedEx | 11 | Taco Bell | 1 | |
| Ford | 1 | Tim Hortons | 1 | |
| GameStop | 1 | True Value | 1 | |
| Goodwill | 1 | U-Haul | 4 | |
| H&R Block | 2 | UPS | 13 | |
| Home Depot | 1 | Walgreens | 1 | |
| Jones New York | 2 | Walmart | 1 | |
| KFC | 1 | Wendy's | 4 | |
| Kohl's | 1 | YMCA | 1 | |
Strongest AM radio stations in Newark:
- WHTH (790 AM; 1 kW; HEATH, OH; Owner: RUNNYMEDE, INC.)
- WCLT (1430 AM; 0 kW; NEWARK, OH)
- WTVN (610 AM; 50 kW; COLUMBUS, OH; Owner: CITICASTERS LICENSES, L.P.)
- WRFD (880 AM; daytime; 23 kW; COLUMBUS-WORTHINGTON, OH; Owner: SALEM MEDIA OF OHIO, INC.)
- WWVA (1170 AM; 53 kW; WHEELING, WV; Owner: CAPSTAR TX LIMITED PARTNERSHIP)
- WKNR (850 AM; 50 kW; CLEVELAND, OH; Owner: CARON BROADCASTING, INC.)
- WLW (700 AM; 50 kW; CINCINNATI, OH; Owner: JACOR BROADCASTING CORPORATION)
- WTAM (1100 AM; 50 kW; CLEVELAND, OH; Owner: JACOR BROADCASTING CORPORATION)
- WOSU (820 AM; 5 kW; COLUMBUS, OH; Owner: THE OHIO STATE UNIVERSITY)
- WBNS (1460 AM; 5 kW; COLUMBUS, OH; Owner: RADIOHIO, INCORPORATED)
- WHK (1220 AM; 50 kW; CLEVELAND, OH; Owner: CARON BROADCASTING, INC.)
- WJR (760 AM; 50 kW; DETROIT, MI; Owner: ABC, INC.)
- KDKA (1020 AM; 50 kW; PITTSBURGH, PA; Owner: INFINITY BROADCASTING OPERATIONS, INC.)
Strongest FM radio stations in Newark:
- WCLT-FM (100.3 FM; NEWARK, OH; Owner: WCLT RADIO, INC.)
- WNKO (101.7 FM; NEWARK, OH; Owner: RUNNYMEDE, INC.)
- WDUB (91.1 FM; GRANVILLE, OH; Owner: DENISON UNIVERSITY)
- WJIC (91.7 FM; ZANESVILLE, OH; Owner: VCY/AMERICA, INC.)
- W294AC (106.7 FM; NEWARK, OH; Owner: BD. OF EDUC. CITY SCHOOL DISTRICT)
- WSMZ (103.1 FM; JOHNSTOWN, OH; Owner: STOP 26- RIVERBEND, INC.)
- WWJM (106.3 FM; NEW LEXINGTON, OH; Owner: PERRY COUNTY BROADCASTING CO., INC.)
- W201AK (88.1 FM; COLUMBUS, OH; Owner: THE CEDARVILLE UNIVERSITY)
- WOSU-FM (89.7 FM; COLUMBUS, OH; Owner: THE OHIO STATE UNIVERSITY)
- WQIO (93.7 FM; MOUNT VERNON, OH; Owner: CAPSTAR TX LIMITED PARTNERSHIP)
- WHOK-FM (95.5 FM; LANCASTER, OH; Owner: INFINITY RADIO SUBSIDIARY OPERATIONS INC.)
- WBZX (99.7 FM; COLUMBUS, OH; Owner: NORTH AMERICAN BROADCASTING CO., INC)
- WBNS-FM (97.1 FM; COLUMBUS, OH; Owner: RADIO OHIO, INC.)
- WUFM (88.7 FM; COLUMBUS, OH; Owner: SPIRIT COMMUNICATIONS, INC)
- WCOL-FM (92.3 FM; COLUMBUS, OH; Owner: CITICASTERS LICENSES, L.P.)
- WXMG (98.9 FM; UPPER ARLINGTON, OH; Owner: BLUE CHIP BROADCASTING LICENSES, LTD)
- WLVQ (96.3 FM; COLUMBUS, OH; Owner: INFINITY RADIO OPERATIONS INC.)
- WHIZ-FM (102.5 FM; ZANESVILLE, OH; Owner: SOUTHEASTERN OHIO BROADCASTING SYSTEM, INC.)
- WWBK (98.3 FM; FREDERICKTOWN, OH; Owner: CAPSTAR TX LIMITED PARTNERSHIP)
- WSNY (94.7 FM; COLUMBUS, OH; Owner: FRANKLIN COMMUNICATIONS, INC.)
TV broadcast stations around Newark:
- W31AA (Channel 31; NEWARK, OH; Owner: OHIO EDUC'L. TV NETWORK COMMISSION)
- WSFJ-TV (Channel 51; NEWARK, OH; Owner: GUARDIAN VISION INTERNATIONAL, INC.)
- WOSU-TV (Channel 34; COLUMBUS, OH; Owner: THE OHIO STATE UNIVERSITY)
- WSYX (Channel 6; COLUMBUS, OH; Owner: WSYX LICENSEE, INC.)
- WBNS-TV (Channel 10; COLUMBUS, OH; Owner: WBNS-TV, INC.)
- WTTE (Channel 28; COLUMBUS, OH; Owner: COLUMBUS (WTTE-TV) LICENSEE, INC.)
- WCMH-TV (Channel 4; COLUMBUS, OH; Owner: OUTLET BROADCASTING, INC.)
- WMFD-TV (Channel 68; MANSFIELD, OH; Owner: MID-STATE TELEVISION,INC.)
- WINJ-LP (Channel 8; COLUMBUS, OH; Owner: THE NEW LIFE FELLOWSHIP OF CHURCHES)
- WHIZ-TV (Channel 18; ZANESVILLE, OH; Owner: SOUTHEASTERN OHIO TELEVISION SYSTEM)
- WCLL-LP (Channel 19; COLUMBUS, OH; Owner: JONATHAN W. OWENS)
- WDEM-LP (Channel 17; COLUMBUS, OH; Owner: TRIPLETT & ASSOCIATES, INC.)
- WCPX-LP (Channel 48; COLUMBUS, OH; Owner: PAXSON COMMUNICATIONS LICENSE COMPANY, LLC)
- National Bridge Inventory (NBI) Statistics
- 95Number of bridges
- 909ft / 277mTotal length
- $98,032,000Total costs
- 1,066,499Total average daily traffic
- 53,918Total average daily truck traffic
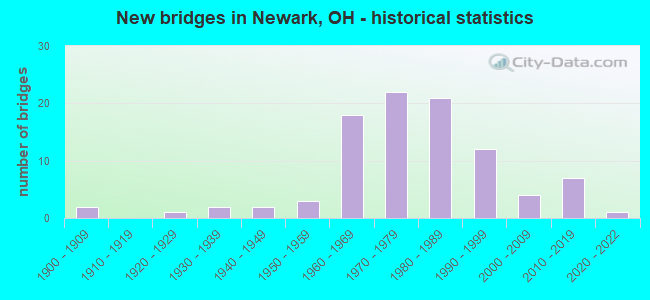
- New bridges - historical statistics
- 21900-1909
- 11920-1929
- 21930-1939
- 21940-1949
- 31950-1959
- 181960-1969
- 221970-1979
- 211980-1989
- 121990-1999
- 42000-2009
- 72010-2019
- 12020-2022
FCC Registered Antenna Towers: 403 (See the full list of FCC Registered Antenna Towers)
FCC Registered Commercial Land Mobile Towers: 5 (See the full list of FCC Registered Commercial Land Mobile Towers in Newark, OH)
FCC Registered Private Land Mobile Towers: 6 (See the full list of FCC Registered Private Land Mobile Towers)
FCC Registered Broadcast Land Mobile Towers: 48 (See the full list of FCC Registered Broadcast Land Mobile Towers)
FCC Registered Microwave Towers: 24 (See the full list of FCC Registered Microwave Towers in this town)
FCC Registered Paging Towers: 5 (See the full list of FCC Registered Paging Towers)
FCC Registered Maritime Coast & Aviation Ground Towers: 2 (See the full list of FCC Registered Maritime Coast & Aviation Ground Towers)
FCC Registered Amateur Radio Licenses: 364 (See the full list of FCC Registered Amateur Radio Licenses in Newark)
FAA Registered Aircraft: 37 (See the full list of FAA Registered Aircraft in Newark)
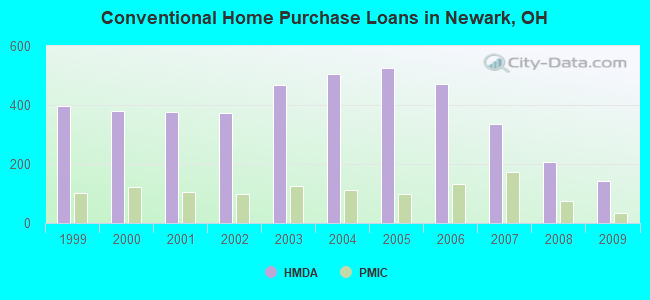
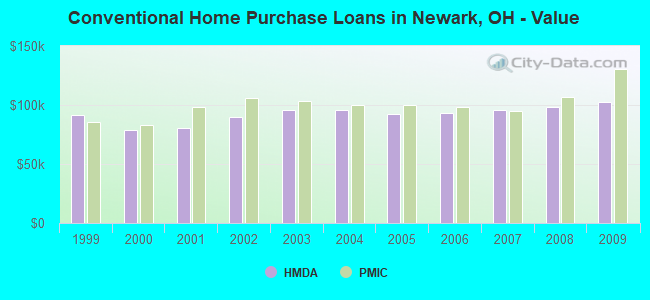
| Home Mortgage Disclosure Act Aggregated Statistics For Year 2009 (Based on 7 full and 6 partial tracts) | ||||||||||||||
| A) FHA, FSA/RHS & VA Home Purchase Loans | B) Conventional Home Purchase Loans | C) Refinancings | D) Home Improvement Loans | E) Loans on Dwellings For 5+ Families | F) Non-occupant Loans on < 5 Family Dwellings (A B C & D) | G) Loans On Manufactured Home Dwelling (A B C & D) | ||||||||
|---|---|---|---|---|---|---|---|---|---|---|---|---|---|---|
| Number | Average Value | Number | Average Value | Number | Average Value | Number | Average Value | Number | Average Value | Number | Average Value | Number | Average Value | |
| LOANS ORIGINATED | 177 | $96,863 | 144 | $102,396 | 551 | $113,085 | 22 | $26,617 | 2 | $2,217,325 | 74 | $65,998 | 1 | $86,750 |
| APPLICATIONS APPROVED, NOT ACCEPTED | 8 | $81,481 | 14 | $105,775 | 81 | $107,838 | 3 | $46,177 | 1 | $6,602,960 | 7 | $75,527 | 1 | $38,600 |
| APPLICATIONS DENIED | 32 | $90,105 | 37 | $85,221 | 204 | $115,610 | 17 | $39,020 | 0 | $0 | 23 | $84,114 | 2 | $100,645 |
| APPLICATIONS WITHDRAWN | 18 | $103,907 | 9 | $64,534 | 75 | $121,888 | 7 | $32,664 | 0 | $0 | 4 | $45,322 | 0 | $0 |
| FILES CLOSED FOR INCOMPLETENESS | 3 | $83,550 | 5 | $67,404 | 24 | $119,944 | 3 | $57,233 | 0 | $0 | 3 | $56,610 | 1 | $71,330 |
Detailed mortgage data for all 13 tracts in Newark, OH
| Private Mortgage Insurance Companies Aggregated Statistics For Year 2009 (Based on 7 full and 6 partial tracts) | ||||
| A) Conventional Home Purchase Loans | B) Refinancings | |||
|---|---|---|---|---|
| Number | Average Value | Number | Average Value | |
| LOANS ORIGINATED | 34 | $130,151 | 23 | $151,443 |
| APPLICATIONS APPROVED, NOT ACCEPTED | 4 | $107,040 | 12 | $150,464 |
| APPLICATIONS DENIED | 5 | $79,072 | 7 | $156,209 |
| APPLICATIONS WITHDRAWN | 2 | $256,765 | 1 | $91,260 |
| FILES CLOSED FOR INCOMPLETENESS | 2 | $95,860 | 1 | $164,420 |
2002 - 2018 National Fire Incident Reporting System (NFIRS) incidents
- Fire incident types reported to NFIRS in Newark, OH
- 3,29160.8%Structure Fires
- 1,41826.2%Outside Fires
- 67612.5%Mobile Property/Vehicle Fires
- 280.5%Other
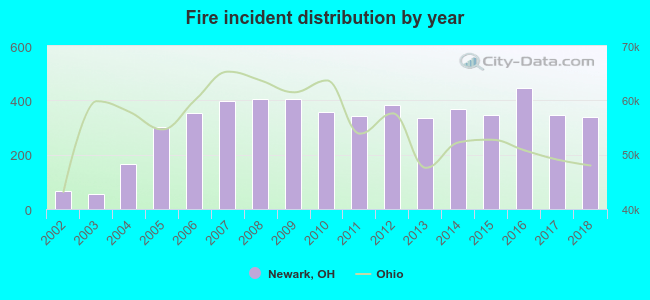 According to the data from the years 2002 - 2018 the average number of fires per year is 318. The highest number of fires - 445 took place in 2016, and the least - 56 in 2003. The data has a growing trend.
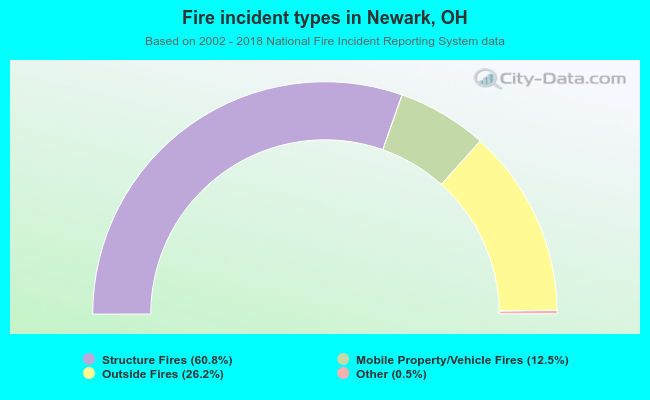 When looking into fire subcategories, the most reports belonged to: Structure Fires (60.8%), and Outside Fires (26.2%).
Fire-safe hotels and motels in Newark, Ohio:
- Courtyard Newark, 500s Highland Blvd, Newark, Ohio 43055 , Phone: (740) 344-1800
- Cherry Valley Lodge, 2299 Cherry Valley Rd, Newark, Ohio 43055 , Phone: (740) 788-1200, Fax: (740) 788-8800
- Doubletree By Hilton, 50 N 2nd St, Newark, Ohio 43055 , Phone: (740) 322-6455, Fax: (740) 322-6267
| Most common first names in Newark, OH among deceased individuals | ||
| Name | Count | Lived (average) |
|---|---|---|
| Mary | 709 | 79.5 years |
| John | 534 | 73.8 years |
| William | 516 | 73.4 years |
| Charles | 446 | 73.7 years |
| Robert | 445 | 70.3 years |
| James | 439 | 71.3 years |
| Helen | 297 | 80.0 years |
| George | 271 | 75.4 years |
| Paul | 250 | 72.7 years |
| Dorothy | 237 | 78.4 years |
| Most common last names in Newark, OH among deceased individuals | ||
| Last name | Count | Lived (average) |
|---|---|---|
| Smith | 262 | 75.0 years |
| Miller | 165 | 75.8 years |
| Jones | 161 | 77.7 years |
| Wilson | 150 | 74.0 years |
| Johnson | 142 | 73.2 years |
| Brown | 124 | 77.0 years |
| Davis | 122 | 74.6 years |
| Williams | 119 | 75.8 years |
| Thompson | 106 | 75.1 years |
| Moore | 100 | 74.0 years |
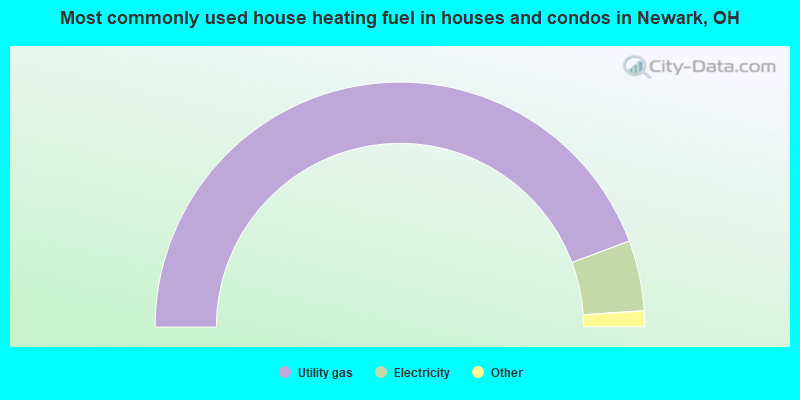
- 88.6%Utility gas
- 9.3%Electricity
- 1.1%Bottled, tank, or LP gas
- 0.6%Wood
- 0.2%Other fuel
- 0.2%Fuel oil, kerosene, etc.
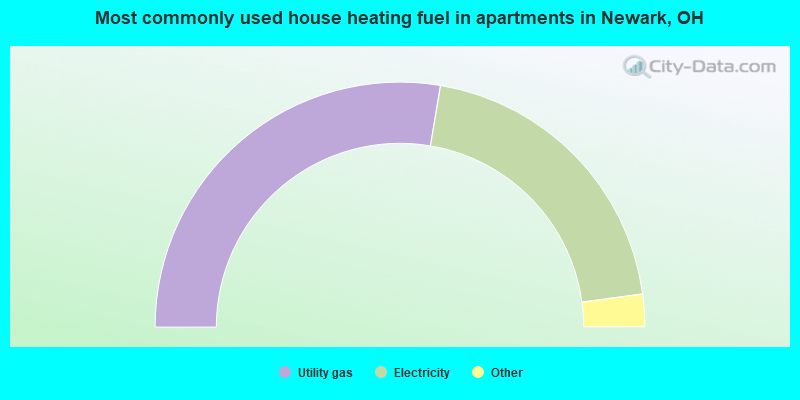
- 55.3%Utility gas
- 40.4%Electricity
- 2.3%Bottled, tank, or LP gas
- 1.1%No fuel used
- 0.9%Other fuel
Newark compared to Ohio state average:
- Unemployed percentage below state average.
- Black race population percentage significantly below state average.
- Foreign-born population percentage below state average.
- Length of stay since moving in significantly above state average.
Newark on our top lists:
- #26 on the list of "Top 101 cities with largest percentage of males in industries: broadcasting, internet publishing, and telecommunications services (population 5,000+)"
- #26 on the list of "Top 101 cities with largest percentage of females in industries: broadcasting, internet publishing, and telecommunications services (population 5,000+)"
- #26 on the list of "Top 101 cities with largest percentage of males in industries: wholesale electronic markets and agents and brokers (population 5,000+)"
- #26 on the list of "Top 101 cities with largest percentage of females in industries: wholesale electronic markets and agents and brokers (population 5,000+)"
- #86 on the list of "Top 101 cities with the highest number of arson incidents per 100,000 residents, excludes tourist destinations and others with a lot of outsiders visiting based on city industries data (population 5,000+)"
- #29 on the list of "Top 101 counties with the lowest percentage of residents relocating to foreign countries in 2011"
- #101 on the list of "Top 101 counties with the largest decrease in the number of births per 1000 residents 2000-2006 to 2007-2013 (pop 50,000+)"

|
|
Total of 251 patent applications in 2008-2024.