Monroe, Ohio Submit your own pictures of this city and show them to the world
OSM Map
General Map
Google Map
MSN Map
OSM Map
General Map
Google Map
MSN Map
OSM Map
General Map
Google Map
MSN Map
OSM Map
General Map
Google Map
MSN Map
Please wait while loading the map...
Population in 2022: 15,489 (94% urban, 6% rural). Population change since 2000: +117.1%Males: 7,647 Females: 7,842
March 2022 cost of living index in Monroe: 89.1 (less than average, U.S. average is 100) Percentage of residents living in poverty in 2022: 3.7%for White Non-Hispanic residents , 3.0% for Hispanic or Latino residents , 2.8% for two or more races residents )
Profiles of local businesses
Business Search - 14 Million verified businesses
Data:
Median household income ($)
Median household income (% change since 2000)
Household income diversity
Ratio of average income to average house value (%)
Ratio of average income to average rent
Median household income ($) - White
Median household income ($) - Black or African American
Median household income ($) - Asian
Median household income ($) - Hispanic or Latino
Median household income ($) - American Indian and Alaska Native
Median household income ($) - Multirace
Median household income ($) - Other Race
Median household income for houses/condos with a mortgage ($)
Median household income for apartments without a mortgage ($)
Races - White alone (%)
Races - White alone (% change since 2000)
Races - Black alone (%)
Races - Black alone (% change since 2000)
Races - American Indian alone (%)
Races - American Indian alone (% change since 2000)
Races - Asian alone (%)
Races - Asian alone (% change since 2000)
Races - Hispanic (%)
Races - Hispanic (% change since 2000)
Races - Native Hawaiian and Other Pacific Islander alone (%)
Races - Native Hawaiian and Other Pacific Islander alone (% change since 2000)
Races - Two or more races (%)
Races - Two or more races (% change since 2000)
Races - Other race alone (%)
Races - Other race alone (% change since 2000)
Racial diversity
Unemployment (%)
Unemployment (% change since 2000)
Unemployment (%) - White
Unemployment (%) - Black or African American
Unemployment (%) - Asian
Unemployment (%) - Hispanic or Latino
Unemployment (%) - American Indian and Alaska Native
Unemployment (%) - Multirace
Unemployment (%) - Other Race
Population density (people per square mile)
Population - Males (%)
Population - Females (%)
Population - Males (%) - White
Population - Males (%) - Black or African American
Population - Males (%) - Asian
Population - Males (%) - Hispanic or Latino
Population - Males (%) - American Indian and Alaska Native
Population - Males (%) - Multirace
Population - Males (%) - Other Race
Population - Females (%) - White
Population - Females (%) - Black or African American
Population - Females (%) - Asian
Population - Females (%) - Hispanic or Latino
Population - Females (%) - American Indian and Alaska Native
Population - Females (%) - Multirace
Population - Females (%) - Other Race
Coronavirus confirmed cases (May 04, 2024)
Deaths caused by coronavirus (May 04, 2024)
Coronavirus confirmed cases (per 100k population) (May 04, 2024)
Deaths caused by coronavirus (per 100k population) (May 04, 2024)
Daily increase in number of cases (May 04, 2024)
Weekly increase in number of cases (May 04, 2024)
Cases doubled (in days) (May 04, 2024)
Hospitalized patients (Apr 18, 2022)
Negative test results (Apr 18, 2022)
Total test results (Apr 18, 2022)
COVID Vaccine doses distributed (per 100k population) (Sep 19, 2023)
COVID Vaccine doses administered (per 100k population) (Sep 19, 2023)
COVID Vaccine doses distributed (Sep 19, 2023)
COVID Vaccine doses administered (Sep 19, 2023)
Likely homosexual households (%)
Likely homosexual households (% change since 2000)
Likely homosexual households - Lesbian couples (%)
Likely homosexual households - Lesbian couples (% change since 2000)
Likely homosexual households - Gay men (%)
Likely homosexual households - Gay men (% change since 2000)
Cost of living index
Median gross rent ($)
Median contract rent ($)
Median monthly housing costs ($)
Median house or condo value ($)
Median house or condo value ($ change since 2000)
Mean house or condo value by units in structure - 1, detached ($)
Mean house or condo value by units in structure - 1, attached ($)
Mean house or condo value by units in structure - 2 ($)
Mean house or condo value by units in structure by units in structure - 3 or 4 ($)
Mean house or condo value by units in structure - 5 or more ($)
Mean house or condo value by units in structure - Boat, RV, van, etc. ($)
Mean house or condo value by units in structure - Mobile home ($)
Median house or condo value ($) - White
Median house or condo value ($) - Black or African American
Median house or condo value ($) - Asian
Median house or condo value ($) - Hispanic or Latino
Median house or condo value ($) - American Indian and Alaska Native
Median house or condo value ($) - Multirace
Median house or condo value ($) - Other Race
Median resident age
Resident age diversity
Median resident age - Males
Median resident age - Females
Median resident age - White
Median resident age - Black or African American
Median resident age - Asian
Median resident age - Hispanic or Latino
Median resident age - American Indian and Alaska Native
Median resident age - Multirace
Median resident age - Other Race
Median resident age - Males - White
Median resident age - Males - Black or African American
Median resident age - Males - Asian
Median resident age - Males - Hispanic or Latino
Median resident age - Males - American Indian and Alaska Native
Median resident age - Males - Multirace
Median resident age - Males - Other Race
Median resident age - Females - White
Median resident age - Females - Black or African American
Median resident age - Females - Asian
Median resident age - Females - Hispanic or Latino
Median resident age - Females - American Indian and Alaska Native
Median resident age - Females - Multirace
Median resident age - Females - Other Race
Commute - mean travel time to work (minutes)
Travel time to work - Less than 5 minutes (%)
Travel time to work - Less than 5 minutes (% change since 2000)
Travel time to work - 5 to 9 minutes (%)
Travel time to work - 5 to 9 minutes (% change since 2000)
Travel time to work - 10 to 19 minutes (%)
Travel time to work - 10 to 19 minutes (% change since 2000)
Travel time to work - 20 to 29 minutes (%)
Travel time to work - 20 to 29 minutes (% change since 2000)
Travel time to work - 30 to 39 minutes (%)
Travel time to work - 30 to 39 minutes (% change since 2000)
Travel time to work - 40 to 59 minutes (%)
Travel time to work - 40 to 59 minutes (% change since 2000)
Travel time to work - 60 to 89 minutes (%)
Travel time to work - 60 to 89 minutes (% change since 2000)
Travel time to work - 90 or more minutes (%)
Travel time to work - 90 or more minutes (% change since 2000)
Marital status - Never married (%)
Marital status - Now married (%)
Marital status - Separated (%)
Marital status - Widowed (%)
Marital status - Divorced (%)
Median family income ($)
Median family income (% change since 2000)
Median non-family income ($)
Median non-family income (% change since 2000)
Median per capita income ($)
Median per capita income (% change since 2000)
Median family income ($) - White
Median family income ($) - Black or African American
Median family income ($) - Asian
Median family income ($) - Hispanic or Latino
Median family income ($) - American Indian and Alaska Native
Median family income ($) - Multirace
Median family income ($) - Other Race
Median year house/condo built
Median year apartment built
Year house built - Built 2005 or later (%)
Year house built - Built 2000 to 2004 (%)
Year house built - Built 1990 to 1999 (%)
Year house built - Built 1980 to 1989 (%)
Year house built - Built 1970 to 1979 (%)
Year house built - Built 1960 to 1969 (%)
Year house built - Built 1950 to 1959 (%)
Year house built - Built 1940 to 1949 (%)
Year house built - Built 1939 or earlier (%)
Average household size
Household density (households per square mile)
Average household size - White
Average household size - Black or African American
Average household size - Asian
Average household size - Hispanic or Latino
Average household size - American Indian and Alaska Native
Average household size - Multirace
Average household size - Other Race
Occupied housing units (%)
Vacant housing units (%)
Owner occupied housing units (%)
Renter occupied housing units (%)
Vacancy status - For rent (%)
Vacancy status - For sale only (%)
Vacancy status - Rented or sold, not occupied (%)
Vacancy status - For seasonal, recreational, or occasional use (%)
Vacancy status - For migrant workers (%)
Vacancy status - Other vacant (%)
Residents with income below the poverty level (%)
Residents with income below 50% of the poverty level (%)
Children below poverty level (%)
Poor families by family type - Married-couple family (%)
Poor families by family type - Male, no wife present (%)
Poor families by family type - Female, no husband present (%)
Poverty status for native-born residents (%)
Poverty status for foreign-born residents (%)
Poverty among high school graduates not in families (%)
Poverty among people who did not graduate high school not in families (%)
Residents with income below the poverty level (%) - White
Residents with income below the poverty level (%) - Black or African American
Residents with income below the poverty level (%) - Asian
Residents with income below the poverty level (%) - Hispanic or Latino
Residents with income below the poverty level (%) - American Indian and Alaska Native
Residents with income below the poverty level (%) - Multirace
Residents with income below the poverty level (%) - Other Race
Air pollution - Air Quality Index (AQI)
Air pollution - CO
Air pollution - NO2
Air pollution - SO2
Air pollution - Ozone
Air pollution - PM10
Air pollution - PM25
Air pollution - Pb
Crime - Murders per 100,000 population
Crime - Rapes per 100,000 population
Crime - Robberies per 100,000 population
Crime - Assaults per 100,000 population
Crime - Burglaries per 100,000 population
Crime - Thefts per 100,000 population
Crime - Auto thefts per 100,000 population
Crime - Arson per 100,000 population
Crime - City-data.com crime index
Crime - Violent crime index
Crime - Property crime index
Crime - Murders per 100,000 population (5 year average)
Crime - Rapes per 100,000 population (5 year average)
Crime - Robberies per 100,000 population (5 year average)
Crime - Assaults per 100,000 population (5 year average)
Crime - Burglaries per 100,000 population (5 year average)
Crime - Thefts per 100,000 population (5 year average)
Crime - Auto thefts per 100,000 population (5 year average)
Crime - Arson per 100,000 population (5 year average)
Crime - City-data.com crime index (5 year average)
Crime - Violent crime index (5 year average)
Crime - Property crime index (5 year average)
1996 Presidential Elections Results (%) - Democratic Party (Clinton)
1996 Presidential Elections Results (%) - Republican Party (Dole)
1996 Presidential Elections Results (%) - Other
2000 Presidential Elections Results (%) - Democratic Party (Gore)
2000 Presidential Elections Results (%) - Republican Party (Bush)
2000 Presidential Elections Results (%) - Other
2004 Presidential Elections Results (%) - Democratic Party (Kerry)
2004 Presidential Elections Results (%) - Republican Party (Bush)
2004 Presidential Elections Results (%) - Other
2008 Presidential Elections Results (%) - Democratic Party (Obama)
2008 Presidential Elections Results (%) - Republican Party (McCain)
2008 Presidential Elections Results (%) - Other
2012 Presidential Elections Results (%) - Democratic Party (Obama)
2012 Presidential Elections Results (%) - Republican Party (Romney)
2012 Presidential Elections Results (%) - Other
2016 Presidential Elections Results (%) - Democratic Party (Clinton)
2016 Presidential Elections Results (%) - Republican Party (Trump)
2016 Presidential Elections Results (%) - Other
2020 Presidential Elections Results (%) - Democratic Party (Biden)
2020 Presidential Elections Results (%) - Republican Party (Trump)
2020 Presidential Elections Results (%) - Other
Ancestries Reported - Arab (%)
Ancestries Reported - Czech (%)
Ancestries Reported - Danish (%)
Ancestries Reported - Dutch (%)
Ancestries Reported - English (%)
Ancestries Reported - French (%)
Ancestries Reported - French Canadian (%)
Ancestries Reported - German (%)
Ancestries Reported - Greek (%)
Ancestries Reported - Hungarian (%)
Ancestries Reported - Irish (%)
Ancestries Reported - Italian (%)
Ancestries Reported - Lithuanian (%)
Ancestries Reported - Norwegian (%)
Ancestries Reported - Polish (%)
Ancestries Reported - Portuguese (%)
Ancestries Reported - Russian (%)
Ancestries Reported - Scotch-Irish (%)
Ancestries Reported - Scottish (%)
Ancestries Reported - Slovak (%)
Ancestries Reported - Subsaharan African (%)
Ancestries Reported - Swedish (%)
Ancestries Reported - Swiss (%)
Ancestries Reported - Ukrainian (%)
Ancestries Reported - United States (%)
Ancestries Reported - Welsh (%)
Ancestries Reported - West Indian (%)
Ancestries Reported - Other (%)
Educational Attainment - No schooling completed (%)
Educational Attainment - Less than high school (%)
Educational Attainment - High school or equivalent (%)
Educational Attainment - Less than 1 year of college (%)
Educational Attainment - 1 or more years of college (%)
Educational Attainment - Associate degree (%)
Educational Attainment - Bachelor's degree (%)
Educational Attainment - Master's degree (%)
Educational Attainment - Professional school degree (%)
Educational Attainment - Doctorate degree (%)
School Enrollment - Nursery, preschool (%)
School Enrollment - Kindergarten (%)
School Enrollment - Grade 1 to 4 (%)
School Enrollment - Grade 5 to 8 (%)
School Enrollment - Grade 9 to 12 (%)
School Enrollment - College undergrad (%)
School Enrollment - Graduate or professional (%)
School Enrollment - Not enrolled in school (%)
School enrollment - Public schools (%)
School enrollment - Private schools (%)
School enrollment - Not enrolled (%)
Median number of rooms in houses and condos
Median number of rooms in apartments
Housing units lacking complete plumbing facilities (%)
Housing units lacking complete kitchen facilities (%)
Density of houses
Urban houses (%)
Rural houses (%)
Households with people 60 years and over (%)
Households with people 65 years and over (%)
Households with people 75 years and over (%)
Households with one or more nonrelatives (%)
Households with no nonrelatives (%)
Population in households (%)
Family households (%)
Nonfamily households (%)
Population in families (%)
Family households with own children (%)
Median number of bedrooms in owner occupied houses
Mean number of bedrooms in owner occupied houses
Median number of bedrooms in renter occupied houses
Mean number of bedrooms in renter occupied houses
Median number of vehichles in owner occupied houses
Mean number of vehichles in owner occupied houses
Median number of vehichles in renter occupied houses
Mean number of vehichles in renter occupied houses
Mortgage status - with mortgage (%)
Mortgage status - with second mortgage (%)
Mortgage status - with home equity loan (%)
Mortgage status - with both second mortgage and home equity loan (%)
Mortgage status - without a mortgage (%)
Average family size
Average family size - White
Average family size - Black or African American
Average family size - Asian
Average family size - Hispanic or Latino
Average family size - American Indian and Alaska Native
Average family size - Multirace
Average family size - Other Race
Geographical mobility - Same house 1 year ago (%)
Geographical mobility - Moved within same county (%)
Geographical mobility - Moved from different county within same state (%)
Geographical mobility - Moved from different state (%)
Geographical mobility - Moved from abroad (%)
Place of birth - Born in state of residence (%)
Place of birth - Born in other state (%)
Place of birth - Native, outside of US (%)
Place of birth - Foreign born (%)
Housing units in structures - 1, detached (%)
Housing units in structures - 1, attached (%)
Housing units in structures - 2 (%)
Housing units in structures - 3 or 4 (%)
Housing units in structures - 5 to 9 (%)
Housing units in structures - 10 to 19 (%)
Housing units in structures - 20 to 49 (%)
Housing units in structures - 50 or more (%)
Housing units in structures - Mobile home (%)
Housing units in structures - Boat, RV, van, etc. (%)
House/condo owner moved in on average (years ago)
Renter moved in on average (years ago)
Year householder moved into unit - Moved in 1999 to March 2000 (%)
Year householder moved into unit - Moved in 1995 to 1998 (%)
Year householder moved into unit - Moved in 1990 to 1994 (%)
Year householder moved into unit - Moved in 1980 to 1989 (%)
Year householder moved into unit - Moved in 1970 to 1979 (%)
Year householder moved into unit - Moved in 1969 or earlier (%)
Means of transportation to work - Drove car alone (%)
Means of transportation to work - Carpooled (%)
Means of transportation to work - Public transportation (%)
Means of transportation to work - Bus or trolley bus (%)
Means of transportation to work - Streetcar or trolley car (%)
Means of transportation to work - Subway or elevated (%)
Means of transportation to work - Railroad (%)
Means of transportation to work - Ferryboat (%)
Means of transportation to work - Taxicab (%)
Means of transportation to work - Motorcycle (%)
Means of transportation to work - Bicycle (%)
Means of transportation to work - Walked (%)
Means of transportation to work - Other means (%)
Working at home (%)
Industry diversity
Most Common Industries - Agriculture, forestry, fishing and hunting, and mining (%)
Most Common Industries - Agriculture, forestry, fishing and hunting (%)
Most Common Industries - Mining, quarrying, and oil and gas extraction (%)
Most Common Industries - Construction (%)
Most Common Industries - Manufacturing (%)
Most Common Industries - Wholesale trade (%)
Most Common Industries - Retail trade (%)
Most Common Industries - Transportation and warehousing, and utilities (%)
Most Common Industries - Transportation and warehousing (%)
Most Common Industries - Utilities (%)
Most Common Industries - Information (%)
Most Common Industries - Finance and insurance, and real estate and rental and leasing (%)
Most Common Industries - Finance and insurance (%)
Most Common Industries - Real estate and rental and leasing (%)
Most Common Industries - Professional, scientific, and management, and administrative and waste management services (%)
Most Common Industries - Professional, scientific, and technical services (%)
Most Common Industries - Management of companies and enterprises (%)
Most Common Industries - Administrative and support and waste management services (%)
Most Common Industries - Educational services, and health care and social assistance (%)
Most Common Industries - Educational services (%)
Most Common Industries - Health care and social assistance (%)
Most Common Industries - Arts, entertainment, and recreation, and accommodation and food services (%)
Most Common Industries - Arts, entertainment, and recreation (%)
Most Common Industries - Accommodation and food services (%)
Most Common Industries - Other services, except public administration (%)
Most Common Industries - Public administration (%)
Occupation diversity
Most Common Occupations - Management, business, science, and arts occupations (%)
Most Common Occupations - Management, business, and financial occupations (%)
Most Common Occupations - Management occupations (%)
Most Common Occupations - Business and financial operations occupations (%)
Most Common Occupations - Computer, engineering, and science occupations (%)
Most Common Occupations - Computer and mathematical occupations (%)
Most Common Occupations - Architecture and engineering occupations (%)
Most Common Occupations - Life, physical, and social science occupations (%)
Most Common Occupations - Education, legal, community service, arts, and media occupations (%)
Most Common Occupations - Community and social service occupations (%)
Most Common Occupations - Legal occupations (%)
Most Common Occupations - Education, training, and library occupations (%)
Most Common Occupations - Arts, design, entertainment, sports, and media occupations (%)
Most Common Occupations - Healthcare practitioners and technical occupations (%)
Most Common Occupations - Health diagnosing and treating practitioners and other technical occupations (%)
Most Common Occupations - Health technologists and technicians (%)
Most Common Occupations - Service occupations (%)
Most Common Occupations - Healthcare support occupations (%)
Most Common Occupations - Protective service occupations (%)
Most Common Occupations - Fire fighting and prevention, and other protective service workers including supervisors (%)
Most Common Occupations - Law enforcement workers including supervisors (%)
Most Common Occupations - Food preparation and serving related occupations (%)
Most Common Occupations - Building and grounds cleaning and maintenance occupations (%)
Most Common Occupations - Personal care and service occupations (%)
Most Common Occupations - Sales and office occupations (%)
Most Common Occupations - Sales and related occupations (%)
Most Common Occupations - Office and administrative support occupations (%)
Most Common Occupations - Natural resources, construction, and maintenance occupations (%)
Most Common Occupations - Farming, fishing, and forestry occupations (%)
Most Common Occupations - Construction and extraction occupations (%)
Most Common Occupations - Installation, maintenance, and repair occupations (%)
Most Common Occupations - Production, transportation, and material moving occupations (%)
Most Common Occupations - Production occupations (%)
Most Common Occupations - Transportation occupations (%)
Most Common Occupations - Material moving occupations (%)
People in Group quarters - Institutionalized population (%)
People in Group quarters - Correctional institutions (%)
People in Group quarters - Federal prisons and detention centers (%)
People in Group quarters - Halfway houses (%)
People in Group quarters - Local jails and other confinement facilities (including police lockups) (%)
People in Group quarters - Military disciplinary barracks (%)
People in Group quarters - State prisons (%)
People in Group quarters - Other types of correctional institutions (%)
People in Group quarters - Nursing homes (%)
People in Group quarters - Hospitals/wards, hospices, and schools for the handicapped (%)
People in Group quarters - Hospitals/wards and hospices for chronically ill (%)
People in Group quarters - Hospices or homes for chronically ill (%)
People in Group quarters - Military hospitals or wards for chronically ill (%)
People in Group quarters - Other hospitals or wards for chronically ill (%)
People in Group quarters - Hospitals or wards for drug/alcohol abuse (%)
People in Group quarters - Mental (Psychiatric) hospitals or wards (%)
People in Group quarters - Schools, hospitals, or wards for the mentally retarded (%)
People in Group quarters - Schools, hospitals, or wards for the physically handicapped (%)
People in Group quarters - Institutions for the deaf (%)
People in Group quarters - Institutions for the blind (%)
People in Group quarters - Orthopedic wards and institutions for the physically handicapped (%)
People in Group quarters - Wards in general hospitals for patients who have no usual home elsewhere (%)
People in Group quarters - Wards in military hospitals for patients who have no usual home elsewhere (%)
People in Group quarters - Juvenile institutions (%)
People in Group quarters - Long-term care (%)
People in Group quarters - Homes for abused, dependent, and neglected children (%)
People in Group quarters - Residential treatment centers for emotionally disturbed children (%)
People in Group quarters - Training schools for juvenile delinquents (%)
People in Group quarters - Short-term care, detention or diagnostic centers for delinquent children (%)
People in Group quarters - Type of juvenile institution unknown (%)
People in Group quarters - Noninstitutionalized population (%)
People in Group quarters - College dormitories (includes college quarters off campus) (%)
People in Group quarters - Military quarters (%)
People in Group quarters - On base (%)
People in Group quarters - Barracks, unaccompanied personnel housing (UPH), (Enlisted/Officer), ;and similar group living quarters for military personnel (%)
People in Group quarters - Transient quarters for temporary residents (%)
People in Group quarters - Military ships (%)
People in Group quarters - Group homes (%)
People in Group quarters - Homes or halfway houses for drug/alcohol abuse (%)
People in Group quarters - Homes for the mentally ill (%)
People in Group quarters - Homes for the mentally retarded (%)
People in Group quarters - Homes for the physically handicapped (%)
People in Group quarters - Other group homes (%)
People in Group quarters - Religious group quarters (%)
People in Group quarters - Dormitories (%)
People in Group quarters - Agriculture workers' dormitories on farms (%)
People in Group quarters - Job Corps and vocational training facilities (%)
People in Group quarters - Other workers' dormitories (%)
People in Group quarters - Crews of maritime vessels (%)
People in Group quarters - Other nonhousehold living situations (%)
People in Group quarters - Other noninstitutional group quarters (%)
Residents speaking English at home (%)
Residents speaking English at home - Born in the United States (%)
Residents speaking English at home - Native, born elsewhere (%)
Residents speaking English at home - Foreign born (%)
Residents speaking Spanish at home (%)
Residents speaking Spanish at home - Born in the United States (%)
Residents speaking Spanish at home - Native, born elsewhere (%)
Residents speaking Spanish at home - Foreign born (%)
Residents speaking other language at home (%)
Residents speaking other language at home - Born in the United States (%)
Residents speaking other language at home - Native, born elsewhere (%)
Residents speaking other language at home - Foreign born (%)
Class of Workers - Employee of private company (%)
Class of Workers - Self-employed in own incorporated business (%)
Class of Workers - Private not-for-profit wage and salary workers (%)
Class of Workers - Local government workers (%)
Class of Workers - State government workers (%)
Class of Workers - Federal government workers (%)
Class of Workers - Self-employed workers in own not incorporated business and Unpaid family workers (%)
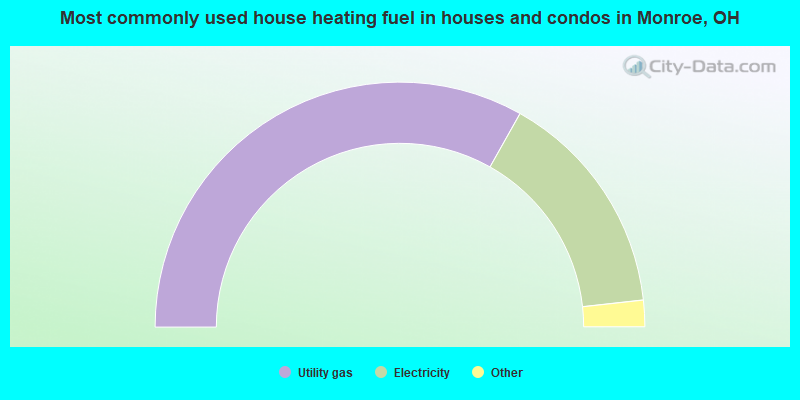
House heating fuel used in houses and condos - Utility gas (%)
House heating fuel used in houses and condos - Bottled, tank, or LP gas (%)
House heating fuel used in houses and condos - Electricity (%)
House heating fuel used in houses and condos - Fuel oil, kerosene, etc. (%)
House heating fuel used in houses and condos - Coal or coke (%)
House heating fuel used in houses and condos - Wood (%)
House heating fuel used in houses and condos - Solar energy (%)
House heating fuel used in houses and condos - Other fuel (%)
House heating fuel used in houses and condos - No fuel used (%)
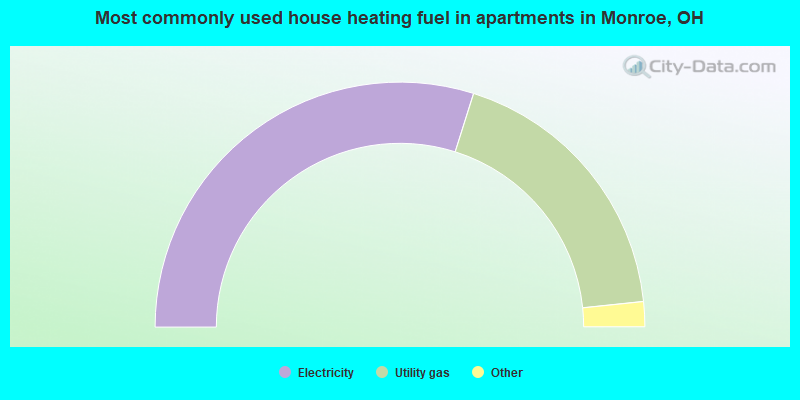
House heating fuel used in apartments - Utility gas (%)
House heating fuel used in apartments - Bottled, tank, or LP gas (%)
House heating fuel used in apartments - Electricity (%)
House heating fuel used in apartments - Fuel oil, kerosene, etc. (%)
House heating fuel used in apartments - Coal or coke (%)
House heating fuel used in apartments - Wood (%)
House heating fuel used in apartments - Solar energy (%)
House heating fuel used in apartments - Other fuel (%)
House heating fuel used in apartments - No fuel used (%)
Armed forces status - In Armed Forces (%)
Armed forces status - Civilian (%)
Armed forces status - Civilian - Veteran (%)
Armed forces status - Civilian - Nonveteran (%)
Fatal accidents locations in years 2005-2021
Fatal accidents locations in 2005
Fatal accidents locations in 2006
Fatal accidents locations in 2007
Fatal accidents locations in 2008
Fatal accidents locations in 2009
Fatal accidents locations in 2010
Fatal accidents locations in 2011
Fatal accidents locations in 2012
Fatal accidents locations in 2013
Fatal accidents locations in 2014
Fatal accidents locations in 2015
Fatal accidents locations in 2016
Fatal accidents locations in 2017
Fatal accidents locations in 2018
Fatal accidents locations in 2019
Fatal accidents locations in 2020
Fatal accidents locations in 2021
Alcohol use - People drinking some alcohol every month (%)
Alcohol use - People not drinking at all (%)
Alcohol use - Average days/month drinking alcohol
Alcohol use - Average drinks/week
Alcohol use - Average days/year people drink much
Audiometry - Average condition of hearing (%)
Audiometry - People that can hear a whisper from across a quiet room (%)
Audiometry - People that can hear normal voice from across a quiet room (%)
Audiometry - Ears ringing, roaring, buzzing (%)
Audiometry - Had a job exposure to loud noise (%)
Audiometry - Had off-work exposure to loud noise (%)
Blood Pressure & Cholesterol - Has high blood pressure (%)
Blood Pressure & Cholesterol - Checking blood pressure at home (%)
Blood Pressure & Cholesterol - Frequently checking blood cholesterol (%)
Blood Pressure & Cholesterol - Has high cholesterol level (%)
Consumer Behavior - Money monthly spent on food at supermarket/grocery store
Consumer Behavior - Money monthly spent on food at other stores
Consumer Behavior - Money monthly spent on eating out
Consumer Behavior - Money monthly spent on carryout/delivered foods
Consumer Behavior - Income spent on food at supermarket/grocery store (%)
Consumer Behavior - Income spent on food at other stores (%)
Consumer Behavior - Income spent on eating out (%)
Consumer Behavior - Income spent on carryout/delivered foods (%)
Current Health Status - General health condition (%)
Current Health Status - Blood donors (%)
Current Health Status - Has blood ever tested for HIV virus (%)
Current Health Status - Left-handed people (%)
Dermatology - People using sunscreen (%)
Diabetes - Diabetics (%)
Diabetes - Had a blood test for high blood sugar (%)
Diabetes - People taking insulin (%)
Diet Behavior & Nutrition - Diet health (%)
Diet Behavior & Nutrition - Milk product consumption (# of products/month)
Diet Behavior & Nutrition - Meals not home prepared (#/week)
Diet Behavior & Nutrition - Meals from fast food or pizza place (#/week)
Diet Behavior & Nutrition - Ready-to-eat foods (#/month)
Diet Behavior & Nutrition - Frozen meals/pizza (#/month)
Drug Use - People that ever used marijuana or hashish (%)
Drug Use - Ever used hard drugs (%)
Drug Use - Ever used any form of cocaine (%)
Drug Use - Ever used heroin (%)
Drug Use - Ever used methamphetamine (%)
Health Insurance - People covered by health insurance (%)
Kidney Conditions-Urology - Avg. # of times urinating at night
Medical Conditions - People with asthma (%)
Medical Conditions - People with anemia (%)
Medical Conditions - People with psoriasis (%)
Medical Conditions - People with overweight (%)
Medical Conditions - Elderly people having difficulties in thinking or remembering (%)
Medical Conditions - People who ever received blood transfusion (%)
Medical Conditions - People having trouble seeing even with glass/contacts (%)
Medical Conditions - People with arthritis (%)
Medical Conditions - People with gout (%)
Medical Conditions - People with congestive heart failure (%)
Medical Conditions - People with coronary heart disease (%)
Medical Conditions - People with angina pectoris (%)
Medical Conditions - People who ever had heart attack (%)
Medical Conditions - People who ever had stroke (%)
Medical Conditions - People with emphysema (%)
Medical Conditions - People with thyroid problem (%)
Medical Conditions - People with chronic bronchitis (%)
Medical Conditions - People with any liver condition (%)
Medical Conditions - People who ever had cancer or malignancy (%)
Mental Health - People who have little interest in doing things (%)
Mental Health - People feeling down, depressed, or hopeless (%)
Mental Health - People who have trouble sleeping or sleeping too much (%)
Mental Health - People feeling tired or having little energy (%)
Mental Health - People with poor appetite or overeating (%)
Mental Health - People feeling bad about themself (%)
Mental Health - People who have trouble concentrating on things (%)
Mental Health - People moving or speaking slowly or too fast (%)
Mental Health - People having thoughts they would be better off dead (%)
Oral Health - Average years since last visit a dentist
Oral Health - People embarrassed because of mouth (%)
Oral Health - People with gum disease (%)
Oral Health - General health of teeth and gums (%)
Oral Health - Average days a week using dental floss/device
Oral Health - Average days a week using mouthwash for dental problem
Oral Health - Average number of teeth
Pesticide Use - Households using pesticides to control insects (%)
Pesticide Use - Households using pesticides to kill weeds (%)
Physical Activity - People doing vigorous-intensity work activities (%)
Physical Activity - People doing moderate-intensity work activities (%)
Physical Activity - People walking or bicycling (%)
Physical Activity - People doing vigorous-intensity recreational activities (%)
Physical Activity - People doing moderate-intensity recreational activities (%)
Physical Activity - Average hours a day doing sedentary activities
Physical Activity - Average hours a day watching TV or videos
Physical Activity - Average hours a day using computer
Physical Functioning - People having limitations keeping them from working (%)
Physical Functioning - People limited in amount of work they can do (%)
Physical Functioning - People that need special equipment to walk (%)
Physical Functioning - People experiencing confusion/memory problems (%)
Physical Functioning - People requiring special healthcare equipment (%)
Prescription Medications - Average number of prescription medicines taking
Preventive Aspirin Use - Adults 40+ taking low-dose aspirin (%)
Reproductive Health - Vaginal deliveries (%)
Reproductive Health - Cesarean deliveries (%)
Reproductive Health - Deliveries resulted in a live birth (%)
Reproductive Health - Pregnancies resulted in a delivery (%)
Reproductive Health - Women breastfeeding newborns (%)
Reproductive Health - Women that had a hysterectomy (%)
Reproductive Health - Women that had both ovaries removed (%)
Reproductive Health - Women that have ever taken birth control pills (%)
Reproductive Health - Women taking birth control pills (%)
Reproductive Health - Women that have ever used Depo-Provera or injectables (%)
Reproductive Health - Women that have ever used female hormones (%)
Sexual Behavior - People 18+ that ever had sex (vaginal, anal, or oral) (%)
Sexual Behavior - Males 18+ that ever had vaginal sex with a woman (%)
Sexual Behavior - Males 18+ that ever performed oral sex on a woman (%)
Sexual Behavior - Males 18+ that ever had anal sex with a woman (%)
Sexual Behavior - Males 18+ that ever had any sex with a man (%)
Sexual Behavior - Females 18+ that ever had vaginal sex with a man (%)
Sexual Behavior - Females 18+ that ever performed oral sex on a man (%)
Sexual Behavior - Females 18+ that ever had anal sex with a man (%)
Sexual Behavior - Females 18+ that ever had any kind of sex with a woman (%)
Sexual Behavior - Average age people first had sex
Sexual Behavior - Average number of female sex partners in lifetime (males 18+)
Sexual Behavior - Average number of female vaginal sex partners in lifetime (males 18+)
Sexual Behavior - Average age people first performed oral sex on a woman (18+)
Sexual Behavior - Average number of woman performed oral sex on in lifetime (18+)
Sexual Behavior - Average number of male sex partners in lifetime (males 18+)
Sexual Behavior - Average number of male anal sex partners in lifetime (males 18+)
Sexual Behavior - Average age people first performed oral sex on a man (18+)
Sexual Behavior - Average number of male oral sex partners in lifetime (18+)
Sexual Behavior - People using protection when performing oral sex (%)
Sexual Behavior - Average number of times people have vaginal or anal sex a year
Sexual Behavior - People having sex without condom (%)
Sexual Behavior - Average number of male sex partners in lifetime (females 18+)
Sexual Behavior - Average number of male vaginal sex partners in lifetime (females 18+)
Sexual Behavior - Average number of female sex partners in lifetime (females 18+)
Sexual Behavior - Circumcised males 18+ (%)
Sleep Disorders - Average hours sleeping at night
Sleep Disorders - People that has trouble sleeping (%)
Smoking-Cigarette Use - People smoking cigarettes (%)
Taste & Smell - People 40+ having problems with smell (%)
Taste & Smell - People 40+ having problems with taste (%)
Taste & Smell - People 40+ that ever had wisdom teeth removed (%)
Taste & Smell - People 40+ that ever had tonsils teeth removed (%)
Taste & Smell - People 40+ that ever had a loss of consciousness because of a head injury (%)
Taste & Smell - People 40+ that ever had a broken nose or other serious injury to face or skull (%)
Taste & Smell - People 40+ that ever had two or more sinus infections (%)
Weight - Average height (inches)
Weight - Average weight (pounds)
Weight - Average BMI
Weight - People that are obese (%)
Weight - People that ever were obese (%)
Weight - People trying to lose weight (%)
According to our research of Ohio and other state lists, there were 9 registered sex offenders living in Monroe, Ohio as of May 03, 2024 . The ratio of all residents to sex offenders in Monroe is 1,521 to 1.The ratio of registered sex offenders to all residents in this city is much lower than the state average.
Officers per 1,000 residents here:
1.94Ohio average:
2.43
Latest news from Monroe, OH collected exclusively by city-data.com from local newspapers, TV, and radio stations
Ancestries: German (24.3%), English (11.1%), American (10.9%), Irish (6.1%), Arab (5.1%), Italian (3.1%).
Current Local Time:
Land area: 15.5 square miles.
Population density: 999 people per square mile (low).
550 residents are foreign born (1.9% Asia , 0.8% Latin America ).
Median real estate property taxes paid for housing units with mortgages in 2022: $3,479 (1.2%)Median real estate property taxes paid for housing units with no mortgage in 2022: $3,149 (1.2%)
Nearest city with pop. 50,000+: Middletown, OH
Nearest city with pop. 200,000+: Cincinnati, OH
Nearest city with pop. 1,000,000+: Chicago, IL
Nearest cities:
Latitude: 39.44 N, Longitude: 84.36 W
Daytime population change due to commuting: +4,139 (+27.2%)Workers who live and work in this city: 2,172 (27.0%)
Property values in Monroe, OH
Single-family new house construction building permits:
2022: 42 buildings , average cost: $322,6002021: 32 buildings , average cost: $204,9002020: 44 buildings , average cost: $191,6002019: 65 buildings , average cost: $166,6002018: 71 buildings , average cost: $173,5002017: 79 buildings , average cost: $199,5002016: 88 buildings , average cost: $174,8002015: 54 buildings , average cost: $168,7002014: 50 buildings , average cost: $142,6002013: 71 buildings , average cost: $146,1002012: 89 buildings , average cost: $136,1002011: 65 buildings , average cost: $129,9002010: 73 buildings , average cost: $133,0002009: 81 buildings , average cost: $129,9002008: 53 buildings , average cost: $150,3002007: 100 buildings , average cost: $153,2002006: 214 buildings , average cost: $152,9002005: 248 buildings , average cost: $143,2002004: 194 buildings , average cost: $127,3002003: 221 buildings , average cost: $115,8002002: 251 buildings , average cost: $100,8002001: 189 buildings , average cost: $105,5002000: 139 buildings , average cost: $107,4001999: 121 buildings , average cost: $93,7001998: 67 buildings , average cost: $105,4001997: 75 buildings , average cost: $91,500Unemployment in December 2023:
Most common occupations in Monroe, OH (%)
Both Males Females
Other production occupations, including supervisors (6.0%)
Other management occupations, except farmers and farm managers (4.9%)
Electrical equipment mechanics and other installation, maintenance, and repair workers, including supervisors (4.8%)
Preschool, kindergarten, elementary, and middle school teachers (4.6%)
Sales representatives, services, wholesale and manufacturing (4.3%)
Metal workers and plastic workers (4.2%)
Secretaries and administrative assistants (3.9%)
Other production occupations, including supervisors (9.8%)
Electrical equipment mechanics and other installation, maintenance, and repair workers, including supervisors (6.1%)
Metal workers and plastic workers (5.9%)
Other management occupations, except farmers and farm managers (5.2%)
Sales representatives, services, wholesale and manufacturing (4.9%)
Computer specialists (4.3%)
Operations specialties managers, except financial managers (3.6%)
Preschool, kindergarten, elementary, and middle school teachers (9.0%)
Secretaries and administrative assistants (8.4%)
Registered nurses (6.3%)
Other office and administrative support workers, including supervisors (5.7%)
Financial clerks, except bookkeeping, accounting and auditing clerks (5.1%)
Other management occupations, except farmers and farm managers (4.5%)
Customer service representatives (3.7%)
Tornado activity:
Monroe-area historical tornado activity is slightly above Ohio state average. It is 65% greater than the overall U.S. average.
On 4/3/1974, a category F5 (max. wind speeds 261-318 mph) tornado 21.1 miles away from the Monroe city center killed 3 people and injured 210 people .
On 4/3/1974, a category F5 tornado 21.1 miles away from the city center killed 36 people and injured 1150 people and caused between $50,000,000 and $500,000,000 in damages.
Earthquake activity:
Monroe-area historical earthquake activity is significantly above Ohio state average. It is 37% greater than the overall U.S. average. On 7/27/1980 at 18:52:21, a magnitude 5.2 (5.1 MB, 4.7 MS, 5.0 UK, 5.2 UK, Class: Moderate, Intensity: VI - VII) earthquake occurred 88.7 miles away from Monroe center On 4/18/2008 at 09:36:59, a magnitude 5.4 (5.1 MB, 4.8 MS, 5.4 MW, 5.2 MW) earthquake occurred 201.5 miles away from Monroe center On 4/18/2008 at 09:36:59, a magnitude 5.2 (5.2 MW, Depth: 8.9 mi) earthquake occurred 201.5 miles away from the city center On 6/10/1987 at 23:48:54, a magnitude 5.1 (4.9 MB, 4.4 MS, 4.6 MS, 5.1 LG) earthquake occurred 193.8 miles away from Monroe center On 9/7/1988 at 02:28:09, a magnitude 4.6 (4.5 MB, 4.6 LG, Class: Light, Intensity: IV - V) earthquake occurred 93.8 miles away from Monroe center On 7/12/1986 at 08:19:37, a magnitude 4.5 (4.5 MB) earthquake occurred 75.6 miles away from Monroe center Magnitude types: regional Lg-wave magnitude (LG), body-wave magnitude (MB), surface-wave magnitude (MS), moment magnitude (MW) Natural disasters: The number of natural disasters in Butler County (11) is smaller than the US average (15).Major Disasters (Presidential) Declared: 7Emergencies Declared: 3Floods: 5, Storms: 4, Tornadoes: 2, Blizzard: 1, Heavy Rain: 1, Hurricane: 1, Snow: 1, Snowstorm: 1, Tropical Depression: 1, Wind: 1, Other: 1 (Note: some incidents may be assigned to more than one category). Hospitals and medical centers in Monroe: MOUNT PLEASANT RETIREMENT VILLAGE (225 BRITTON LANE)
MT PLEASANT VILLAGE (225 BRITTON RD)
Other hospitals and medical centers near Monroe: GARDEN MANOR EXTENDED CARE CENTER, INC (Nursing Home, about 4 miles away; MIDDLETOWN, OH)
BUTLER COUNTY DIALYSIS (Dialysis Facility, about 4 miles away; FRANKLIN, OH)
BUTLER COUNTY HOME TRAINING DIALYSIS (Dialysis Facility, about 4 miles away; FRANKLIN, OH)
ATRIUM MEDICAL CENTER OUTPATIENT DIALYSIS (Dialysis Facility, about 4 miles away; MIDDLETOWN, OH)
HAWTHORN GLEN NURSING CENTER (Nursing Home, about 4 miles away; MIDDLETOWN, OH)
HOSPICE OF MIDDLETOWN INC (Hospital, about 4 miles away; MIDDLETOWN, OH)
RESIDENCE AT KENSINGTON PLACE (Nursing Home, about 5 miles away; MIDDLETOWN, OH)
Amtrak station near Monroe: 12 miles: HAMILTON (M. L. KING BLVD AT HENRY ST.) Services: public payphones, free short-term parking, call for taxi service, public transit connection.
Colleges/universities with over 2000 students nearest to Monroe:
Miami University-Hamilton (about 12 miles; Hamilton, OH ; Full-time enrollment: 2,906)
University of Cincinnati-Blue Ash College (about 15 miles; Blue Ash, OH ; FT enrollment: 3,711)
Fortis College-Centerville (about 19 miles; Centerville, OH ; FT enrollment: 4,527)
Miami University-Oxford (about 21 miles; Oxford, OH ; FT enrollment: 17,670)
Xavier University (about 22 miles; Cincinnati, OH ; FT enrollment: 6,143)
Cincinnati State Technical and Community College (about 23 miles; Cincinnati, OH ; FT enrollment: 8,757)
University of Dayton (about 23 miles; Dayton, OH ; FT enrollment: 10,392)
Public high schools in Monroe: MONROE JR./SR. HIGH SCHOOL Students: 371, Location: 220 YANKEE RD, Grades: 7-12)BUTLER TECH NATURAL SCIENCE CENTER Location: 640 HAMILTON LEBANON RD, Grades: 11-12)
Public elementary/middle schools in Monroe: MONROE ELEMENTARY SCHOOL Students: 668, Location: 230 YANKEE RD, Grades: 1-6)MONROE PRIMARY SCHOOL Location: 225 MACREADY AVE, Grades: PK-1)
See full list of schools located in Monroe
Notable locations in Monroe: (A) , Monroe Fire Department Station 2 Headquarters (B) , Monroe Fire Department Station 1 (C) . Display/hide their locations on the map
Churches in Monroe include: (A) , First Baptist Church (B) , Mount Pleasant Presbyterian Church (C) . Display/hide their locations on the map
Cemeteries: (1) , Mount Pleasant Cemetery (2) , Monroe Cemetery (3) . Display/hide their locations on the map
Lake: (A) . Display/hide its location on the map
Streams, rivers, and creeks: (A) , Dicks Creek (B) , Gregory Creek (C) , Swamp Run (D) , Fanni Tellis Creek (E) , Clarks Run (F) , Ausbergers Creek (G) . Display/hide their locations on the map
Park in Monroe: (1) . Display/hide its location on the map
Tourist attraction: (1) . Display/hide its approximate location on the map
Hotels: (1) , Hampton Inn Cincinnati/Monroe (40 New Garver Rd) (2) , Days Inn (120 Senate Drive) (3) , Canfield's Pub (1250 Hamilton Lebanon Road Ofc) (4) . Display/hide their approximate locations on the map
Birthplace of: James H. Baker - Soldier, James W. McDill - Politician.
Butler County has a predicted average indoor radon screening level greater than 4 pCi/L (pico curies per liter) - Highest Potential Average household size: This city:
2.6 peopleOhio:
2.4 people
Percentage of family households: This city:
74.9%Whole state:
65.0%
Percentage of households with unmarried partners: This city:
5.4%Whole state:
6.8%
Likely homosexual households (counted as self-reported same-sex unmarried-partner households)
Lesbian couples: 0.4% of all households Gay men: 0.3% of all households
171 people in nursing facilities/skilled-nursing facilities in 2010people in residential treatment centers for adults in 2010people in nursing homes in 2000
Banks with branches in Monroe (2011 data):
U.S. Bank National Association: Monroe Branch at 5 North Main Street, branch established on 1894/01/01. Info updated 2012/01/30: Bank assets: $330,470.8 mil, Deposits: $236,091.5 mil, headquarters in Cincinnati, OH, positive income , 3121 total offices , Holding Company: U.S. Bancorp
First Financial Bank, National Association: Monroe Branch at 108 South Main Street, branch established on 1991/08/07. Info updated 2009/09/21: Bank assets: $6,663.4 mil, Deposits: $5,754.9 mil, headquarters in Hamilton, OH, positive income , Commercial Lending Specialization, 101 total offices , Holding Company: First Financial Bancorp
LCNB National Bank: Monroe Branch at 101clarence F Warner Drive, branch established on 2011/06/20. Info updated 2010/06/02: Bank assets: $787.1 mil, Deposits: $664.9 mil, headquarters in Lebanon, OH, positive income , Commercial Lending Specialization, 26 total offices , Holding Company: Lcnb Corp.
Fifth Third Bank: Monroe Bank Mart Branch at 3033 Heritage Green Drive, branch established on 2006/03/02. Info updated 2009/10/05: Bank assets: $114,540.4 mil, Deposits: $89,689.1 mil, headquarters in Cincinnati, OH, positive income , Commercial Lending Specialization, 1378 total offices , Holding Company: Fifth Third Bancorp
The Huntington National Bank: Mount Pleasant Retirement Center Bra at 210 Mount Pleasant Dr, branch established on 2011/04/21. Info updated 2012/04/02: Bank assets: $54,183.4 mil, Deposits: $44,300.3 mil, headquarters in Columbus, OH, positive income , Commercial Lending Specialization, 878 total offices , Holding Company: Huntington Bancshares Incorporated
JPMorgan Chase Bank, National Association: Monroe Branch at One East Ave, branch established on 1977/01/31. Info updated 2011/11/10: Bank assets: $1,811,678.0 mil, Deposits: $1,190,738.0 mil, headquarters in Columbus, OH, positive income , International Specialization, 5577 total offices , Holding Company: Jpmorgan Chase & Co.
For population 15 years and over in Monroe:
Never married: 24.0%Now married: 62.4%Separated: 0.5%Widowed: 5.5%Divorced: 7.7% For population 25 years and over in Monroe:
High school or higher: 96.7%Bachelor's degree or higher: 38.2%Graduate or professional degree: 12.3%Unemployed: 2.3%Mean travel time to work (commute): 20.0 minutes
Education Gini index (Inequality in education) Here:
10.3Ohio average:
11.0
Religion statistics for Monroe, OH (based on Butler County data)
Religion Adherents Congregations Evangelical Protestant 63,088 210 Catholic 44,417 13 Mainline Protestant 22,088 68 Other 6,647 28 Black Protestant 2,609 13 Orthodox 90 1 None 229,191 -
Source: Clifford Grammich, Kirk Hadaway, Richard Houseal, Dale E.Jones, Alexei Krindatch, Richie Stanley and Richard H.Taylor. 2012. 2010 U.S.Religion Census: Religious Congregations & Membership Study. Association of Statisticians of American Religious Bodies. Jones, Dale E., et al. 2002. Congregations and Membership in the United States 2000. Nashville, TN: Glenmary Research Center. Graphs represent county-level data
Food Environment Statistics: Number of grocery stores : 59Butler County :
1.65 / 10,000 pop.Ohio :
1.89 / 10,000 pop.
Number of supercenters and club stores : 3Butler County :
0.08 / 10,000 pop.Ohio :
0.13 / 10,000 pop.
Number of convenience stores (no gas) : 32Butler County :
0.89 / 10,000 pop.Ohio :
1.25 / 10,000 pop.
Number of convenience stores (with gas) : 109Butler County :
3.05 / 10,000 pop.Ohio :
2.93 / 10,000 pop.
Number of full-service restaurants : 188Butler County :
5.25 / 10,000 pop.Ohio :
6.25 / 10,000 pop.
Adult diabetes rate : Butler County :
10.0%State :
10.3%
Low-income preschool obesity rate : Butler County :
14.7%Ohio :
11.9%
Health and Nutrition:
Average overall health of teeth and gums : People feeling badly about themselves : People not drinking alcohol at all : This city:
8.1%State:
10.4%
Average hours sleeping at night : Overweight people : This city:
34.8%Ohio:
34.3%
General health condition : Average condition of hearing : More about Health and Nutrition of Monroe, OH Residents
Local government employment and payroll (March 2022)
Function
Full-time employees
Monthly full-time payroll
Average yearly full-time wage
Part-time employees
Monthly part-time payroll
Firefighters
36 $257,351 $85,784 0 $0 Police Protection - Officers
29 $210,602 $87,146 0 $0 Streets and Highways
17 $77,176 $54,477 0 $0 Financial Administration
14 $70,116 $60,099 0 $0 Police - Other
7 $60,935 $104,460 0 $0 Other Government Administration
6 $52,065 $104,130 9 $9,551 Water Supply
4 $19,556 $58,668 0 $0 Fire - Other
4 $33,274 $99,822 0 $0 Parks and Recreation
1 $8,126 $97,512 0 $0
Totals for Government
118 $789,199 $80,258 9 $9,551
Monroe government finances - Expenditure in 2021 (per resident):
Construction - Police Protection: $2,895,000 ($186.91)
Regular Highways: $954,000 ($61.59)Parks and Recreation: $255,000 ($16.46)General - Other: $68,000 ($4.39)Current Operations - Local Fire Protection: $5,322,000 ($343.60)
Police Protection: $4,497,000 ($290.34)Central Staff Services: $2,811,000 ($181.48)Regular Highways: $2,230,000 ($143.97)Water Utilities: $2,165,000 ($139.78)Sewerage: $1,617,000 ($104.40)Financial Administration: $1,171,000 ($75.60)Solid Waste Management: $955,000 ($61.66)Parks and Recreation: $390,000 ($25.18)General Public Buildings: $272,000 ($17.56)Miscellaneous Commercial Activities - Other: $85,000 ($5.49)General - Other: $66,000 ($4.26)Judicial and Legal Services: $26,000 ($1.68)General - Interest on Debt: $473,000 ($30.54)
Intergovernmental to Local - Other - Elementary and Secondary Education: $3,676,000 ($237.33)
Other - General - Other: $1,517,000 ($97.94)Other Capital Outlay - Water Utilities: $81,000 ($5.23)
Water Utilities - Interest on Debt: $244,000 ($15.75)
Monroe government finances - Revenue in 2021 (per resident):
Charges - Sewerage: $1,421,000 ($91.74)
Other: $820,000 ($52.94)Solid Waste Management: $744,000 ($48.03)Regular Highways: $225,000 ($14.53)Miscellaneous Commercial Activities: $95,000 ($6.13)Parks and Recreation: $38,000 ($2.45)Miscellaneous - General Revenue - Other: $7,827,000 ($505.33)
Special Assessments: $913,000 ($58.95)Interest Earnings: $626,000 ($40.42)Fines and Forfeits: $121,000 ($7.81)Revenue - Water Utilities: $3,292,000 ($212.54)
State Intergovernmental - Other: $1,934,000 ($124.86)
Highways: $1,093,000 ($70.57)Water Utilities: $85,000 ($5.49)Tax - Individual Income: $12,970,000 ($837.37)
Property: $2,585,000 ($166.89)Other License: $627,000 ($40.48)Motor Vehicle License: $77,000 ($4.97)
Monroe government finances - Debt in 2021 (per resident):
Long Term Debt - Beginning Outstanding - Unspecified Public Purpose: $22,185,000 ($1432.31)
Outstanding Unspecified Public Purpose: $20,772,000 ($1341.08)Retired Unspecified Public Purpose: $1,413,000 ($91.23)
Monroe government finances - Cash and Securities in 2021 (per resident):
Bond Funds - Cash and Securities: $8,745,000 ($564.59)
Other Funds - Cash and Securities: $20,244,000 ($1306.99)
Sinking Funds - Cash and Securities: $2,936,000 ($189.55)
6.49% of this county's 2021 resident taxpayers lived in other counties in 2020 ($55,999 average adjusted gross income )
Here:
6.49%Ohio average:
5.68%
0.01% of residents moved from foreign countries ($83 average AGI )Butler County:
0.01%Ohio average:
0.01%
Top counties from which taxpayers relocated into this county between 2020 and 2021:
Businesses in Monroe, OH
Name Count Name Count
Aeropostale 1 Kincaid 1 Ann Taylor 1 Kroger 1 Banana Republic 1 La-Z-Boy 1 Brooks Brothers 1 Lane Bryant 1 Burger King 1 LensCrafters 1 Charlotte Russe 1 Levi Strauss & Co. 1 Clarks 1 McDonald's 1 Comfort Inn 1 New York & Co 1 Domino's Pizza 1 Nike 1 DressBarn 1 Pac Sun 1 Dressbarn 1 Penske 1 Famous Footwear 1 Popeyes 1 FedEx 1 Rue21 1 Gap 1 Skechers USA 1 Gymboree 1 Subway 2 H&R Block 1 Talbots 1 Honda 1 Tim Hortons 1 Howard Johnson 1 Toys"R"Us 1 IZOD 1 U-Haul 1 J.Crew 1 UPS 1 JoS. A. Bank 1 Waffle House 1 Jones New York 1 Wendy's 1
Strongest AM radio stations in Monroe:
WLW (700 AM; 50 kW; CINCINNATI, OH; Owner: JACOR BROADCASTING CORPORATION)
WPFB (910 AM; 1 kW; MIDDLETOWN, OH)
WSAI (1530 AM; 50 kW; CINCINNATI, OH; Owner: JACOR BROADCASTING CORPORATION)
WCNW (1560 AM; daytime; 5 kW; FAIRFIELD, OH)
WONE (980 AM; 5 kW; DAYTON, OH; Owner: CITICASTERS LICENSES, L.P.)
WCKY (1360 AM; 5 kW; CINCINNATI, OH; Owner: JACOR BROADCASTING CORPORATION)
WTVN (610 AM; 50 kW; COLUMBUS, OH; Owner: CITICASTERS LICENSES, L.P.)
WCIN (1480 AM; 5 kW; CINCINNATI, OH)
WHIO (1290 AM; 5 kW; DAYTON, OH; Owner: CXR HOLDINGS, INC.)
WING (1410 AM; 5 kW; DAYTON, OH)
WKRC (550 AM; 5 kW; CINCINNATI, OH; Owner: JACOR BROADCASTING CORPORATION)
WMOH (1450 AM; 1 kW; HAMILTON, OH; Owner: THE MIAMI RIVER BROADCASTING COMPANY)
WHAS (840 AM; 50 kW; LOUISVILLE, KY; Owner: CLEAR CHANNEL BROADCASTING LICENSES, INC.)
Strongest FM radio stations in Monroe:
WPFB-FM (105.9 FM; MIDDLETOWN, OH; Owner: RADIO STATIONS WPAY/WPFB, INC.)
WYGY (96.5 FM; LEBANON, OH; Owner: WVAE LICO, INC.)
WMOJ (94.9 FM; FAIRFIELD, OH; Owner: WVAE LICO, INC.)
WAQZ (97.3 FM; FORT THOMAS, KY; Owner: INFINITY RADIO OPERATIONS INC.)
WGRR (103.5 FM; HAMILTON, OH; Owner: INFINITY RADIO OPERATIONS INC.)
WLHS (89.9 FM; WEST CHESTER, OH; Owner: LAKOTA LOCAL SCHOOL DISTRICT)
WHKO (99.1 FM; DAYTON, OH; Owner: CXR HOLDINGS, INC.)
WRRM (98.5 FM; CINCINNATI, OH; Owner: WRRM LICO, INC)
WUBE-FM (105.1 FM; CINCINNATI, OH; Owner: INFINITY RADIO OPERATIONS INC.)
WFCJ (93.7 FM; MIAMISBURG, OH; Owner: MIAMI VALLEY CHRISTIAN BROADCASTING ASSOCIATION)
WGUC (90.9 FM; CINCINNATI, OH; Owner: CINCINNATI CLASSICAL PUBLIC RADIO, INC.)
WKRQ (101.9 FM; CINCINNATI, OH; Owner: INFINITY RADIO OPERATIONS INC.)
WKFS (107.1 FM; MILFORD, OH; Owner: JACOR BROADCASTING CORPORATION)
WOFX-FM (92.5 FM; CINCINNATI, OH; Owner: JACOR BROADCASTING CORPORATION)
WVMX (94.1 FM; CINCINNATI, OH; Owner: CITICASTERS LICENSES, L.P.)
WEBN (102.7 FM; CINCINNATI, OH; Owner: JACOR BROADCASTING CORPORATION)
WLQT (99.9 FM; KETTERING, OH; Owner: CITICASTERS LICENSES, L.P.)
WMMX (107.7 FM; DAYTON, OH; Owner: CITICASTERS LICENSES, L.P.)
WTUE (104.7 FM; DAYTON, OH; Owner: CITICASTERS LICENSES, L.P.)
WRNB (92.1 FM; WEST CARROLLTON, OH; Owner: RADIO ONE OF DAYTON LICENSES, LLC)
TV broadcast stations around Monroe:
WHIO-TV (Channel 7; DAYTON, OH; Owner: WHIO-TV HOLDINGS, INC.)
WKOI (Channel 43; RICHMOND, IN; Owner: TRINITY BROADCASTING OF INDIANA, INC.)
WDTN (Channel 2; DAYTON, OH; Owner: WDTN BROADCASTING, LLC)
WPTD (Channel 16; DAYTON, OH; Owner: GREATER DAYTON PUBLIC TV, INC.)
WKEF (Channel 22; DAYTON, OH; Owner: WKEF LICENSEE L.P.)
WRGT-TV (Channel 45; DAYTON, OH; Owner: WRGT LICENSEE, LLC)
WPTO (Channel 14; OXFORD, OH; Owner: GREATER DAYTON PUBLIC TELEVISION, INC.)
WLWT (Channel 5; CINCINNATI, OH; Owner: OHIO/OKLAHOMA HEARST-ARGYLE TV, INC)
WCPO-TV (Channel 9; CINCINNATI, OH; Owner: SCRIPPS HOWARD BROADCASTING COMPANY)
W61DE (Channel 61; CINCINNATI, OH; Owner: TRINITY BROADCASTING NETWORK)
WXIX-TV (Channel 19; NEWPORT, KY; Owner: RAYCOM NATIONAL, INC.)
WKRC-TV (Channel 12; CINCINNATI, OH; Owner: CITICASTERS CO.)
WSTR-TV (Channel 64; CINCINNATI, OH; Owner: WSTR LICENSEE, INC.)
WCET (Channel 48; CINCINNATI, OH; Owner: THE GREATER CINCINNATI TV EDUC'L. FOUNDATION)
WWRD-LP (Channel 55; CENTERVILLE, OH; Owner: LIFE BROADCASTING NETWORK)
WBQC-CA (Channel 25; CINCINNATI, OH; Owner: ELLIOTT B. BLOCK)
WOTH-LP (Channel 35; CINCINNATI, OH; Owner: ELLIOTT B. BLOCK)
WRCX-LP (Channel 51; DAYTON, OH; Owner: ROSS COMMUNICATIONS, LTD.)
WBDT (Channel 26; SPRINGFIELD, OH; Owner: ACME TV LICENSES OF OHIO, LLC)
National Bridge Inventory (NBI) Statistics 49 Number of bridges381ft / 116m Total length993,756 Total average daily traffic143,251 Total average daily truck traffic
New bridges - historical statistics
3 1900-1909 2 1930-1939 1 1950-1959 12 1960-1969 5 1970-1979 5 1980-1989 7 1990-1999 6 2000-2009 8 2010-2019
See full National Bridge Inventory statistics for Monroe, OH
FCC Registered Antenna Towers: 37 (
See the full list of FCC Registered Antenna Towers in Monroe )
FCC Registered Private Land Mobile Towers: 1 (
See the full list of FCC Registered Private Land Mobile Towers in Monroe, OH )
FCC Registered Broadcast Land Mobile Towers: 23 (
See the full list of FCC Registered Broadcast Land Mobile Towers )
FCC Registered Microwave Towers: 9 (
See the full list of FCC Registered Microwave Towers in this town )
FCC Registered Amateur Radio Licenses: 62 (
See the full list of FCC Registered Amateur Radio Licenses in Monroe )
FAA Registered Aircraft: 7
Aircraft: VANS AIRCRAFT INC RV-12 (Category: Land, Seats: 2, Weight: Up to 12,499 Pounds), Engine: ROTAX 912ULS SERIES (100 HP) (4 Cycle)N-Number: 12VN, N12VN, N-12VN, Serial Number: 120106, Year manufactured: 2011, Airworthiness Date: 08/03/2011, Certificate Issue Date: 08/31/2017Registrant (Corporation): Allen Aircraft Inc, 108 Muskingum Cir, Monroe, OH 45050Aircraft: CESSNA 172G (Category: Land, Seats: 4, Weight: Up to 12,499 Pounds, Speed: 105 mph), Engine: CONT MOTOR 0-300 SER (145 HP) (Reciprocating)N-Number: 3648L, N3648L, N-3648L, Serial Number: 17253817, Year manufactured: 1965, Airworthiness Date: 10/28/1965, Certificate Issue Date: 01/23/2020Registrant (Individual): Jagdeep Singh, 853 Hocking Meadow Cir, Monroe, OH 45050Aircraft: AIRFLY BALLOONS N-73 (Category: Land, Weight: Up to 12,499 Pounds), Engine: NoneN-Number: 413CB, N413CB, N-413CB, Serial Number: LPC 200304, Year manufactured: 2010, Airworthiness Date: 05/10/2017, Certificate Issue Date: 02/24/2020Registrant (LLC): Zb Promotions LLC, 80 Brittony Woods Dr, Monroe, OH 45050Aircraft: EMMIGHAUSEN ARTHUR MAX WAIEX (Category: Land, Seats: 2, Weight: Up to 12,499 Pounds), Engine: ReciprocatingN-Number: 59YK, N59YK, N-59YK, Serial Number: W0059Registrant (Individual): Pending Registration, 108 Muskingum Cir, Monroe, OH 45050Aircraft: CAMERON BALLOONS ZL-60 (Category: Land, Weight: Up to 12,499 Pounds), Engine: NoneN-Number: 60ZL, N60ZL, N-60ZL, Serial Number: 6373, Year manufactured: 2004, Airworthiness Date: 05/19/2004, Certificate Issue Date: 01/18/2019Registrant (Individual): Zach Burgess, 80 Brittony Woods Dr, Monroe, OH 45050Aircraft: LINDSTRAND BALLOONS 90A (Category: Land, Weight: Up to 12,499 Pounds), Engine: NoneN-Number: 7502G, N7502G, N-7502G, Serial Number: 5219, Year manufactured: 2002, Airworthiness Date: 12/20/2002, Certificate Issue Date: 02/11/2020Registrant (LLC): Zb Promotions LLC, 80 Brittony Woods Dr, Monroe, OH 45050Aircraft: LUIZ PAULO GNECCO AF-SS-16 (Category: Land, Weight: Up to 12,499 Pounds), Engine: AMA/EXPR UNKNOWN ENG (None)N-Number: 816NP, N816NP, N-816NP, Serial Number: LP2014-02, Year manufactured: 2015, Airworthiness Date: 04/12/2018, Certificate Issue Date: 02/24/2020Registrant (LLC): Zb Promotions LLC, 80 Brittony Woods Dr, Monroe, OH 45050
Home Mortgage Disclosure Act Aggregated Statistics For Year 2009(Based on 3 partial tracts) A) FHA, FSA/RHS & VA B) Conventional C) Refinancings D) Home Improvement Loans F) Non-occupant Loans on G) Loans On Manufactured Number Average Value Number Average Value Number Average Value Number Average Value Number Average Value Number Average Value
LOANS ORIGINATED 134 $163,379 69 $132,054 377 $149,149 4 $49,235 11 $106,986 1 $7,270 APPLICATIONS APPROVED, NOT ACCEPTED 9 $178,310 7 $141,459 31 $171,849 2 $69,650 4 $131,768 0 $0 APPLICATIONS DENIED 23 $162,745 11 $133,264 137 $160,369 10 $61,638 3 $106,870 3 $24,053 APPLICATIONS WITHDRAWN 15 $163,145 6 $127,570 81 $173,580 3 $74,683 1 $720,560 1 $18,160 FILES CLOSED FOR INCOMPLETENESS 2 $112,750 2 $112,460 25 $156,978 1 $39,990 0 $0 1 $17,440
Aggregated Statistics For Year 2008(Based on 3 partial tracts) A) FHA, FSA/RHS & VA B) Conventional C) Refinancings D) Home Improvement Loans E) Loans on Dwellings For 5+ Families F) Non-occupant Loans on G) Loans On Manufactured Number Average Value Number Average Value Number Average Value Number Average Value Number Average Value Number Average Value Number Average Value
LOANS ORIGINATED 81 $169,283 92 $144,505 166 $160,417 13 $37,776 1 $618,030 27 $139,487 2 $15,185 APPLICATIONS APPROVED, NOT ACCEPTED 3 $165,567 6 $143,593 23 $168,524 5 $33,978 0 $0 3 $106,883 1 $5,810 APPLICATIONS DENIED 14 $165,772 18 $146,214 134 $170,077 18 $35,874 1 $661,660 3 $164,987 3 $27,860 APPLICATIONS WITHDRAWN 6 $201,247 13 $164,739 63 $159,643 1 $117,790 0 $0 4 $146,692 0 $0 FILES CLOSED FOR INCOMPLETENESS 1 $153,250 2 $116,555 14 $164,024 1 $23,530 0 $0 1 $161,310 0 $0
Aggregated Statistics For Year 2007(Based on 3 partial tracts) A) FHA, FSA/RHS & VA B) Conventional C) Refinancings D) Home Improvement Loans F) Non-occupant Loans on G) Loans On Manufactured Number Average Value Number Average Value Number Average Value Number Average Value Number Average Value Number Average Value
LOANS ORIGINATED 44 $179,932 273 $134,270 205 $133,196 26 $33,897 40 $140,269 2 $34,590 APPLICATIONS APPROVED, NOT ACCEPTED 1 $214,490 30 $124,477 49 $150,013 6 $18,192 8 $128,266 0 $0 APPLICATIONS DENIED 9 $186,509 61 $137,622 206 $153,103 24 $56,403 17 $135,766 6 $38,930 APPLICATIONS WITHDRAWN 8 $196,680 31 $151,342 60 $165,627 3 $48,763 8 $145,852 0 $0 FILES CLOSED FOR INCOMPLETENESS 1 $160,210 6 $178,882 21 $187,385 1 $96,180 1 $130,550 0 $0
Aggregated Statistics For Year 2006(Based on 3 partial tracts) A) FHA, FSA/RHS & VA B) Conventional C) Refinancings D) Home Improvement Loans E) Loans on Dwellings For 5+ Families F) Non-occupant Loans on G) Loans On Manufactured Number Average Value Number Average Value Number Average Value Number Average Value Number Average Value Number Average Value Number Average Value
LOANS ORIGINATED 46 $178,732 397 $134,634 214 $118,814 28 $47,299 1 $191,950 41 $131,224 0 $0 APPLICATIONS APPROVED, NOT ACCEPTED 4 $170,728 38 $122,134 73 $116,473 9 $29,522 0 $0 6 $140,127 0 $0 APPLICATIONS DENIED 7 $167,197 60 $115,378 180 $144,615 27 $41,508 0 $0 13 $138,720 5 $27,904 APPLICATIONS WITHDRAWN 4 $233,890 37 $124,018 86 $141,655 8 $55,502 0 $0 5 $125,584 0 $0 FILES CLOSED FOR INCOMPLETENESS 0 $0 14 $123,281 43 $156,081 2 $85,795 0 $0 1 $34,900 1 $18,180
Aggregated Statistics For Year 2005(Based on 3 partial tracts) A) FHA, FSA/RHS & VA B) Conventional C) Refinancings D) Home Improvement Loans F) Non-occupant Loans on G) Loans On Manufactured Number Average Value Number Average Value Number Average Value Number Average Value Number Average Value Number Average Value
LOANS ORIGINATED 27 $170,953 397 $129,557 274 $131,011 35 $42,995 40 $117,083 2 $18,625 APPLICATIONS APPROVED, NOT ACCEPTED 0 $0 41 $133,872 51 $125,754 7 $23,184 5 $115,528 2 $12,290 APPLICATIONS DENIED 5 $123,286 71 $122,537 167 $136,806 30 $34,782 17 $138,374 7 $55,824 APPLICATIONS WITHDRAWN 1 $202,050 45 $130,906 114 $148,390 17 $145,112 10 $117,560 0 $0 FILES CLOSED FOR INCOMPLETENESS 0 $0 13 $123,842 32 $151,108 3 $29,197 1 $35,630 0 $0
Aggregated Statistics For Year 2004(Based on 3 partial tracts) A) FHA, FSA/RHS & VA B) Conventional C) Refinancings D) Home Improvement Loans E) Loans on Dwellings For 5+ Families F) Non-occupant Loans on G) Loans On Manufactured Number Average Value Number Average Value Number Average Value Number Average Value Number Average Value Number Average Value Number Average Value
LOANS ORIGINATED 47 $155,008 306 $137,709 281 $128,532 33 $37,224 1 $7,271,000 27 $132,278 3 $61,150 APPLICATIONS APPROVED, NOT ACCEPTED 3 $155,873 41 $128,722 76 $129,498 8 $46,372 0 $0 4 $146,138 3 $37,037 APPLICATIONS DENIED 6 $144,658 45 $97,835 174 $131,019 33 $23,079 0 $0 4 $97,925 10 $30,397 APPLICATIONS WITHDRAWN 1 $111,250 20 $131,948 110 $132,044 9 $25,091 0 $0 2 $215,060 0 $0 FILES CLOSED FOR INCOMPLETENESS 0 $0 8 $165,601 25 $125,192 5 $32,276 0 $0 1 $192,680 0 $0
Aggregated Statistics For Year 2003(Based on 3 partial tracts) A) FHA, FSA/RHS & VA B) Conventional C) Refinancings D) Home Improvement Loans F) Non-occupant Loans on Number Average Value Number Average Value Number Average Value Number Average Value Number Average Value
LOANS ORIGINATED 69 $144,922 323 $138,843 672 $123,647 25 $17,671 32 $113,465 APPLICATIONS APPROVED, NOT ACCEPTED 4 $124,572 19 $133,106 93 $122,385 3 $16,427 2 $164,325 APPLICATIONS DENIED 7 $131,980 39 $119,171 191 $121,604 18 $17,830 4 $125,285 APPLICATIONS WITHDRAWN 4 $115,718 24 $147,676 131 $127,181 5 $42,166 4 $77,618 FILES CLOSED FOR INCOMPLETENESS 1 $60,310 12 $154,972 42 $140,739 2 $47,245 1 $191,950
Aggregated Statistics For Year 2002(Based on 3 partial tracts) A) FHA, FSA/RHS & VA B) Conventional C) Refinancings D) Home Improvement Loans E) Loans on Dwellings For 5+ Families F) Non-occupant Loans on Number Average Value Number Average Value Number Average Value Number Average Value Number Average Value Number Average Value
LOANS ORIGINATED 46 $136,734 245 $137,161 429 $121,055 26 $19,168 3 $769,813 16 $100,695 APPLICATIONS APPROVED, NOT ACCEPTED 2 $148,690 24 $103,088 83 $121,373 7 $14,129 0 $0 1 $112,660 APPLICATIONS DENIED 4 $157,485 32 $72,902 143 $116,355 11 $16,578 1 $3,562,790 7 $62,360 APPLICATIONS WITHDRAWN 7 $135,253 18 $147,879 116 $127,325 2 $15,870 0 $0 4 $87,980 FILES CLOSED FOR INCOMPLETENESS 1 $182,500 6 $139,148 21 $134,271 2 $19,255 0 $0 1 $186,860
Aggregated Statistics For Year 2001(Based on 3 partial tracts) A) FHA, FSA/RHS & VA B) Conventional C) Refinancings D) Home Improvement Loans E) Loans on Dwellings For 5+ Families F) Non-occupant Loans on Number Average Value Number Average Value Number Average Value Number Average Value Number Average Value Number Average Value
LOANS ORIGINATED 53 $130,343 190 $128,173 344 $118,696 33 $12,164 0 $0 16 $154,414 APPLICATIONS APPROVED, NOT ACCEPTED 2 $133,785 23 $92,010 66 $113,324 8 $13,842 0 $0 1 $61,800 APPLICATIONS DENIED 4 $117,608 35 $76,791 124 $111,596 28 $14,395 1 $3,562,790 5 $91,162 APPLICATIONS WITHDRAWN 3 $135,860 15 $91,564 100 $119,314 3 $47,593 0 $0 1 $207,950 FILES CLOSED FOR INCOMPLETENESS 0 $0 3 $114,627 17 $134,452 0 $0 0 $0 1 $52,350
Aggregated Statistics For Year 2000(Based on 3 partial tracts) A) FHA, FSA/RHS & VA B) Conventional C) Refinancings D) Home Improvement Loans F) Non-occupant Loans on Number Average Value Number Average Value Number Average Value Number Average Value Number Average Value
LOANS ORIGINATED 57 $126,399 174 $112,552 72 $89,791 30 $13,482 5 $98,628 APPLICATIONS APPROVED, NOT ACCEPTED 5 $126,792 31 $90,865 25 $89,658 7 $16,463 1 $166,510 APPLICATIONS DENIED 6 $116,723 62 $70,989 71 $84,290 23 $21,029 5 $76,684 APPLICATIONS WITHDRAWN 4 $126,478 21 $109,857 19 $99,633 5 $30,442 1 $166,510 FILES CLOSED FOR INCOMPLETENESS 2 $136,295 7 $95,726 2 $122,155 0 $0 1 $55,260
Aggregated Statistics For Year 1999(Based on 3 partial tracts) A) FHA, FSA/RHS & VA B) Conventional C) Refinancings D) Home Improvement Loans F) Non-occupant Loans on Number Average Value Number Average Value Number Average Value Number Average Value Number Average Value
LOANS ORIGINATED 61 $115,834 144 $98,618 161 $91,311 44 $9,849 11 $79,292 APPLICATIONS APPROVED, NOT ACCEPTED 2 $79,410 25 $69,169 48 $94,169 6 $11,322 2 $37,615 APPLICATIONS DENIED 3 $123,730 57 $60,887 72 $81,597 22 $16,369 4 $87,345 APPLICATIONS WITHDRAWN 5 $105,616 10 $117,666 52 $99,187 6 $54,738 2 $79,330 FILES CLOSED FOR INCOMPLETENESS 1 $99,110 1 $77,400 6 $112,088 0 $0 0 $0
Detailed HMDA statistics for the following Tracts:
0112.00
, 0113.00 , 0316.00
Private Mortgage Insurance Companies Aggregated Statistics For Year 2009(Based on 3 partial tracts) A) Conventional B) Refinancings C) Non-occupant Loans on Number Average Value Number Average Value Number Average Value
LOANS ORIGINATED 11 $152,251 18 $167,123 1 $99,610 APPLICATIONS APPROVED, NOT ACCEPTED 2 $227,865 9 $181,693 0 $0 APPLICATIONS DENIED 2 $184,825 0 $0 0 $0 APPLICATIONS WITHDRAWN 3 $139,093 1 $113,790 0 $0 FILES CLOSED FOR INCOMPLETENESS 0 $0 1 $141,100 0 $0
Aggregated Statistics For Year 2008(Based on 3 partial tracts) A) Conventional B) Refinancings C) Non-occupant Loans on Number Average Value Number Average Value Number Average Value
LOANS ORIGINATED 45 $166,062 21 $183,260 7 $145,314 APPLICATIONS APPROVED, NOT ACCEPTED 14 $163,296 11 $180,977 1 $231,220 APPLICATIONS DENIED 2 $220,260 3 $156,083 3 $183,713 APPLICATIONS WITHDRAWN 1 $259,400 1 $130,880 1 $130,880 FILES CLOSED FOR INCOMPLETENESS 1 $210,520 0 $0 0 $0
Aggregated Statistics For Year 2007(Based on 3 partial tracts) A) Conventional B) Refinancings C) Non-occupant Loans on Number Average Value Number Average Value Number Average Value
LOANS ORIGINATED 80 $158,704 22 $174,673 5 $161,540 APPLICATIONS APPROVED, NOT ACCEPTED 8 $176,809 7 $193,064 0 $0 APPLICATIONS DENIED 1 $79,720 0 $0 0 $0 APPLICATIONS WITHDRAWN 2 $221,670 3 $171,797 1 $158,400 FILES CLOSED FOR INCOMPLETENESS 0 $0 0 $0 0 $0
Aggregated Statistics For Year 2006(Based on 3 partial tracts) A) Conventional B) Refinancings C) Non-occupant Loans on Number Average Value Number Average Value Number Average Value
LOANS ORIGINATED 61 $156,120 14 $170,548 2 $191,635 APPLICATIONS APPROVED, NOT ACCEPTED 9 $168,978 8 $181,531 1 $68,350 APPLICATIONS DENIED 0 $0 0 $0 0 $0 APPLICATIONS WITHDRAWN 3 $187,807 2 $172,685 0 $0 FILES CLOSED FOR INCOMPLETENESS 0 $0 1 $100,340 0 $0
Aggregated Statistics For Year 2005(Based on 3 partial tracts) A) Conventional B) Refinancings C) Non-occupant Loans on Number Average Value Number Average Value Number Average Value
LOANS ORIGINATED 57 $156,918 27 $160,837 2 $143,620 APPLICATIONS APPROVED, NOT ACCEPTED 8 $165,391 11 $157,870 0 $0 APPLICATIONS DENIED 0 $0 0 $0 0 $0 APPLICATIONS WITHDRAWN 2 $172,380 3 $139,300 1 $110,520 FILES CLOSED FOR INCOMPLETENESS 0 $0 0 $0 0 $0
Aggregated Statistics For Year 2004(Based on 3 partial tracts) A) Conventional B) Refinancings C) Non-occupant Loans on Number Average Value Number Average Value Number Average Value
LOANS ORIGINATED 48 $165,531 30 $145,748 2 $114,420 APPLICATIONS APPROVED, NOT ACCEPTED 12 $155,748 18 $145,242 3 $139,120 APPLICATIONS DENIED 0 $0 1 $87,190 0 $0 APPLICATIONS WITHDRAWN 4 $188,768 5 $132,088 1 $131,530 FILES CLOSED FOR INCOMPLETENESS 0 $0 0 $0 0 $0
Aggregated Statistics For Year 2003(Based on 3 partial tracts) A) Conventional B) Refinancings C) Non-occupant Loans on Number Average Value Number Average Value Number Average Value
LOANS ORIGINATED 86 $154,680 103 $144,710 4 $105,550 APPLICATIONS APPROVED, NOT ACCEPTED 17 $167,514 33 $153,055 1 $109,070 APPLICATIONS DENIED 1 $42,900 4 $158,145 1 $191,230 APPLICATIONS WITHDRAWN 3 $157,440 12 $135,494 1 $185,410 FILES CLOSED FOR INCOMPLETENESS 0 $0 0 $0 0 $0
Aggregated Statistics For Year 2002(Based on 3 partial tracts) A) Conventional B) Refinancings C) Non-occupant Loans on Number Average Value Number Average Value Number Average Value
LOANS ORIGINATED 67 $159,305 80 $148,046 2 $116,025 APPLICATIONS APPROVED, NOT ACCEPTED 7 $148,730 18 $140,785 0 $0 APPLICATIONS DENIED 0 $0 3 $186,223 0 $0 APPLICATIONS WITHDRAWN 4 $187,410 10 $151,725 0 $0 FILES CLOSED FOR INCOMPLETENESS 3 $154,147 0 $0 0 $0
Aggregated Statistics For Year 2001(Based on 3 partial tracts) A) Conventional B) Refinancings C) Non-occupant Loans on Number Average Value Number Average Value Number Average Value
LOANS ORIGINATED 57 $142,984 53 $134,066 2 $89,750 APPLICATIONS APPROVED, NOT ACCEPTED 12 $156,491 12 $127,257 0 $0 APPLICATIONS DENIED 1 $101,790 4 $132,638 1 $101,790 APPLICATIONS WITHDRAWN 0 $0 1 $189,770 0 $0 FILES CLOSED FOR INCOMPLETENESS 0 $0 0 $0 0 $0
Aggregated Statistics For Year 2000(Based on 3 partial tracts) A) Conventional B) Refinancings C) Non-occupant Loans on Number Average Value Number Average Value Number Average Value
LOANS ORIGINATED 68 $134,116 11 $123,135 1 $125,060 APPLICATIONS APPROVED, NOT ACCEPTED 10 $152,072 1 $117,000 0 $0 APPLICATIONS DENIED 2 $133,865 1 $148,330 0 $0 APPLICATIONS WITHDRAWN 4 $143,302 0 $0 0 $0 FILES CLOSED FOR INCOMPLETENESS 0 $0 0 $0 0 $0
Aggregated Statistics For Year 1999(Based on 3 partial tracts) A) Conventional B) Refinancings C) Non-occupant Loans on Number Average Value Number Average Value Number Average Value
LOANS ORIGINATED 41 $123,185 22 $114,160 1 $57,870 APPLICATIONS APPROVED, NOT ACCEPTED 3 $106,400 2 $133,940 0 $0 APPLICATIONS DENIED 1 $181,570 1 $71,620 0 $0 APPLICATIONS WITHDRAWN 1 $56,430 1 $63,660 0 $0 FILES CLOSED FOR INCOMPLETENESS 0 $0 0 $0 0 $0
Detailed PMIC statistics for the following Tracts:
0112.00
, 0113.00 , 0316.00 Fire-safe hotels and motels in Monroe, Ohio:
Comfort Inn - Monroe, 120 Senate Dr, Monroe, Ohio 45050 Phone: (513) 539-2660, Fax: (513) 539-2992
Best Western Monroe Inn, 40 New Garver Rd, Monroe, Ohio 45050 Phone: (513) 539-4400, Fax: (513) 539-4664
All 2 fire-safe hotels and motels in Monroe, Ohio
Most common first names in Monroe, OH among deceased individuals Name Count Lived (average)
Mary 147 84.7 years William 123 78.2 years Robert 117 76.4 years Charles 117 74.4 years Helen 96 86.7 years John 84 75.4 years James 72 78.2 years Ruth 72 81.1 years Margaret 63 83.5 years Paul 60 71.1 years
Most common last names in Monroe, OH among deceased individuals Last name Count Lived (average)
Miller 45 83.3 years Smith 45 80.4 years Jones 30 83.7 years Moore 30 82.4 years Williams 27 65.6 years Brown 24 89.2 years Hall 24 75.7 years Baker 21 83.7 years Davis 21 59.3 years Wilson 18 65.7 years
Monroe compared to Ohio state average:
Unemployed percentage significantly below state average. Hispanic race population percentage significantly above state average. Foreign-born population percentage above state average. Renting percentage below state average. House age significantly below state average. Percentage of population with a bachelor's degree or higher above state average.
Top Patent Applicants
David K. Norvell (32)
Matthew Alan Russell (20)
John A. Weed, Iii (11)
Michael Gorden (4)
Kristin Marie Cable (3)
Jared Matthew Wolfe (3)
Brent Taylor Ginn (3)
Daniel Keith Scherrer (2)
William Clifford Ross (2)
Bryce C. Waggoner (2)
Total of 107 patent applications in 2008-2024.
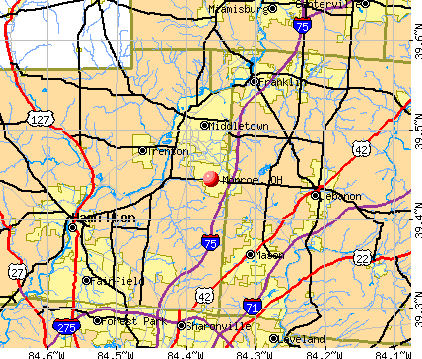


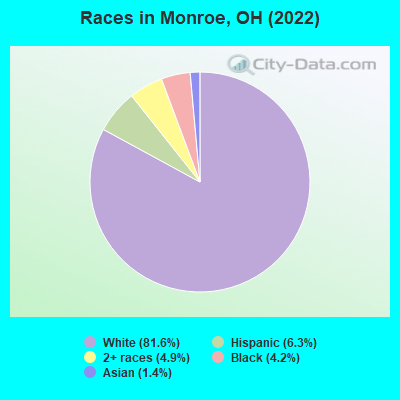
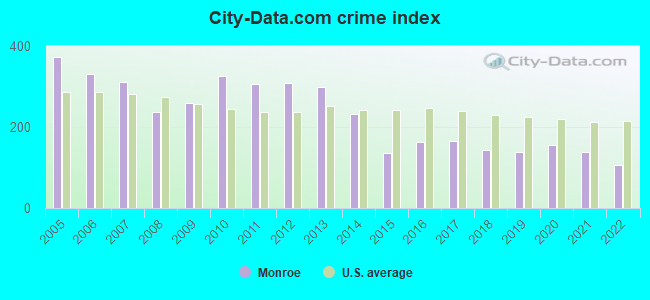
 Recent articles from our blog. Our writers, many of them Ph.D. graduates or candidates, create easy-to-read articles on a wide variety of topics.

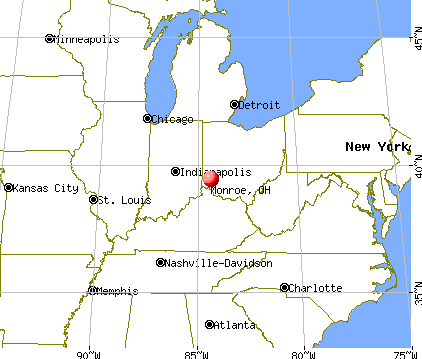
 (4.3 miles
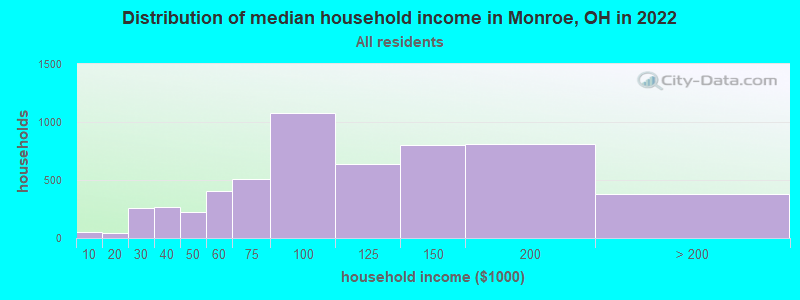
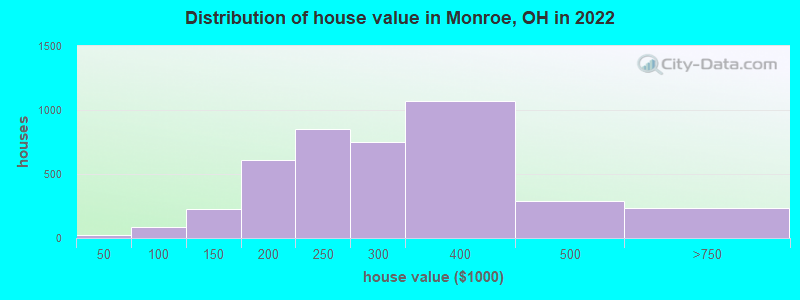
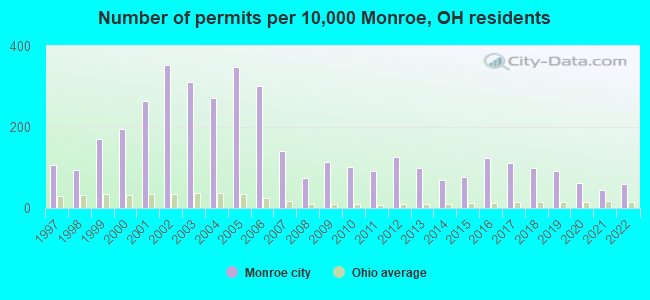
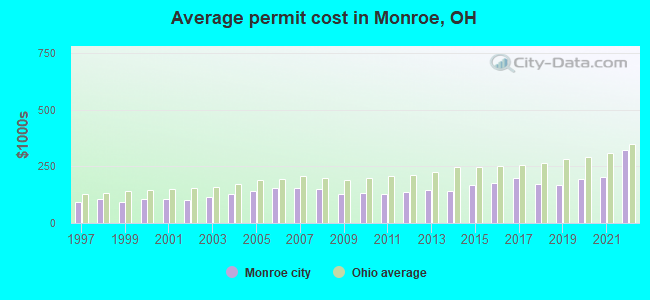
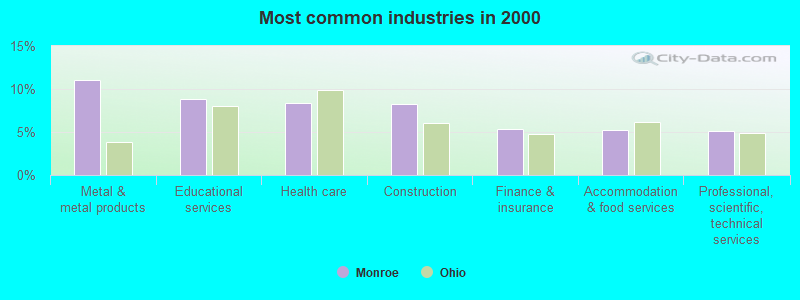
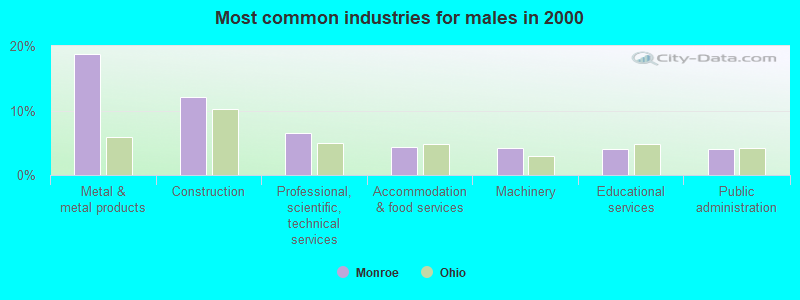
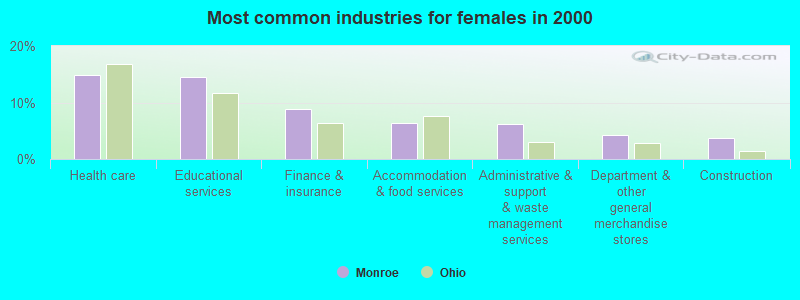
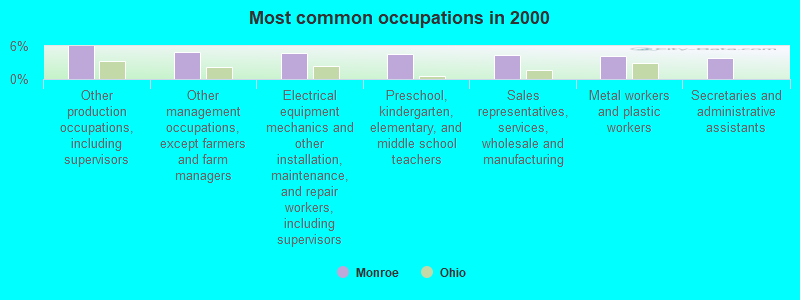
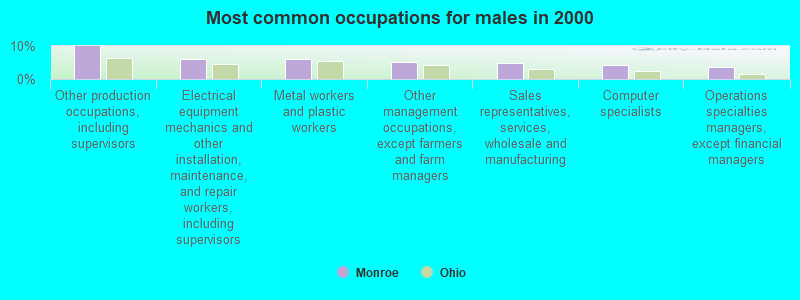
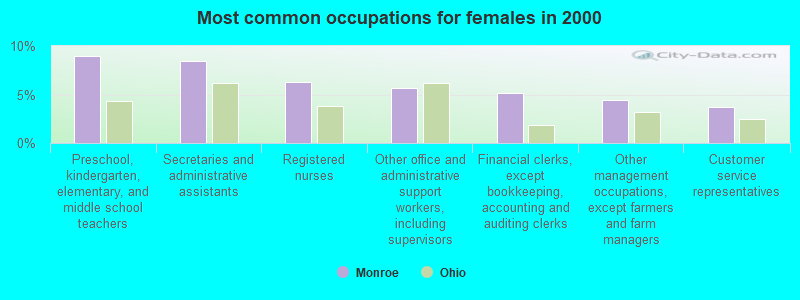

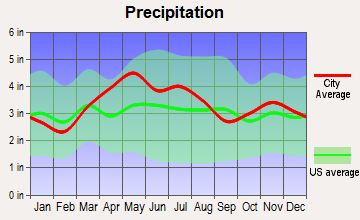


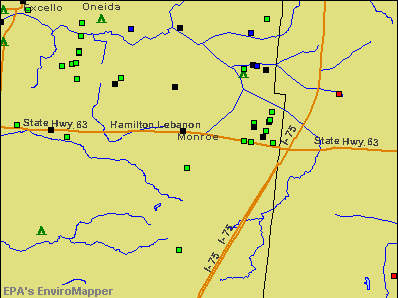

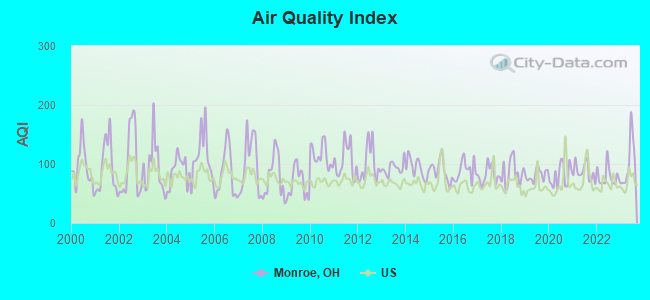
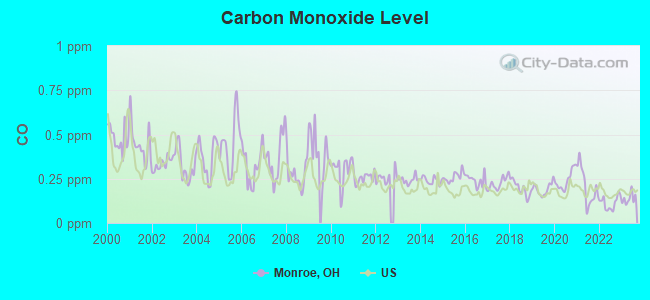
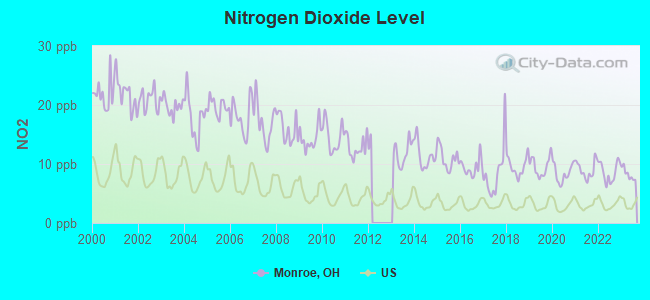
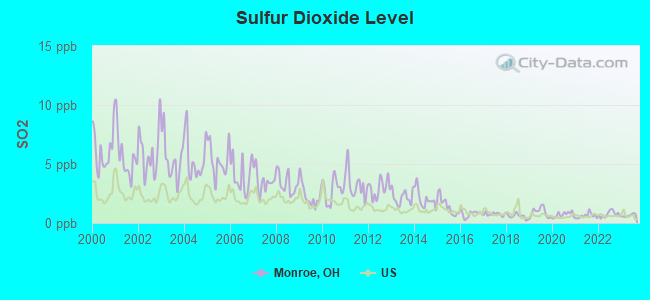
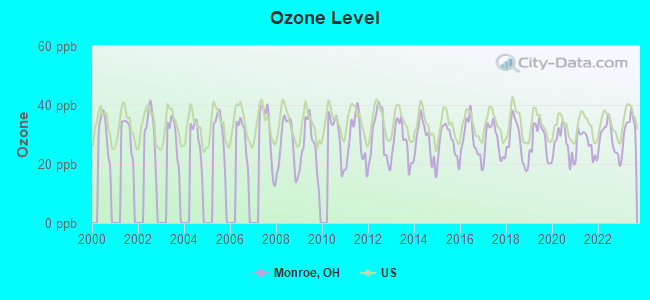
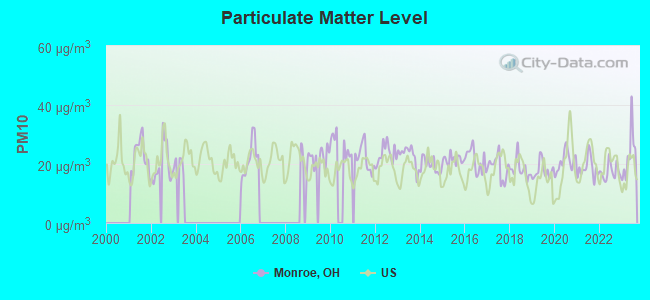
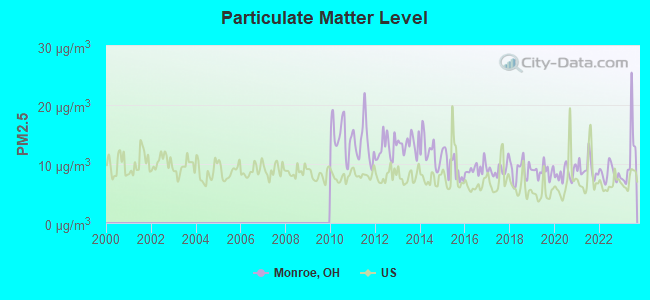
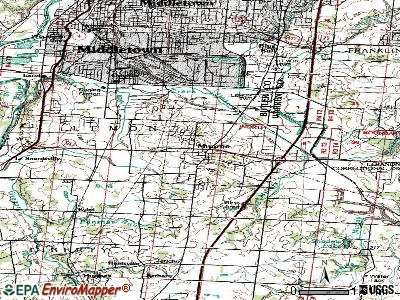
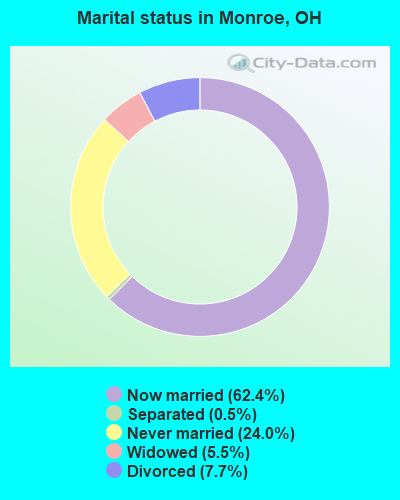
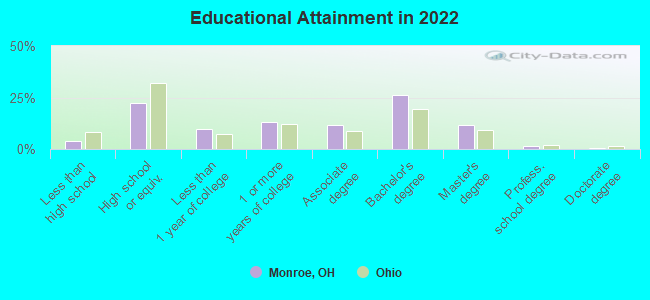
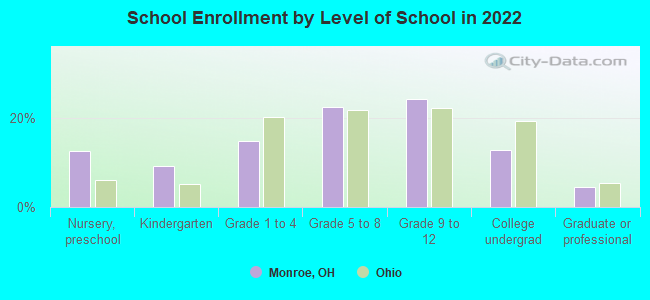
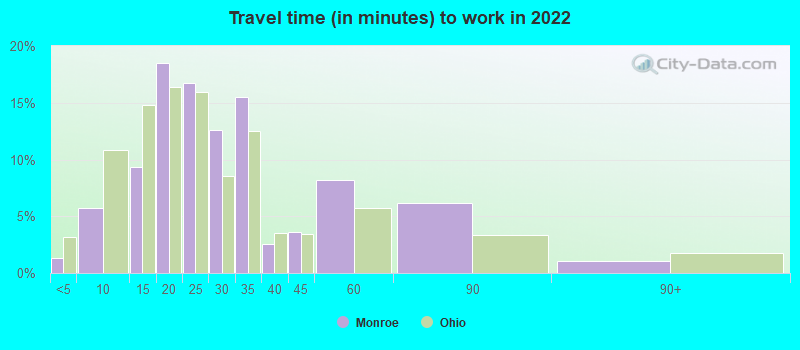
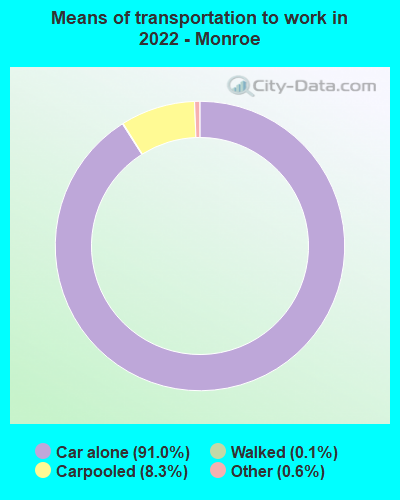
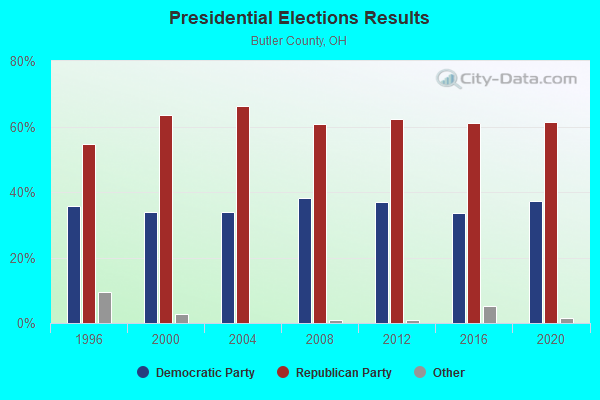
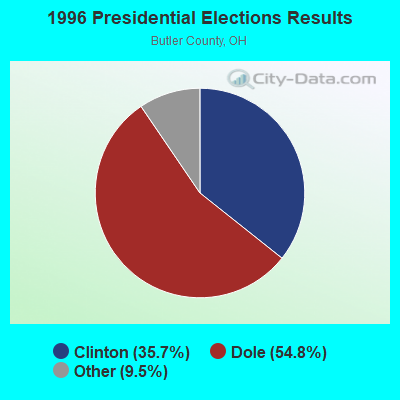
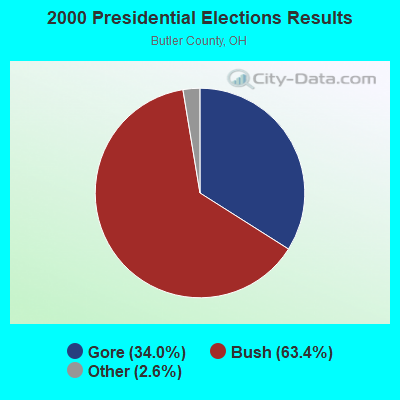
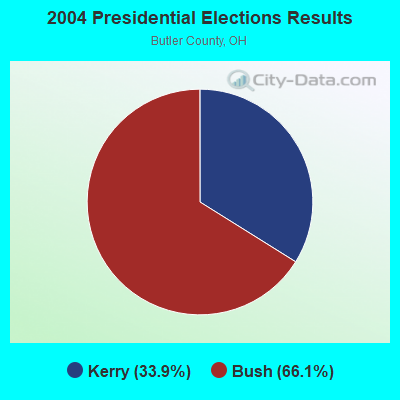
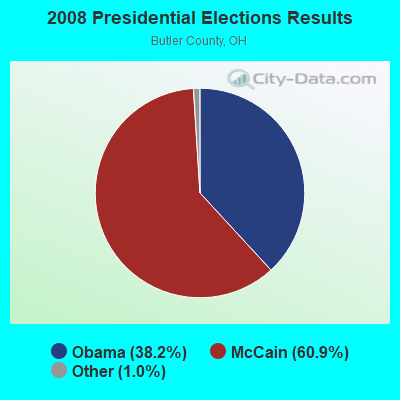
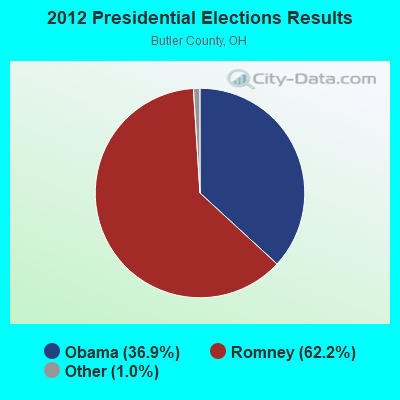
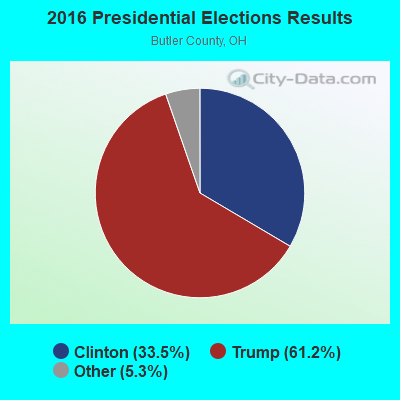
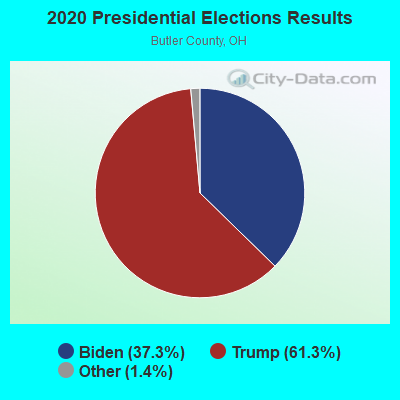
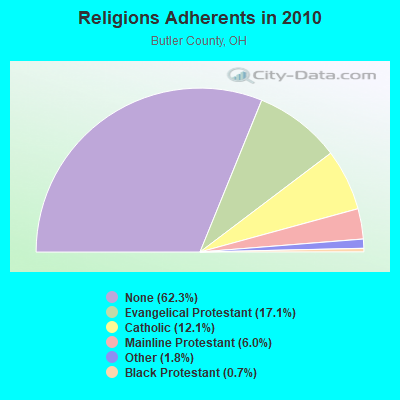
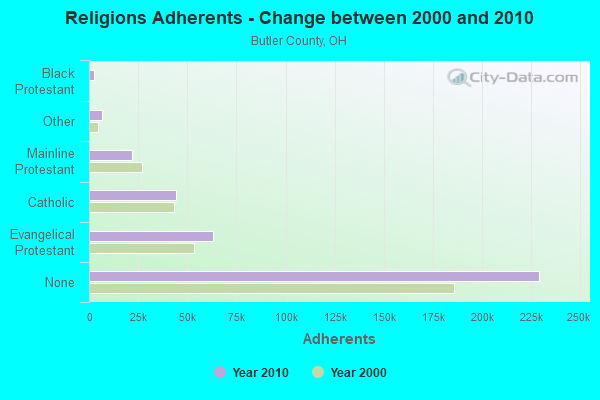
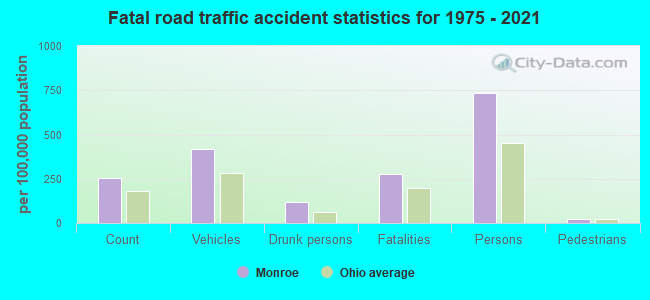
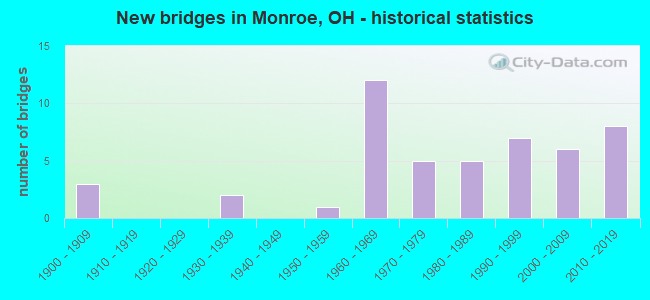
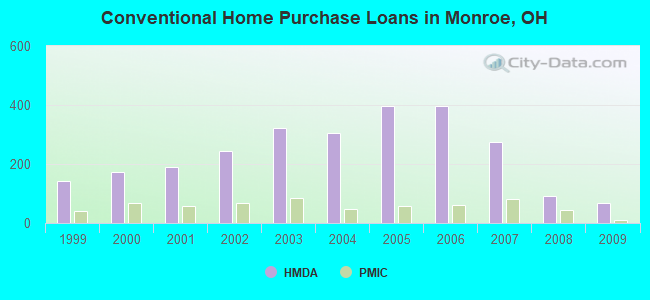
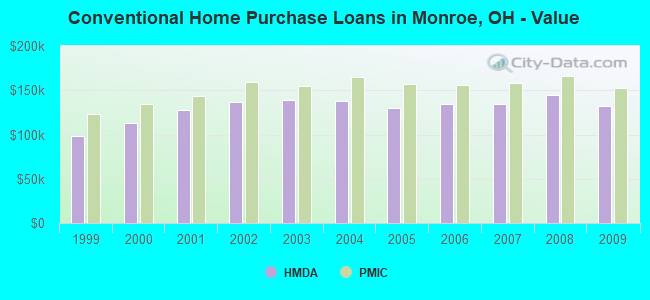
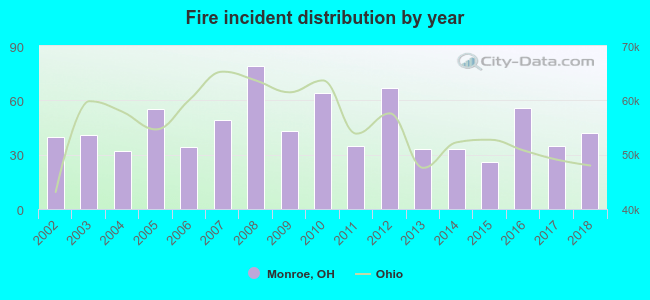 Based on the data from the years 2002 - 2018 the average number of fire incidents per year is 45. The highest number of fire incidents - 79 took place in 2008, and the least - 26 in 2015. The data has a growing trend.
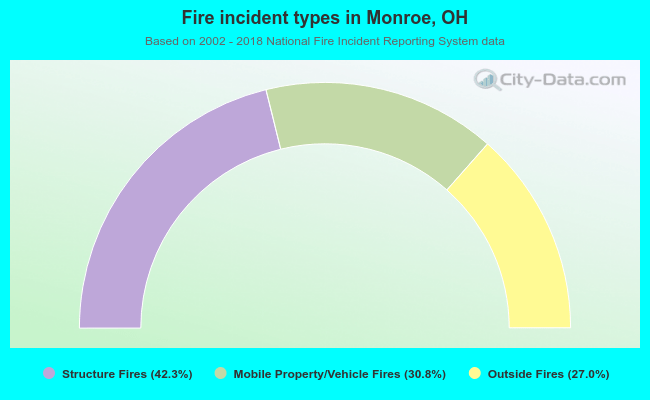 When looking into fire subcategories, the most reports belonged to: Structure Fires (42.3%), and Mobile Property/Vehicle Fires (30.8%).