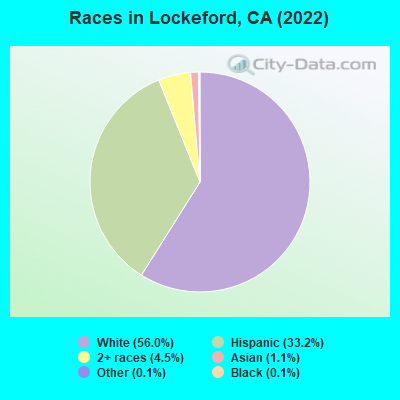
Percentage of residents living in poverty in 2022: 9.8%
(4.8% for White Non-Hispanic residents, 100.0% for Black residents, 19.3% for Hispanic or Latino residents, 100.0% for Native Hawaiian and other Pacific Islander residents, 15.5% for two or more races residents)
20.05%Native Hawaiian and Other Pacific Islander alone
According to our research of California and other state lists, there were 5 registered sex offenders living in Lockeford, California as of May 09, 2024. The ratio of all residents to sex offenders in Lockeford is 673 to 1. The ratio of registered sex offenders to all residents in this city is near the state average.
Recent articles from our blog. Our writers, many of them Ph.D. graduates or candidates, create easy-to-read articles on a wide variety of topics.
Latest news from Lockeford, CA collected exclusively by city-data.com from local newspapers, TV, and radio stations
Ancestries: English (7.3%), European (7.3%), German (7.2%), Dutch (6.0%), Scotch-Irish (5.1%), Italian (4.0%).
Current Local Time: PST time zone
Elevation: 104 feet
Land area: 8.37 square miles.
Population density: 386 people per square mile (very low).
482 residents are foreign born (9.5% Latin America).
This place:
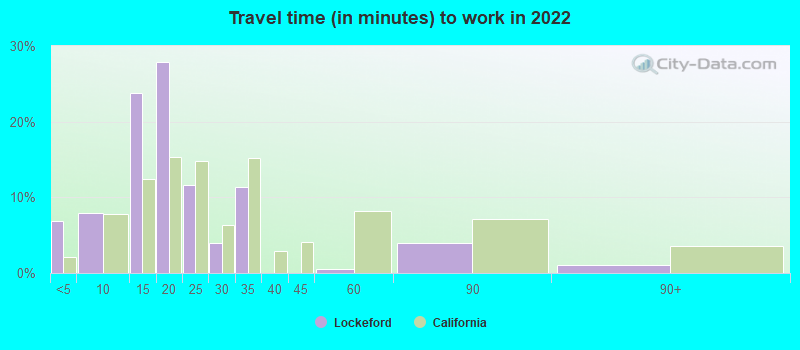
11.5%
California:
26.5%
Median real estate property taxes paid for housing units with mortgages in 2022: $3,085 (0.5%) Median real estate property taxes paid for housing units with no mortgage in 2022: $3,610 (0.9%)
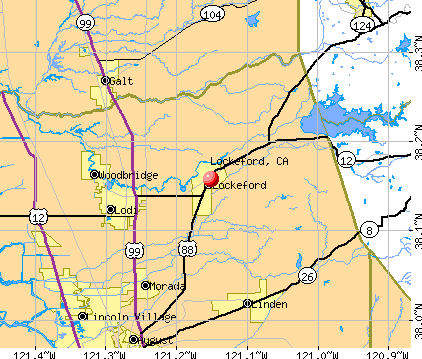
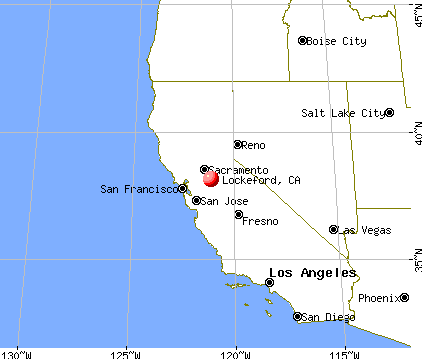
Nearest city with pop. 50,000+: Lodi, CA (7.3 miles , pop. 56,999).
Nearest city with pop. 200,000+: Stockton, CA (15.0 miles , pop. 243,771).
Nearest city with pop. 1,000,000+: Los Angeles, CA (321.4 miles , pop. 3,694,820).
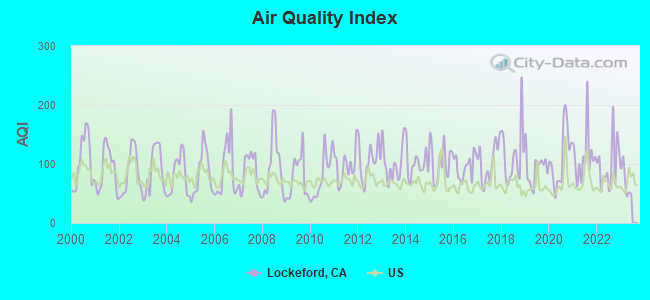
Air Quality Index (AQI) level in 2022 was 98.8. This is worse than average.
City:
98.8
U.S.:
72.6
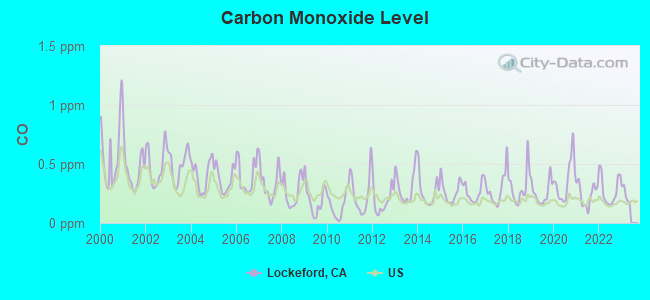
Carbon Monoxide (CO) [ppm] level in 2022 was 0.278. This is about average.Closest monitor was 7.9 miles away from the city center.
City:
0.278
U.S.:
0.251
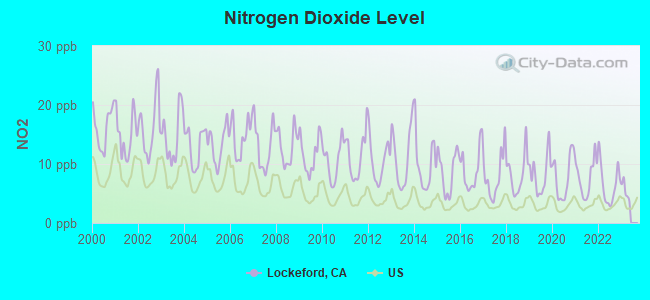
Nitrogen Dioxide (NO2) [ppb] level in 2022 was 6.57. This is worse than average.Closest monitor was 15.3 miles away from the city center.
City:
6.57
U.S.:
5.11
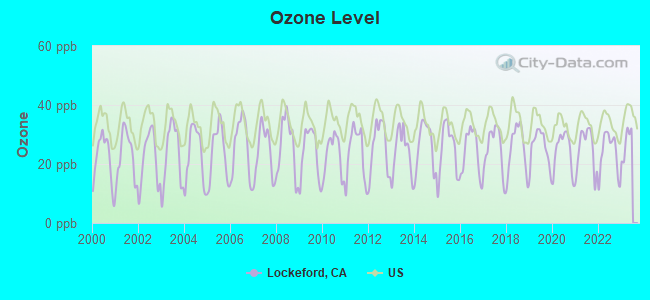
Ozone [ppb] level in 2022 was 23.6. This is significantly better than average.Closest monitor was 7.9 miles away from the city center.
City:
23.6
U.S.:
33.3
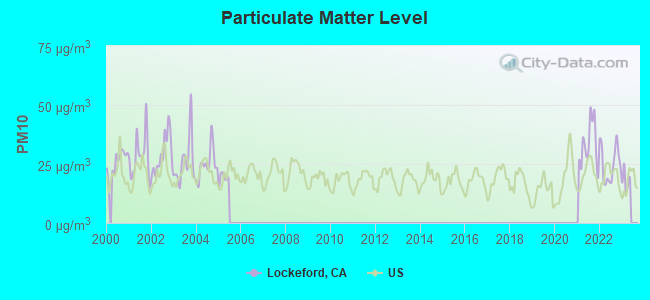
Particulate Matter (PM10) [µg/m3] level in 2022 was 25.0. This is worse than average.Closest monitor was 14.1 miles away from the city center.
City:
25.0
U.S.:
19.2
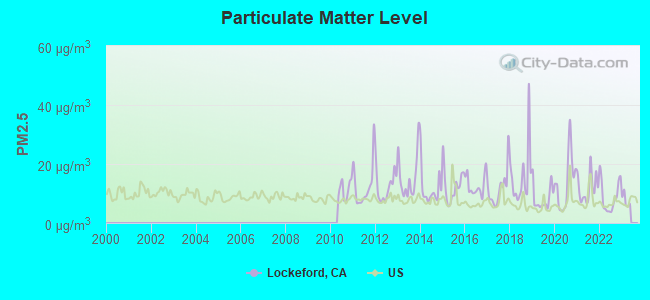
Particulate Matter (PM2.5) [µg/m3] level in 2022 was 8.99. This is about average.Closest monitor was 15.3 miles away from the city center.
City:
8.99
U.S.:
8.11
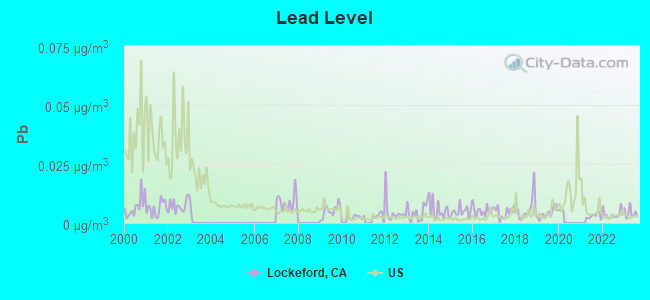
Lead (Pb) [µg/m3] level in 2023 was 0.00414. This is significantly better than average.Closest monitor was 13.8 miles away from the city center.
City:
0.00414
U.S.:
0.00931
Earthquake activity:
Lockeford-area historical earthquake activity is significantly above California state average. It is 7933% greater than the overall U.S. average.
On 4/18/1906 at 13:12:21, a magnitude 7.9 (7.9 UK, Class: Major, Intensity: VIII - XII) earthquake occurred 101.2 miles away from Lockeford center, causing $524,000,000 total damage On 10/18/1989 at 00:04:15, a magnitude 7.1 (6.5 MB, 7.1 MS, 6.9 MW, 7.0 ML) earthquake occurred 80.0 miles away from the city center, causing 62 deaths (62 shaking deaths) and 3757 injuries, causing $1,305,032,704 total damage On 7/21/1952 at 11:52:14, a magnitude 7.7 (7.7 UK) earthquake occurred 248.9 miles away from the city center, causing $50,000,000 total damage On 11/4/1927 at 13:51:53, a magnitude 7.5 (7.5 UK) earthquake occurred 224.4 miles away from the city center On 10/3/1915 at 06:52:48, a magnitude 7.6 (7.6 UK) earthquake occurred 253.8 miles away from Lockeford center On 12/21/1932 at 06:10:09, a magnitude 7.2 (7.2 UK) earthquake occurred 168.2 miles away from the city center Magnitude types: body-wave magnitude (MB), local magnitude (ML), surface-wave magnitude (MS), moment magnitude (MW)
Natural disasters:
The number of natural disasters in San Joaquin County (20) is greater than the US average (15). Major Disasters (Presidential) Declared: 15 Emergencies Declared: 3
Causes of natural disasters: Floods: 13, Storms: 7, Mudslides: 4, Landslides: 3, Winter Storms: 3, Drought: 1, Earthquake: 1, Freeze: 1, Heavy Rain: 1, Hurricane: 1, Tornado: 1, Wind: 1, Other: 2 (Note: some incidents may be assigned to more than one category).
Hospitals and medical centers near Lockeford:
REIMS ICFDD-H (Hospital, about 4 miles away; ACAMPO, CA)
ARBOR NURSING CENTER (Nursing Home, about 7 miles away; LODI, CA)
WINE COUNTRY CARE CENTER (Nursing Home, about 7 miles away; LODI, CA)
TOKAY DIALYSIS CENTER (Dialysis Facility, about 8 miles away; LODI, CA)
ALPINE ICF (Hospital, about 8 miles away; LODI, CA)
BECHTHOLD CONV HOSP (Nursing Home, about 8 miles away; LODI, CA)
CRESCENT COURT NURSING HOME (Nursing Home, about 8 miles away; LODI, CA)
Amtrak stations near Lockeford:
16 miles: STOCKTON, CABRAL STATION (STOCKTON, 949 E. CHANNEL ST.) . Services: public payphones.
17 miles: STOCKTON, SAN JOAQUIN ST. (STOCKTON, 735 S. SAN JOAQUIN ST.) . Services: ticket office, fully wheelchair accessible, enclosed waiting area, public restrooms, public payphones, vending machines, free short-term parking, call for car rental service, call for taxi service, public transit connection.
Colleges/universities with over 2000 students nearest to Lockeford:
San Joaquin Delta College (about 15 miles; Stockton, CA; Full-time enrollment: 12,167)
University of the Pacific (about 15 miles; Stockton, CA; FT enrollment: 4,999)
Cosumnes River College (about 26 miles; Sacramento, CA; FT enrollment: 9,327)
California State University-Sacramento (about 32 miles; Sacramento, CA; FT enrollment: 22,234)
Sacramento City College (about 33 miles; Sacramento, CA; FT enrollment: 15,963)
Folsom Lake College (about 35 miles; Folsom, CA; FT enrollment: 5,308)
American River College (about 36 miles; Sacramento, CA; FT enrollment: 20,452)
Notable locations in Lockeford: La Lomito Rancho (A), Mokelumne Rural Fire Department (B), Lockeford Community Center (C). Display/hide their locations on the map
Churches in Lockeford include: First Landmark Missionary Baptist Church (A), Gospel Lighthouse Pentecostal Church of God (B), Grace Church of Lockeford (C), Saint Joachim Catholic Church (D). Display/hide their locations on the map
San Joaquin County has a predicted average indoor radon screening level less than 2 pCi/L (pico curies per liter) - Low Potential
Drinking water stations with addresses in Lockeford and their reported violations in the past:
TUSCAN WINERY VILLAGE (Population served: 25, Groundwater):
Past health violations:
MCL, Monthly (TCR) - In MAY-2011, Contaminant: Coliform. Follow-up actions: St Public Notif requested (MAY-01-2011), St Compliance achieved (MAY-01-2011)
MCL, Monthly (TCR) - In APR-2011, Contaminant: Coliform. Follow-up actions: St Public Notif requested (APR-01-2011), St Compliance achieved (MAY-01-2011)
Past monitoring violations:
10 routine major monitoring violations
Average household size:
This place:
2.8 people
California:
2.9 people
Percentage of family households:
This place:
72.3%
Whole state:
68.7%
Percentage of households with unmarried partners:
This place:
6.6%
Whole state:
7.2%
Likely homosexual households (counted as self-reported same-sex unmarried-partner households)
Lesbian couples: 0.4% of all households
Gay men: 0.1% of all households
16 people in group homes intended for adults in 2010
Banks with branches in Lockeford (2011 data):
Wells Fargo Bank, National Association: Lockeford Branch at 19000 North Highway 88, branch established on 1990/01/10. Info updated 2011/04/05: Bank assets: $1,161,490.0 mil, Deposits: $905,653.0 mil, headquarters in Sioux Falls, SD, positive income, 6395 total offices, Holding Company: Wells Fargo & Company
Bank of the West: Lockeford Branch at 13299 East Highway 88, branch established on 1907/01/01. Info updated 2009/11/16: Bank assets: $62,408.3 mil, Deposits: $43,995.2 mil, headquarters in San Francisco, CA, positive income, 647 total offices, Holding Company: Bnp Paribas
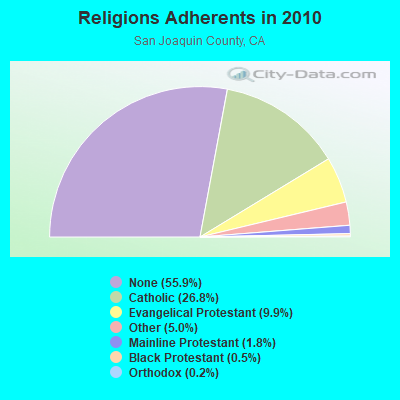
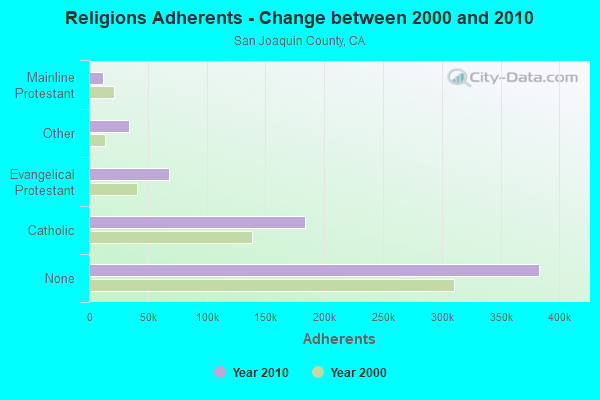
Religion statistics for Lockeford, CA (based on San Joaquin County data)
Religion
Adherents
Congregations
Catholic
183,692
18
Evangelical Protestant
67,940
304
Other
33,949
68
Mainline Protestant
12,067
43
Black Protestant
3,251
17
Orthodox
1,368
2
None
383,039
-
Source: Clifford Grammich, Kirk Hadaway, Richard Houseal, Dale E.Jones, Alexei Krindatch, Richie Stanley and Richard H.Taylor. 2012. 2010 U.S.Religion Census: Religious Congregations & Membership Study. Association of Statisticians of American Religious Bodies. Jones, Dale E., et al. 2002. Congregations and Membership in the United States 2000. Nashville, TN: Glenmary Research Center. Graphs represent county-level data
Aircraft: CESSNA T210N (Category: Land, Seats: 6, Weight: Up to 12,499 Pounds), Engine: CONT MOTOR TSIO-520 SER (300 HP) (Reciprocating) N-Number: 211L, N211L, N-211L, Serial Number: 21063183, Year manufactured: 1979, Airworthiness Date: 03/05/1979, Certificate Issue Date: 07/16/2013 Registrant (Corporation): R & G Schatz Farms Inc, 18247 N Tretheway Rd, Lockeford, CA 95237
Aircraft: PIPER PA-32-260 (Category: Land, Seats: 6, Weight: Up to 12,499 Pounds, Speed: 126 mph), Engine: LYCOMING 0-540 SERIES (250 HP) (Reciprocating) N-Number: 4855S, N4855S, N-4855S, Serial Number: 32-1295, Year manufactured: 1970, Airworthiness Date: 07/29/1970, Certificate Issue Date: 11/16/2018 Registrant (Co-Owned): Tanen J Munoz, Po Box 616, Lockeford, CA 95237, Other Owners: Brian G Rogian
Aircraft: LIPSCOMB STARDUSTER TOO (Category: Land, Seats: 2, Weight: Up to 12,499 Pounds), Engine: LYCOMING IO-540 SER (300 HP) (Reciprocating) N-Number: 80MM, N80MM, N-80MM, Serial Number: 249, Year manufactured: 1980, Airworthiness Date: 05/18/1995, Certificate Issue Date: 07/25/2012 Registrant (Individual): Patrick A Todd, Po Box 817, Lockeford, CA 95237
Home Mortgage Disclosure Act Aggregated Statistics For Year 2009 (Based on 1 full tract)
A) FHA, FSA/RHS & VA Home Purchase Loans
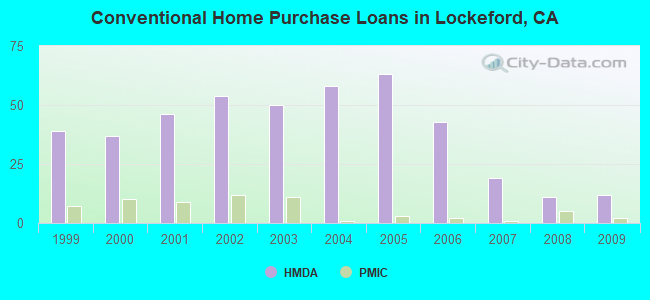
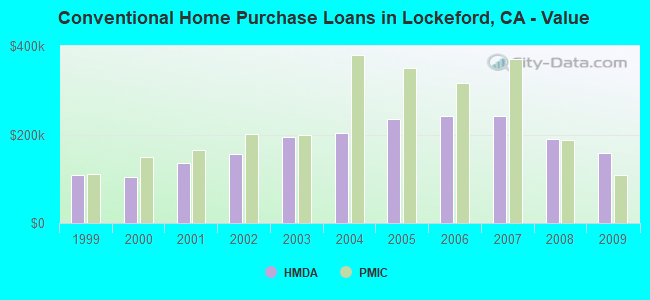
B) Conventional Home Purchase Loans
C) Refinancings
D) Home Improvement Loans
F) Non-occupant Loans on < 5 Family Dwellings (A B C & D)
G) Loans On Manufactured Home Dwelling (A B C & D)
Number
Average Value
Number
Average Value
Number
Average Value
Number
Average Value
Number
Average Value
Number
Average Value
LOANS ORIGINATED
16
$190,250
12
$157,417
15
$231,867
0
$0
6
$154,167
1
$25,000
APPLICATIONS APPROVED, NOT ACCEPTED
1
$177,000
1
$84,000
3
$238,333
0
$0
0
$0
0
$0
APPLICATIONS DENIED
3
$166,333
2
$42,000
21
$231,619
2
$5,000
2
$130,500
3
$29,667
APPLICATIONS WITHDRAWN
1
$236,000
0
$0
10
$178,100
1
$64,000
0
$0
0
$0
FILES CLOSED FOR INCOMPLETENESS
1
$240,000
0
$0
2
$337,000
0
$0
0
$0
0
$0
Aggregated Statistics For Year 2008 (Based on 1 full tract)
A) FHA, FSA/RHS & VA Home Purchase Loans
B) Conventional Home Purchase Loans
C) Refinancings
D) Home Improvement Loans
F) Non-occupant Loans on < 5 Family Dwellings (A B C & D)
G) Loans On Manufactured Home Dwelling (A B C & D)
Number
Average Value
Number
Average Value
Number
Average Value
Number
Average Value
Number
Average Value
Number
Average Value
LOANS ORIGINATED
8
$204,500
11
$190,455
25
$206,800
5
$128,600
6
$183,333
0
$0
APPLICATIONS APPROVED, NOT ACCEPTED
0
$0
2
$208,500
4
$319,750
2
$21,500
1
$268,000
0
$0
APPLICATIONS DENIED
3
$248,333
5
$108,200
23
$250,739
7
$57,000
7
$191,429
1
$75,000
APPLICATIONS WITHDRAWN
1
$236,000
0
$0
13
$233,077
5
$137,000
1
$125,000
0
$0
FILES CLOSED FOR INCOMPLETENESS
0
$0
0
$0
3
$183,667
1
$10,000
0
$0
0
$0
Aggregated Statistics For Year 2007 (Based on 1 full tract)
A) FHA, FSA/RHS & VA Home Purchase Loans
B) Conventional Home Purchase Loans
C) Refinancings
D) Home Improvement Loans
F) Non-occupant Loans on < 5 Family Dwellings (A B C & D)
G) Loans On Manufactured Home Dwelling (A B C & D)
Number
Average Value
Number
Average Value
Number
Average Value
Number
Average Value
Number
Average Value
Number
Average Value
LOANS ORIGINATED
1
$351,000
19
$240,842
55
$221,618
17
$121,235
6
$193,833
0
$0
APPLICATIONS APPROVED, NOT ACCEPTED
0
$0
5
$169,200
23
$249,826
1
$73,000
0
$0
3
$98,667
APPLICATIONS DENIED
0
$0
6
$364,167
52
$270,231
6
$83,833
3
$184,000
2
$28,500
APPLICATIONS WITHDRAWN
1
$193,000
3
$265,667
15
$202,400
3
$170,333
1
$397,000
0
$0
FILES CLOSED FOR INCOMPLETENESS
0
$0
1
$500,000
5
$318,800
0
$0
0
$0
0
$0
Aggregated Statistics For Year 2006 (Based on 1 full tract)
B) Conventional Home Purchase Loans
C) Refinancings
D) Home Improvement Loans
F) Non-occupant Loans on < 5 Family Dwellings (A B C & D)
G) Loans On Manufactured Home Dwelling (A B C & D)
Number
Average Value
Number
Average Value
Number
Average Value
Number
Average Value
Number
Average Value
LOANS ORIGINATED
43
$242,140
122
$238,566
14
$219,357
14
$227,286
1
$38,000
APPLICATIONS APPROVED, NOT ACCEPTED
5
$278,000
31
$213,258
1
$295,000
2
$168,500
0
$0
APPLICATIONS DENIED
18
$191,333
57
$242,368
9
$75,889
4
$121,250
1
$344,000
APPLICATIONS WITHDRAWN
6
$296,000
43
$287,465
1
$60,000
2
$310,000
0
$0
FILES CLOSED FOR INCOMPLETENESS
2
$489,500
12
$290,333
0
$0
2
$418,000
0
$0
Aggregated Statistics For Year 2005 (Based on 1 full tract)
A) FHA, FSA/RHS & VA Home Purchase Loans
B) Conventional Home Purchase Loans
C) Refinancings
D) Home Improvement Loans
F) Non-occupant Loans on < 5 Family Dwellings (A B C & D)
G) Loans On Manufactured Home Dwelling (A B C & D)
Number
Average Value
Number
Average Value
Number
Average Value
Number
Average Value
Number
Average Value
Number
Average Value
LOANS ORIGINATED
0
$0
63
$235,937
135
$245,489
21
$160,667
7
$234,143
0
$0
APPLICATIONS APPROVED, NOT ACCEPTED
0
$0
18
$186,222
18
$234,833
2
$16,000
4
$166,250
3
$54,333
APPLICATIONS DENIED
1
$83,000
17
$191,824
65
$247,277
14
$80,643
1
$322,000
1
$27,000
APPLICATIONS WITHDRAWN
0
$0
5
$180,000
44
$236,386
8
$127,000
0
$0
0
$0
FILES CLOSED FOR INCOMPLETENESS
0
$0
3
$213,333
17
$271,529
0
$0
0
$0
0
$0
Aggregated Statistics For Year 2004 (Based on 1 full tract)
A) FHA, FSA/RHS & VA Home Purchase Loans
B) Conventional Home Purchase Loans
C) Refinancings
D) Home Improvement Loans
E) Loans on Dwellings For 5+ Families
F) Non-occupant Loans on < 5 Family Dwellings (A B C & D)
G) Loans On Manufactured Home Dwelling (A B C & D)
Number
Average Value
Number
Average Value
Number
Average Value
Number
Average Value
Number
Average Value
Number
Average Value
Number
Average Value
LOANS ORIGINATED
1
$138,000
58
$203,776
142
$191,021
16
$104,875
1
$765,000
11
$167,909
1
$172,000
APPLICATIONS APPROVED, NOT ACCEPTED
0
$0
5
$186,600
34
$177,412
8
$100,125
0
$0
1
$144,000
2
$135,000
APPLICATIONS DENIED
0
$0
10
$124,000
49
$208,571
9
$103,778
0
$0
2
$119,000
3
$58,333
APPLICATIONS WITHDRAWN
0
$0
6
$254,167
50
$187,540
6
$133,667
1
$500,000
1
$95,000
0
$0
FILES CLOSED FOR INCOMPLETENESS
0
$0
0
$0
14
$235,429
2
$35,000
0
$0
0
$0
0
$0
Aggregated Statistics For Year 2003 (Based on 1 full tract)
A) FHA, FSA/RHS & VA Home Purchase Loans
B) Conventional Home Purchase Loans
C) Refinancings
D) Home Improvement Loans
E) Loans on Dwellings For 5+ Families
F) Non-occupant Loans on < 5 Family Dwellings (A B C & D)
Number
Average Value
Number
Average Value
Number
Average Value
Number
Average Value
Number
Average Value
Number
Average Value
LOANS ORIGINATED
7
$180,857
50
$195,040
243
$159,296
2
$52,500
0
$0
14
$157,143
APPLICATIONS APPROVED, NOT ACCEPTED
0
$0
5
$158,800
45
$156,311
4
$44,750
0
$0
6
$103,167
APPLICATIONS DENIED
0
$0
13
$178,692
57
$169,140
8
$27,750
0
$0
3
$217,333
APPLICATIONS WITHDRAWN
1
$199,000
8
$239,375
52
$179,462
1
$39,000
0
$0
2
$288,500
FILES CLOSED FOR INCOMPLETENESS
0
$0
3
$79,667
7
$120,429
1
$19,000
1
$530,000
1
$100,000
Aggregated Statistics For Year 2002 (Based on 1 full tract)
A) FHA, FSA/RHS & VA Home Purchase Loans
B) Conventional Home Purchase Loans
C) Refinancings
D) Home Improvement Loans
E) Loans on Dwellings For 5+ Families
F) Non-occupant Loans on < 5 Family Dwellings (A B C & D)
Number
Average Value
Number
Average Value
Number
Average Value
Number
Average Value
Number
Average Value
Number
Average Value
LOANS ORIGINATED
9
$155,556
54
$156,463
141
$139,383
5
$45,600
2
$524,000
10
$98,400
APPLICATIONS APPROVED, NOT ACCEPTED
0
$0
5
$216,600
20
$129,350
1
$25,000
0
$0
4
$191,750
APPLICATIONS DENIED
0
$0
10
$184,700
54
$147,926
9
$27,667
0
$0
3
$123,000
APPLICATIONS WITHDRAWN
0
$0
4
$181,750
33
$132,424
1
$40,000
0
$0
2
$151,500
FILES CLOSED FOR INCOMPLETENESS
0
$0
1
$25,000
12
$156,250
0
$0
0
$0
1
$25,000
Aggregated Statistics For Year 2001 (Based on 1 full tract)
A) FHA, FSA/RHS & VA Home Purchase Loans
B) Conventional Home Purchase Loans
C) Refinancings
D) Home Improvement Loans
E) Loans on Dwellings For 5+ Families
F) Non-occupant Loans on < 5 Family Dwellings (A B C & D)
Number
Average Value
Number
Average Value
Number
Average Value
Number
Average Value
Number
Average Value
Number
Average Value
LOANS ORIGINATED
14
$144,786
46
$135,000
115
$145,339
9
$62,667
1
$639,000
7
$92,000
APPLICATIONS APPROVED, NOT ACCEPTED
1
$131,000
5
$198,400
15
$113,200
1
$42,000
0
$0
1
$225,000
APPLICATIONS DENIED
2
$124,500
4
$146,000
39
$118,897
9
$23,556
0
$0
1
$94,000
APPLICATIONS WITHDRAWN
1
$128,000
5
$54,800
30
$96,633
2
$35,500
0
$0
2
$57,000
FILES CLOSED FOR INCOMPLETENESS
0
$0
0
$0
4
$145,750
1
$37,000
0
$0
0
$0
Aggregated Statistics For Year 2000 (Based on 1 full tract)
A) FHA, FSA/RHS & VA Home Purchase Loans
B) Conventional Home Purchase Loans
C) Refinancings
D) Home Improvement Loans
E) Loans on Dwellings For 5+ Families
F) Non-occupant Loans on < 5 Family Dwellings (A B C & D)
Number
Average Value
Number
Average Value
Number
Average Value
Number
Average Value
Number
Average Value
Number
Average Value
LOANS ORIGINATED
12
$151,833
37
$104,135
24
$124,708
5
$21,200
0
$0
5
$95,400
APPLICATIONS APPROVED, NOT ACCEPTED
1
$139,000
10
$118,000
10
$124,700
2
$23,500
0
$0
2
$134,000
APPLICATIONS DENIED
3
$124,667
5
$95,200
16
$93,500
1
$15,000
0
$0
0
$0
APPLICATIONS WITHDRAWN
0
$0
5
$114,200
15
$80,933
0
$0
0
$0
2
$107,000
FILES CLOSED FOR INCOMPLETENESS
0
$0
0
$0
2
$152,000
0
$0
1
$745,000
0
$0
Aggregated Statistics For Year 1999 (Based on 1 full tract)
A) FHA, FSA/RHS & VA Home Purchase Loans
B) Conventional Home Purchase Loans
C) Refinancings
D) Home Improvement Loans
E) Loans on Dwellings For 5+ Families
F) Non-occupant Loans on < 5 Family Dwellings (A B C & D)
Detailed PMIC statistics for the following Tracts:0047.01
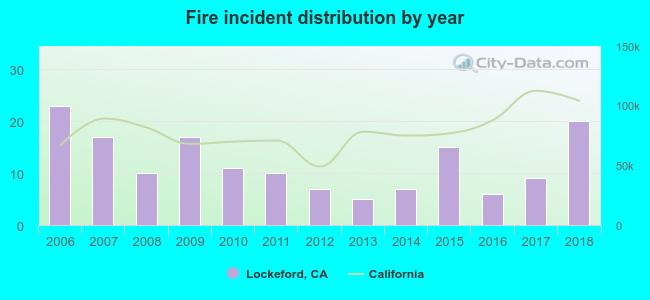
2006 - 2018 National Fire Incident Reporting System (NFIRS) incidents
According to the data from the years 2006 - 2018 the average number of fires per year is 12. The highest number of reported fires - 23 took place in 2006, and the least - 5 in 2013. The data has a dropping trend.
When looking into fire subcategories, the most incidents belonged to: Outside Fires (58.6%), and Structure Fires (25.5%).
Fire incident types reported to NFIRS in Lockeford, CA


 Recent articles from our blog. Our writers, many of them Ph.D. graduates or candidates, create easy-to-read articles on a wide variety of topics.

 (7.3 miles


 According to the data from the years 2006 - 2018 the average number of fires per year is 12. The highest number of reported fires - 23 took place in 2006, and the least - 5 in 2013. The data has a dropping trend.
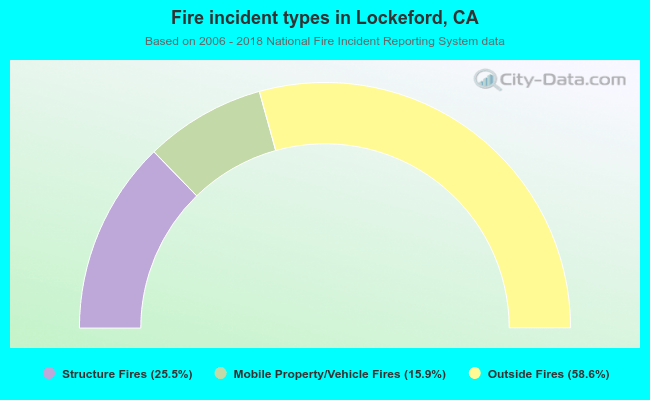 When looking into fire subcategories, the most incidents belonged to: Outside Fires (58.6%), and Structure Fires (25.5%).