Lindina, Wisconsin
Submit your own pictures of this town and show them to the world
- OSM Map
- General Map
- Google Map
- MSN Map
Population change since 2000: -1.6%
 |
| Males: 388 | |
| Females: 330 |
| Median resident age: | 46.2 years |
| Wisconsin median age: | 42.6 years |
Zip codes: 53948.
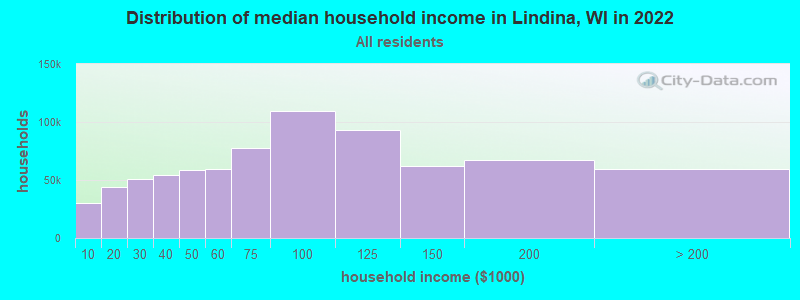
| Lindina: | $72,583 |
| WI: | $70,996 |
Estimated per capita income in 2022: $28,033 (it was $16,047 in 2000)
Lindina town income, earnings, and wages data
Estimated median house or condo value in 2022: $203,289 (it was $86,200 in 2000)
| Lindina: | $203,289 |
| WI: | $252,800 |
Mean prices in 2022: all housing units: $203,649; detached houses: $219,017; townhouses or other attached units: $219,298; in 2-unit structures: $128,311; in 3-to-4-unit structures: $149,106; in 5-or-more-unit structures: $361,682; mobile homes: $119,046; occupied boats, rvs, vans, etc.: $83,403
Detailed information about poverty and poor residents in Lindina, WI


- 70397.9%White alone
- 40.6%Hispanic
- 30.4%Black alone
- 30.4%American Indian alone
- 20.3%Asian alone
- 20.3%Two or more races
- 10.1%Other race alone

Races in Lindina detailed stats: ancestries, foreign born residents, place of birth
 Recent articles from our blog. Our writers, many of them Ph.D. graduates or candidates, create easy-to-read articles on a wide variety of topics.

Latest news from Lindina, WI collected exclusively by city-data.com from local newspapers, TV, and radio stations
Ancestries: German (44.9%), Irish (12.9%), English (9.5%), Norwegian (8.5%), Polish (7.7%), United States (3.7%).
Current Local Time: CST time zone
Elevation: 925 feet
Land area: 33.1 square miles.
Population density: 22 people per square mile (very low).
11 residents are foreign born
| This town: | 1.5% |
| Wisconsin: | 3.6% |
| Lindina town: | 1.1% ($966) |
| Wisconsin: | 2.0% ($2,245) |
Nearest city with pop. 50,000+: La Crosse, WI  (54.9 miles , pop. 51,818).
Nearest city with pop. 200,000+: Madison, WI (61.6 miles , pop. 208,054).
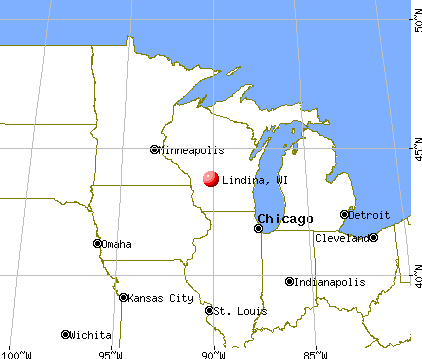
Nearest city with pop. 1,000,000+: Chicago, IL (183.3 miles , pop. 2,896,016).
Nearest cities:
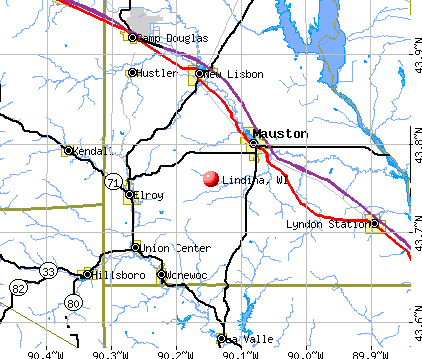
), ), ), ), )Latitude: 43.78 N, Longitude: 90.13 W
Area code commonly used in this area: 608

Single-family new house construction building permits:
- 2022: 1 building, cost: $400,000
- 2020: 2 buildings, average cost: $95,000
- 2018: 1 building, cost: $250,000
- 2017: 2 buildings, average cost: $207,500
- 2016: 1 building, cost: $100,000
- 2015: 2 buildings, average cost: $485,000
- 2014: 1 building, cost: $250,000
- 2013: 2 buildings, average cost: $153,100
- 2009: 1 building, cost: $125,000
- 2006: 5 buildings, average cost: $112,000
- 2005: 7 buildings, average cost: $55,600
- 2004: 4 buildings, average cost: $131,300
- 2003: 2 buildings, average cost: $194,000
- 2002: 1 building, cost: $60,000
- 2001: 1 building, cost: $150,000
- 2000: 2 buildings, average cost: $200,000
- 1999: 4 buildings, average cost: $96,000
- 1998: 3 buildings, average cost: $78,300
- 1997: 2 buildings, average cost: $48,000


| Here: | 3.1% |
| Wisconsin: | 2.7% |

- Construction (12.9%)
- Agriculture, forestry, fishing & hunting (10.2%)
- Accommodation & food services (9.1%)
- Educational services (8.3%)
- Health care (7.5%)
- Public administration (6.2%)
- Motor vehicle & parts dealers (5.1%)

- Construction (24.0%)
- Agriculture, forestry, fishing & hunting (17.0%)
- Accommodation & food services (6.5%)
- Motor vehicle & parts dealers (5.0%)
- Truck transportation (5.0%)
- Administrative & support & waste management services (4.5%)
- Metal & metal products (4.0%)

- Educational services (15.1%)
- Health care (14.5%)
- Accommodation & food services (12.2%)
- Public administration (9.9%)
- Motor vehicle & parts dealers (5.2%)
- Electronic shopping & mail-order houses (4.7%)
- Finance & insurance (4.1%)

- Farmers and farm managers (7.5%)
- Preschool, kindergarten, elementary, and middle school teachers (5.1%)
- Building and grounds cleaning and maintenance occupations (5.1%)
- Driver/sales workers and truck drivers (4.8%)
- Other production occupations, including supervisors (3.8%)
- Secretaries and administrative assistants (3.5%)
- Information and record clerks, except customer service representatives (3.2%)

- Farmers and farm managers (12.0%)
- Driver/sales workers and truck drivers (8.5%)
- Building and grounds cleaning and maintenance occupations (7.5%)
- Electrical equipment mechanics and other installation, maintenance, and repair workers, including supervisors (5.0%)
- Metal workers and plastic workers (4.5%)
- Other production occupations, including supervisors (4.5%)
- Carpenters (4.0%)

- Preschool, kindergarten, elementary, and middle school teachers (11.0%)
- Secretaries and administrative assistants (7.6%)
- Information and record clerks, except customer service representatives (7.0%)
- Waiters and waitresses (5.8%)
- Other sales and related occupations, including supervisors (4.7%)
- Material recording, scheduling, dispatching, and distributing workers (4.1%)
- Financial clerks, except bookkeeping, accounting and auditing clerks (4.1%)
Average climate in Lindina, Wisconsin
Based on data reported by over 4,000 weather stations


(lower is better)

Air Quality Index (AQI) level in 2022 was 63.6. This is about average.
| City: | 63.6 |
| U.S.: | 72.6 |

Ozone [ppb] level in 2010 was 35.3. This is about average. Closest monitor was 18.9 miles away from the city center.
| City: | 35.3 |
| U.S.: | 33.3 |

Particulate Matter (PM2.5) [µg/m3] level in 2022 was 6.55. This is better than average. Closest monitor was 21.1 miles away from the city center.
| City: | 6.55 |
| U.S.: | 8.11 |
Tornado activity:
Lindina-area historical tornado activity is slightly above Wisconsin state average. It is 43% greater than the overall U.S. average.
On 4/19/1957, a category F4 (max. wind speeds 207-260 mph) tornado 6.3 miles away from the Lindina town center killed one person and caused between $5000 and $50,000 in damages.
On 6/7/1984, a category F5 (max. wind speeds 261-318 mph) tornado 46.6 miles away from the town center killed 9 people and injured 200 people and caused between $50,000 and $500,000 in damages.
Earthquake activity:
Lindina-area historical earthquake activity is significantly above Wisconsin state average. It is 29% greater than the overall U.S. average.On 4/18/2008 at 09:36:59, a magnitude 5.4 (5.1 MB, 4.8 MS, 5.4 MW, 5.2 MW, Class: Moderate, Intensity: VI - VII) earthquake occurred 386.9 miles away from the city center
On 6/28/2004 at 06:10:52, a magnitude 4.2 (4.2 MW, Depth: 6.2 mi, Class: Light, Intensity: IV - V) earthquake occurred 172.6 miles away from Lindina center
On 6/10/1987 at 23:48:54, a magnitude 5.1 (4.9 MB, 4.4 MS, 4.6 MS, 5.1 LG) earthquake occurred 362.6 miles away from Lindina center
On 4/18/2008 at 09:36:59, a magnitude 5.2 (5.2 MW, Depth: 8.9 mi) earthquake occurred 387.0 miles away from the city center
On 2/10/2010 at 09:59:35, a magnitude 3.8 (3.8 MW, Depth: 6.2 mi, Class: Light, Intensity: II - III) earthquake occurred 150.5 miles away from Lindina center
On 7/9/1975 at 14:54:15, a magnitude 4.6 (4.6 MB) earthquake occurred 318.1 miles away from Lindina center
Magnitude types: regional Lg-wave magnitude (LG), body-wave magnitude (MB), surface-wave magnitude (MS), moment magnitude (MW)
Natural disasters:
The number of natural disasters in Juneau County (14) is near the US average (15).Major Disasters (Presidential) Declared: 11
Emergencies Declared: 2
Causes of natural disasters: Floods: 11, Storms: 10, Tornadoes: 6, Drought: 1, Hurricane: 1, Landslide: 1, Mudslide: 1, Wind: 1, Other: 1 (Note: some incidents may be assigned to more than one category).

Hospitals and medical centers near Lindina:
- CREST VIEW NURSING HOME (Nursing Home, about 7 miles away; NEW LISBON, WI)
- HESS HOME HLTH (Home Health Center, about 8 miles away; MAUSTON, WI)
- MILE BLUFF MEDICAL CENTER, INC Acute Care Hospitals (about 8 miles away; MAUSTON, WI)
- ST JOSEPHS HLTH SVCS Critical Access Hospitals (about 15 miles away; HILLSBORO, WI)
- ST JOSEPHS MEMORIAL HOSPITAL (Hospital, about 15 miles away; HILLSBORO, WI)
Colleges/universities with over 2000 students nearest to Lindina:
- Mid-State Technical College (about 46 miles; Wisconsin Rapids, WI; Full-time enrollment: 2,128)
- University of Wisconsin-La Crosse (about 55 miles; La Crosse, WI; FT enrollment: 9,837)
- Viterbo University (about 56 miles; La Crosse, WI; FT enrollment: 2,848)
- Western Technical College (about 56 miles; La Crosse, WI; FT enrollment: 3,377)
- University of Wisconsin-Stevens Point (about 59 miles; Stevens Point, WI; FT enrollment: 9,089)
- Madison Area Technical College (about 62 miles; Madison, WI; FT enrollment: 9,603)
- Herzing University-Madison (about 62 miles; Madison, WI; FT enrollment: 3,160)
Points of interest:
Churches in Lindina include: Plymouth Church (A), Kingdom Hall (B). Display/hide their locations on the map
Cemeteries: Plymouth Cemetery (1), Suldal Cemetery (2), Rock Valley Cemetery (3), Evergreen Cemetery (4), Saint Anns Cemetery (5). Display/hide their locations on the map
Creeks: Spring Creek (A), Stewart Creek (B), Brewer Creek (C), Little Onemile Creek (D). Display/hide their locations on the map
| This town: | 2.5 people |
| Wisconsin: | 2.4 people |
| This town: | 72.7% |
| Whole state: | 64.4% |
| This town: | 6.3% |
| Whole state: | 7.3% |
Likely homosexual households (counted as self-reported same-sex unmarried-partner households)
- Lesbian couples: 0.0% of all households
- Gay men: 0.3% of all households
| This town: | 7.3% |
| Whole state: | 8.7% |
| This town: | 4.8% |
| Whole state: | 3.7% |
For population 15 years and over in Lindina:

- Never married: 20.6%
- Now married: 65.0%
- Separated: 0.0%
- Widowed: 5.3%
- Divorced: 9.0%
For population 25 years and over in Lindina:
- High school or higher: 82.8%
- Bachelor's degree or higher: 13.5%
- Graduate or professional degree: 5.1%
- Unemployed: 3.6%
- Mean travel time to work (commute): 22.0 minutes


| Here: | 8.9 |
| Wisconsin average: | 11.0 |

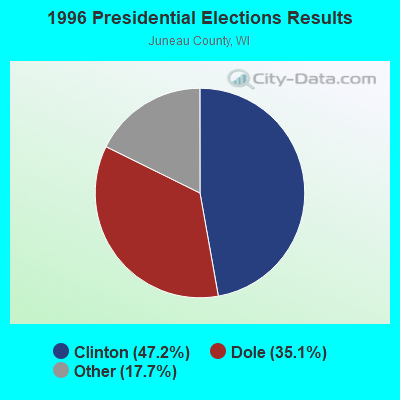
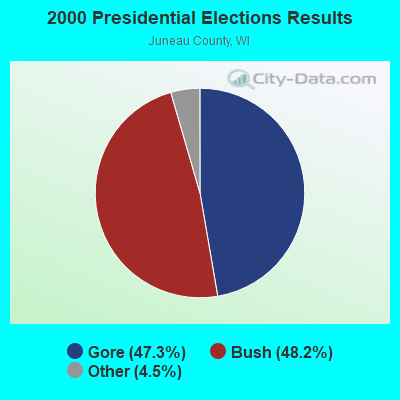
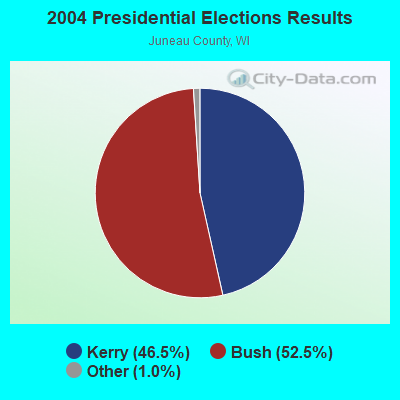
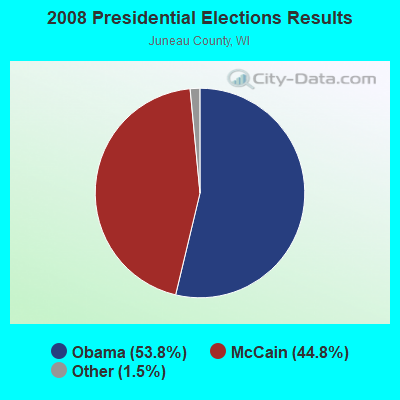

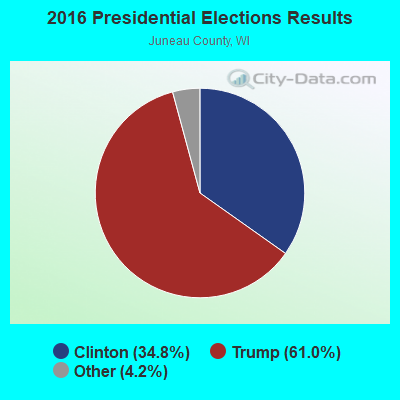
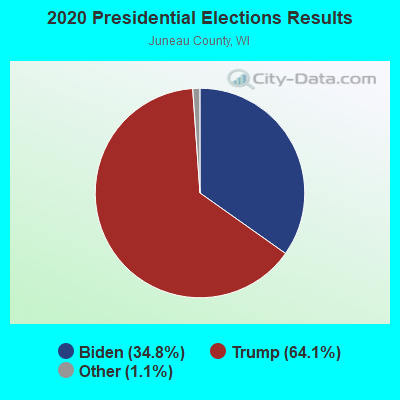
Graphs represent county-level data. Detailed 2008 Election Results
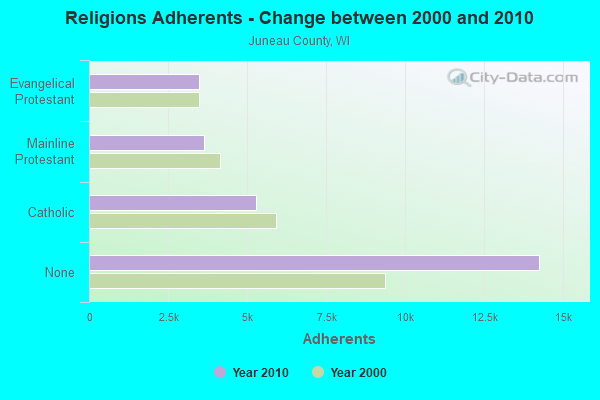
Religion statistics for Lindina, WI (based on Juneau County data)
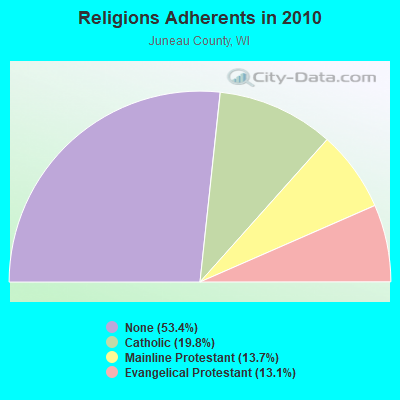
| Religion | Adherents | Congregations |
|---|---|---|
| Catholic | 5,280 | 7 |
| Mainline Protestant | 3,652 | 17 |
| Evangelical Protestant | 3,480 | 15 |
| Other | 5 | 1 |
| None | 14,247 | - |
Food Environment Statistics:
| Juneau County: | 3.39 / 10,000 pop. |
| Wisconsin: | 1.86 / 10,000 pop. |
| Juneau County: | 6.78 / 10,000 pop. |
| Wisconsin: | 4.12 / 10,000 pop. |
| This county: | 8.29 / 10,000 pop. |
| Wisconsin: | 8.64 / 10,000 pop. |
| Here: | 8.6% |
| Wisconsin: | 7.6% |
| Here: | 29.1% |
| State: | 27.5% |
| Juneau County: | 13.2% |
| Wisconsin: | 13.0% |
Strongest AM radio stations in Lindina:
- WRJC (1270 AM; 0 kW; MAUSTON, WI)
- WSPT (1010 AM; 50 kW; STEVENS POINT, WI)
- WNAM (1280 AM; 50 kW; NEENAH-MENASHA, WI; Owner: CUMULUS LICENSING CORP.)
- WSAU (550 AM; 20 kW; WAUSAU, WI; Owner: WRIG, INC.)
- WTMJ (620 AM; 50 kW; MILWAUKEE, WI; Owner: JOURNAL BROADCAST CORPORATION)
- WHBY (1150 AM; 25 kW; KIMBERLY, WI; Owner: WOODWARD COMMUNICATIONS, INC.)
- WISN (1130 AM; 50 kW; MILWAUKEE, WI; Owner: CAPSTAR TX LIMITED PARTNERSHIP)
- WKTY (580 AM; 5 kW; LA CROSSE, WI; Owner: FAMILY RADIO, INC.)
- WKLJ (1290 AM; 5 kW; SPARTA, WI; Owner: SPARTA-TOMAH BROADCASTING CO., INC.)
- WSCR (670 AM; 50 kW; CHICAGO, IL; Owner: INFINITY BROADCASTING OPERATIONS, INC.)
- WGN (720 AM; 50 kW; CHICAGO, IL; Owner: WGN CONTINENTAL BROADCASTING CO.)
- WRDB (1400 AM; 1 kW; REEDSBURG, WI; Owner: NEWRADIO GROUP, LLC)
- WBBM (780 AM; 50 kW; CHICAGO, IL; Owner: INFINITY BROADCASTING OPERATIONS, INC.)
Strongest FM radio stations in Lindina:
- WRJC-FM (92.1 FM; MAUSTON, WI; Owner: WRJC, INCORPORATED)
- WVCX (98.9 FM; TOMAH, WI; Owner: VCY AMERICA, INC.)
- WNFM (104.9 FM; REEDSBURG, WI; Owner: NEWRADIO GROUP, LLC)
- WBDL (102.9 FM; REEDSBURG, WI; Owner: NEWRADIO GROUP, LLC)
- WOLX-FM (94.9 FM; BARABOO, WI; Owner: ENTERCOM MADISON LICENSE, LLC.)
- WXYM (96.1 FM; TOMAH, WI; Owner: MAGNUM RADIO, INC.)
- WBOG (94.5 FM; TOMAH, WI; Owner: MAGNUM RADIO, INC.)
- WDKM (106.1 FM; ADAMS, WI; Owner: ROCHE-A-CRI BROADCASTING)
- WNNO-FM (106.9 FM; WISCONSIN DELLS, WI; Owner: MAGNUM COMMUNICATIONS, INC.)
TV broadcast stations around Lindina:
- WDLS-LP (Channel 35; TOMAH, WI; Owner: MAGNUM RADIO, INC.)
- National Bridge Inventory (NBI) Statistics
- 8Number of bridges
- 46ft / 13.5mTotal length
- $276,000Total costs
- 3,075Total average daily traffic
- 243Total average daily truck traffic
- 2,740Total future (year 2035) average daily traffic

- 48.3%Bottled, tank, or LP gas
- 19.7%Wood
- 16.3%Fuel oil, kerosene, etc.
- 10.3%Utility gas
- 4.4%Electricity
- 1.0%Other fuel

- 54.4%Bottled, tank, or LP gas
- 19.3%Fuel oil, kerosene, etc.
- 12.3%Wood
- 10.5%Utility gas
- 3.5%Electricity
Lindina compared to Wisconsin state average:
- Unemployed percentage significantly below state average.
- Black race population percentage significantly below state average.
- Hispanic race population percentage significantly below state average.
- Foreign-born population percentage significantly below state average.
- Renting percentage below state average.
- Length of stay since moving in significantly above state average.
- Number of rooms per house significantly below state average.
- House age significantly below state average.
- Number of college students below state average.
- Percentage of population with a bachelor's degree or higher below state average.