Lafitte, Louisiana Submit your own pictures of this place and show them to the world
OSM Map
General Map
Google Map
MSN Map
OSM Map
General Map
Google Map
MSN Map
OSM Map
General Map
Google Map
MSN Map
OSM Map
General Map
Google Map
MSN Map
Please wait while loading the map...
Population in 2010: 972. Population change since 2000: -38.3%Males: 603 Females: 369
March 2022 cost of living index in Lafitte: 91.0 (less than average, U.S. average is 100) Percentage of residents living in poverty in 2022: 23.1%for White Non-Hispanic residents , 94.6% for two or more races residents )
Profiles of local businesses
Business Search - 14 Million verified businesses
Data:
Median household income ($)
Median household income (% change since 2000)
Household income diversity
Ratio of average income to average house value (%)
Ratio of average income to average rent
Median household income ($) - White
Median household income ($) - Black or African American
Median household income ($) - Asian
Median household income ($) - Hispanic or Latino
Median household income ($) - American Indian and Alaska Native
Median household income ($) - Multirace
Median household income ($) - Other Race
Median household income for houses/condos with a mortgage ($)
Median household income for apartments without a mortgage ($)
Races - White alone (%)
Races - White alone (% change since 2000)
Races - Black alone (%)
Races - Black alone (% change since 2000)
Races - American Indian alone (%)
Races - American Indian alone (% change since 2000)
Races - Asian alone (%)
Races - Asian alone (% change since 2000)
Races - Hispanic (%)
Races - Hispanic (% change since 2000)
Races - Native Hawaiian and Other Pacific Islander alone (%)
Races - Native Hawaiian and Other Pacific Islander alone (% change since 2000)
Races - Two or more races (%)
Races - Two or more races (% change since 2000)
Races - Other race alone (%)
Races - Other race alone (% change since 2000)
Racial diversity
Unemployment (%)
Unemployment (% change since 2000)
Unemployment (%) - White
Unemployment (%) - Black or African American
Unemployment (%) - Asian
Unemployment (%) - Hispanic or Latino
Unemployment (%) - American Indian and Alaska Native
Unemployment (%) - Multirace
Unemployment (%) - Other Race
Population density (people per square mile)
Population - Males (%)
Population - Females (%)
Population - Males (%) - White
Population - Males (%) - Black or African American
Population - Males (%) - Asian
Population - Males (%) - Hispanic or Latino
Population - Males (%) - American Indian and Alaska Native
Population - Males (%) - Multirace
Population - Males (%) - Other Race
Population - Females (%) - White
Population - Females (%) - Black or African American
Population - Females (%) - Asian
Population - Females (%) - Hispanic or Latino
Population - Females (%) - American Indian and Alaska Native
Population - Females (%) - Multirace
Population - Females (%) - Other Race
Coronavirus confirmed cases (May 21, 2024)
Deaths caused by coronavirus (May 21, 2024)
Coronavirus confirmed cases (per 100k population) (May 21, 2024)
Deaths caused by coronavirus (per 100k population) (May 21, 2024)
Daily increase in number of cases (May 21, 2024)
Weekly increase in number of cases (May 21, 2024)
Cases doubled (in days) (May 21, 2024)
Hospitalized patients (Apr 18, 2022)
Negative test results (Apr 18, 2022)
Total test results (Apr 18, 2022)
COVID Vaccine doses distributed (per 100k population) (Sep 19, 2023)
COVID Vaccine doses administered (per 100k population) (Sep 19, 2023)
COVID Vaccine doses distributed (Sep 19, 2023)
COVID Vaccine doses administered (Sep 19, 2023)
Likely homosexual households (%)
Likely homosexual households (% change since 2000)
Likely homosexual households - Lesbian couples (%)
Likely homosexual households - Lesbian couples (% change since 2000)
Likely homosexual households - Gay men (%)
Likely homosexual households - Gay men (% change since 2000)
Cost of living index
Median gross rent ($)
Median contract rent ($)
Median monthly housing costs ($)
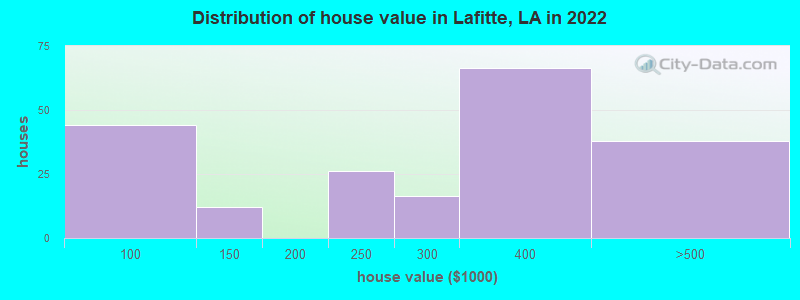
Median house or condo value ($)
Median house or condo value ($ change since 2000)
Mean house or condo value by units in structure - 1, detached ($)
Mean house or condo value by units in structure - 1, attached ($)
Mean house or condo value by units in structure - 2 ($)
Mean house or condo value by units in structure by units in structure - 3 or 4 ($)
Mean house or condo value by units in structure - 5 or more ($)
Mean house or condo value by units in structure - Boat, RV, van, etc. ($)
Mean house or condo value by units in structure - Mobile home ($)
Median house or condo value ($) - White
Median house or condo value ($) - Black or African American
Median house or condo value ($) - Asian
Median house or condo value ($) - Hispanic or Latino
Median house or condo value ($) - American Indian and Alaska Native
Median house or condo value ($) - Multirace
Median house or condo value ($) - Other Race
Median resident age
Resident age diversity
Median resident age - Males
Median resident age - Females
Median resident age - White
Median resident age - Black or African American
Median resident age - Asian
Median resident age - Hispanic or Latino
Median resident age - American Indian and Alaska Native
Median resident age - Multirace
Median resident age - Other Race
Median resident age - Males - White
Median resident age - Males - Black or African American
Median resident age - Males - Asian
Median resident age - Males - Hispanic or Latino
Median resident age - Males - American Indian and Alaska Native
Median resident age - Males - Multirace
Median resident age - Males - Other Race
Median resident age - Females - White
Median resident age - Females - Black or African American
Median resident age - Females - Asian
Median resident age - Females - Hispanic or Latino
Median resident age - Females - American Indian and Alaska Native
Median resident age - Females - Multirace
Median resident age - Females - Other Race
Commute - mean travel time to work (minutes)
Travel time to work - Less than 5 minutes (%)
Travel time to work - Less than 5 minutes (% change since 2000)
Travel time to work - 5 to 9 minutes (%)
Travel time to work - 5 to 9 minutes (% change since 2000)
Travel time to work - 10 to 19 minutes (%)
Travel time to work - 10 to 19 minutes (% change since 2000)
Travel time to work - 20 to 29 minutes (%)
Travel time to work - 20 to 29 minutes (% change since 2000)
Travel time to work - 30 to 39 minutes (%)
Travel time to work - 30 to 39 minutes (% change since 2000)
Travel time to work - 40 to 59 minutes (%)
Travel time to work - 40 to 59 minutes (% change since 2000)
Travel time to work - 60 to 89 minutes (%)
Travel time to work - 60 to 89 minutes (% change since 2000)
Travel time to work - 90 or more minutes (%)
Travel time to work - 90 or more minutes (% change since 2000)
Marital status - Never married (%)
Marital status - Now married (%)
Marital status - Separated (%)
Marital status - Widowed (%)
Marital status - Divorced (%)
Median family income ($)
Median family income (% change since 2000)
Median non-family income ($)
Median non-family income (% change since 2000)
Median per capita income ($)
Median per capita income (% change since 2000)
Median family income ($) - White
Median family income ($) - Black or African American
Median family income ($) - Asian
Median family income ($) - Hispanic or Latino
Median family income ($) - American Indian and Alaska Native
Median family income ($) - Multirace
Median family income ($) - Other Race
Median year house/condo built
Median year apartment built
Year house built - Built 2005 or later (%)
Year house built - Built 2000 to 2004 (%)
Year house built - Built 1990 to 1999 (%)
Year house built - Built 1980 to 1989 (%)
Year house built - Built 1970 to 1979 (%)
Year house built - Built 1960 to 1969 (%)
Year house built - Built 1950 to 1959 (%)
Year house built - Built 1940 to 1949 (%)
Year house built - Built 1939 or earlier (%)
Average household size
Household density (households per square mile)
Average household size - White
Average household size - Black or African American
Average household size - Asian
Average household size - Hispanic or Latino
Average household size - American Indian and Alaska Native
Average household size - Multirace
Average household size - Other Race
Occupied housing units (%)
Vacant housing units (%)
Owner occupied housing units (%)
Renter occupied housing units (%)
Vacancy status - For rent (%)
Vacancy status - For sale only (%)
Vacancy status - Rented or sold, not occupied (%)
Vacancy status - For seasonal, recreational, or occasional use (%)
Vacancy status - For migrant workers (%)
Vacancy status - Other vacant (%)
Residents with income below the poverty level (%)
Residents with income below 50% of the poverty level (%)
Children below poverty level (%)
Poor families by family type - Married-couple family (%)
Poor families by family type - Male, no wife present (%)
Poor families by family type - Female, no husband present (%)
Poverty status for native-born residents (%)
Poverty status for foreign-born residents (%)
Poverty among high school graduates not in families (%)
Poverty among people who did not graduate high school not in families (%)
Residents with income below the poverty level (%) - White
Residents with income below the poverty level (%) - Black or African American
Residents with income below the poverty level (%) - Asian
Residents with income below the poverty level (%) - Hispanic or Latino
Residents with income below the poverty level (%) - American Indian and Alaska Native
Residents with income below the poverty level (%) - Multirace
Residents with income below the poverty level (%) - Other Race
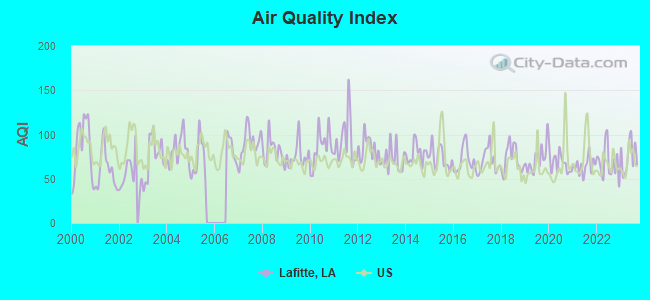
Air pollution - Air Quality Index (AQI)
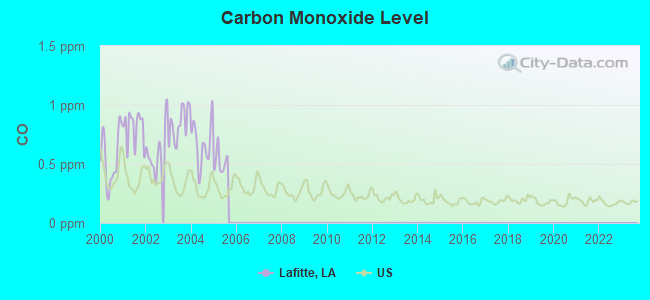
Air pollution - CO
Air pollution - NO2
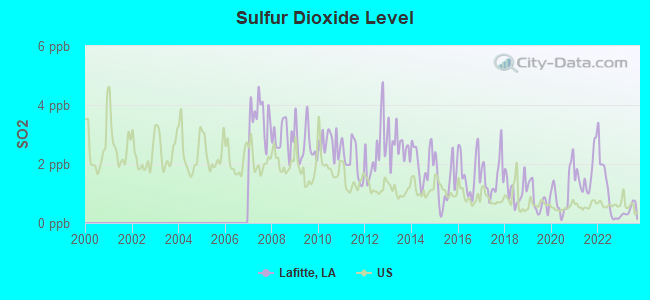
Air pollution - SO2
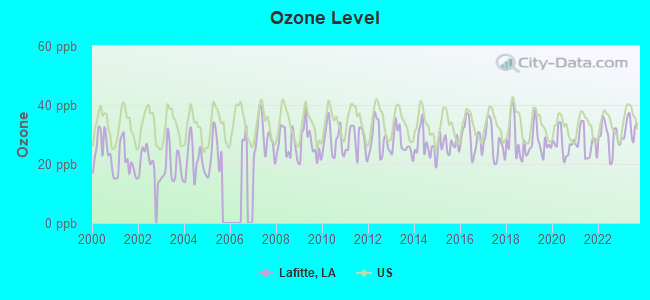
Air pollution - Ozone
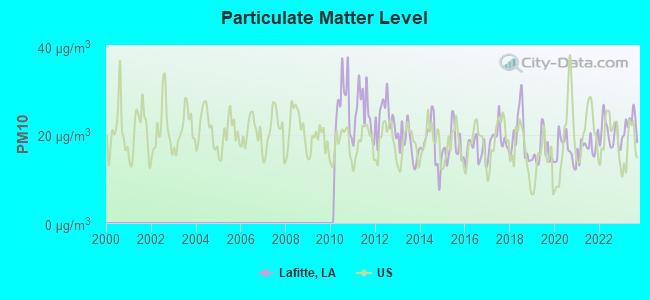
Air pollution - PM10
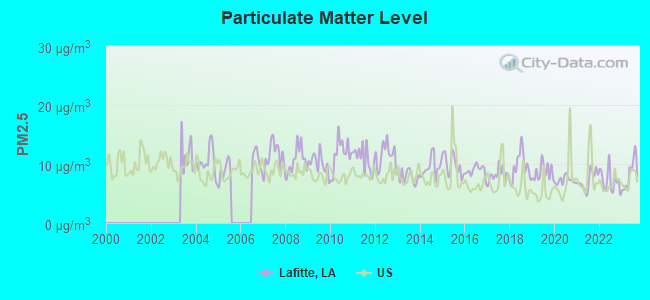
Air pollution - PM25
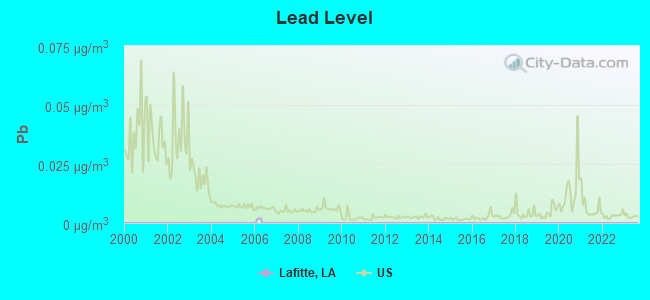
Air pollution - Pb
Crime - Murders per 100,000 population
Crime - Rapes per 100,000 population
Crime - Robberies per 100,000 population
Crime - Assaults per 100,000 population
Crime - Burglaries per 100,000 population
Crime - Thefts per 100,000 population
Crime - Auto thefts per 100,000 population
Crime - Arson per 100,000 population
Crime - City-data.com crime index
Crime - Violent crime index
Crime - Property crime index
Crime - Murders per 100,000 population (5 year average)
Crime - Rapes per 100,000 population (5 year average)
Crime - Robberies per 100,000 population (5 year average)
Crime - Assaults per 100,000 population (5 year average)
Crime - Burglaries per 100,000 population (5 year average)
Crime - Thefts per 100,000 population (5 year average)
Crime - Auto thefts per 100,000 population (5 year average)
Crime - Arson per 100,000 population (5 year average)
Crime - City-data.com crime index (5 year average)
Crime - Violent crime index (5 year average)
Crime - Property crime index (5 year average)
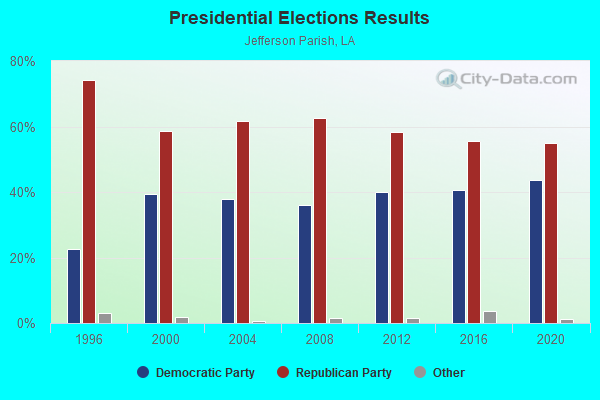
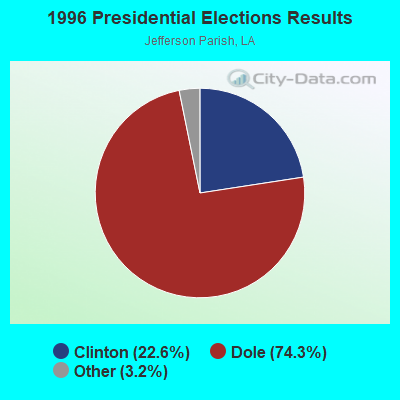
1996 Presidential Elections Results (%) - Democratic Party (Clinton)
1996 Presidential Elections Results (%) - Republican Party (Dole)
1996 Presidential Elections Results (%) - Other
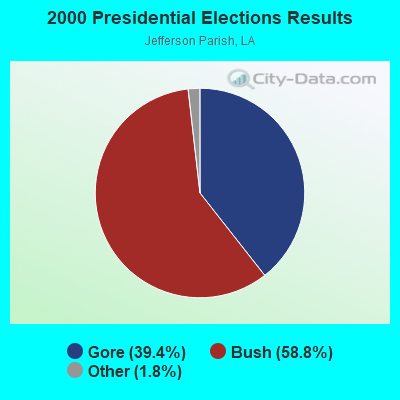
2000 Presidential Elections Results (%) - Democratic Party (Gore)
2000 Presidential Elections Results (%) - Republican Party (Bush)
2000 Presidential Elections Results (%) - Other
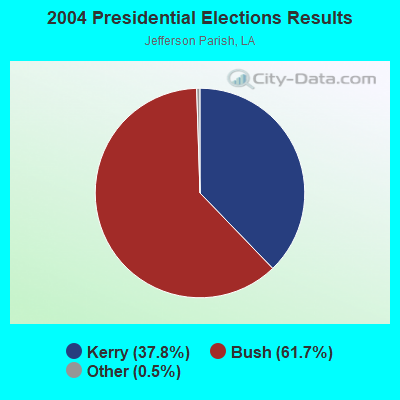
2004 Presidential Elections Results (%) - Democratic Party (Kerry)
2004 Presidential Elections Results (%) - Republican Party (Bush)
2004 Presidential Elections Results (%) - Other
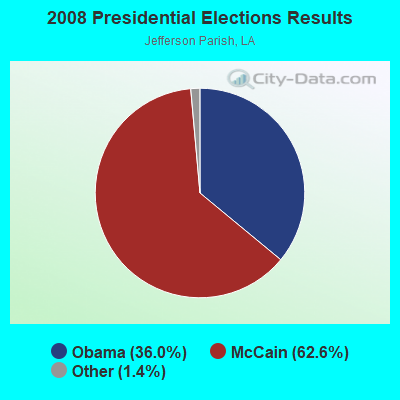
2008 Presidential Elections Results (%) - Democratic Party (Obama)
2008 Presidential Elections Results (%) - Republican Party (McCain)
2008 Presidential Elections Results (%) - Other
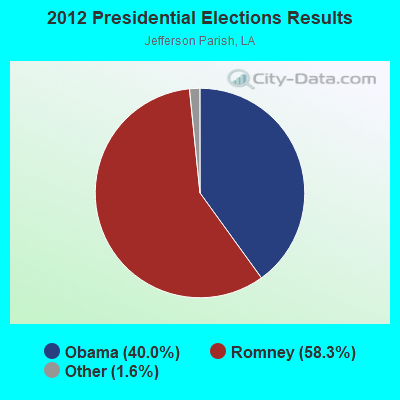
2012 Presidential Elections Results (%) - Democratic Party (Obama)
2012 Presidential Elections Results (%) - Republican Party (Romney)
2012 Presidential Elections Results (%) - Other
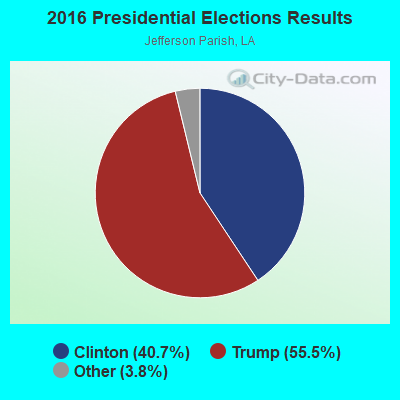
2016 Presidential Elections Results (%) - Democratic Party (Clinton)
2016 Presidential Elections Results (%) - Republican Party (Trump)
2016 Presidential Elections Results (%) - Other
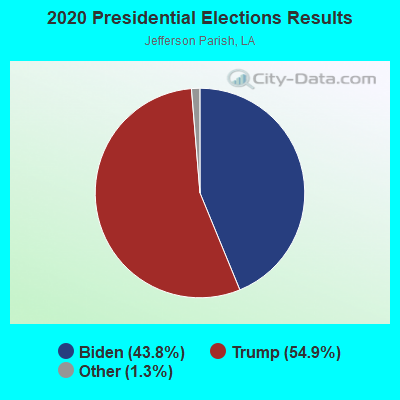
2020 Presidential Elections Results (%) - Democratic Party (Biden)
2020 Presidential Elections Results (%) - Republican Party (Trump)
2020 Presidential Elections Results (%) - Other
Ancestries Reported - Arab (%)
Ancestries Reported - Czech (%)
Ancestries Reported - Danish (%)
Ancestries Reported - Dutch (%)
Ancestries Reported - English (%)
Ancestries Reported - French (%)
Ancestries Reported - French Canadian (%)
Ancestries Reported - German (%)
Ancestries Reported - Greek (%)
Ancestries Reported - Hungarian (%)
Ancestries Reported - Irish (%)
Ancestries Reported - Italian (%)
Ancestries Reported - Lithuanian (%)
Ancestries Reported - Norwegian (%)
Ancestries Reported - Polish (%)
Ancestries Reported - Portuguese (%)
Ancestries Reported - Russian (%)
Ancestries Reported - Scotch-Irish (%)
Ancestries Reported - Scottish (%)
Ancestries Reported - Slovak (%)
Ancestries Reported - Subsaharan African (%)
Ancestries Reported - Swedish (%)
Ancestries Reported - Swiss (%)
Ancestries Reported - Ukrainian (%)
Ancestries Reported - United States (%)
Ancestries Reported - Welsh (%)
Ancestries Reported - West Indian (%)
Ancestries Reported - Other (%)
Educational Attainment - No schooling completed (%)
Educational Attainment - Less than high school (%)
Educational Attainment - High school or equivalent (%)
Educational Attainment - Less than 1 year of college (%)
Educational Attainment - 1 or more years of college (%)
Educational Attainment - Associate degree (%)
Educational Attainment - Bachelor's degree (%)
Educational Attainment - Master's degree (%)
Educational Attainment - Professional school degree (%)
Educational Attainment - Doctorate degree (%)
School Enrollment - Nursery, preschool (%)
School Enrollment - Kindergarten (%)
School Enrollment - Grade 1 to 4 (%)
School Enrollment - Grade 5 to 8 (%)
School Enrollment - Grade 9 to 12 (%)
School Enrollment - College undergrad (%)
School Enrollment - Graduate or professional (%)
School Enrollment - Not enrolled in school (%)
School enrollment - Public schools (%)
School enrollment - Private schools (%)
School enrollment - Not enrolled (%)
Median number of rooms in houses and condos
Median number of rooms in apartments
Housing units lacking complete plumbing facilities (%)
Housing units lacking complete kitchen facilities (%)
Density of houses
Urban houses (%)
Rural houses (%)
Households with people 60 years and over (%)
Households with people 65 years and over (%)
Households with people 75 years and over (%)
Households with one or more nonrelatives (%)
Households with no nonrelatives (%)
Population in households (%)
Family households (%)
Nonfamily households (%)
Population in families (%)
Family households with own children (%)
Median number of bedrooms in owner occupied houses
Mean number of bedrooms in owner occupied houses
Median number of bedrooms in renter occupied houses
Mean number of bedrooms in renter occupied houses
Median number of vehichles in owner occupied houses
Mean number of vehichles in owner occupied houses
Median number of vehichles in renter occupied houses
Mean number of vehichles in renter occupied houses
Mortgage status - with mortgage (%)
Mortgage status - with second mortgage (%)
Mortgage status - with home equity loan (%)
Mortgage status - with both second mortgage and home equity loan (%)
Mortgage status - without a mortgage (%)
Average family size
Average family size - White
Average family size - Black or African American
Average family size - Asian
Average family size - Hispanic or Latino
Average family size - American Indian and Alaska Native
Average family size - Multirace
Average family size - Other Race
Geographical mobility - Same house 1 year ago (%)
Geographical mobility - Moved within same county (%)
Geographical mobility - Moved from different county within same state (%)
Geographical mobility - Moved from different state (%)
Geographical mobility - Moved from abroad (%)
Place of birth - Born in state of residence (%)
Place of birth - Born in other state (%)
Place of birth - Native, outside of US (%)
Place of birth - Foreign born (%)
Housing units in structures - 1, detached (%)
Housing units in structures - 1, attached (%)
Housing units in structures - 2 (%)
Housing units in structures - 3 or 4 (%)
Housing units in structures - 5 to 9 (%)
Housing units in structures - 10 to 19 (%)
Housing units in structures - 20 to 49 (%)
Housing units in structures - 50 or more (%)
Housing units in structures - Mobile home (%)
Housing units in structures - Boat, RV, van, etc. (%)
House/condo owner moved in on average (years ago)
Renter moved in on average (years ago)
Year householder moved into unit - Moved in 1999 to March 2000 (%)
Year householder moved into unit - Moved in 1995 to 1998 (%)
Year householder moved into unit - Moved in 1990 to 1994 (%)
Year householder moved into unit - Moved in 1980 to 1989 (%)
Year householder moved into unit - Moved in 1970 to 1979 (%)
Year householder moved into unit - Moved in 1969 or earlier (%)
Means of transportation to work - Drove car alone (%)
Means of transportation to work - Carpooled (%)
Means of transportation to work - Public transportation (%)
Means of transportation to work - Bus or trolley bus (%)
Means of transportation to work - Streetcar or trolley car (%)
Means of transportation to work - Subway or elevated (%)
Means of transportation to work - Railroad (%)
Means of transportation to work - Ferryboat (%)
Means of transportation to work - Taxicab (%)
Means of transportation to work - Motorcycle (%)
Means of transportation to work - Bicycle (%)
Means of transportation to work - Walked (%)
Means of transportation to work - Other means (%)
Working at home (%)
Industry diversity
Most Common Industries - Agriculture, forestry, fishing and hunting, and mining (%)
Most Common Industries - Agriculture, forestry, fishing and hunting (%)
Most Common Industries - Mining, quarrying, and oil and gas extraction (%)
Most Common Industries - Construction (%)
Most Common Industries - Manufacturing (%)
Most Common Industries - Wholesale trade (%)
Most Common Industries - Retail trade (%)
Most Common Industries - Transportation and warehousing, and utilities (%)
Most Common Industries - Transportation and warehousing (%)
Most Common Industries - Utilities (%)
Most Common Industries - Information (%)
Most Common Industries - Finance and insurance, and real estate and rental and leasing (%)
Most Common Industries - Finance and insurance (%)
Most Common Industries - Real estate and rental and leasing (%)
Most Common Industries - Professional, scientific, and management, and administrative and waste management services (%)
Most Common Industries - Professional, scientific, and technical services (%)
Most Common Industries - Management of companies and enterprises (%)
Most Common Industries - Administrative and support and waste management services (%)
Most Common Industries - Educational services, and health care and social assistance (%)
Most Common Industries - Educational services (%)
Most Common Industries - Health care and social assistance (%)
Most Common Industries - Arts, entertainment, and recreation, and accommodation and food services (%)
Most Common Industries - Arts, entertainment, and recreation (%)
Most Common Industries - Accommodation and food services (%)
Most Common Industries - Other services, except public administration (%)
Most Common Industries - Public administration (%)
Occupation diversity
Most Common Occupations - Management, business, science, and arts occupations (%)
Most Common Occupations - Management, business, and financial occupations (%)
Most Common Occupations - Management occupations (%)
Most Common Occupations - Business and financial operations occupations (%)
Most Common Occupations - Computer, engineering, and science occupations (%)
Most Common Occupations - Computer and mathematical occupations (%)
Most Common Occupations - Architecture and engineering occupations (%)
Most Common Occupations - Life, physical, and social science occupations (%)
Most Common Occupations - Education, legal, community service, arts, and media occupations (%)
Most Common Occupations - Community and social service occupations (%)
Most Common Occupations - Legal occupations (%)
Most Common Occupations - Education, training, and library occupations (%)
Most Common Occupations - Arts, design, entertainment, sports, and media occupations (%)
Most Common Occupations - Healthcare practitioners and technical occupations (%)
Most Common Occupations - Health diagnosing and treating practitioners and other technical occupations (%)
Most Common Occupations - Health technologists and technicians (%)
Most Common Occupations - Service occupations (%)
Most Common Occupations - Healthcare support occupations (%)
Most Common Occupations - Protective service occupations (%)
Most Common Occupations - Fire fighting and prevention, and other protective service workers including supervisors (%)
Most Common Occupations - Law enforcement workers including supervisors (%)
Most Common Occupations - Food preparation and serving related occupations (%)
Most Common Occupations - Building and grounds cleaning and maintenance occupations (%)
Most Common Occupations - Personal care and service occupations (%)
Most Common Occupations - Sales and office occupations (%)
Most Common Occupations - Sales and related occupations (%)
Most Common Occupations - Office and administrative support occupations (%)
Most Common Occupations - Natural resources, construction, and maintenance occupations (%)
Most Common Occupations - Farming, fishing, and forestry occupations (%)
Most Common Occupations - Construction and extraction occupations (%)
Most Common Occupations - Installation, maintenance, and repair occupations (%)
Most Common Occupations - Production, transportation, and material moving occupations (%)
Most Common Occupations - Production occupations (%)
Most Common Occupations - Transportation occupations (%)
Most Common Occupations - Material moving occupations (%)
People in Group quarters - Institutionalized population (%)
People in Group quarters - Correctional institutions (%)
People in Group quarters - Federal prisons and detention centers (%)
People in Group quarters - Halfway houses (%)
People in Group quarters - Local jails and other confinement facilities (including police lockups) (%)
People in Group quarters - Military disciplinary barracks (%)
People in Group quarters - State prisons (%)
People in Group quarters - Other types of correctional institutions (%)
People in Group quarters - Nursing homes (%)
People in Group quarters - Hospitals/wards, hospices, and schools for the handicapped (%)
People in Group quarters - Hospitals/wards and hospices for chronically ill (%)
People in Group quarters - Hospices or homes for chronically ill (%)
People in Group quarters - Military hospitals or wards for chronically ill (%)
People in Group quarters - Other hospitals or wards for chronically ill (%)
People in Group quarters - Hospitals or wards for drug/alcohol abuse (%)
People in Group quarters - Mental (Psychiatric) hospitals or wards (%)
People in Group quarters - Schools, hospitals, or wards for the mentally retarded (%)
People in Group quarters - Schools, hospitals, or wards for the physically handicapped (%)
People in Group quarters - Institutions for the deaf (%)
People in Group quarters - Institutions for the blind (%)
People in Group quarters - Orthopedic wards and institutions for the physically handicapped (%)
People in Group quarters - Wards in general hospitals for patients who have no usual home elsewhere (%)
People in Group quarters - Wards in military hospitals for patients who have no usual home elsewhere (%)
People in Group quarters - Juvenile institutions (%)
People in Group quarters - Long-term care (%)
People in Group quarters - Homes for abused, dependent, and neglected children (%)
People in Group quarters - Residential treatment centers for emotionally disturbed children (%)
People in Group quarters - Training schools for juvenile delinquents (%)
People in Group quarters - Short-term care, detention or diagnostic centers for delinquent children (%)
People in Group quarters - Type of juvenile institution unknown (%)
People in Group quarters - Noninstitutionalized population (%)
People in Group quarters - College dormitories (includes college quarters off campus) (%)
People in Group quarters - Military quarters (%)
People in Group quarters - On base (%)
People in Group quarters - Barracks, unaccompanied personnel housing (UPH), (Enlisted/Officer), ;and similar group living quarters for military personnel (%)
People in Group quarters - Transient quarters for temporary residents (%)
People in Group quarters - Military ships (%)
People in Group quarters - Group homes (%)
People in Group quarters - Homes or halfway houses for drug/alcohol abuse (%)
People in Group quarters - Homes for the mentally ill (%)
People in Group quarters - Homes for the mentally retarded (%)
People in Group quarters - Homes for the physically handicapped (%)
People in Group quarters - Other group homes (%)
People in Group quarters - Religious group quarters (%)
People in Group quarters - Dormitories (%)
People in Group quarters - Agriculture workers' dormitories on farms (%)
People in Group quarters - Job Corps and vocational training facilities (%)
People in Group quarters - Other workers' dormitories (%)
People in Group quarters - Crews of maritime vessels (%)
People in Group quarters - Other nonhousehold living situations (%)
People in Group quarters - Other noninstitutional group quarters (%)
Residents speaking English at home (%)
Residents speaking English at home - Born in the United States (%)
Residents speaking English at home - Native, born elsewhere (%)
Residents speaking English at home - Foreign born (%)
Residents speaking Spanish at home (%)
Residents speaking Spanish at home - Born in the United States (%)
Residents speaking Spanish at home - Native, born elsewhere (%)
Residents speaking Spanish at home - Foreign born (%)
Residents speaking other language at home (%)
Residents speaking other language at home - Born in the United States (%)
Residents speaking other language at home - Native, born elsewhere (%)
Residents speaking other language at home - Foreign born (%)
Class of Workers - Employee of private company (%)
Class of Workers - Self-employed in own incorporated business (%)
Class of Workers - Private not-for-profit wage and salary workers (%)
Class of Workers - Local government workers (%)
Class of Workers - State government workers (%)
Class of Workers - Federal government workers (%)
Class of Workers - Self-employed workers in own not incorporated business and Unpaid family workers (%)
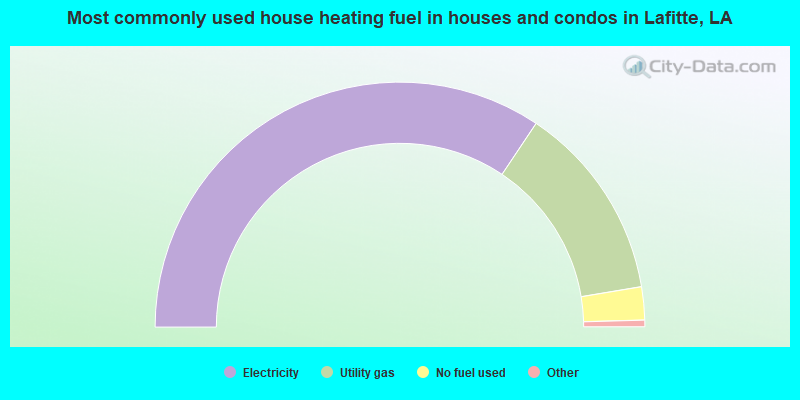
House heating fuel used in houses and condos - Utility gas (%)
House heating fuel used in houses and condos - Bottled, tank, or LP gas (%)
House heating fuel used in houses and condos - Electricity (%)
House heating fuel used in houses and condos - Fuel oil, kerosene, etc. (%)
House heating fuel used in houses and condos - Coal or coke (%)
House heating fuel used in houses and condos - Wood (%)
House heating fuel used in houses and condos - Solar energy (%)
House heating fuel used in houses and condos - Other fuel (%)
House heating fuel used in houses and condos - No fuel used (%)
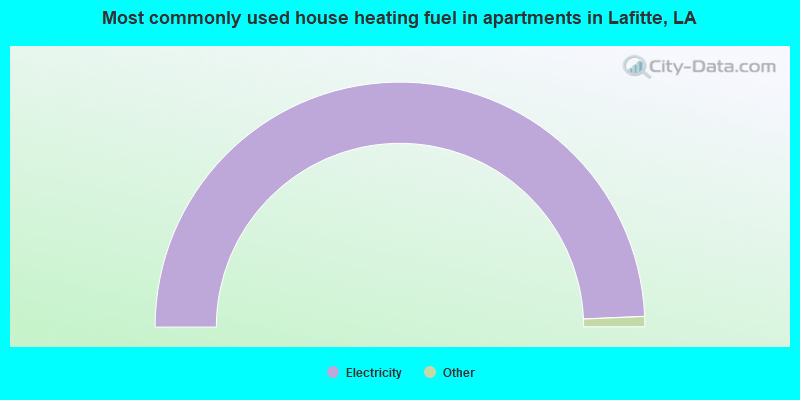
House heating fuel used in apartments - Utility gas (%)
House heating fuel used in apartments - Bottled, tank, or LP gas (%)
House heating fuel used in apartments - Electricity (%)
House heating fuel used in apartments - Fuel oil, kerosene, etc. (%)
House heating fuel used in apartments - Coal or coke (%)
House heating fuel used in apartments - Wood (%)
House heating fuel used in apartments - Solar energy (%)
House heating fuel used in apartments - Other fuel (%)
House heating fuel used in apartments - No fuel used (%)
Armed forces status - In Armed Forces (%)
Armed forces status - Civilian (%)
Armed forces status - Civilian - Veteran (%)
Armed forces status - Civilian - Nonveteran (%)
Fatal accidents locations in years 2005-2021
Fatal accidents locations in 2005
Fatal accidents locations in 2006
Fatal accidents locations in 2007
Fatal accidents locations in 2008
Fatal accidents locations in 2009
Fatal accidents locations in 2010
Fatal accidents locations in 2011
Fatal accidents locations in 2012
Fatal accidents locations in 2013
Fatal accidents locations in 2014
Fatal accidents locations in 2015
Fatal accidents locations in 2016
Fatal accidents locations in 2017
Fatal accidents locations in 2018
Fatal accidents locations in 2019
Fatal accidents locations in 2020
Fatal accidents locations in 2021
Alcohol use - People drinking some alcohol every month (%)
Alcohol use - People not drinking at all (%)
Alcohol use - Average days/month drinking alcohol
Alcohol use - Average drinks/week
Alcohol use - Average days/year people drink much
Audiometry - Average condition of hearing (%)
Audiometry - People that can hear a whisper from across a quiet room (%)
Audiometry - People that can hear normal voice from across a quiet room (%)
Audiometry - Ears ringing, roaring, buzzing (%)
Audiometry - Had a job exposure to loud noise (%)
Audiometry - Had off-work exposure to loud noise (%)
Blood Pressure & Cholesterol - Has high blood pressure (%)
Blood Pressure & Cholesterol - Checking blood pressure at home (%)
Blood Pressure & Cholesterol - Frequently checking blood cholesterol (%)
Blood Pressure & Cholesterol - Has high cholesterol level (%)
Consumer Behavior - Money monthly spent on food at supermarket/grocery store
Consumer Behavior - Money monthly spent on food at other stores
Consumer Behavior - Money monthly spent on eating out
Consumer Behavior - Money monthly spent on carryout/delivered foods
Consumer Behavior - Income spent on food at supermarket/grocery store (%)
Consumer Behavior - Income spent on food at other stores (%)
Consumer Behavior - Income spent on eating out (%)
Consumer Behavior - Income spent on carryout/delivered foods (%)
Current Health Status - General health condition (%)
Current Health Status - Blood donors (%)
Current Health Status - Has blood ever tested for HIV virus (%)
Current Health Status - Left-handed people (%)
Dermatology - People using sunscreen (%)
Diabetes - Diabetics (%)
Diabetes - Had a blood test for high blood sugar (%)
Diabetes - People taking insulin (%)
Diet Behavior & Nutrition - Diet health (%)
Diet Behavior & Nutrition - Milk product consumption (# of products/month)
Diet Behavior & Nutrition - Meals not home prepared (#/week)
Diet Behavior & Nutrition - Meals from fast food or pizza place (#/week)
Diet Behavior & Nutrition - Ready-to-eat foods (#/month)
Diet Behavior & Nutrition - Frozen meals/pizza (#/month)
Drug Use - People that ever used marijuana or hashish (%)
Drug Use - Ever used hard drugs (%)
Drug Use - Ever used any form of cocaine (%)
Drug Use - Ever used heroin (%)
Drug Use - Ever used methamphetamine (%)
Health Insurance - People covered by health insurance (%)
Kidney Conditions-Urology - Avg. # of times urinating at night
Medical Conditions - People with asthma (%)
Medical Conditions - People with anemia (%)
Medical Conditions - People with psoriasis (%)
Medical Conditions - People with overweight (%)
Medical Conditions - Elderly people having difficulties in thinking or remembering (%)
Medical Conditions - People who ever received blood transfusion (%)
Medical Conditions - People having trouble seeing even with glass/contacts (%)
Medical Conditions - People with arthritis (%)
Medical Conditions - People with gout (%)
Medical Conditions - People with congestive heart failure (%)
Medical Conditions - People with coronary heart disease (%)
Medical Conditions - People with angina pectoris (%)
Medical Conditions - People who ever had heart attack (%)
Medical Conditions - People who ever had stroke (%)
Medical Conditions - People with emphysema (%)
Medical Conditions - People with thyroid problem (%)
Medical Conditions - People with chronic bronchitis (%)
Medical Conditions - People with any liver condition (%)
Medical Conditions - People who ever had cancer or malignancy (%)
Mental Health - People who have little interest in doing things (%)
Mental Health - People feeling down, depressed, or hopeless (%)
Mental Health - People who have trouble sleeping or sleeping too much (%)
Mental Health - People feeling tired or having little energy (%)
Mental Health - People with poor appetite or overeating (%)
Mental Health - People feeling bad about themself (%)
Mental Health - People who have trouble concentrating on things (%)
Mental Health - People moving or speaking slowly or too fast (%)
Mental Health - People having thoughts they would be better off dead (%)
Oral Health - Average years since last visit a dentist
Oral Health - People embarrassed because of mouth (%)
Oral Health - People with gum disease (%)
Oral Health - General health of teeth and gums (%)
Oral Health - Average days a week using dental floss/device
Oral Health - Average days a week using mouthwash for dental problem
Oral Health - Average number of teeth
Pesticide Use - Households using pesticides to control insects (%)
Pesticide Use - Households using pesticides to kill weeds (%)
Physical Activity - People doing vigorous-intensity work activities (%)
Physical Activity - People doing moderate-intensity work activities (%)
Physical Activity - People walking or bicycling (%)
Physical Activity - People doing vigorous-intensity recreational activities (%)
Physical Activity - People doing moderate-intensity recreational activities (%)
Physical Activity - Average hours a day doing sedentary activities
Physical Activity - Average hours a day watching TV or videos
Physical Activity - Average hours a day using computer
Physical Functioning - People having limitations keeping them from working (%)
Physical Functioning - People limited in amount of work they can do (%)
Physical Functioning - People that need special equipment to walk (%)
Physical Functioning - People experiencing confusion/memory problems (%)
Physical Functioning - People requiring special healthcare equipment (%)
Prescription Medications - Average number of prescription medicines taking
Preventive Aspirin Use - Adults 40+ taking low-dose aspirin (%)
Reproductive Health - Vaginal deliveries (%)
Reproductive Health - Cesarean deliveries (%)
Reproductive Health - Deliveries resulted in a live birth (%)
Reproductive Health - Pregnancies resulted in a delivery (%)
Reproductive Health - Women breastfeeding newborns (%)
Reproductive Health - Women that had a hysterectomy (%)
Reproductive Health - Women that had both ovaries removed (%)
Reproductive Health - Women that have ever taken birth control pills (%)
Reproductive Health - Women taking birth control pills (%)
Reproductive Health - Women that have ever used Depo-Provera or injectables (%)
Reproductive Health - Women that have ever used female hormones (%)
Sexual Behavior - People 18+ that ever had sex (vaginal, anal, or oral) (%)
Sexual Behavior - Males 18+ that ever had vaginal sex with a woman (%)
Sexual Behavior - Males 18+ that ever performed oral sex on a woman (%)
Sexual Behavior - Males 18+ that ever had anal sex with a woman (%)
Sexual Behavior - Males 18+ that ever had any sex with a man (%)
Sexual Behavior - Females 18+ that ever had vaginal sex with a man (%)
Sexual Behavior - Females 18+ that ever performed oral sex on a man (%)
Sexual Behavior - Females 18+ that ever had anal sex with a man (%)
Sexual Behavior - Females 18+ that ever had any kind of sex with a woman (%)
Sexual Behavior - Average age people first had sex
Sexual Behavior - Average number of female sex partners in lifetime (males 18+)
Sexual Behavior - Average number of female vaginal sex partners in lifetime (males 18+)
Sexual Behavior - Average age people first performed oral sex on a woman (18+)
Sexual Behavior - Average number of woman performed oral sex on in lifetime (18+)
Sexual Behavior - Average number of male sex partners in lifetime (males 18+)
Sexual Behavior - Average number of male anal sex partners in lifetime (males 18+)
Sexual Behavior - Average age people first performed oral sex on a man (18+)
Sexual Behavior - Average number of male oral sex partners in lifetime (18+)
Sexual Behavior - People using protection when performing oral sex (%)
Sexual Behavior - Average number of times people have vaginal or anal sex a year
Sexual Behavior - People having sex without condom (%)
Sexual Behavior - Average number of male sex partners in lifetime (females 18+)
Sexual Behavior - Average number of male vaginal sex partners in lifetime (females 18+)
Sexual Behavior - Average number of female sex partners in lifetime (females 18+)
Sexual Behavior - Circumcised males 18+ (%)
Sleep Disorders - Average hours sleeping at night
Sleep Disorders - People that has trouble sleeping (%)
Smoking-Cigarette Use - People smoking cigarettes (%)
Taste & Smell - People 40+ having problems with smell (%)
Taste & Smell - People 40+ having problems with taste (%)
Taste & Smell - People 40+ that ever had wisdom teeth removed (%)
Taste & Smell - People 40+ that ever had tonsils teeth removed (%)
Taste & Smell - People 40+ that ever had a loss of consciousness because of a head injury (%)
Taste & Smell - People 40+ that ever had a broken nose or other serious injury to face or skull (%)
Taste & Smell - People 40+ that ever had two or more sinus infections (%)
Weight - Average height (inches)
Weight - Average weight (pounds)
Weight - Average BMI
Weight - People that are obese (%)
Weight - People that ever were obese (%)
Weight - People trying to lose weight (%)
Latest news from Lafitte, LA collected exclusively by city-data.com from local newspapers, TV, and radio stations
Ancestries: French (25.7%), American (13.9%), Belgian (12.2%), English (5.9%), Ukrainian (5.9%), Norwegian (5.1%).
Current Local Time:
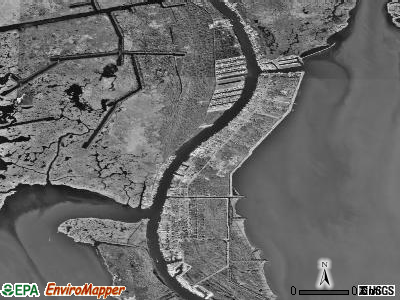
Land area: 5.70 square miles.
Population density: 171 people per square mile (very low).
14 residents are foreign born
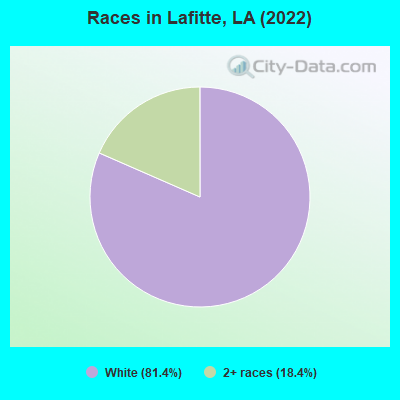
This place:
0.9%Louisiana:
2.6%
Median real estate property taxes paid for housing units in 2000: Lafitte CDP:
0.3% ($211)Louisiana:
0.3% ($199)
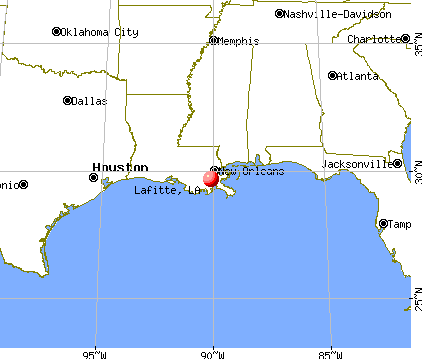
Nearest city with pop. 50,000+: New Orleans, LA
Nearest city with pop. 1,000,000+: Houston, TX
Nearest cities:
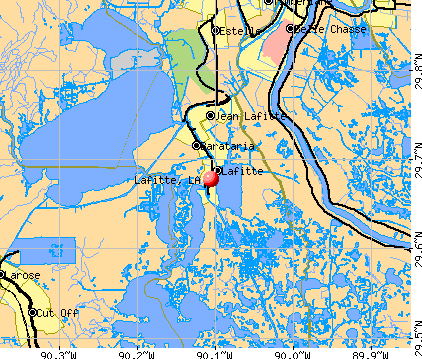
Latitude: 29.68 N, Longitude: 90.11 W
Unemployment in December 2023:
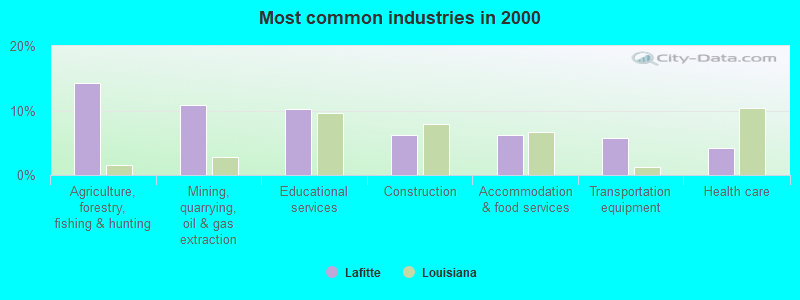
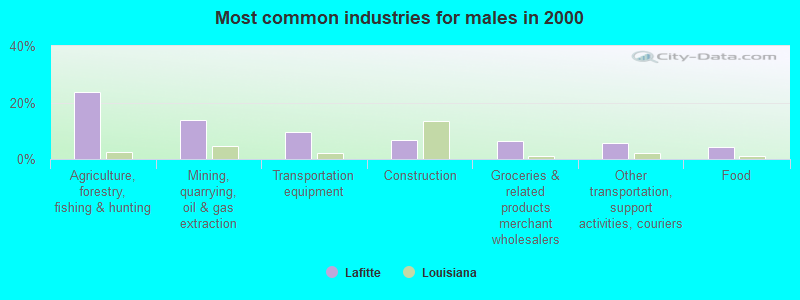
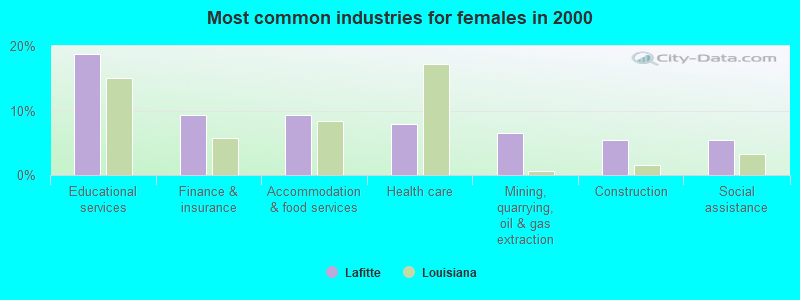
Most common industries in Lafitte, LA (%)
Both Males Females
Agriculture, forestry, fishing & hunting (14.2%)
Mining, quarrying, oil & gas extraction (10.9%)
Educational services (10.2%)
Construction (6.2%)
Accommodation & food services (6.2%)
Transportation equipment (5.8%)
Health care (4.2%)
Agriculture, forestry, fishing & hunting (23.8%)
Mining, quarrying, oil & gas extraction (13.9%)
Transportation equipment (9.7%)
Construction (6.8%)
Groceries & related products merchant wholesalers (6.3%)
Other transportation, support activities, couriers (5.8%)
Food (4.4%)
Educational services (18.7%)
Finance & insurance (9.4%)
Accommodation & food services (9.4%)
Health care (7.9%)
Mining, quarrying, oil & gas extraction (6.5%)
Construction (5.4%)
Social assistance (5.4%)
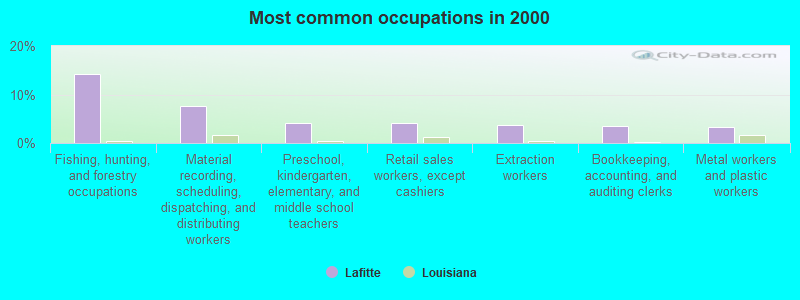
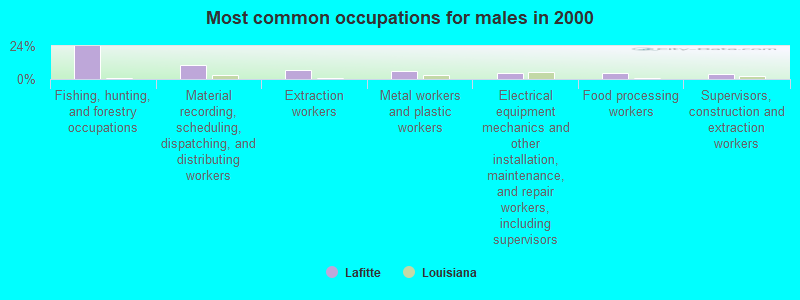
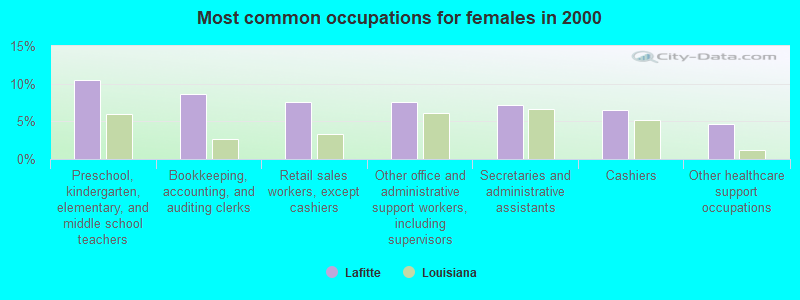
Most common occupations in Lafitte, LA (%)
Both Males Females
Fishing, hunting, and forestry occupations (14.2%)
Material recording, scheduling, dispatching, and distributing workers (7.7%)
Preschool, kindergarten, elementary, and middle school teachers (4.2%)
Retail sales workers, except cashiers (4.1%)
Extraction workers (3.8%)
Bookkeeping, accounting, and auditing clerks (3.5%)
Metal workers and plastic workers (3.3%)
Fishing, hunting, and forestry occupations (23.8%)
Material recording, scheduling, dispatching, and distributing workers (10.5%)
Extraction workers (6.3%)
Metal workers and plastic workers (5.6%)
Electrical equipment mechanics and other installation, maintenance, and repair workers, including supervisors (4.4%)
Food processing workers (4.4%)
Supervisors, construction and extraction workers (3.9%)
Preschool, kindergarten, elementary, and middle school teachers (10.4%)
Bookkeeping, accounting, and auditing clerks (8.6%)
Retail sales workers, except cashiers (7.6%)
Other office and administrative support workers, including supervisors (7.6%)
Secretaries and administrative assistants (7.2%)
Cashiers (6.5%)
Other healthcare support occupations (4.7%)
Tornado activity:
Lafitte-area historical tornado activity is below Louisiana state average. It is 5% smaller than the overall U.S. average.
On 10/3/1964, a category F4 (max. wind speeds 207-260 mph) tornado 16.8 miles away from the Lafitte place center killed 22 people and injured 165 people and caused between $500,000 and $5,000,000 in damages.
On 12/6/1983, a category F4 tornado 33.6 miles away from the place center injured 25 people and caused between $5,000,000 and $50,000,000 in damages.
Earthquake activity:
Lafitte-area historical earthquake activity is significantly above Louisiana state average. It is 58% smaller than the overall U.S. average. On 9/10/2006 at 14:56:08, a magnitude 5.9 (5.9 MB, 5.5 MS, 5.8 MW, Class: Moderate, Intensity: VI - VII) earthquake occurred 318.2 miles away from the city center On 10/24/1997 at 08:35:17, a magnitude 4.9 (4.8 MB, 4.2 MS, 4.9 LG, Depth: 6.2 mi, Class: Light, Intensity: IV - V) earthquake occurred 196.4 miles away from Lafitte center On 5/6/2018 at 16:47:09, a magnitude 4.6 (4.6 MB, Depth: 6.2 mi) earthquake occurred 152.0 miles away from the city center On 6/30/1994 at 01:08:24, a magnitude 4.2 (4.2 MB, Depth: 6.2 mi) earthquake occurred 122.3 miles away from the city center On 5/17/2012 at 08:12:00, a magnitude 4.8 (4.8 MW, Depth: 3.1 mi) earthquake occurred 297.2 miles away from Lafitte center On 1/18/1999 at 07:00:53, a magnitude 4.8 (4.8 MB, 4.0 LG, Depth: 0.6 mi) earthquake occurred 307.7 miles away from the city center Magnitude types: regional Lg-wave magnitude (LG), body-wave magnitude (MB), surface-wave magnitude (MS), moment magnitude (MW) Natural disasters: The number of natural disasters in Jefferson Parish (31) is a lot greater than the US average (15).Major Disasters (Presidential) Declared: 23Emergencies Declared: 5Hurricanes: 17, Floods: 6, Storms: 6, Tropical Storms: 6, Heavy Rain: 1, Tornado: 1, Other: 2 (Note: some incidents may be assigned to more than one category). Hospitals and medical centers near Lafitte: RIVERBEND NURSING AND REHABILITATION CENTER (Nursing Home, about 8 miles away; BELLE CHASSE, LA)
BARBWOOD COMMUNITY HOME (Hospital, about 12 miles away; HARVEY, LA)
LAC ST PIERRE COMMUNITY HOME (Hospital, about 13 miles away; HARVEY, LA)
VIOLA COMMUNITY HOME (Hospital, about 14 miles away; HARVEY, LA)
WESTMERE COMMUNITY HOME (Hospital, about 14 miles away; HARVEY, LA)
DAVITA - MARRERO DIALYSIS CENTER (Dialysis Facility, about 14 miles away; HARVEY, LA)
SOUTHERN QUALITY HOME HEALTH, (Home Health Center, about 14 miles away; HARVEY, LA)
Heliports located in Lafitte: Amtrak station near Lafitte: 19 miles: NEW ORLEANS (1001 LOYOLA AVE.) Services: ticket office, fully wheelchair accessible, enclosed waiting area, public restrooms, public payphones, snack bar, paid short-term parking, paid long-term parking, call for car rental service, taxi stand, intercity bus service, public transit connection.
Colleges/universities with over 2000 students nearest to Lafitte:
Loyola University New Orleans (about 18 miles; New Orleans, LA ; Full-time enrollment: 3,912)
Tulane University of Louisiana (about 19 miles; New Orleans, LA ; FT enrollment: 11,089)
Xavier University of Louisiana (about 20 miles; New Orleans, LA ; FT enrollment: 2,492)
Delgado Community College (about 22 miles; New Orleans, LA ; FT enrollment: 12,843)
University of New Orleans (about 25 miles; New Orleans, LA ; FT enrollment: 8,201)
Nicholls State University (about 43 miles; Thibodaux, LA ; FT enrollment: 5,997)
Southeastern Louisiana University (about 62 miles; Hammond, LA ; FT enrollment: 12,713)
Public high school in Lafitte: FISHER MIDDLE/HIGH SCHOOL Location: 2529 JEAN LAFITTE BOULEVARD, Grades: 6-12)
Public elementary/middle school in Lafitte:
See full list of schools located in Lafitte
Cemeteries: (1) , Coulon Cemetery (2) , Fisher Cemetery (3) , Lafitte Cemetery (4) . Display/hide their locations on the map
Tourist attractions: (1) , Lafitte Jean Tourist Commission (799 Jean Lafitte Boulevard) (2) , Airboat Swamp Tours of New Orleans (Tours & Charters; 786 Jean Lafitte Boulevard) (3) , Airboat Excursions of New Orleans (Tours & Charters; 280 Jean Lafitte Boulevard) (4) . Display/hide their approximate locations on the map
Jefferson Parish has a predicted average indoor radon screening level less than 2 pCi/L (pico curies per liter) - Low Potential Average household size: This place:
2.6 peopleLouisiana:
2.5 people
Percentage of family households: This place:
76.8%Whole state:
67.1%
Percentage of households with unmarried partners: This place:
7.1%Whole state:
6.8%
No gay or lesbian households reported
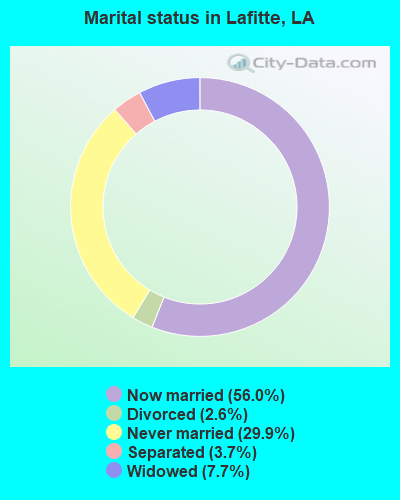
For population 15 years and over in Lafitte:
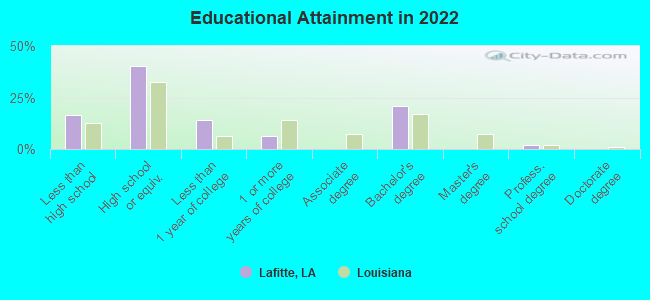
Never married: 29.9%Now married: 56.0%Separated: 3.7%Widowed: 7.7%Divorced: 2.6% For population 25 years and over in Lafitte:
High school or higher: 82.7%Bachelor's degree or higher: 22.6%Graduate or professional degree: 1.5%Unemployed: 5.1%Mean travel time to work (commute): 43.6 minutes
Education Gini index (Inequality in education) Here:
13.6Louisiana average:
11.9
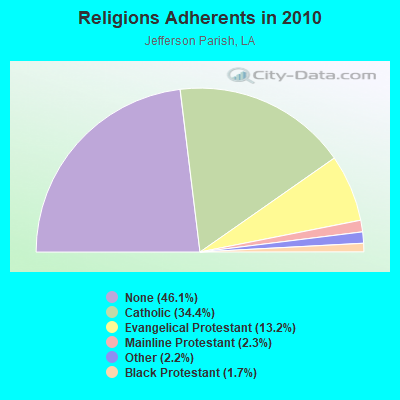
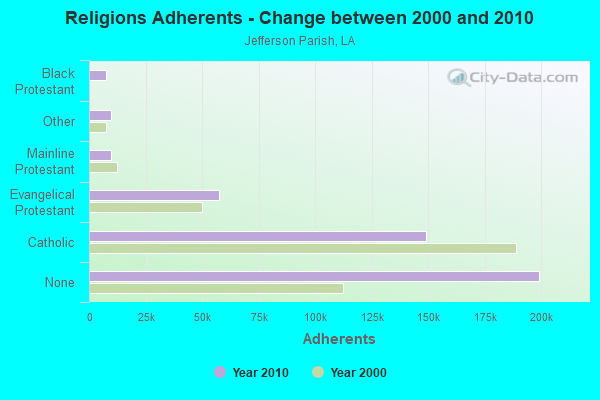
Religion statistics for Lafitte, LA (based on Jefferson Parish data)
Religion Adherents Congregations Catholic 148,827 43 Evangelical Protestant 57,266 160 Mainline Protestant 9,908 30 Other 9,666 23 Black Protestant 7,394 32 Orthodox 300 1 None 199,191 -
Source: Clifford Grammich, Kirk Hadaway, Richard Houseal, Dale E.Jones, Alexei Krindatch, Richie Stanley and Richard H.Taylor. 2012. 2010 U.S.Religion Census: Religious Congregations & Membership Study. Association of Statisticians of American Religious Bodies. Jones, Dale E., et al. 2002. Congregations and Membership in the United States 2000. Nashville, TN: Glenmary Research Center. Graphs represent county-level data
Food Environment Statistics: Number of grocery stores : 107Jefferson Parish :
2.43 / 10,000 pop.Louisiana :
2.56 / 10,000 pop.
Number of supercenters and club stores : 7Jefferson Parish :
0.16 / 10,000 pop.Louisiana :
0.18 / 10,000 pop.
Number of convenience stores (no gas) : 62This county :
1.41 / 10,000 pop.Louisiana :
1.29 / 10,000 pop.
Number of convenience stores (with gas) : 128Jefferson Parish :
2.91 / 10,000 pop.Louisiana :
4.49 / 10,000 pop.
Number of full-service restaurants : 334Here :
7.59 / 10,000 pop.State :
5.92 / 10,000 pop.
Adult diabetes rate : Here :
11.2%Louisiana :
10.9%
Adult obesity rate : Jefferson Parish :
28.3%Louisiana :
29.2%
Low-income preschool obesity rate : Here :
14.5%Louisiana :
13.7%
Health and Nutrition: Healthy diet rate : Lafitte:
44.6%Louisiana:
49.4%
Average overall health of teeth and gums : Average BMI : Lafitte:
28.4Louisiana:
29.1
People feeling badly about themselves : People not drinking alcohol at all : Average hours sleeping at night : Overweight people : Here:
32.0%Louisiana:
34.5%
General health condition : Lafitte:
50.9%Louisiana:
55.8%
Average condition of hearing : Lafitte:
80.2%Louisiana:
80.2%
More about Health and Nutrition of Lafitte, LA Residents
7.42% of this county's 2020 resident taxpayers moved to other counties in 2021 ($53,152 average adjusted gross income )
Here:
7.42%Louisiana average:
7.33%
0.02% of residents moved to foreign countries ($118 average AGI )Jefferson Parish:
0.02%Louisiana average:
0.02%
Top counties to which taxpayers relocated from this county between 2020 and 2021: Strongest AM radio stations in Lafitte:
WWL (870 AM; 50 kW; NEW ORLEANS, LA; Owner: ENTERCOM NEW ORLEANS LICENSE, LLC)
WLNO (1060 AM; 50 kW; NEW ORLEANS, LA; Owner: COMMUNICOM CO. OF LOUISIANA, L.P.)
WYLD (940 AM; 10 kW; NEW ORLEANS, LA; Owner: CLEAR CHANNEL BROADCASTING LICENSES, INC.)
WTIX (690 AM; 10 kW; NEW ORLEANS, LA; Owner: WTIX, INC.)
WODT (1280 AM; 5 kW; NEW ORLEANS, LA; Owner: CLEAR CHANNEL BROADCASTING LICENSES, INC.)
WSMB (1350 AM; 5 kW; NEW ORLEANS, LA; Owner: ENTERCOM NEW ORLEANS LICENSE, LLC)
WSHO (800 AM; 1 kW; NEW ORLEANS, LA; Owner: SHADOWLANDS COMMUNICATIONS, L.L.C.)
KLEB (1600 AM; 5 kW; GOLDEN MEADOW, LA; Owner: COASTAL BROADCASTING OF LAROSE, INC.)
WFNO (830 AM; 5 kW; NORCO, LA; Owner: WFNO, L.L.C.)
WVOG (600 AM; 1 kW; NEW ORLEANS, LA; Owner: F.W. ROBERT BROADCASTING CO., INC.)
WOMN (1110 AM; daytime; 30 kW; FRANKLINTON, LA; Owner: PITTMAN BROADCASTING SERVICES, LLC.)
KGLA (1540 AM; daytime; 1 kW; GRETNA, LA; Owner: CROCODILE BROADCASTING CORP., INC.)
KTIB (640 AM; 5 kW; THIBODAUX, LA; Owner: LA TERR BROADCASTING CORPORATION)
Strongest FM radio stations in Lafitte:
WYLD-FM (98.5 FM; NEW ORLEANS, LA; Owner: CLEAR CHANNEL BROADCASTING LICENSES, INC.)
WLMG (101.9 FM; NEW ORLEANS, LA; Owner: ENTERCOM NEW ORLEANS LICENSE, LLC)
WTIX-FM (94.3 FM; GALLIANO, LA; Owner: FLEUR DE LIS BROADCASTING, INC.)
WEZB (97.1 FM; NEW ORLEANS, LA; Owner: ENTERCOM NEW ORLEANS LICENSE, LLC)
WTKL (95.7 FM; NEW ORLEANS, LA; Owner: ENTERCOM NEW ORLEANS LICENSE, LLC)
KCIL (107.5 FM; HOUMA, LA; Owner: GUARANTY BROADCASTING COMPANY OF HOUMA, LLC)
KLRZ (100.3 FM; LAROSE, LA; Owner: COASTAL BROADCASTING OF LAROSE, INC.)
WQUE-FM (93.3 FM; NEW ORLEANS, LA; Owner: CLEAR CHANNEL BROADCASTING LICENSES, INC.)
KMEZ (102.9 FM; BELLE CHASSE, LA; Owner: CITADEL BROADCASTING COMPANY)
WWNO (89.9 FM; NEW ORLEANS, LA; Owner: LOUISIANA STATE UNIV & A & M COLLEGE)
KKND (106.7 FM; PORT SULPHUR, LA; Owner: CITADEL BROADCASTING COMPANY)
WNOE-FM (101.1 FM; NEW ORLEANS, LA; Owner: CLEAR CHANNEL BROADCASTING LICENSES, INC.)
WRNO-FM (99.5 FM; NEW ORLEANS, LA; Owner: CLEAR CHANNEL BROADCASTING LICENSES, INC.)
WKZN (105.3 FM; KENNER, LA; Owner: ENTERCOM NEW ORLEANS LICENSE, LLC)
KSTE-FM (104.1 FM; HOUMA, LA; Owner: CLEAR CHANNEL BROADCASTING LICENSES, INC.)
WCKW-FM (92.3 FM; LAPLACE, LA; Owner: 222 CORPORATION)
WBSN-FM (89.1 FM; NEW ORLEANS, LA; Owner: PROVIDENCE EDUCATIONAL FOUNDATION)
WRBH (88.3 FM; NEW ORLEANS, LA; Owner: RADIO FOR THE BLIND & HANDICAPPED, INC.)
WWOZ (90.7 FM; NEW ORLEANS, LA; Owner: FRIENDS OF WWOZ, INC.)
KNOU (104.5 FM; EMPIRE, LA; Owner: ON TOP COMMUNICATIONS OF LOUISIANA, LLC)
TV broadcast stations around Lafitte:
WWL-TV (Channel 4; NEW ORLEANS, LA; Owner: WWL-TV, INC.)
WHNO (Channel 20; NEW ORLEANS, LA; Owner: LESEA BROADCASTING CORPORATION)
K66FW (Channel 14; NEW ORLEANS, LA; Owner: VENTANA TELEVISION, INC.)
WYES-TV (Channel 12; NEW ORLEANS, LA; Owner: GREATER NEW ORLEANS ED TV FOUNDATION)
WBXN-CA (Channel 10; NEW ORLEANS, LA; Owner: THE BOX WORLDWIDE LLC)
WVUE (Channel 8; NEW ORLEANS, LA; Owner: EMMIS TELEIVISION LICENSE CORPORATION)
WLPN-LP (Channel 61; NEW ORLEANS, LA; Owner: GLENN R. & KARIN A. PLUMMER)
WGNO (Channel 26; NEW ORLEANS, LA; Owner: TRIBUNE TELEVISION NEW ORLEANS, INC.)
WNOL-TV (Channel 38; NEW ORLEANS, LA; Owner: TRIBUNE TELEVISION NEW ORLEANS, INC.)
WLAE-TV (Channel 32; NEW ORLEANS, LA; Owner: EDUCATIONAL BROADCASTING FOUNDATION, INC.)
WDSU (Channel 6; NEW ORLEANS, LA; Owner: NEW ORLEANS HEARST-ARGYLE TELEVISION, INC.)
WPXL (Channel 49; NEW ORLEANS, LA; Owner: FLINN BROADCASTING CORPORATION)
KNOV-LP (Channel 57; NEW ORLEANS, LA; Owner: BEACH TV PROPERTIES, INC.)
K59DG (Channel 59; NEW ORLEANS, LA; Owner: TRINITY BROADCCASTING NETWORK)
Lafitte, Louisiana
Fatal accident count 23 Vehicles involved in fatal accidents 26 Fatal accidents involving drunk persons: 8 Fatalities 25 Persons involved in fatal accidents 54 Pedestrians involved in fatal accidents 0
Louisiana average
Fatal accident count 13557 Vehicles involved in fatal accidents 19763 Fatal accidents involving drunk persons 4681 Fatalities 15199 Persons involved in fatal accidents 34072 Pedestrians involved in fatal accidents 1120
See more detailed statistics of Lafitte fatal car crashes and road traffic accidents for 1975 - 2021 here
National Bridge Inventory (NBI) Statistics 3 Number of bridges49ft / 14.8m Total length $312,000 Total costs38,380 Total average daily traffic3,912 Total average daily truck traffic64,146 Total future (year 2034) average daily traffic
FCC Registered Cell Phone Towers: 2 (
See the full list of FCC Registered Cell Phone Towers in Lafitte )
FCC Registered Antenna Towers: 52 (
See the full list of FCC Registered Antenna Towers )
FCC Registered Broadcast Land Mobile Towers: 5
Lafitte Compressor Station 1 13 Mi Se (Lat: 29.581611 Lon: -90.065639), Call Sign: KGS799, Licensee ID: L00009844, Assigned Frequencies: 48.9400 MHz, Grant Date: 10/03/1995, Expiration Date: 10/03/2000, Cancellation Date: 12/03/2000, Registrant: Texaco Communications Inc, Denver, CO 80217, Phone: (303) 860-3584 7 Mi S (Lat: 29.583000 Lon: -90.063417), Call Sign: KKA239, Licensee ID: L00009844, Assigned Frequencies: 153.290 MHz, Grant Date: 10/03/1995, Expiration Date: 10/03/2000, Cancellation Date: 12/03/2000, Registrant: Texaco Communications Inc, Denver, CO 80217, Phone: (504) 876-5645 11 Mi Se (Lat: 29.583000 Lon: -90.063417), Call Sign: KKA960, Licensee ID: L00008706, Assigned Frequencies: 48.9400 MHz, Grant Date: 09/17/2002, Expiration Date: 09/11/2012, Cancellation Date: 05/27/2003, Certifier: Marc Coventry, Registrant: Chevron Usa Inc, 1001 G Street, Nw, Suite 500 West, Washington, DC 20001, Phone: (202) 434-4282, Fax: (202) 434-4646, Email:
Lafitte Dock 2 Mi S (Lat: 29.652722 Lon: -90.105361), Call Sign: KUO780, Licensee ID: L00008706, Assigned Frequencies: 48.9400 MHz, Grant Date: 07/04/2001, Expiration Date: 08/12/2011, Cancellation Date: 05/27/2003, Certifier: Marc Coventry, Registrant: Chevron Usa Inc, 1001 G Street, Nw, Suite 500 West, Washington, DC 20001, Phone: (202) 434-4282, Fax: (202) 434-4646, Email:
1836 Rural Highway 301 ( 30292 / Lafitte La 1 ) (Lat: 29.686083 Lon: -90.105333), Type: Tower, Structure height: 121.9 m, Overall height: 125.9 m, Call Sign: WQHI998, Assigned Frequencies: 764.518 MHz, 764.756 MHz, 764.768 MHz, 765.006 MHz, 765.018 MHz, 765.506 MHz, 765.518 MHz, 773.531 MHz, 773.543 MHz, 773.781 MHz, 773.793 MHz, Grant Date: 08/10/2007, Expiration Date: 06/01/2008, Cancellation Date: 01/09/2010, Certifier: Curtis Bowers, Registrant: M S Benbow And Associates, 2450 Severn Avenue Suite 400, Metairie, LA 70001, Phone: (504) 836-8902, Fax: (504) 836-2088, Email:
FCC Registered Microwave Towers: 3
STATION, 7 Mi S Of (Lat: 29.582972 Lon: -90.063389), Overall height: 87.8 m, Call Sign: WNEE988, Assigned Frequencies: 2183.20 MHz, 2196.00 MHz, 2191.20 MHz, Grant Date: 08/18/1998, Expiration Date: 09/23/2008, Cancellation Date: 05/12/2004, Certifier: David M Pfeffer, Registrant: Shell Communications Inc, Houston, TX 77252-0329, Phone: (713) 245-1303, Fax: (713) 245-1010, Email:
TETCO, St Marys Point (Lat: 29.438472 Lon: -89.926361), Type: Rig, Structure height: 12.2 m, Overall height: 16.8 m, Call Sign: WRYP441, Assigned Frequencies: 11265.0 MHz, 11265.0 MHz, 11265.0 MHz, 11265.0 MHz, 11265.0 MHz, 11265.0 MHz, 11265.0 MHz, 11265.0 MHz, 11265.0 MHz, 11265.0 MHz, 11265.0 MHz, Grant Date: 09/05/2023, Expiration Date: 09/05/2033, Certifier: Jennifer Roy, Registrant: Micronet Communications, Inc., 812 Lexington Dr, Plano, TX 75075, Phone: (972) 422-7200, Email:
TGP, 0.1 Mile Of St Marys Point (Lat: 29.422167 Lon: -89.926361), Type: Rig, Structure height: 12.2 m, Overall height: 16.8 m, Call Sign: WRYP443, Assigned Frequencies: 11425.0 MHz, 11425.0 MHz, 11425.0 MHz, 11425.0 MHz, 11425.0 MHz, 11425.0 MHz, 11425.0 MHz, 11425.0 MHz, 11425.0 MHz, 11425.0 MHz, 11425.0 MHz, Grant Date: 09/05/2023, Expiration Date: 09/05/2033, Certifier: Jennifer Roy, Registrant: Micronet Communications, Inc., 812 Lexington Dr, Plano, TX 75075, Phone: (972) 422-7200, Email:
FCC Registered Maritime Coast & Aviation Ground Towers: 1
11 Mi Se (Lat: 29.583833 Lon: -90.052583), Type: Building, Call Sign: KGW427, Licensee ID: L00008706, Assigned Frequencies: 156.450 MHz, 156.175 MHz, 156.500 MHz, 156.800 MHz, 156.900 MHz, Grant Date: 03/14/2000, Expiration Date: 05/04/2005, Cancellation Date: 05/27/2003, Certifier: Marc Coventry, Registrant: Chevron Usa Inc, 1001 G St, N.W., Suite 500 West, Washington, DC 20001, Phone: (202) 434-4282, Fax: (202) 434-4646, Email:
FCC Registered Amateur Radio Licenses: 2
Call Sign: WA5CDX, Licensee ID: L01337732, Grant Date: 08/29/2017, Expiration Date: 11/24/2027, Certifier: Ronald L Platt, Registrant: Ronald L Platt, 546 Jean Lafitte Blvd, Lafitte, LA 70067Call Sign: KE5CZY, Licensee ID: L00941118, Grant Date: 10/02/2014, Expiration Date: 11/16/2024, Certifier: Kerry M Jeanice, Registrant: Kerry M Jeanice, 5629 Fisher Street, Lafitte, LA 70067FAA Registered Aircraft: 4
Aircraft: PIPER PA-18A 150 (Category: Land, Weight: Up to 12,499 Pounds, Speed: 97 mph), Engine: LYCOMING 0-320 SERIES (180 HP) (Reciprocating)N-Number: 2983Z, N2983Z, N-2983Z, Serial Number: 18-7094, Year manufactured: 1959, Airworthiness Date: 07/20/1972, Certificate Issue Date: 06/03/2020Registrant (Individual): Lane P Panepinto, 280 Jean Lafitte Blvd, Lafitte, LA 70067Aircraft: CESSNA 170B (Category: Land, Seats: 4, Weight: Up to 12,499 Pounds, Speed: 105 mph), Engine: CONT MOTOR C145 SERIES (145 HP) (Reciprocating)N-Number: 3172B, N3172B, N-3172B, Serial Number: 25414, Airworthiness Date: 03/06/1956, Certificate Issue Date: 05/03/2018Registrant (LLC): Cajun Air LLC, 280 Jean Lafitte Blvd, Lafitte, LA 70067Deregistered: Cancel Date: 09/06/2012Aircraft: CESSNA U206B (Category: Land, Seats: 6, Weight: Up to 12,499 Pounds, Speed: 132 mph), Engine: CONT MOTOR IO 520 SERIES (285 HP) (Reciprocating)N-Number: 3831G, N3831G, N-3831G, Serial Number: U206-0831, Airworthiness Date: 04/07/1967, Certificate Issue Date: 05/29/2019Registrant (Individual): Lane P Panepinto, 280 Jean Lafitte Blvd, Lafitte, LA 70067Deregistered: Cancel Date: 06/19/2017Aircraft: CESSNA U206B (Category: Land, Seats: 6, Weight: Up to 12,499 Pounds, Speed: 132 mph), Engine: CONT MOTOR IO 520 SERIES (285 HP) (Reciprocating)N-Number: 7896S, N7896S, N-7896S, Serial Number: U2060814, Year manufactured: 1967, Airworthiness Date: 03/29/1967, Certificate Issue Date: 06/10/2008Registrant (Individual): Lane Panepinto, 280 Jean Lafitte Blvd, Lafitte, LA 70067
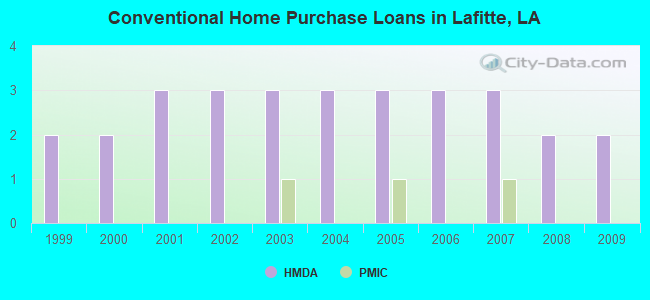
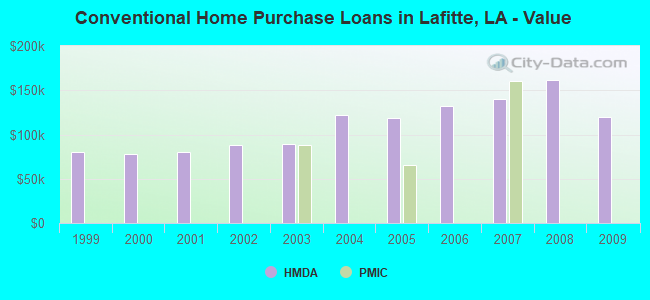
Home Mortgage Disclosure Act Aggregated Statistics For Year 2009(Based on 1 partial tract) B) Conventional C) Refinancings D) Home Improvement Loans F) Non-occupant Loans on G) Loans On Manufactured Number Average Value Number Average Value Number Average Value Number Average Value Number Average Value
LOANS ORIGINATED 2 $119,945 4 $115,655 1 $34,730 2 $159,080 1 $28,950 APPLICATIONS APPROVED, NOT ACCEPTED 0 $0 0 $0 0 $0 0 $0 0 $0 APPLICATIONS DENIED 1 $34,690 1 $209,130 1 $24,830 1 $80,390 1 $37,650 APPLICATIONS WITHDRAWN 0 $0 1 $83,780 0 $0 0 $0 0 $0 FILES CLOSED FOR INCOMPLETENESS 0 $0 0 $0 0 $0 0 $0 0 $0
Aggregated Statistics For Year 2008(Based on 1 partial tract) B) Conventional C) Refinancings D) Home Improvement Loans F) Non-occupant Loans on G) Loans On Manufactured Number Average Value Number Average Value Number Average Value Number Average Value Number Average Value
LOANS ORIGINATED 2 $161,660 3 $150,190 1 $28,530 2 $212,175 0 $0 APPLICATIONS APPROVED, NOT ACCEPTED 1 $32,150 1 $126,550 0 $0 0 $0 1 $27,910 APPLICATIONS DENIED 1 $56,290 2 $110,765 1 $47,780 0 $0 1 $57,290 APPLICATIONS WITHDRAWN 0 $0 1 $81,660 0 $0 0 $0 0 $0 FILES CLOSED FOR INCOMPLETENESS 0 $0 0 $0 0 $0 0 $0 0 $0
Aggregated Statistics For Year 2007(Based on 1 partial tract) B) Conventional C) Refinancings D) Home Improvement Loans F) Non-occupant Loans on G) Loans On Manufactured Number Average Value Number Average Value Number Average Value Number Average Value Number Average Value
LOANS ORIGINATED 3 $140,603 3 $126,730 1 $67,380 2 $175,985 1 $33,690 APPLICATIONS APPROVED, NOT ACCEPTED 0 $0 1 $118,580 0 $0 0 $0 0 $0 APPLICATIONS DENIED 1 $60,290 2 $149,360 1 $37,110 1 $55,320 1 $44,310 APPLICATIONS WITHDRAWN 0 $0 1 $177,220 0 $0 0 $0 0 $0 FILES CLOSED FOR INCOMPLETENESS 0 $0 0 $0 0 $0 0 $0 0 $0
Aggregated Statistics For Year 2006(Based on 1 partial tract) B) Conventional C) Refinancings D) Home Improvement Loans F) Non-occupant Loans on G) Loans On Manufactured Number Average Value Number Average Value Number Average Value Number Average Value Number Average Value
LOANS ORIGINATED 3 $131,810 3 $92,707 1 $46,740 2 $111,285 1 $44,660 APPLICATIONS APPROVED, NOT ACCEPTED 1 $56,480 0 $0 0 $0 0 $0 0 $0 APPLICATIONS DENIED 1 $129,710 2 $94,015 1 $19,250 0 $0 1 $51,710 APPLICATIONS WITHDRAWN 1 $69,760 1 $104,330 0 $0 0 $0 0 $0 FILES CLOSED FOR INCOMPLETENESS 0 $0 0 $0 0 $0 0 $0 0 $0
Aggregated Statistics For Year 2005(Based on 1 partial tract) B) Conventional C) Refinancings D) Home Improvement Loans F) Non-occupant Loans on G) Loans On Manufactured Number Average Value Number Average Value Number Average Value Number Average Value Number Average Value
LOANS ORIGINATED 3 $118,953 4 $93,728 1 $44,120 2 $104,875 1 $24,100 APPLICATIONS APPROVED, NOT ACCEPTED 1 $79,930 1 $85,080 0 $0 0 $0 0 $0 APPLICATIONS DENIED 2 $68,955 3 $91,913 1 $18,940 0 $0 1 $51,630 APPLICATIONS WITHDRAWN 0 $0 1 $116,850 0 $0 0 $0 0 $0 FILES CLOSED FOR INCOMPLETENESS 0 $0 1 $178,290 0 $0 0 $0 0 $0
Aggregated Statistics For Year 2004(Based on 1 partial tract) A) FHA, FSA/RHS & VA B) Conventional C) Refinancings D) Home Improvement Loans F) Non-occupant Loans on G) Loans On Manufactured Number Average Value Number Average Value Number Average Value Number Average Value Number Average Value Number Average Value
LOANS ORIGINATED 1 $55,060 3 $121,480 5 $106,846 1 $51,170 2 $103,585 0 $0 APPLICATIONS APPROVED, NOT ACCEPTED 0 $0 0 $0 1 $90,940 0 $0 0 $0 0 $0 APPLICATIONS DENIED 0 $0 1 $123,160 3 $101,140 1 $21,790 0 $0 1 $41,160 APPLICATIONS WITHDRAWN 0 $0 1 $76,230 1 $125,860 0 $0 0 $0 0 $0 FILES CLOSED FOR INCOMPLETENESS 0 $0 0 $0 1 $80,120 0 $0 0 $0 0 $0
Aggregated Statistics For Year 2003(Based on 1 partial tract) B) Conventional C) Refinancings D) Home Improvement Loans F) Non-occupant Loans on Number Average Value Number Average Value Number Average Value Number Average Value
LOANS ORIGINATED 3 $89,577 9 $103,282 2 $23,910 2 $118,350 APPLICATIONS APPROVED, NOT ACCEPTED 0 $0 2 $76,845 0 $0 0 $0 APPLICATIONS DENIED 1 $71,920 3 $96,557 1 $27,370 0 $0 APPLICATIONS WITHDRAWN 1 $55,440 1 $154,770 0 $0 0 $0 FILES CLOSED FOR INCOMPLETENESS 0 $0 0 $0 0 $0 0 $0
Aggregated Statistics For Year 2002(Based on 1 partial tract) B) Conventional C) Refinancings D) Home Improvement Loans F) Non-occupant Loans on Number Average Value Number Average Value Number Average Value Number Average Value
LOANS ORIGINATED 3 $88,077 7 $92,290 1 $40,000 2 $93,495 APPLICATIONS APPROVED, NOT ACCEPTED 0 $0 1 $106,490 0 $0 0 $0 APPLICATIONS DENIED 1 $94,290 2 $75,520 1 $18,210 0 $0 APPLICATIONS WITHDRAWN 0 $0 1 $80,270 0 $0 0 $0 FILES CLOSED FOR INCOMPLETENESS 0 $0 0 $0 0 $0 0 $0
Aggregated Statistics For Year 2001(Based on 1 partial tract) B) Conventional C) Refinancings D) Home Improvement Loans F) Non-occupant Loans on Number Average Value Number Average Value Number Average Value Number Average Value
LOANS ORIGINATED 3 $80,040 6 $86,862 1 $31,380 1 $92,750 APPLICATIONS APPROVED, NOT ACCEPTED 0 $0 1 $51,980 0 $0 0 $0 APPLICATIONS DENIED 1 $43,270 2 $73,860 0 $0 0 $0 APPLICATIONS WITHDRAWN 0 $0 1 $88,160 0 $0 0 $0 FILES CLOSED FOR INCOMPLETENESS 0 $0 0 $0 0 $0 0 $0
Aggregated Statistics For Year 2000(Based on 1 partial tract) B) Conventional C) Refinancings D) Home Improvement Loans F) Non-occupant Loans on Number Average Value Number Average Value Number Average Value Number Average Value
LOANS ORIGINATED 2 $77,885 2 $83,005 1 $45,010 1 $43,390 APPLICATIONS APPROVED, NOT ACCEPTED 0 $0 1 $52,860 0 $0 0 $0 APPLICATIONS DENIED 1 $58,980 2 $51,650 1 $11,320 0 $0 APPLICATIONS WITHDRAWN 0 $0 1 $46,510 0 $0 0 $0 FILES CLOSED FOR INCOMPLETENESS 0 $0 0 $0 0 $0 0 $0
Aggregated Statistics For Year 1999(Based on 1 partial tract) B) Conventional C) Refinancings D) Home Improvement Loans F) Non-occupant Loans on Number Average Value Number Average Value Number Average Value Number Average Value
LOANS ORIGINATED 2 $79,950 3 $63,527 2 $17,185 1 $28,260 APPLICATIONS APPROVED, NOT ACCEPTED 0 $0 1 $60,710 0 $0 0 $0 APPLICATIONS DENIED 1 $52,990 1 $92,540 1 $12,290 0 $0 APPLICATIONS WITHDRAWN 0 $0 1 $43,320 0 $0 0 $0 FILES CLOSED FOR INCOMPLETENESS 0 $0 0 $0 0 $0 0 $0
Detailed HMDA statistics for the following Tracts:
0279.00
Private Mortgage Insurance Companies Aggregated Statistics For Year 2007(Based on 1 partial tract) A) Conventional Number Average Value
LOANS ORIGINATED 1 $160,620 APPLICATIONS APPROVED, NOT ACCEPTED 0 $0 APPLICATIONS DENIED 0 $0 APPLICATIONS WITHDRAWN 0 $0 FILES CLOSED FOR INCOMPLETENESS 0 $0
Aggregated Statistics For Year 2005(Based on 1 partial tract) A) Conventional Number Average Value
LOANS ORIGINATED 1 $65,300 APPLICATIONS APPROVED, NOT ACCEPTED 0 $0 APPLICATIONS DENIED 0 $0 APPLICATIONS WITHDRAWN 0 $0 FILES CLOSED FOR INCOMPLETENESS 0 $0
Aggregated Statistics For Year 2003(Based on 1 partial tract) A) Conventional Number Average Value
LOANS ORIGINATED 1 $88,160 APPLICATIONS APPROVED, NOT ACCEPTED 0 $0 APPLICATIONS DENIED 0 $0 APPLICATIONS WITHDRAWN 0 $0 FILES CLOSED FOR INCOMPLETENESS 0 $0
Aggregated Statistics For Year 2002(Based on 1 partial tract) B) Refinancings Number Average Value
LOANS ORIGINATED 1 $89,360 APPLICATIONS APPROVED, NOT ACCEPTED 0 $0 APPLICATIONS DENIED 0 $0 APPLICATIONS WITHDRAWN 0 $0 FILES CLOSED FOR INCOMPLETENESS 0 $0
Detailed PMIC statistics for the following Tracts:
0279.00
Lafitte compared to Louisiana state average:
Unemployed percentage significantly below state average. Black race population percentage significantly below state average. Hispanic race population percentage significantly below state average. Median age above state average. Foreign-born population percentage significantly below state average. Renting percentage significantly below state average. House age above state average. Number of college students significantly below state average.
#13 on the list of "Top 100 low-educated but high-earning cities"
#31 (70036) on the list of "Top 101 zip codes with the largest percentage of taxpayers reporting profit/loss from business in 2012 (pop 1,000+)"
#93 (70036) on the list of "Top 101 zip codes with the largest percentage of French first ancestries"
#46 on the list of "Top 101 counties with the lowest percentage of residents that drank alcohol in the past 30 days"
#49 on the list of "Top 101 counties with the largest decrease in the number of infant deaths per 1000 residents 2000-2006 to 2007-2013 (pop. 50,000+)"
#50 on the list of "Top 101 counties with the largest increase in the number of births per 1000 residents 2000-2006 to 2007-2013 (pop 50,000+)"
#64 on the list of "Top 101 counties with the highest number of infant deaths per 1000 residents 2007-2013 (pop. 50,000+)"
#68 on the list of "Top 101 counties with the highest surface withdrawal of fresh water for public supply (pop. 50,000+)"
Top Patent Applicants
Lori Eschete (1)
Marty Eschete (1)
Total of 1 patent application in 2008-2024.


 Recent articles from our blog. Our writers, many of them Ph.D. graduates or candidates, create easy-to-read articles on a wide variety of topics.


 (20.6 miles
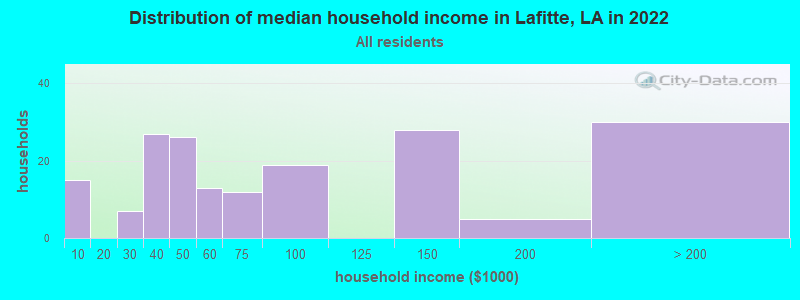


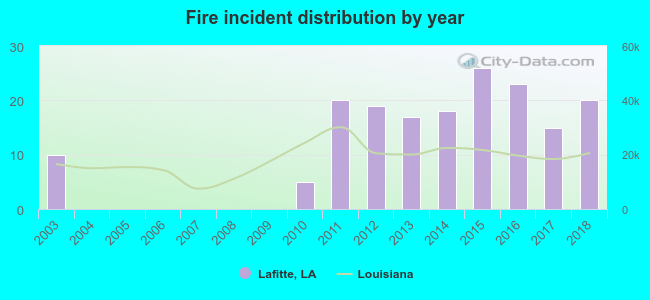 Based on the data from the years 2003 - 2018 the average number of fires per year is 11. The highest number of reported fires - 26 took place in 2015, and the least - 0 in 2004. The data has a rising trend.
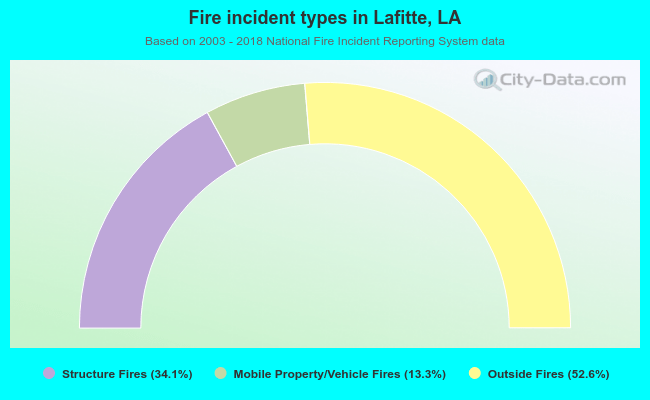 When looking into fire subcategories, the most reports belonged to: Outside Fires (52.6%), and Structure Fires (34.1%).