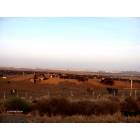
Kerman, California Submit your own pictures of this city and show them to the world
OSM Map
General Map
Google Map
MSN Map
OSM Map
General Map
Google Map
MSN Map
OSM Map
General Map
Google Map
MSN Map
OSM Map
General Map
Google Map
MSN Map
Please wait while loading the map...
Population in 2022: 16,208 (100% urban, 0% rural). Population change since 2000: +89.5%Males: 8,016 Females: 8,192
March 2022 cost of living index in Kerman: 96.4 (near average, U.S. average is 100) Percentage of residents living in poverty in 2022: 21.9%for White Non-Hispanic residents , 19.4% for Hispanic or Latino residents , 4.8% for American Indian residents , 29.2% for other race residents , 16.9% for two or more races residents )
Profiles of local businesses
Business Search - 14 Million verified businesses
Data:
Median household income ($)
Median household income (% change since 2000)
Household income diversity
Ratio of average income to average house value (%)
Ratio of average income to average rent
Median household income ($) - White
Median household income ($) - Black or African American
Median household income ($) - Asian
Median household income ($) - Hispanic or Latino
Median household income ($) - American Indian and Alaska Native
Median household income ($) - Multirace
Median household income ($) - Other Race
Median household income for houses/condos with a mortgage ($)
Median household income for apartments without a mortgage ($)
Races - White alone (%)
Races - White alone (% change since 2000)
Races - Black alone (%)
Races - Black alone (% change since 2000)
Races - American Indian alone (%)
Races - American Indian alone (% change since 2000)
Races - Asian alone (%)
Races - Asian alone (% change since 2000)
Races - Hispanic (%)
Races - Hispanic (% change since 2000)
Races - Native Hawaiian and Other Pacific Islander alone (%)
Races - Native Hawaiian and Other Pacific Islander alone (% change since 2000)
Races - Two or more races (%)
Races - Two or more races (% change since 2000)
Races - Other race alone (%)
Races - Other race alone (% change since 2000)
Racial diversity
Unemployment (%)
Unemployment (% change since 2000)
Unemployment (%) - White
Unemployment (%) - Black or African American
Unemployment (%) - Asian
Unemployment (%) - Hispanic or Latino
Unemployment (%) - American Indian and Alaska Native
Unemployment (%) - Multirace
Unemployment (%) - Other Race
Population density (people per square mile)
Population - Males (%)
Population - Females (%)
Population - Males (%) - White
Population - Males (%) - Black or African American
Population - Males (%) - Asian
Population - Males (%) - Hispanic or Latino
Population - Males (%) - American Indian and Alaska Native
Population - Males (%) - Multirace
Population - Males (%) - Other Race
Population - Females (%) - White
Population - Females (%) - Black or African American
Population - Females (%) - Asian
Population - Females (%) - Hispanic or Latino
Population - Females (%) - American Indian and Alaska Native
Population - Females (%) - Multirace
Population - Females (%) - Other Race
Coronavirus confirmed cases (Apr 19, 2024)
Deaths caused by coronavirus (Apr 19, 2024)
Coronavirus confirmed cases (per 100k population) (Apr 19, 2024)
Deaths caused by coronavirus (per 100k population) (Apr 19, 2024)
Daily increase in number of cases (Apr 19, 2024)
Weekly increase in number of cases (Apr 19, 2024)
Cases doubled (in days) (Apr 19, 2024)
Hospitalized patients (Apr 18, 2022)
Negative test results (Apr 18, 2022)
Total test results (Apr 18, 2022)
COVID Vaccine doses distributed (per 100k population) (Sep 19, 2023)
COVID Vaccine doses administered (per 100k population) (Sep 19, 2023)
COVID Vaccine doses distributed (Sep 19, 2023)
COVID Vaccine doses administered (Sep 19, 2023)
Likely homosexual households (%)
Likely homosexual households (% change since 2000)
Likely homosexual households - Lesbian couples (%)
Likely homosexual households - Lesbian couples (% change since 2000)
Likely homosexual households - Gay men (%)
Likely homosexual households - Gay men (% change since 2000)
Cost of living index
Median gross rent ($)
Median contract rent ($)
Median monthly housing costs ($)
Median house or condo value ($)
Median house or condo value ($ change since 2000)
Mean house or condo value by units in structure - 1, detached ($)
Mean house or condo value by units in structure - 1, attached ($)
Mean house or condo value by units in structure - 2 ($)
Mean house or condo value by units in structure by units in structure - 3 or 4 ($)
Mean house or condo value by units in structure - 5 or more ($)
Mean house or condo value by units in structure - Boat, RV, van, etc. ($)
Mean house or condo value by units in structure - Mobile home ($)
Median house or condo value ($) - White
Median house or condo value ($) - Black or African American
Median house or condo value ($) - Asian
Median house or condo value ($) - Hispanic or Latino
Median house or condo value ($) - American Indian and Alaska Native
Median house or condo value ($) - Multirace
Median house or condo value ($) - Other Race
Median resident age
Resident age diversity
Median resident age - Males
Median resident age - Females
Median resident age - White
Median resident age - Black or African American
Median resident age - Asian
Median resident age - Hispanic or Latino
Median resident age - American Indian and Alaska Native
Median resident age - Multirace
Median resident age - Other Race
Median resident age - Males - White
Median resident age - Males - Black or African American
Median resident age - Males - Asian
Median resident age - Males - Hispanic or Latino
Median resident age - Males - American Indian and Alaska Native
Median resident age - Males - Multirace
Median resident age - Males - Other Race
Median resident age - Females - White
Median resident age - Females - Black or African American
Median resident age - Females - Asian
Median resident age - Females - Hispanic or Latino
Median resident age - Females - American Indian and Alaska Native
Median resident age - Females - Multirace
Median resident age - Females - Other Race
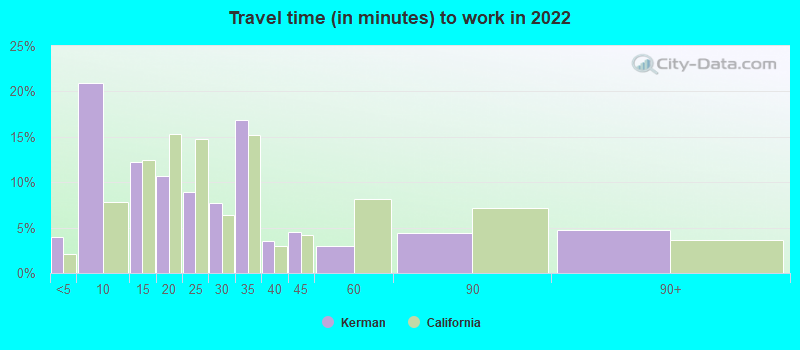
Commute - mean travel time to work (minutes)
Travel time to work - Less than 5 minutes (%)
Travel time to work - Less than 5 minutes (% change since 2000)
Travel time to work - 5 to 9 minutes (%)
Travel time to work - 5 to 9 minutes (% change since 2000)
Travel time to work - 10 to 19 minutes (%)
Travel time to work - 10 to 19 minutes (% change since 2000)
Travel time to work - 20 to 29 minutes (%)
Travel time to work - 20 to 29 minutes (% change since 2000)
Travel time to work - 30 to 39 minutes (%)
Travel time to work - 30 to 39 minutes (% change since 2000)
Travel time to work - 40 to 59 minutes (%)
Travel time to work - 40 to 59 minutes (% change since 2000)
Travel time to work - 60 to 89 minutes (%)
Travel time to work - 60 to 89 minutes (% change since 2000)
Travel time to work - 90 or more minutes (%)
Travel time to work - 90 or more minutes (% change since 2000)
Marital status - Never married (%)
Marital status - Now married (%)
Marital status - Separated (%)
Marital status - Widowed (%)
Marital status - Divorced (%)
Median family income ($)
Median family income (% change since 2000)
Median non-family income ($)
Median non-family income (% change since 2000)
Median per capita income ($)
Median per capita income (% change since 2000)
Median family income ($) - White
Median family income ($) - Black or African American
Median family income ($) - Asian
Median family income ($) - Hispanic or Latino
Median family income ($) - American Indian and Alaska Native
Median family income ($) - Multirace
Median family income ($) - Other Race
Median year house/condo built
Median year apartment built
Year house built - Built 2005 or later (%)
Year house built - Built 2000 to 2004 (%)
Year house built - Built 1990 to 1999 (%)
Year house built - Built 1980 to 1989 (%)
Year house built - Built 1970 to 1979 (%)
Year house built - Built 1960 to 1969 (%)
Year house built - Built 1950 to 1959 (%)
Year house built - Built 1940 to 1949 (%)
Year house built - Built 1939 or earlier (%)
Average household size
Household density (households per square mile)
Average household size - White
Average household size - Black or African American
Average household size - Asian
Average household size - Hispanic or Latino
Average household size - American Indian and Alaska Native
Average household size - Multirace
Average household size - Other Race
Occupied housing units (%)
Vacant housing units (%)
Owner occupied housing units (%)
Renter occupied housing units (%)
Vacancy status - For rent (%)
Vacancy status - For sale only (%)
Vacancy status - Rented or sold, not occupied (%)
Vacancy status - For seasonal, recreational, or occasional use (%)
Vacancy status - For migrant workers (%)
Vacancy status - Other vacant (%)
Residents with income below the poverty level (%)
Residents with income below 50% of the poverty level (%)
Children below poverty level (%)
Poor families by family type - Married-couple family (%)
Poor families by family type - Male, no wife present (%)
Poor families by family type - Female, no husband present (%)
Poverty status for native-born residents (%)
Poverty status for foreign-born residents (%)
Poverty among high school graduates not in families (%)
Poverty among people who did not graduate high school not in families (%)
Residents with income below the poverty level (%) - White
Residents with income below the poverty level (%) - Black or African American
Residents with income below the poverty level (%) - Asian
Residents with income below the poverty level (%) - Hispanic or Latino
Residents with income below the poverty level (%) - American Indian and Alaska Native
Residents with income below the poverty level (%) - Multirace
Residents with income below the poverty level (%) - Other Race
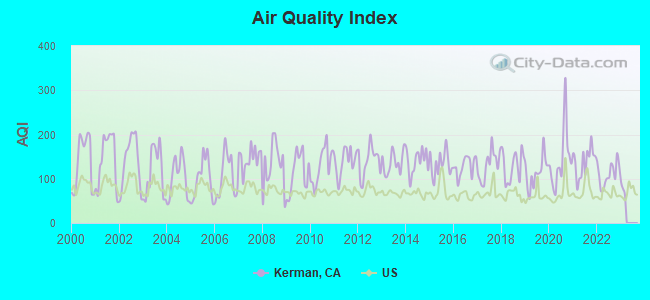
Air pollution - Air Quality Index (AQI)
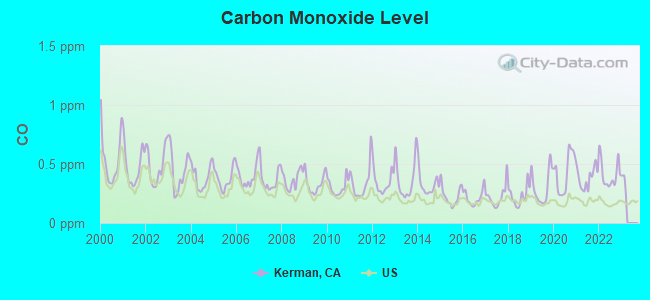
Air pollution - CO
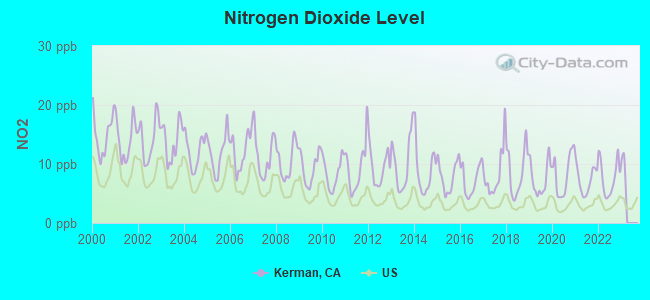
Air pollution - NO2
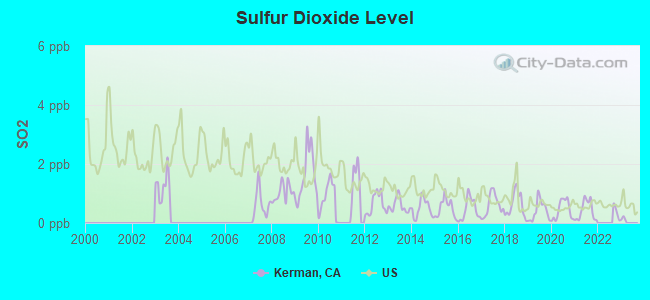
Air pollution - SO2
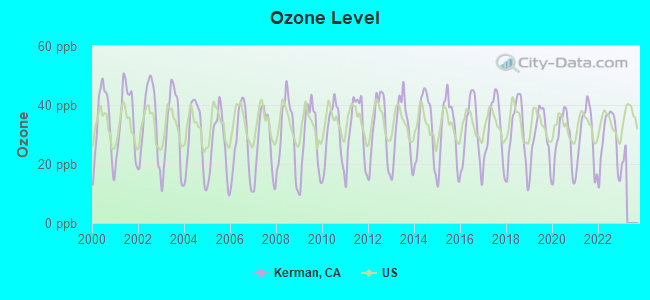
Air pollution - Ozone
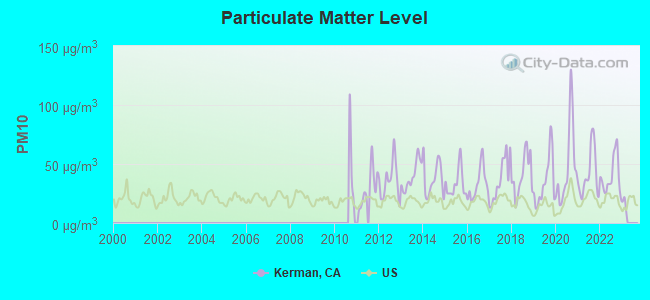
Air pollution - PM10
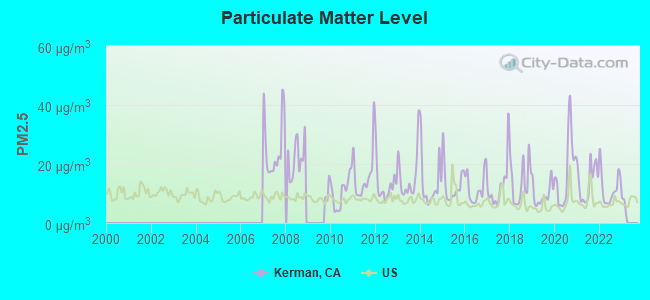
Air pollution - PM25
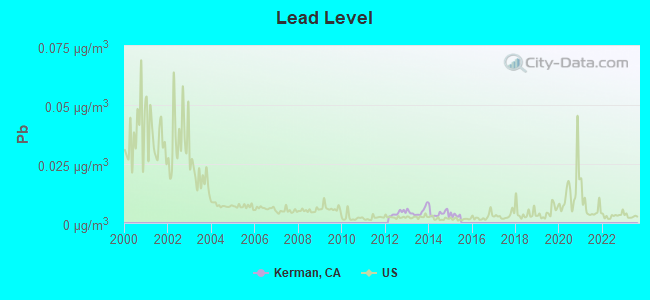
Air pollution - Pb
Crime - Murders per 100,000 population
Crime - Rapes per 100,000 population
Crime - Robberies per 100,000 population
Crime - Assaults per 100,000 population
Crime - Burglaries per 100,000 population
Crime - Thefts per 100,000 population
Crime - Auto thefts per 100,000 population
Crime - Arson per 100,000 population
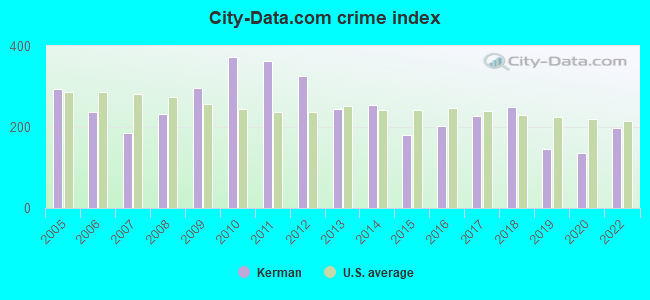
Crime - City-data.com crime index
Crime - Violent crime index
Crime - Property crime index
Crime - Murders per 100,000 population (5 year average)
Crime - Rapes per 100,000 population (5 year average)
Crime - Robberies per 100,000 population (5 year average)
Crime - Assaults per 100,000 population (5 year average)
Crime - Burglaries per 100,000 population (5 year average)
Crime - Thefts per 100,000 population (5 year average)
Crime - Auto thefts per 100,000 population (5 year average)
Crime - Arson per 100,000 population (5 year average)
Crime - City-data.com crime index (5 year average)
Crime - Violent crime index (5 year average)
Crime - Property crime index (5 year average)
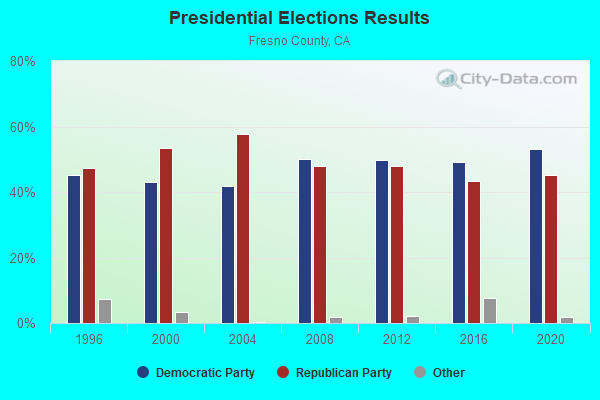
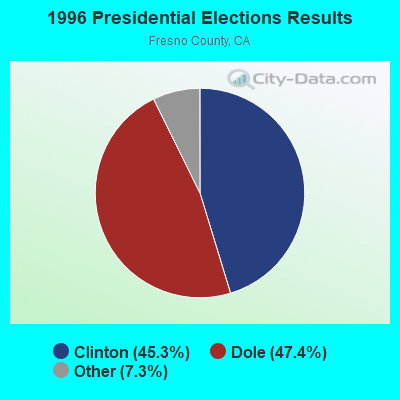
1996 Presidential Elections Results (%) - Democratic Party (Clinton)
1996 Presidential Elections Results (%) - Republican Party (Dole)
1996 Presidential Elections Results (%) - Other
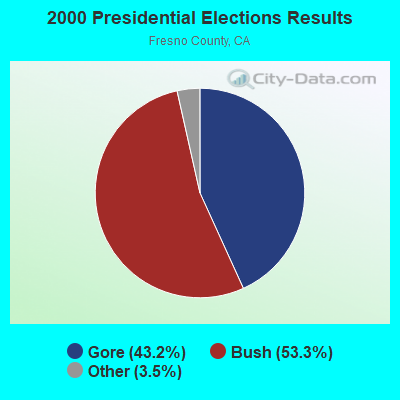
2000 Presidential Elections Results (%) - Democratic Party (Gore)
2000 Presidential Elections Results (%) - Republican Party (Bush)
2000 Presidential Elections Results (%) - Other
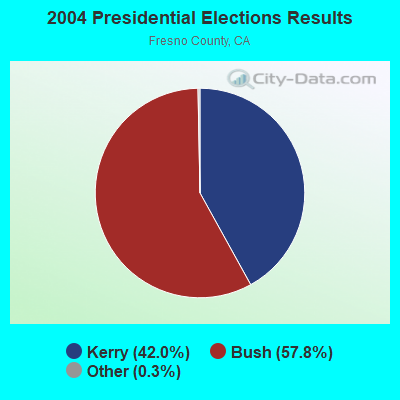
2004 Presidential Elections Results (%) - Democratic Party (Kerry)
2004 Presidential Elections Results (%) - Republican Party (Bush)
2004 Presidential Elections Results (%) - Other
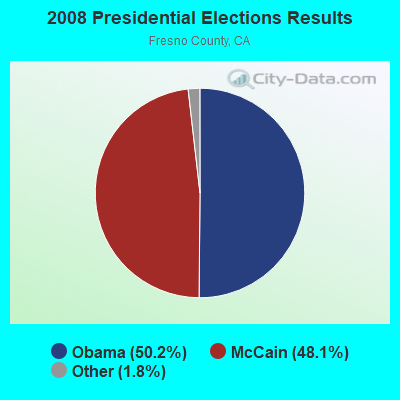
2008 Presidential Elections Results (%) - Democratic Party (Obama)
2008 Presidential Elections Results (%) - Republican Party (McCain)
2008 Presidential Elections Results (%) - Other
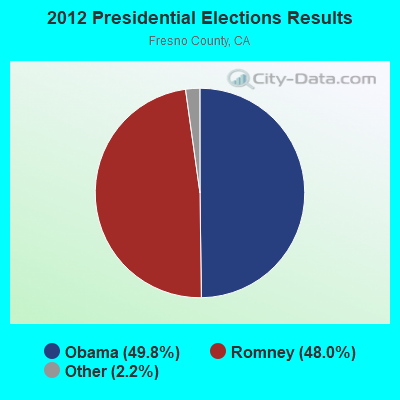
2012 Presidential Elections Results (%) - Democratic Party (Obama)
2012 Presidential Elections Results (%) - Republican Party (Romney)
2012 Presidential Elections Results (%) - Other
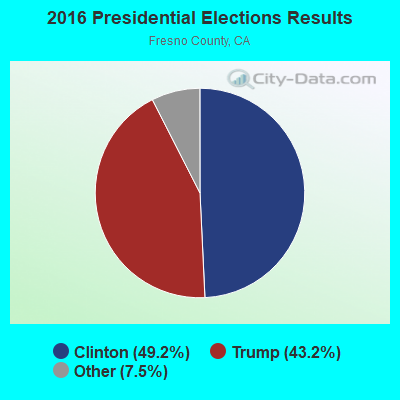
2016 Presidential Elections Results (%) - Democratic Party (Clinton)
2016 Presidential Elections Results (%) - Republican Party (Trump)
2016 Presidential Elections Results (%) - Other
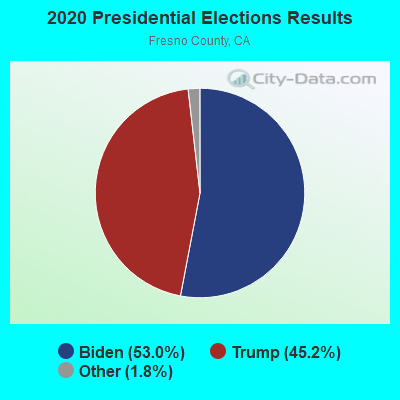
2020 Presidential Elections Results (%) - Democratic Party (Biden)
2020 Presidential Elections Results (%) - Republican Party (Trump)
2020 Presidential Elections Results (%) - Other
Ancestries Reported - Arab (%)
Ancestries Reported - Czech (%)
Ancestries Reported - Danish (%)
Ancestries Reported - Dutch (%)
Ancestries Reported - English (%)
Ancestries Reported - French (%)
Ancestries Reported - French Canadian (%)
Ancestries Reported - German (%)
Ancestries Reported - Greek (%)
Ancestries Reported - Hungarian (%)
Ancestries Reported - Irish (%)
Ancestries Reported - Italian (%)
Ancestries Reported - Lithuanian (%)
Ancestries Reported - Norwegian (%)
Ancestries Reported - Polish (%)
Ancestries Reported - Portuguese (%)
Ancestries Reported - Russian (%)
Ancestries Reported - Scotch-Irish (%)
Ancestries Reported - Scottish (%)
Ancestries Reported - Slovak (%)
Ancestries Reported - Subsaharan African (%)
Ancestries Reported - Swedish (%)
Ancestries Reported - Swiss (%)
Ancestries Reported - Ukrainian (%)
Ancestries Reported - United States (%)
Ancestries Reported - Welsh (%)
Ancestries Reported - West Indian (%)
Ancestries Reported - Other (%)
Educational Attainment - No schooling completed (%)
Educational Attainment - Less than high school (%)
Educational Attainment - High school or equivalent (%)
Educational Attainment - Less than 1 year of college (%)
Educational Attainment - 1 or more years of college (%)
Educational Attainment - Associate degree (%)
Educational Attainment - Bachelor's degree (%)
Educational Attainment - Master's degree (%)
Educational Attainment - Professional school degree (%)
Educational Attainment - Doctorate degree (%)
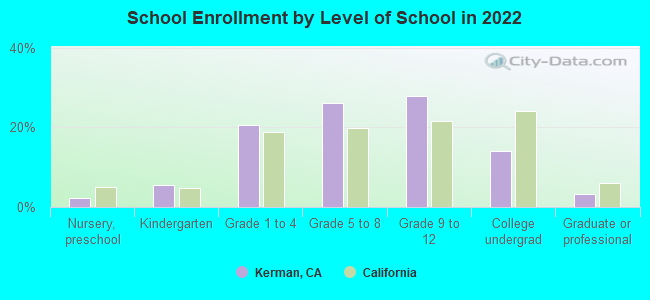
School Enrollment - Nursery, preschool (%)
School Enrollment - Kindergarten (%)
School Enrollment - Grade 1 to 4 (%)
School Enrollment - Grade 5 to 8 (%)
School Enrollment - Grade 9 to 12 (%)
School Enrollment - College undergrad (%)
School Enrollment - Graduate or professional (%)
School Enrollment - Not enrolled in school (%)
School enrollment - Public schools (%)
School enrollment - Private schools (%)
School enrollment - Not enrolled (%)
Median number of rooms in houses and condos
Median number of rooms in apartments
Housing units lacking complete plumbing facilities (%)
Housing units lacking complete kitchen facilities (%)
Density of houses
Urban houses (%)
Rural houses (%)
Households with people 60 years and over (%)
Households with people 65 years and over (%)
Households with people 75 years and over (%)
Households with one or more nonrelatives (%)
Households with no nonrelatives (%)
Population in households (%)
Family households (%)
Nonfamily households (%)
Population in families (%)
Family households with own children (%)
Median number of bedrooms in owner occupied houses
Mean number of bedrooms in owner occupied houses
Median number of bedrooms in renter occupied houses
Mean number of bedrooms in renter occupied houses
Median number of vehichles in owner occupied houses
Mean number of vehichles in owner occupied houses
Median number of vehichles in renter occupied houses
Mean number of vehichles in renter occupied houses
Mortgage status - with mortgage (%)
Mortgage status - with second mortgage (%)
Mortgage status - with home equity loan (%)
Mortgage status - with both second mortgage and home equity loan (%)
Mortgage status - without a mortgage (%)
Average family size
Average family size - White
Average family size - Black or African American
Average family size - Asian
Average family size - Hispanic or Latino
Average family size - American Indian and Alaska Native
Average family size - Multirace
Average family size - Other Race
Geographical mobility - Same house 1 year ago (%)
Geographical mobility - Moved within same county (%)
Geographical mobility - Moved from different county within same state (%)
Geographical mobility - Moved from different state (%)
Geographical mobility - Moved from abroad (%)
Place of birth - Born in state of residence (%)
Place of birth - Born in other state (%)
Place of birth - Native, outside of US (%)
Place of birth - Foreign born (%)
Housing units in structures - 1, detached (%)
Housing units in structures - 1, attached (%)
Housing units in structures - 2 (%)
Housing units in structures - 3 or 4 (%)
Housing units in structures - 5 to 9 (%)
Housing units in structures - 10 to 19 (%)
Housing units in structures - 20 to 49 (%)
Housing units in structures - 50 or more (%)
Housing units in structures - Mobile home (%)
Housing units in structures - Boat, RV, van, etc. (%)
House/condo owner moved in on average (years ago)
Renter moved in on average (years ago)
Year householder moved into unit - Moved in 1999 to March 2000 (%)
Year householder moved into unit - Moved in 1995 to 1998 (%)
Year householder moved into unit - Moved in 1990 to 1994 (%)
Year householder moved into unit - Moved in 1980 to 1989 (%)
Year householder moved into unit - Moved in 1970 to 1979 (%)
Year householder moved into unit - Moved in 1969 or earlier (%)
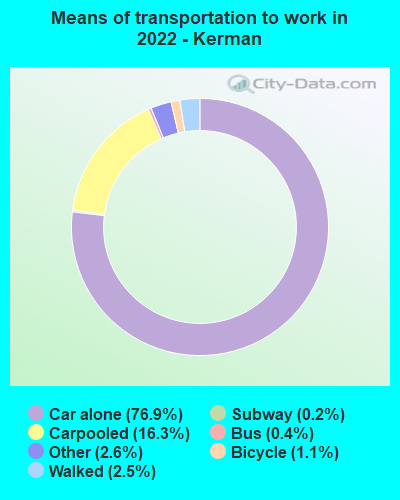
Means of transportation to work - Drove car alone (%)
Means of transportation to work - Carpooled (%)
Means of transportation to work - Public transportation (%)
Means of transportation to work - Bus or trolley bus (%)
Means of transportation to work - Streetcar or trolley car (%)
Means of transportation to work - Subway or elevated (%)
Means of transportation to work - Railroad (%)
Means of transportation to work - Ferryboat (%)
Means of transportation to work - Taxicab (%)
Means of transportation to work - Motorcycle (%)
Means of transportation to work - Bicycle (%)
Means of transportation to work - Walked (%)
Means of transportation to work - Other means (%)
Working at home (%)
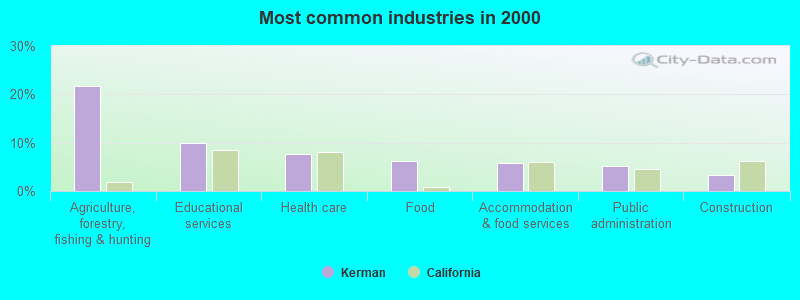
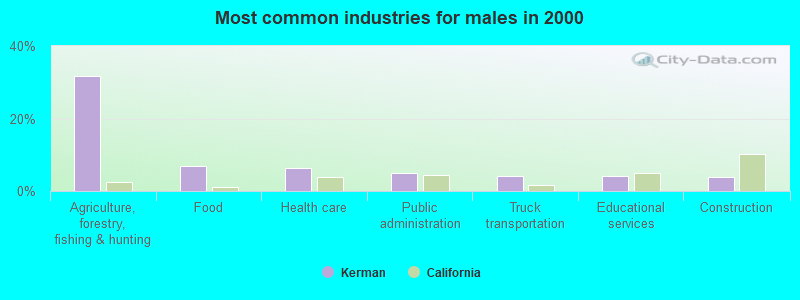
Industry diversity
Most Common Industries - Agriculture, forestry, fishing and hunting, and mining (%)
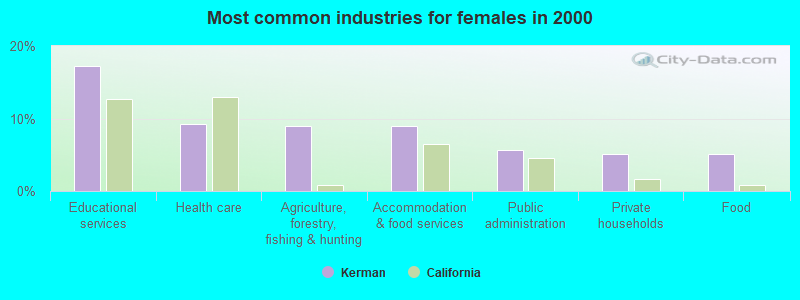
Most Common Industries - Agriculture, forestry, fishing and hunting (%)
Most Common Industries - Mining, quarrying, and oil and gas extraction (%)
Most Common Industries - Construction (%)
Most Common Industries - Manufacturing (%)
Most Common Industries - Wholesale trade (%)
Most Common Industries - Retail trade (%)
Most Common Industries - Transportation and warehousing, and utilities (%)
Most Common Industries - Transportation and warehousing (%)
Most Common Industries - Utilities (%)
Most Common Industries - Information (%)
Most Common Industries - Finance and insurance, and real estate and rental and leasing (%)
Most Common Industries - Finance and insurance (%)
Most Common Industries - Real estate and rental and leasing (%)
Most Common Industries - Professional, scientific, and management, and administrative and waste management services (%)
Most Common Industries - Professional, scientific, and technical services (%)
Most Common Industries - Management of companies and enterprises (%)
Most Common Industries - Administrative and support and waste management services (%)
Most Common Industries - Educational services, and health care and social assistance (%)
Most Common Industries - Educational services (%)
Most Common Industries - Health care and social assistance (%)
Most Common Industries - Arts, entertainment, and recreation, and accommodation and food services (%)
Most Common Industries - Arts, entertainment, and recreation (%)
Most Common Industries - Accommodation and food services (%)
Most Common Industries - Other services, except public administration (%)
Most Common Industries - Public administration (%)
Occupation diversity
Most Common Occupations - Management, business, science, and arts occupations (%)
Most Common Occupations - Management, business, and financial occupations (%)
Most Common Occupations - Management occupations (%)
Most Common Occupations - Business and financial operations occupations (%)
Most Common Occupations - Computer, engineering, and science occupations (%)
Most Common Occupations - Computer and mathematical occupations (%)
Most Common Occupations - Architecture and engineering occupations (%)
Most Common Occupations - Life, physical, and social science occupations (%)
Most Common Occupations - Education, legal, community service, arts, and media occupations (%)
Most Common Occupations - Community and social service occupations (%)
Most Common Occupations - Legal occupations (%)
Most Common Occupations - Education, training, and library occupations (%)
Most Common Occupations - Arts, design, entertainment, sports, and media occupations (%)
Most Common Occupations - Healthcare practitioners and technical occupations (%)
Most Common Occupations - Health diagnosing and treating practitioners and other technical occupations (%)
Most Common Occupations - Health technologists and technicians (%)
Most Common Occupations - Service occupations (%)
Most Common Occupations - Healthcare support occupations (%)
Most Common Occupations - Protective service occupations (%)
Most Common Occupations - Fire fighting and prevention, and other protective service workers including supervisors (%)
Most Common Occupations - Law enforcement workers including supervisors (%)
Most Common Occupations - Food preparation and serving related occupations (%)
Most Common Occupations - Building and grounds cleaning and maintenance occupations (%)
Most Common Occupations - Personal care and service occupations (%)
Most Common Occupations - Sales and office occupations (%)
Most Common Occupations - Sales and related occupations (%)
Most Common Occupations - Office and administrative support occupations (%)
Most Common Occupations - Natural resources, construction, and maintenance occupations (%)
Most Common Occupations - Farming, fishing, and forestry occupations (%)
Most Common Occupations - Construction and extraction occupations (%)
Most Common Occupations - Installation, maintenance, and repair occupations (%)
Most Common Occupations - Production, transportation, and material moving occupations (%)
Most Common Occupations - Production occupations (%)
Most Common Occupations - Transportation occupations (%)
Most Common Occupations - Material moving occupations (%)
People in Group quarters - Institutionalized population (%)
People in Group quarters - Correctional institutions (%)
People in Group quarters - Federal prisons and detention centers (%)
People in Group quarters - Halfway houses (%)
People in Group quarters - Local jails and other confinement facilities (including police lockups) (%)
People in Group quarters - Military disciplinary barracks (%)
People in Group quarters - State prisons (%)
People in Group quarters - Other types of correctional institutions (%)
People in Group quarters - Nursing homes (%)
People in Group quarters - Hospitals/wards, hospices, and schools for the handicapped (%)
People in Group quarters - Hospitals/wards and hospices for chronically ill (%)
People in Group quarters - Hospices or homes for chronically ill (%)
People in Group quarters - Military hospitals or wards for chronically ill (%)
People in Group quarters - Other hospitals or wards for chronically ill (%)
People in Group quarters - Hospitals or wards for drug/alcohol abuse (%)
People in Group quarters - Mental (Psychiatric) hospitals or wards (%)
People in Group quarters - Schools, hospitals, or wards for the mentally retarded (%)
People in Group quarters - Schools, hospitals, or wards for the physically handicapped (%)
People in Group quarters - Institutions for the deaf (%)
People in Group quarters - Institutions for the blind (%)
People in Group quarters - Orthopedic wards and institutions for the physically handicapped (%)
People in Group quarters - Wards in general hospitals for patients who have no usual home elsewhere (%)
People in Group quarters - Wards in military hospitals for patients who have no usual home elsewhere (%)
People in Group quarters - Juvenile institutions (%)
People in Group quarters - Long-term care (%)
People in Group quarters - Homes for abused, dependent, and neglected children (%)
People in Group quarters - Residential treatment centers for emotionally disturbed children (%)
People in Group quarters - Training schools for juvenile delinquents (%)
People in Group quarters - Short-term care, detention or diagnostic centers for delinquent children (%)
People in Group quarters - Type of juvenile institution unknown (%)
People in Group quarters - Noninstitutionalized population (%)
People in Group quarters - College dormitories (includes college quarters off campus) (%)
People in Group quarters - Military quarters (%)
People in Group quarters - On base (%)
People in Group quarters - Barracks, unaccompanied personnel housing (UPH), (Enlisted/Officer), ;and similar group living quarters for military personnel (%)
People in Group quarters - Transient quarters for temporary residents (%)
People in Group quarters - Military ships (%)
People in Group quarters - Group homes (%)
People in Group quarters - Homes or halfway houses for drug/alcohol abuse (%)
People in Group quarters - Homes for the mentally ill (%)
People in Group quarters - Homes for the mentally retarded (%)
People in Group quarters - Homes for the physically handicapped (%)
People in Group quarters - Other group homes (%)
People in Group quarters - Religious group quarters (%)
People in Group quarters - Dormitories (%)
People in Group quarters - Agriculture workers' dormitories on farms (%)
People in Group quarters - Job Corps and vocational training facilities (%)
People in Group quarters - Other workers' dormitories (%)
People in Group quarters - Crews of maritime vessels (%)
People in Group quarters - Other nonhousehold living situations (%)
People in Group quarters - Other noninstitutional group quarters (%)
Residents speaking English at home (%)
Residents speaking English at home - Born in the United States (%)
Residents speaking English at home - Native, born elsewhere (%)
Residents speaking English at home - Foreign born (%)
Residents speaking Spanish at home (%)
Residents speaking Spanish at home - Born in the United States (%)
Residents speaking Spanish at home - Native, born elsewhere (%)
Residents speaking Spanish at home - Foreign born (%)
Residents speaking other language at home (%)
Residents speaking other language at home - Born in the United States (%)
Residents speaking other language at home - Native, born elsewhere (%)
Residents speaking other language at home - Foreign born (%)
Class of Workers - Employee of private company (%)
Class of Workers - Self-employed in own incorporated business (%)
Class of Workers - Private not-for-profit wage and salary workers (%)
Class of Workers - Local government workers (%)
Class of Workers - State government workers (%)
Class of Workers - Federal government workers (%)
Class of Workers - Self-employed workers in own not incorporated business and Unpaid family workers (%)
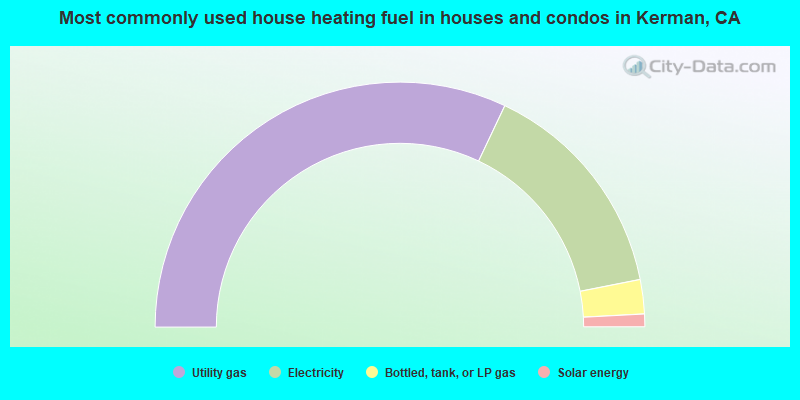
House heating fuel used in houses and condos - Utility gas (%)
House heating fuel used in houses and condos - Bottled, tank, or LP gas (%)
House heating fuel used in houses and condos - Electricity (%)
House heating fuel used in houses and condos - Fuel oil, kerosene, etc. (%)
House heating fuel used in houses and condos - Coal or coke (%)
House heating fuel used in houses and condos - Wood (%)
House heating fuel used in houses and condos - Solar energy (%)
House heating fuel used in houses and condos - Other fuel (%)
House heating fuel used in houses and condos - No fuel used (%)
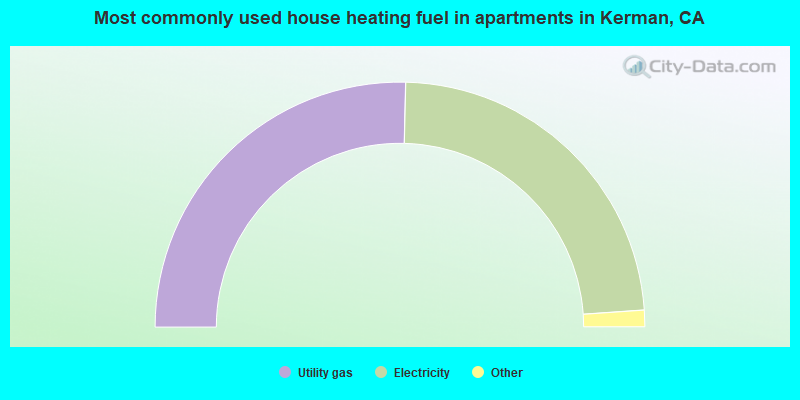
House heating fuel used in apartments - Utility gas (%)
House heating fuel used in apartments - Bottled, tank, or LP gas (%)
House heating fuel used in apartments - Electricity (%)
House heating fuel used in apartments - Fuel oil, kerosene, etc. (%)
House heating fuel used in apartments - Coal or coke (%)
House heating fuel used in apartments - Wood (%)
House heating fuel used in apartments - Solar energy (%)
House heating fuel used in apartments - Other fuel (%)
House heating fuel used in apartments - No fuel used (%)
Armed forces status - In Armed Forces (%)
Armed forces status - Civilian (%)
Armed forces status - Civilian - Veteran (%)
Armed forces status - Civilian - Nonveteran (%)
Fatal accidents locations in years 2005-2021
Fatal accidents locations in 2005
Fatal accidents locations in 2006
Fatal accidents locations in 2007
Fatal accidents locations in 2008
Fatal accidents locations in 2009
Fatal accidents locations in 2010
Fatal accidents locations in 2011
Fatal accidents locations in 2012
Fatal accidents locations in 2013
Fatal accidents locations in 2014
Fatal accidents locations in 2015
Fatal accidents locations in 2016
Fatal accidents locations in 2017
Fatal accidents locations in 2018
Fatal accidents locations in 2019
Fatal accidents locations in 2020
Fatal accidents locations in 2021
Alcohol use - People drinking some alcohol every month (%)
Alcohol use - People not drinking at all (%)
Alcohol use - Average days/month drinking alcohol
Alcohol use - Average drinks/week
Alcohol use - Average days/year people drink much
Audiometry - Average condition of hearing (%)
Audiometry - People that can hear a whisper from across a quiet room (%)
Audiometry - People that can hear normal voice from across a quiet room (%)
Audiometry - Ears ringing, roaring, buzzing (%)
Audiometry - Had a job exposure to loud noise (%)
Audiometry - Had off-work exposure to loud noise (%)
Blood Pressure & Cholesterol - Has high blood pressure (%)
Blood Pressure & Cholesterol - Checking blood pressure at home (%)
Blood Pressure & Cholesterol - Frequently checking blood cholesterol (%)
Blood Pressure & Cholesterol - Has high cholesterol level (%)
Consumer Behavior - Money monthly spent on food at supermarket/grocery store
Consumer Behavior - Money monthly spent on food at other stores
Consumer Behavior - Money monthly spent on eating out
Consumer Behavior - Money monthly spent on carryout/delivered foods
Consumer Behavior - Income spent on food at supermarket/grocery store (%)
Consumer Behavior - Income spent on food at other stores (%)
Consumer Behavior - Income spent on eating out (%)
Consumer Behavior - Income spent on carryout/delivered foods (%)
Current Health Status - General health condition (%)
Current Health Status - Blood donors (%)
Current Health Status - Has blood ever tested for HIV virus (%)
Current Health Status - Left-handed people (%)
Dermatology - People using sunscreen (%)
Diabetes - Diabetics (%)
Diabetes - Had a blood test for high blood sugar (%)
Diabetes - People taking insulin (%)
Diet Behavior & Nutrition - Diet health (%)
Diet Behavior & Nutrition - Milk product consumption (# of products/month)
Diet Behavior & Nutrition - Meals not home prepared (#/week)
Diet Behavior & Nutrition - Meals from fast food or pizza place (#/week)
Diet Behavior & Nutrition - Ready-to-eat foods (#/month)
Diet Behavior & Nutrition - Frozen meals/pizza (#/month)
Drug Use - People that ever used marijuana or hashish (%)
Drug Use - Ever used hard drugs (%)
Drug Use - Ever used any form of cocaine (%)
Drug Use - Ever used heroin (%)
Drug Use - Ever used methamphetamine (%)
Health Insurance - People covered by health insurance (%)
Kidney Conditions-Urology - Avg. # of times urinating at night
Medical Conditions - People with asthma (%)
Medical Conditions - People with anemia (%)
Medical Conditions - People with psoriasis (%)
Medical Conditions - People with overweight (%)
Medical Conditions - Elderly people having difficulties in thinking or remembering (%)
Medical Conditions - People who ever received blood transfusion (%)
Medical Conditions - People having trouble seeing even with glass/contacts (%)
Medical Conditions - People with arthritis (%)
Medical Conditions - People with gout (%)
Medical Conditions - People with congestive heart failure (%)
Medical Conditions - People with coronary heart disease (%)
Medical Conditions - People with angina pectoris (%)
Medical Conditions - People who ever had heart attack (%)
Medical Conditions - People who ever had stroke (%)
Medical Conditions - People with emphysema (%)
Medical Conditions - People with thyroid problem (%)
Medical Conditions - People with chronic bronchitis (%)
Medical Conditions - People with any liver condition (%)
Medical Conditions - People who ever had cancer or malignancy (%)
Mental Health - People who have little interest in doing things (%)
Mental Health - People feeling down, depressed, or hopeless (%)
Mental Health - People who have trouble sleeping or sleeping too much (%)
Mental Health - People feeling tired or having little energy (%)
Mental Health - People with poor appetite or overeating (%)
Mental Health - People feeling bad about themself (%)
Mental Health - People who have trouble concentrating on things (%)
Mental Health - People moving or speaking slowly or too fast (%)
Mental Health - People having thoughts they would be better off dead (%)
Oral Health - Average years since last visit a dentist
Oral Health - People embarrassed because of mouth (%)
Oral Health - People with gum disease (%)
Oral Health - General health of teeth and gums (%)
Oral Health - Average days a week using dental floss/device
Oral Health - Average days a week using mouthwash for dental problem
Oral Health - Average number of teeth
Pesticide Use - Households using pesticides to control insects (%)
Pesticide Use - Households using pesticides to kill weeds (%)
Physical Activity - People doing vigorous-intensity work activities (%)
Physical Activity - People doing moderate-intensity work activities (%)
Physical Activity - People walking or bicycling (%)
Physical Activity - People doing vigorous-intensity recreational activities (%)
Physical Activity - People doing moderate-intensity recreational activities (%)
Physical Activity - Average hours a day doing sedentary activities
Physical Activity - Average hours a day watching TV or videos
Physical Activity - Average hours a day using computer
Physical Functioning - People having limitations keeping them from working (%)
Physical Functioning - People limited in amount of work they can do (%)
Physical Functioning - People that need special equipment to walk (%)
Physical Functioning - People experiencing confusion/memory problems (%)
Physical Functioning - People requiring special healthcare equipment (%)
Prescription Medications - Average number of prescription medicines taking
Preventive Aspirin Use - Adults 40+ taking low-dose aspirin (%)
Reproductive Health - Vaginal deliveries (%)
Reproductive Health - Cesarean deliveries (%)
Reproductive Health - Deliveries resulted in a live birth (%)
Reproductive Health - Pregnancies resulted in a delivery (%)
Reproductive Health - Women breastfeeding newborns (%)
Reproductive Health - Women that had a hysterectomy (%)
Reproductive Health - Women that had both ovaries removed (%)
Reproductive Health - Women that have ever taken birth control pills (%)
Reproductive Health - Women taking birth control pills (%)
Reproductive Health - Women that have ever used Depo-Provera or injectables (%)
Reproductive Health - Women that have ever used female hormones (%)
Sexual Behavior - People 18+ that ever had sex (vaginal, anal, or oral) (%)
Sexual Behavior - Males 18+ that ever had vaginal sex with a woman (%)
Sexual Behavior - Males 18+ that ever performed oral sex on a woman (%)
Sexual Behavior - Males 18+ that ever had anal sex with a woman (%)
Sexual Behavior - Males 18+ that ever had any sex with a man (%)
Sexual Behavior - Females 18+ that ever had vaginal sex with a man (%)
Sexual Behavior - Females 18+ that ever performed oral sex on a man (%)
Sexual Behavior - Females 18+ that ever had anal sex with a man (%)
Sexual Behavior - Females 18+ that ever had any kind of sex with a woman (%)
Sexual Behavior - Average age people first had sex
Sexual Behavior - Average number of female sex partners in lifetime (males 18+)
Sexual Behavior - Average number of female vaginal sex partners in lifetime (males 18+)
Sexual Behavior - Average age people first performed oral sex on a woman (18+)
Sexual Behavior - Average number of woman performed oral sex on in lifetime (18+)
Sexual Behavior - Average number of male sex partners in lifetime (males 18+)
Sexual Behavior - Average number of male anal sex partners in lifetime (males 18+)
Sexual Behavior - Average age people first performed oral sex on a man (18+)
Sexual Behavior - Average number of male oral sex partners in lifetime (18+)
Sexual Behavior - People using protection when performing oral sex (%)
Sexual Behavior - Average number of times people have vaginal or anal sex a year
Sexual Behavior - People having sex without condom (%)
Sexual Behavior - Average number of male sex partners in lifetime (females 18+)
Sexual Behavior - Average number of male vaginal sex partners in lifetime (females 18+)
Sexual Behavior - Average number of female sex partners in lifetime (females 18+)
Sexual Behavior - Circumcised males 18+ (%)
Sleep Disorders - Average hours sleeping at night
Sleep Disorders - People that has trouble sleeping (%)
Smoking-Cigarette Use - People smoking cigarettes (%)
Taste & Smell - People 40+ having problems with smell (%)
Taste & Smell - People 40+ having problems with taste (%)
Taste & Smell - People 40+ that ever had wisdom teeth removed (%)
Taste & Smell - People 40+ that ever had tonsils teeth removed (%)
Taste & Smell - People 40+ that ever had a loss of consciousness because of a head injury (%)
Taste & Smell - People 40+ that ever had a broken nose or other serious injury to face or skull (%)
Taste & Smell - People 40+ that ever had two or more sinus infections (%)
Weight - Average height (inches)
Weight - Average weight (pounds)
Weight - Average BMI
Weight - People that are obese (%)
Weight - People that ever were obese (%)
Weight - People trying to lose weight (%)
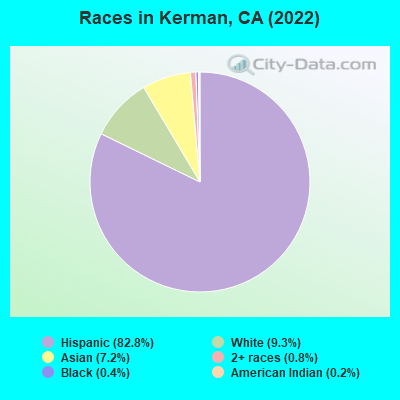
13,327 82.8% Hispanic 1,496 9.3% White alone 1,163 7.2% Asian alone 132 0.8% Two or more races 70 0.4% Black alone 34 0.2% American Indian alone
Officers per 1,000 residents here:
1.42California average:
2.30
Latest news from Kerman, CA collected exclusively by city-data.com from local newspapers, TV, and radio stations
Ancestries: German (1.3%).
Current Local Time:
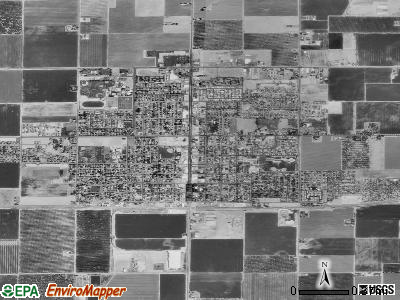
Land area: 2.16 square miles.
Population density: 7,489 people per square mile (high).
4,348 residents are foreign born (23.7% Latin America , 3.3% Asia ).
This city:
27.0%California:
26.5%
Median real estate property taxes paid for housing units with mortgages in 2022: $2,509 (0.7%)Median real estate property taxes paid for housing units with no mortgage in 2022: $1,326 (0.5%)
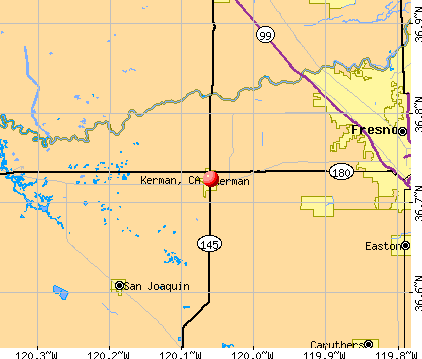
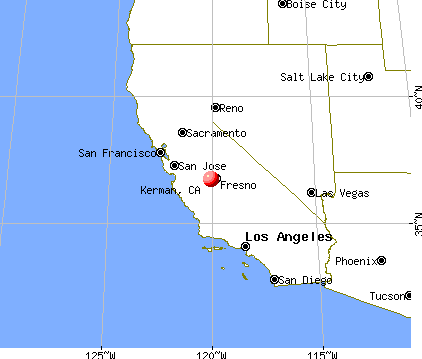
Nearest city with pop. 50,000+: Fresno, CA
Nearest city with pop. 1,000,000+: Los Angeles, CA
Nearest cities:
Raisin City, CA (3.5 miles),
Latitude: 36.73 N, Longitude: 120.06 W
Daytime population change due to commuting: -1,750 (-10.9%)Workers who live and work in this city: 1,656 (26.7%)
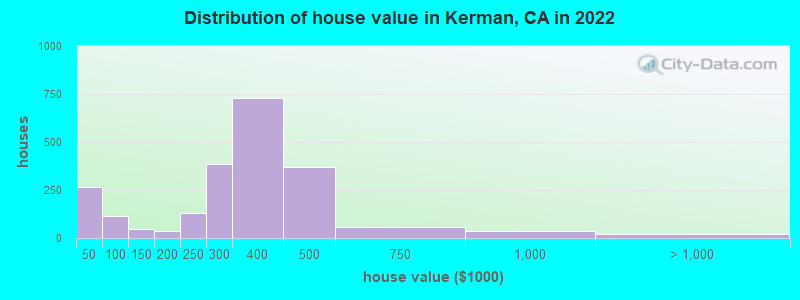
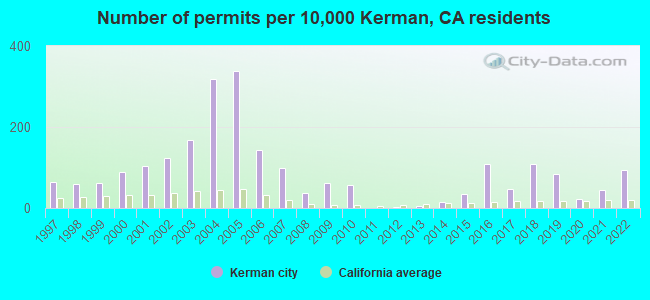
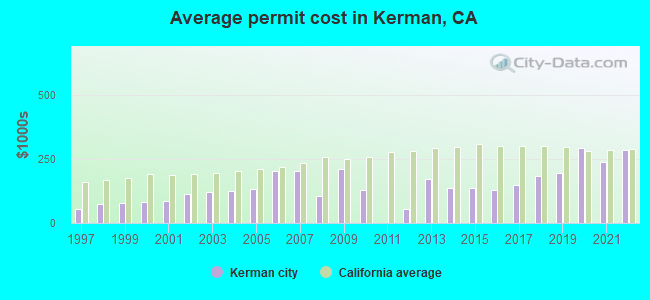
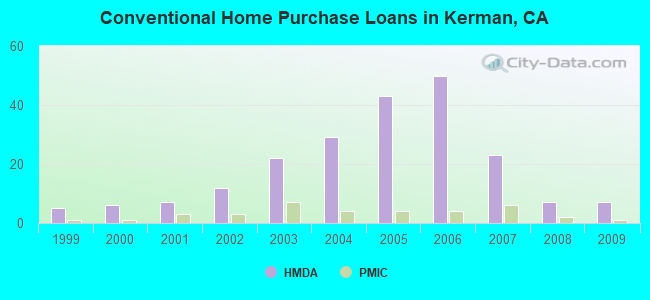
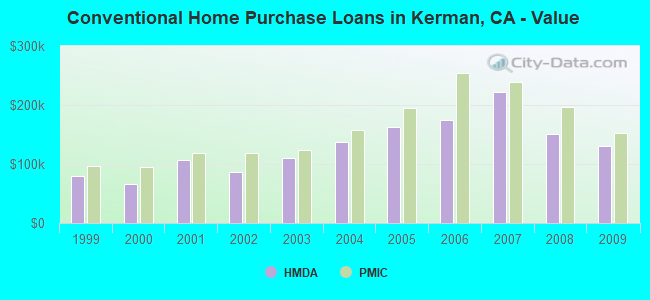
Property values in Kerman, CA
Single-family new house construction building permits:
2022: 81 buildings , average cost: $285,7002021: 38 buildings , average cost: $238,9002020: 20 buildings , average cost: $293,6002019: 71 buildings , average cost: $194,6002018: 92 buildings , average cost: $182,8002017: 41 buildings , average cost: $148,6002016: 92 buildings , average cost: $130,5002015: 30 buildings , average cost: $136,8002014: 12 buildings , average cost: $136,9002013: 5 buildings , average cost: $171,2002012: 2 buildings , average cost: $54,8002010: 48 buildings , average cost: $128,9002009: 52 buildings , average cost: $212,2002008: 31 buildings , average cost: $106,4002007: 84 buildings , average cost: $203,8002006: 123 buildings , average cost: $203,8002005: 290 buildings , average cost: $132,9002004: 272 buildings , average cost: $124,9002003: 143 buildings , average cost: $121,0002002: 105 buildings , average cost: $111,6002001: 89 buildings , average cost: $86,1002000: 75 buildings , average cost: $81,4001999: 52 buildings , average cost: $78,0001998: 51 buildings , average cost: $76,4001997: 55 buildings , average cost: $56,400Unemployment in December 2023:
Population change in the 1990s: +2,778 (+48.1%).
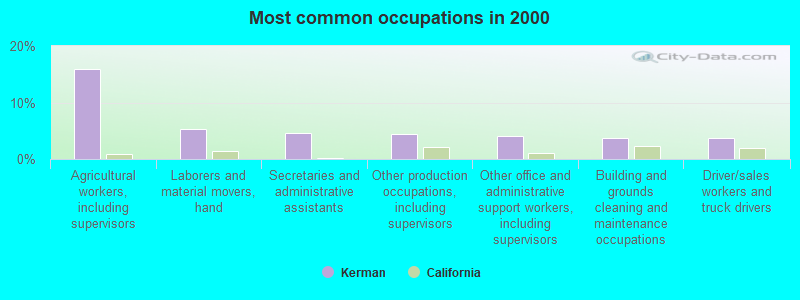
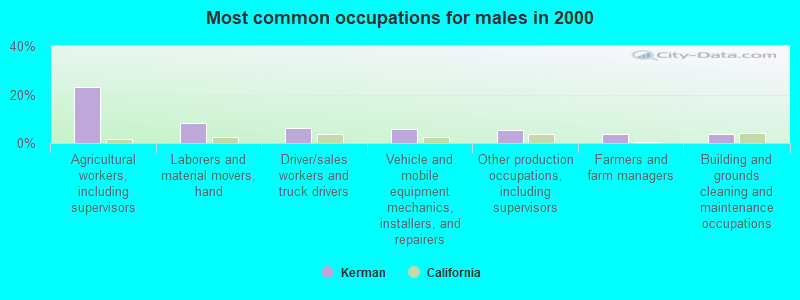
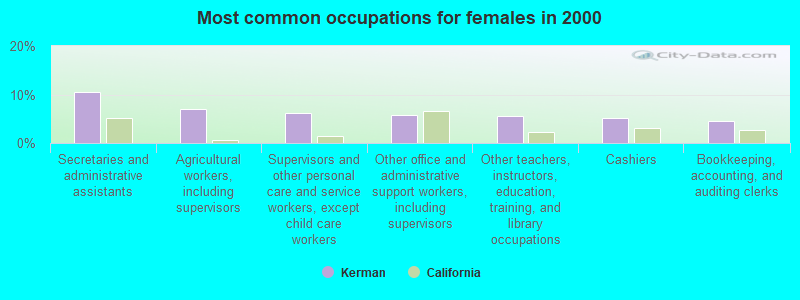
Most common occupations in Kerman, CA (%)
Both Males Females
Agricultural workers, including supervisors (15.9%)
Laborers and material movers, hand (5.4%)
Secretaries and administrative assistants (4.7%)
Other production occupations, including supervisors (4.4%)
Other office and administrative support workers, including supervisors (4.0%)
Building and grounds cleaning and maintenance occupations (3.8%)
Driver/sales workers and truck drivers (3.7%)
Agricultural workers, including supervisors (23.0%)
Laborers and material movers, hand (8.1%)
Driver/sales workers and truck drivers (6.1%)
Vehicle and mobile equipment mechanics, installers, and repairers (5.6%)
Other production occupations, including supervisors (5.5%)
Farmers and farm managers (3.7%)
Building and grounds cleaning and maintenance occupations (3.7%)
Secretaries and administrative assistants (10.6%)
Agricultural workers, including supervisors (6.9%)
Supervisors and other personal care and service workers, except child care workers (6.1%)
Other office and administrative support workers, including supervisors (5.8%)
Other teachers, instructors, education, training, and library occupations (5.6%)
Cashiers (5.1%)
Bookkeeping, accounting, and auditing clerks (4.6%)
Earthquake activity:
Kerman-area historical earthquake activity is significantly above California state average. It is 8439% greater than the overall U.S. average. On 7/21/1952 at 11:52:14, a magnitude 7.7 (7.7 UK, Class: Major, Intensity: VIII - XII) earthquake occurred 133.3 miles away from Kerman center, causing $50,000,000 total damage On 4/18/1906 at 13:12:21, a magnitude 7.9 (7.9 UK) earthquake occurred 184.1 miles away from Kerman center, causing $524,000,000 total damage On 11/4/1927 at 13:51:53, a magnitude 7.5 (7.5 UK) earthquake occurred 136.6 miles away from the city center On 10/18/1989 at 00:04:15, a magnitude 7.1 (6.5 MB, 7.1 MS, 6.9 MW, 7.0 ML) earthquake occurred 98.2 miles away from the city center, causing 62 deaths ( 62 shaking deaths) and 3757 injuries, causing $1,305,032,704 total damage On 5/2/1983 at 23:42:37, a magnitude 6.7 (6.2 MB, 6.5 MS, 6.5 MW, 6.7 ML, Class: Strong, Intensity: VII - IX) earthquake occurred 37.7 miles away from Kerman center, causing $31,000,000 total damage On 12/21/1932 at 06:10:09, a magnitude 7.2 (7.2 UK) earthquake occurred 164.1 miles away from the city center Magnitude types: body-wave magnitude (MB), local magnitude (ML), surface-wave magnitude (MS), moment magnitude (MW) Natural disasters: The number of natural disasters in Fresno County (12) is smaller than the US average (15).Major Disasters (Presidential) Declared: 8Emergencies Declared: 2Floods: 6, Storms: 4, Winter Storms: 3, Freezes: 2, Landslides: 2, Drought: 1, Fire: 1, Hurricane: 1, Other: 1 (Note: some incidents may be assigned to more than one category). Hospitals and medical centers near Kerman: GOLDEN LIVINGCENTER COUNTRY VIEW ALZHEIMERS CARE (Nursing Home, about 11 miles away; FRESNO, CA)
LOYD'S LIBERTY HOMES, INC-BRIX (Hospital, about 11 miles away; FRESNO, CA)
NEW BEGINNINGS #2 (Hospital, about 12 miles away; FRESNO, CA)
FRESNO DIALYSIS CENTER (Dialysis Facility, about 12 miles away; FRESNO, CA)
NEW BEGINNINGS #1 (Hospital, about 12 miles away; FRESNO, CA)
BONAVENTE ICF/DD-N HOME (Hospital, about 13 miles away; FRESNO, CA)
DAVIS GROUP HOMES (Hospital, about 13 miles away; FRESNO, CA)
Amtrak stations near Kerman: 16 miles: FRESNO (2650 TULARE ST.) Services: ticket office, fully wheelchair accessible, enclosed waiting area, public restrooms, public payphones, vending machines, free short-term parking, free long-term parking, call for car rental service, call for taxi service, intercity bus service, public transit connection.
18 miles: MADERA (15 1/2 & 29TH RD.) Services: partially wheelchair accessible, public payphones, free short-term parking, free long-term parking, call for taxi service.
Colleges/universities with over 2000 students nearest to Kerman:
Fresno City College (about 15 miles; Fresno, CA ; Full-time enrollment: 12,994)
Heald College-Fresno (about 17 miles; Fresno, CA ; FT enrollment: 2,199)
University of Phoenix-Central Valley Campus (about 18 miles; Fresno, CA ; FT enrollment: 2,109)
Fresno Pacific University (about 19 miles; Fresno, CA ; FT enrollment: 3,083)
California State University-Fresno (about 19 miles; Fresno, CA ; FT enrollment: 18,993)
Institute of Technology Inc (about 21 miles; Clovis, CA ; FT enrollment: 2,483)
West Hills College-Lemoore (about 33 miles; Lemoore, CA ; FT enrollment: 2,314)
Public elementary/middle school in Kerman:
See full list of schools located in Kerman User-submitted facts and corrections:
Two more radio stations are KSEQ 97.1 Q97 in FRESNO CALI and KBOS 94.9 B95 in FRESNO CALI
Birthplace of: Jason Von Flue - Karate and hand to hand combat artist, Raymond S. Wetmore - Flying ace.
Fresno County has a predicted average indoor radon screening level between 2 and 4 pCi/L (pico curies per liter) - Moderate Potential Drinking water stations with addresses in Kerman and their reported violations in the past:
SALWASSER DEHYDRATOR (Population served: 40, Groundwater):
Past monitoring violations:
7 routine major monitoring violations
2 regular monitoring violations
Average household size: This city:
3.7 peopleCalifornia:
2.9 people
Percentage of family households: This city:
84.9%Whole state:
68.7%
Percentage of households with unmarried partners: This city:
8.4%Whole state:
7.2%
Likely homosexual households (counted as self-reported same-sex unmarried-partner households)
Lesbian couples: 0.2% of all households Gay men: 0.5% of all households
5 people in residential treatment centers for juveniles (non-correctional) in 2010people in other noninstitutional facilities in 2010people in other noninstitutional group quarters in 2000
Banks with branches in Kerman (2011 data):
Central Valley Community Bank: Kerman Branch at 360 S. Madera Avenue, branch established on 2002/10/15. Info updated 2008/11/25: Bank assets: $848.4 mil, Deposits: $714.0 mil, headquarters in Fresno, CA, positive income , Commercial Lending Specialization, 17 total offices , Holding Company: Central Valley Community Bancorp
Bank of America, National Association: Kerman Branch at 702 South Madera Avenue, branch established on 1937/10/25. Info updated 2009/11/18: Bank assets: $1,451,969.3 mil, Deposits: $1,077,176.8 mil, headquarters in Charlotte, NC, positive income , 5782 total offices , Holding Company: Bank Of America Corporation
Westamerica Bank: Kerman Branch at 306 South Madera Avenue, branch established on 1967/07/03. Info updated 2011/06/21: Bank assets: $4,998.1 mil, Deposits: $4,253.2 mil, headquarters in San Rafael, CA, positive income , Commercial Lending Specialization, 98 total offices , Holding Company: Westamerica Bancorporation
Citibank, National Association: South Madera Ave Branch at 437 South Madera Ave, branch established on 1919/01/01. Info updated 2012/01/10: Bank assets: $1,288,658.0 mil, Deposits: $882,541.0 mil, headquarters in Sioux Falls, SD, positive income , International Specialization, 1048 total offices , Holding Company: Citigroup Inc.
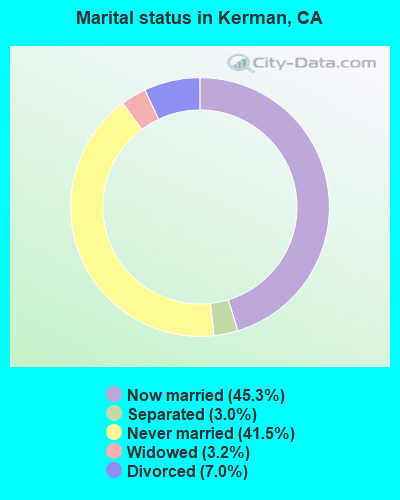
For population 15 years and over in Kerman:
Never married: 41.5%Now married: 45.3%Separated: 3.0%Widowed: 3.2%Divorced: 7.0% For population 25 years and over in Kerman:
High school or higher: 57.9%Bachelor's degree or higher: 13.2%Graduate or professional degree: 2.7%Unemployed: 15.0%Mean travel time to work (commute): 24.3 minutes
Education Gini index (Inequality in education) Here:
23.5California average:
15.5
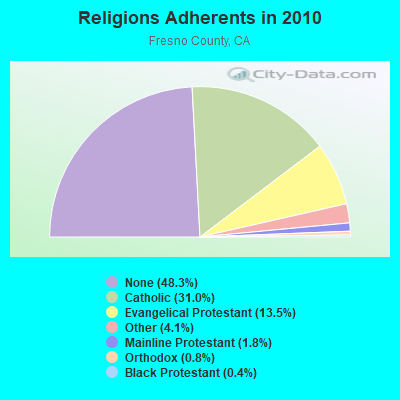
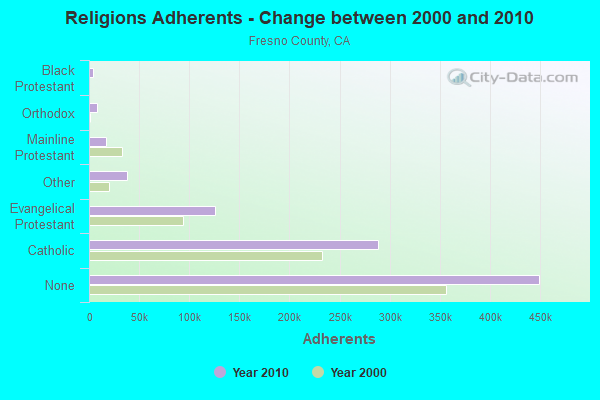
Religion statistics for Kerman, CA (based on Fresno County data)
Religion Adherents Congregations Catholic 288,324 43 Evangelical Protestant 126,004 463 Other 37,977 95 Mainline Protestant 16,843 70 Orthodox 7,768 9 Black Protestant 4,160 21 None 449,374 -
Source: Clifford Grammich, Kirk Hadaway, Richard Houseal, Dale E.Jones, Alexei Krindatch, Richie Stanley and Richard H.Taylor. 2012. 2010 U.S.Religion Census: Religious Congregations & Membership Study. Association of Statisticians of American Religious Bodies. Jones, Dale E., et al. 2002. Congregations and Membership in the United States 2000. Nashville, TN: Glenmary Research Center. Graphs represent county-level data
Food Environment Statistics: Number of grocery stores : 215Fresno County :
2.40 / 10,000 pop.California :
2.14 / 10,000 pop.
Number of supercenters and club stores : 4Fresno County :
0.04 / 10,000 pop.California :
0.04 / 10,000 pop.
Number of convenience stores (no gas) : 108Fresno County :
1.21 / 10,000 pop.California :
0.62 / 10,000 pop.
Number of convenience stores (with gas) : 190Here :
2.12 / 10,000 pop.California :
1.49 / 10,000 pop.
Number of full-service restaurants : 516Fresno County :
5.77 / 10,000 pop.State :
7.42 / 10,000 pop.
Adult diabetes rate : Fresno County :
7.6%State :
7.3%
Adult obesity rate : Fresno County :
26.4%California :
21.3%
Low-income preschool obesity rate : Fresno County :
17.5%California :
17.9%
Health and Nutrition:
Average overall health of teeth and gums : Kerman:
44.1%California:
48.0%
People feeling badly about themselves : People not drinking alcohol at all : This city:
11.7%California:
11.2%
Average hours sleeping at night : Overweight people : Kerman:
29.4%California:
31.5%
General health condition : This city:
52.4%State:
56.4%
Average condition of hearing : Here:
80.7%California:
80.9%
More about Health and Nutrition of Kerman, CA Residents
Local government employment and payroll (March 2022)
Function
Full-time employees
Monthly full-time payroll
Average yearly full-time wage
Part-time employees
Monthly part-time payroll
Police Protection - Officers
25 $144,776 $69,492 2 $4,188 Streets and Highways
11 $43,875 $47,864 3 $8,253 Other Government Administration
8 $58,246 $87,369 12 $4,207 Parks and Recreation
7 $32,960 $56,503 14 $12,921 Financial Administration
5 $31,401 $75,362 0 $0 Police - Other
4 $15,994 $47,982 1 $1,701 Water Supply
3 $12,895 $51,580 0 $0 Health
2 $5,954 $35,724 0 $0 Sewerage
2 $12,895 $77,370 0 $0 Other and Unallocable
2 $9,852 $59,112 1 $1,275 Natural Resources
1 $7,097 $85,164 0 $0
Totals for Government
70 $375,947 $64,448 33 $32,545
Kerman government finances - Expenditure in 2017 (per resident):
Construction - Sewerage: $834,000 ($51.46)
Regular Highways: $539,000 ($33.26)Water Utilities: $144,000 ($8.88)Housing and Community Development: $137,000 ($8.45)Current Operations - Police Protection: $2,747,000 ($169.48)
Regular Highways: $1,147,000 ($70.77)Water Utilities: $1,086,000 ($67.00)Solid Waste Management: $1,049,000 ($64.72)Sewerage: $894,000 ($55.16)Parks and Recreation: $768,000 ($47.38)Central Staff Services: $755,000 ($46.58)Financial Administration: $444,000 ($27.39)Health - Other: $46,000 ($2.84)Protective Inspection and Regulation - Other: $30,000 ($1.85)General - Interest on Debt: $517,000 ($31.90)
Other Capital Outlay - Housing and Community Development: $9,000 ($0.56)
Kerman government finances - Revenue in 2017 (per resident):
Charges - Sewerage: $1,694,000 ($104.52)
Solid Waste Management: $1,174,000 ($72.43)Other: $381,000 ($23.51)Regular Highways: $213,000 ($13.14)Parks and Recreation: $14,000 ($0.86)Federal Intergovernmental - Other: $1,290,000 ($79.59)
Housing and Community Development: $67,000 ($4.13)Local Intergovernmental - Other: $5,000 ($0.31)
Miscellaneous - General Revenue - Other: $696,000 ($42.94)
Special Assessments: $405,000 ($24.99)Rents: $388,000 ($23.94)Interest Earnings: $53,000 ($3.27)Fines and Forfeits: $49,000 ($3.02)Revenue - Water Utilities: $1,593,000 ($98.28)
State Intergovernmental - Other: $773,000 ($47.69)
Highways: $270,000 ($16.66)General Local Government Support: $7,000 ($0.43)Tax - General Sales and Gross Receipts: $2,737,000 ($168.87)
Property: $1,876,000 ($115.75)Other License: $202,000 ($12.46)Public Utilities Sales: $114,000 ($7.03)Occupation and Business License - Other: $65,000 ($4.01)Documentary and Stock Transfer: $25,000 ($1.54)
Kerman government finances - Debt in 2017 (per resident):
Long Term Debt - Beginning Outstanding - Unspecified Public Purpose: $12,941,000 ($798.43)
Outstanding Unspecified Public Purpose: $12,287,000 ($758.08)Retired Unspecified Public Purpose: $654,000 ($40.35)
Kerman government finances - Cash and Securities in 2017 (per resident):
Bond Funds - Cash and Securities: $1,316,000 ($81.19)
Other Funds - Cash and Securities: $7,898,000 ($487.29)
3.57% of this county's 2021 resident taxpayers lived in other counties in 2020 ($51,894 average adjusted gross income )
Here:
3.57%California average:
5.19%
0.01% of residents moved from foreign countries ($87 average AGI )Fresno County:
0.01%California average:
0.03%
Top counties from which taxpayers relocated into this county between 2020 and 2021:
3.88% of this county's 2020 resident taxpayers moved to other counties in 2021 ($61,665 average adjusted gross income )
Here:
3.88%California average:
6.14%
0.01% of residents moved to foreign countries ($93 average AGI )Fresno County:
0.01%California average:
0.02%
Top counties to which taxpayers relocated from this county between 2020 and 2021:
Businesses in Kerman, CA
Name Count Name Count
AutoZone 1 H&R Block 1 Burger King 1 KFC 1 CVS 1 McDonald's 1 Carl\s Jr. 1 Payless 1 Chevrolet 1 Rite Aid 1 Cricket Wireless 1 Subway 1 FedEx 1 U-Haul 1 GNC 1 UPS 1
Strongest AM radio stations in Kerman:
KXEX (1550 AM; 10 kW; FRESNO, CA; Owner: RAK COMMUNICATIONS, INC.)
KAVT (1680 AM; 10 kW; FRESNO, CA; Owner: RAK COMMUNICATIONS, INC.)
KMJ (580 AM; 50 kW; FRESNO, CA; Owner: INFINITY RADIO OPERATIONS INC.)
KIRV (1510 AM; daytime; 10 kW; FRESNO, CA; Owner: GORE-OVERGAARD BROADCASTING, INC)
KWRU (940 AM; 50 kW; FRESNO, CA)
KOOR (790 AM; 10 kW; CLOVIS, CA; Owner: INFINITY RADIO OPERATIONS INC.)
KGST (1600 AM; 5 kW; FRESNO, CA; Owner: LOTUS COMMUNICATIONS CORP.)
KYNO (1300 AM; 5 kW; FRESNO, CA; Owner: SPANISH CATHOLIC RADIO OF FRESNO, LLC)
KCBC (770 AM; 50 kW; RIVERBANK, CA; Owner: KIERTRON, INC.)
KFIG (1430 AM; 5 kW; FRESNO, CA; Owner: BIG DAWG BROADCASTING, LLC)
KERI (1180 AM; 50 kW; WASCO-GREENACRES, CA; Owner: KWSO, INC.)
KGDP (660 AM; 50 kW; ORCUTT, CA; Owner: RADIO REPRESENTATIVES, INC.)
KNBR (680 AM; 50 kW; SAN FRANCISCO, CA; Owner: KNBR LICO, INC.)
Strongest FM radio stations in Kerman:
KOKO-FM (94.3 FM; KERMAN, CA; Owner: BIG BROADCASTING, INC)
KMGV (97.9 FM; FRESNO, CA; Owner: INFINITY RADIO OPERATIONS INC.)
KBHH (95.3 FM; KERMAN, CA; Owner: FARMWORKER EDUCATIONAL RADIO NETWORK, INC.)
K217EQ (91.3 FM; COALINGA, CA; Owner: CALVARY CHAPEL OF TWIN FALLS, INC.)
K203AQ (88.5 FM; HELM, ETC., CA; Owner: FAMILY STATIONS, INC.)
KDKL (88.3 FM; COALINGA, CA; Owner: EDUCATIONAL MEDIA FOUNDATION)
KMAK (100.3 FM; ORANGE COVE, CA; Owner: RICHARD B. SMITH)
KHTN (104.7 FM; LOS BANOS, CA; Owner: BUCKLEY COMMUNICATIONS, INC.)
K203CM (88.5 FM; SANGER, CA; Owner: EDUCATIONAL MEDIA FOUNDATION)
KFNO (90.3 FM; FRESNO, CA; Owner: FAMILY STATIONS, INC.)
KLBN (105.1 FM; AUBERRY, CA; Owner: LOTUS COMMUNICATIONS CORP.)
KZFO (92.1 FM; CLOVIS, CA; Owner: ENTRAVISION HOLDINGS, LLC)
KRNC (105.9 FM; FRESNO, CA; Owner: INFINITY RADIO OPERATIONS INC.)
KOQO-FM (101.9 FM; FRESNO, CA; Owner: INFINITY RADIO OPERATIONS INC.)
KMMM (107.1 FM; MADERA, CA; Owner: ILLINOIS LOTUS CORP)
KSKS (93.7 FM; FRESNO, CA; Owner: INFINITY RADIO OPERATIONS INC.)
KFCF (88.1 FM; FRESNO, CA; Owner: FRESNO FREE COLLEGE FOUNDATION)
KVPR (89.3 FM; FRESNO, CA; Owner: WHITE ASH BROADCASTING, INC.)
KWYE (101.1 FM; FRESNO, CA; Owner: INFINITY RADIO OPERATIONS INC.)
KAMB (101.5 FM; MERCED, CA; Owner: CENTRAL VALLEY BROADCASTING CO. INC.)
TV broadcast stations around Kerman:
K02OH (Channel 2; FRESNO, CA; Owner: W. R. PORTEE AND LORRAINE PORTEE)
KVHF-LP (Channel 4; FRESNO, CA; Owner: GARY M. COCOLA FAMILY TRUST, GARY M. COCOLA TRUSTEE)
National Bridge Inventory (NBI) Statistics 2 Number of bridges3ft / 1.4m Total length600 Total average daily traffic80 Total average daily truck traffic417 Total future (year 2040) average daily traffic
Home Mortgage Disclosure Act Aggregated Statistics For Year 2009(Based on 1 partial tract) A) FHA, FSA/RHS & VA B) Conventional C) Refinancings D) Home Improvement Loans F) Non-occupant Loans on Number Average Value Number Average Value Number Average Value Number Average Value Number Average Value
LOANS ORIGINATED 12 $171,489 7 $130,181 7 $157,254 1 $33,070 2 $81,275 APPLICATIONS APPROVED, NOT ACCEPTED 2 $168,325 1 $121,780 1 $243,020 0 $0 0 $0 APPLICATIONS DENIED 3 $171,047 2 $160,885 7 $176,093 1 $35,320 1 $132,400 APPLICATIONS WITHDRAWN 2 $137,380 2 $125,100 3 $149,490 0 $0 1 $56,840 FILES CLOSED FOR INCOMPLETENESS 1 $105,180 0 $0 1 $187,250 0 $0 0 $0
Aggregated Statistics For Year 2008(Based on 1 partial tract) A) FHA, FSA/RHS & VA B) Conventional C) Refinancings D) Home Improvement Loans F) Non-occupant Loans on G) Loans On Manufactured Number Average Value Number Average Value Number Average Value Number Average Value Number Average Value Number Average Value
LOANS ORIGINATED 6 $185,810 7 $151,600 11 $152,551 1 $120,580 3 $100,663 0 $0 APPLICATIONS APPROVED, NOT ACCEPTED 1 $116,070 2 $229,610 3 $172,373 1 $8,500 1 $126,690 0 $0 APPLICATIONS DENIED 2 $207,435 4 $169,718 19 $207,419 3 $89,330 2 $80,080 1 $58,560 APPLICATIONS WITHDRAWN 1 $221,380 2 $168,920 3 $218,810 1 $82,730 1 $131,470 0 $0 FILES CLOSED FOR INCOMPLETENESS 1 $100,260 1 $218,850 3 $185,343 0 $0 0 $0 0 $0
Aggregated Statistics For Year 2007(Based on 1 partial tract) B) Conventional C) Refinancings D) Home Improvement Loans F) Non-occupant Loans on G) Loans On Manufactured Number Average Value Number Average Value Number Average Value Number Average Value Number Average Value
LOANS ORIGINATED 23 $221,949 29 $182,692 6 $79,592 4 $139,872 0 $0 APPLICATIONS APPROVED, NOT ACCEPTED 6 $189,152 14 $174,708 2 $133,000 1 $144,490 0 $0 APPLICATIONS DENIED 12 $194,828 39 $213,331 7 $117,680 4 $170,848 1 $50,460 APPLICATIONS WITHDRAWN 5 $218,296 15 $210,107 1 $159,890 2 $160,955 0 $0 FILES CLOSED FOR INCOMPLETENESS 1 $215,270 7 $206,770 0 $0 0 $0 0 $0
Aggregated Statistics For Year 2006(Based on 1 partial tract) B) Conventional C) Refinancings D) Home Improvement Loans F) Non-occupant Loans on Number Average Value Number Average Value Number Average Value Number Average Value
LOANS ORIGINATED 50 $174,350 46 $179,297 9 $133,980 7 $179,906 APPLICATIONS APPROVED, NOT ACCEPTED 12 $174,876 18 $198,314 3 $66,667 2 $229,080 APPLICATIONS DENIED 14 $178,141 35 $195,960 5 $123,504 4 $165,402 APPLICATIONS WITHDRAWN 8 $184,326 28 $190,682 2 $106,105 1 $157,500 FILES CLOSED FOR INCOMPLETENESS 2 $196,940 6 $193,622 0 $0 1 $144,750
Aggregated Statistics For Year 2005(Based on 1 partial tract) A) FHA, FSA/RHS & VA B) Conventional C) Refinancings D) Home Improvement Loans F) Non-occupant Loans on Number Average Value Number Average Value Number Average Value Number Average Value Number Average Value
LOANS ORIGINATED 1 $97,080 43 $162,118 60 $167,018 9 $102,772 6 $171,135 APPLICATIONS APPROVED, NOT ACCEPTED 0 $0 7 $144,240 10 $162,946 2 $94,355 1 $202,250 APPLICATIONS DENIED 0 $0 11 $168,584 33 $158,785 8 $92,628 3 $155,420 APPLICATIONS WITHDRAWN 0 $0 6 $176,757 31 $162,355 3 $105,353 2 $166,795 FILES CLOSED FOR INCOMPLETENESS 0 $0 2 $180,075 8 $157,301 1 $61,220 0 $0
Aggregated Statistics For Year 2004(Based on 1 partial tract) A) FHA, FSA/RHS & VA B) Conventional C) Refinancings D) Home Improvement Loans F) Non-occupant Loans on Number Average Value Number Average Value Number Average Value Number Average Value Number Average Value
LOANS ORIGINATED 4 $138,842 29 $137,251 50 $127,950 6 $77,577 5 $110,782 APPLICATIONS APPROVED, NOT ACCEPTED 0 $0 5 $148,790 14 $122,831 2 $93,625 1 $96,810 APPLICATIONS DENIED 0 $0 8 $126,890 33 $114,216 6 $84,682 1 $191,900 APPLICATIONS WITHDRAWN 0 $0 6 $130,477 27 $128,447 3 $73,307 1 $115,800 FILES CLOSED FOR INCOMPLETENESS 0 $0 1 $56,170 5 $130,250 1 $20,850 0 $0
Aggregated Statistics For Year 2003(Based on 1 partial tract) A) FHA, FSA/RHS & VA B) Conventional C) Refinancings D) Home Improvement Loans F) Non-occupant Loans on Number Average Value Number Average Value Number Average Value Number Average Value Number Average Value
LOANS ORIGINATED 8 $132,551 22 $110,073 53 $104,586 2 $26,425 5 $92,536 APPLICATIONS APPROVED, NOT ACCEPTED 0 $0 3 $107,613 10 $111,140 1 $57,900 1 $136,120 APPLICATIONS DENIED 1 $128,680 5 $92,906 22 $101,960 2 $42,830 1 $84,060 APPLICATIONS WITHDRAWN 1 $139,710 2 $94,355 17 $110,084 0 $0 1 $101,590 FILES CLOSED FOR INCOMPLETENESS 0 $0 0 $0 5 $103,266 0 $0 0 $0
Aggregated Statistics For Year 2002(Based on 1 partial tract) A) FHA, FSA/RHS & VA B) Conventional C) Refinancings D) Home Improvement Loans F) Non-occupant Loans on Number Average Value Number Average Value Number Average Value Number Average Value Number Average Value
LOANS ORIGINATED 9 $108,646 12 $86,398 23 $104,063 0 $0 2 $80,475 APPLICATIONS APPROVED, NOT ACCEPTED 0 $0 1 $50,460 4 $106,172 1 $45,020 0 $0 APPLICATIONS DENIED 1 $52,460 2 $58,235 12 $97,165 1 $28,420 1 $74,900 APPLICATIONS WITHDRAWN 0 $0 1 $156,840 12 $93,658 0 $0 0 $0 FILES CLOSED FOR INCOMPLETENESS 0 $0 1 $47,010 2 $104,445 0 $0 0 $0
Aggregated Statistics For Year 2001(Based on 1 partial tract) A) FHA, FSA/RHS & VA B) Conventional C) Refinancings D) Home Improvement Loans F) Non-occupant Loans on Number Average Value Number Average Value Number Average Value Number Average Value Number Average Value
LOANS ORIGINATED 9 $98,627 7 $106,941 20 $94,480 1 $34,790 3 $72,463 APPLICATIONS APPROVED, NOT ACCEPTED 1 $51,530 1 $110,760 3 $93,227 0 $0 0 $0 APPLICATIONS DENIED 1 $67,060 2 $134,460 12 $90,392 2 $28,020 1 $51,390 APPLICATIONS WITHDRAWN 1 $122,970 1 $62,680 11 $93,237 1 $11,690 1 $43,160 FILES CLOSED FOR INCOMPLETENESS 1 $69,450 1 $37,050 3 $81,850 0 $0 0 $0
Aggregated Statistics For Year 2000(Based on 1 partial tract) A) FHA, FSA/RHS & VA B) Conventional C) Refinancings D) Home Improvement Loans F) Non-occupant Loans on Number Average Value Number Average Value Number Average Value Number Average Value Number Average Value
LOANS ORIGINATED 10 $99,720 6 $66,400 5 $53,066 2 $17,130 1 $25,500 APPLICATIONS APPROVED, NOT ACCEPTED 1 $63,480 1 $30,150 2 $69,255 2 $25,500 0 $0 APPLICATIONS DENIED 1 $119,520 5 $60,742 9 $58,004 4 $17,430 0 $0 APPLICATIONS WITHDRAWN 1 $100,130 1 $107,970 3 $66,047 1 $34,790 0 $0 FILES CLOSED FOR INCOMPLETENESS 0 $0 0 $0 1 $119,790 0 $0 0 $0
Aggregated Statistics For Year 1999(Based on 1 partial tract) A) FHA, FSA/RHS & VA B) Conventional C) Refinancings D) Home Improvement Loans F) Non-occupant Loans on Number Average Value Number Average Value Number Average Value Number Average Value Number Average Value
LOANS ORIGINATED 11 $100,068 5 $79,938 10 $72,096 2 $31,650 2 $58,655 APPLICATIONS APPROVED, NOT ACCEPTED 1 $46,840 1 $46,440 3 $75,240 2 $16,920 0 $0 APPLICATIONS DENIED 1 $117,570 3 $77,763 11 $72,141 3 $25,347 1 $93,550 APPLICATIONS WITHDRAWN 1 $92,360 1 $68,080 6 $71,570 0 $0 1 $32,910 FILES CLOSED FOR INCOMPLETENESS 0 $0 0 $0 2 $75,440 0 $0 0 $0
Detailed HMDA statistics for the following Tracts:
0040.00
Private Mortgage Insurance Companies Aggregated Statistics For Year 2009(Based on 1 partial tract) A) Conventional Number Average Value
LOANS ORIGINATED 1 $152,190 APPLICATIONS APPROVED, NOT ACCEPTED 0 $0 APPLICATIONS DENIED 0 $0 APPLICATIONS WITHDRAWN 0 $0 FILES CLOSED FOR INCOMPLETENESS 0 $0
Aggregated Statistics For Year 2008(Based on 1 partial tract) A) Conventional B) Refinancings Number Average Value Number Average Value
LOANS ORIGINATED 2 $196,745 1 $145,810 APPLICATIONS APPROVED, NOT ACCEPTED 3 $221,113 1 $263,080 APPLICATIONS DENIED 0 $0 0 $0 APPLICATIONS WITHDRAWN 0 $0 0 $0 FILES CLOSED FOR INCOMPLETENESS 0 $0 0 $0
Aggregated Statistics For Year 2007(Based on 1 partial tract) A) Conventional B) Refinancings Number Average Value Number Average Value
LOANS ORIGINATED 6 $239,040 3 $195,127 APPLICATIONS APPROVED, NOT ACCEPTED 2 $321,110 1 $420,440 APPLICATIONS DENIED 0 $0 0 $0 APPLICATIONS WITHDRAWN 1 $141,300 1 $142,100 FILES CLOSED FOR INCOMPLETENESS 0 $0 0 $0
Aggregated Statistics For Year 2006(Based on 1 partial tract) A) Conventional B) Refinancings Number Average Value Number Average Value
LOANS ORIGINATED 4 $253,948 1 $221,110 APPLICATIONS APPROVED, NOT ACCEPTED 1 $316,990 0 $0 APPLICATIONS DENIED 0 $0 0 $0 APPLICATIONS WITHDRAWN 0 $0 0 $0 FILES CLOSED FOR INCOMPLETENESS 0 $0 0 $0
Aggregated Statistics For Year 2005(Based on 1 partial tract) A) Conventional B) Refinancings Number Average Value Number Average Value
LOANS ORIGINATED 4 $194,485 1 $228,680 APPLICATIONS APPROVED, NOT ACCEPTED 1 $152,060 1 $153,780 APPLICATIONS DENIED 0 $0 0 $0 APPLICATIONS WITHDRAWN 0 $0 0 $0 FILES CLOSED FOR INCOMPLETENESS 0 $0 0 $0
Aggregated Statistics For Year 2004(Based on 1 partial tract) A) Conventional B) Refinancings C) Non-occupant Loans on Number Average Value Number Average Value Number Average Value
LOANS ORIGINATED 4 $158,165 1 $223,500 1 $85,520 APPLICATIONS APPROVED, NOT ACCEPTED 2 $180,410 1 $126,430 0 $0 APPLICATIONS DENIED 0 $0 0 $0 0 $0 APPLICATIONS WITHDRAWN 0 $0 0 $0 0 $0 FILES CLOSED FOR INCOMPLETENESS 0 $0 0 $0 0 $0
Aggregated Statistics For Year 2003(Based on 1 partial tract) A) Conventional B) Refinancings C) Non-occupant Loans on Number Average Value Number Average Value Number Average Value
LOANS ORIGINATED 7 $122,916 4 $113,810 1 $53,780 APPLICATIONS APPROVED, NOT ACCEPTED 1 $75,030 1 $85,790 0 $0 APPLICATIONS DENIED 0 $0 0 $0 0 $0 APPLICATIONS WITHDRAWN 0 $0 0 $0 0 $0 FILES CLOSED FOR INCOMPLETENESS 0 $0 0 $0 0 $0
Aggregated Statistics For Year 2002(Based on 1 partial tract) A) Conventional B) Refinancings C) Non-occupant Loans on Number Average Value Number Average Value Number Average Value
LOANS ORIGINATED 3 $119,387 2 $132,800 1 $46,750 APPLICATIONS APPROVED, NOT ACCEPTED 0 $0 0 $0 0 $0 APPLICATIONS DENIED 0 $0 0 $0 0 $0 APPLICATIONS WITHDRAWN 0 $0 0 $0 0 $0 FILES CLOSED FOR INCOMPLETENESS 0 $0 0 $0 0 $0
Aggregated Statistics For Year 2001(Based on 1 partial tract) A) Conventional B) Refinancings Number Average Value Number Average Value
LOANS ORIGINATED 3 $118,103 1 $142,630 APPLICATIONS APPROVED, NOT ACCEPTED 0 $0 0 $0 APPLICATIONS DENIED 0 $0 0 $0 APPLICATIONS WITHDRAWN 0 $0 0 $0 FILES CLOSED FOR INCOMPLETENESS 0 $0 0 $0
Aggregated Statistics For Year 2000(Based on 1 partial tract) A) Conventional Number Average Value
LOANS ORIGINATED 1 $94,820 APPLICATIONS APPROVED, NOT ACCEPTED 0 $0 APPLICATIONS DENIED 0 $0 APPLICATIONS WITHDRAWN 0 $0 FILES CLOSED FOR INCOMPLETENESS 0 $0
Aggregated Statistics For Year 1999(Based on 1 partial tract) A) Conventional B) Refinancings Number Average Value Number Average Value
LOANS ORIGINATED 1 $96,210 1 $94,350 APPLICATIONS APPROVED, NOT ACCEPTED 0 $0 0 $0 APPLICATIONS DENIED 0 $0 0 $0 APPLICATIONS WITHDRAWN 0 $0 0 $0 FILES CLOSED FOR INCOMPLETENESS 0 $0 0 $0
Detailed PMIC statistics for the following Tracts:
0040.00
Most common first names in Kerman, CA among deceased individuals Name Count Lived (average)
Mary 52 79.5 years John 49 77.0 years James 44 77.5 years William 29 74.8 years Robert 25 69.7 years Frank 25 75.0 years Manuel 25 65.9 years Joe 23 71.4 years George 23 77.7 years Maria 19 74.7 years
Most common last names in Kerman, CA among deceased individuals Last name Count Lived (average)
Garcia 23 63.9 years Hernandez 20 70.6 years Brown 14 72.6 years Anderson 13 76.5 years Gonzalez 13 67.6 years Martin 13 67.3 years Perez 12 67.5 years Nazaroff 11 80.4 years Gutierrez 11 70.0 years Taylor 10 65.0 years
Kerman compared to California state average:
Median household income below state average. Median house value below state average. Black race population percentage significantly below state average. Hispanic race population percentage significantly above state average. Foreign-born population percentage above state average. Length of stay since moving in above state average. House age below state average. Percentage of population with a bachelor's degree or higher below state average.
#51 on the list of "Top 101 cities with largest percentage of males in occupations: farming, fishing, and forestry occupations (population 5,000+)"
#59 on the list of "Top 101 cities with largest percentage of males in industries: agriculture, forestry, fishing and hunting (population 5,000+)"
#76 on the list of "Top 101 cities with largest percentage of males in occupations: transportation occupations (population 5,000+)"
#83 on the list of "Top 101 cities with the lowest cost per building permit(population 5,000+)"
#90 on the list of "Top 101 cities with largest percentage of females in occupations: farming, fishing, and forestry occupations (population 5,000+)"
#5 on the list of "Top 101 counties with the highest Particulate Matter (PM2.5 ) Annual air pollution readings in 2012 (µg/m3 )"
#11 on the list of "Top 101 counties with the highest ground withdrawal of fresh water for public supply"
#15 on the list of "Top 101 counties with the highest lead air pollution readings in 2012 (µg/m3 )"
#15 on the list of "Top 101 counties with the lowest lead air pollution readings in 2012 (µg/m3 )"
#15 on the list of "Top 101 counties with the highest Particulate Matter (PM10 ) Annual air pollution readings in 2012 (µg/m3 )"
Top Patent Applicants
Lorianne Fought (3)
Kevin Andrew Carlson (2)
Kevin Carlson (1)
Peter Ramirez (1)
Total of 7 patent applications in 2008-2024.


 Recent articles from our blog. Our writers, many of them Ph.D. graduates or candidates, create easy-to-read articles on a wide variety of topics.

 (15.3 miles
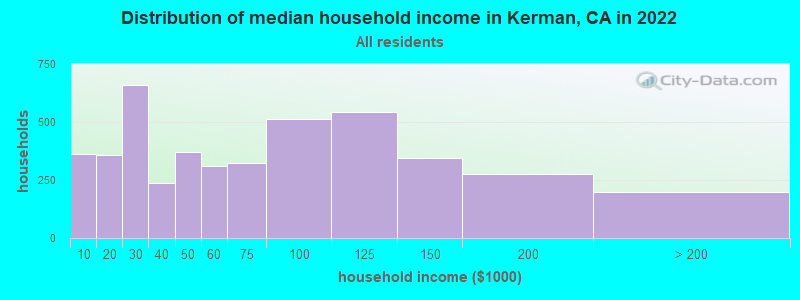


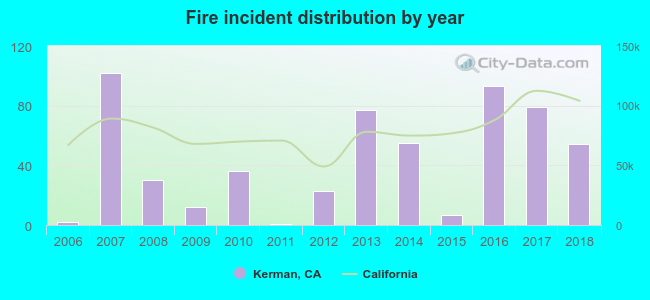 Based on the data from the years 2006 - 2018 the average number of fires per year is 44. The highest number of fire incidents - 102 took place in 2007, and the least - 1 in 2011. The data has a rising trend.
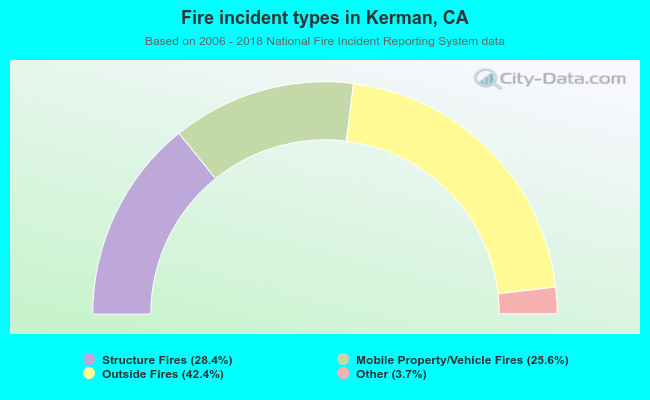 When looking into fire subcategories, the most incidents belonged to: Outside Fires (42.4%), and Structure Fires (28.4%).