Latest news from Kenhorst, PA collected exclusively by city-data.com from local newspapers, TV, and radio stations
Ancestries: German (24.6%), Irish (10.5%), Italian (8.8%), English (5.2%), Polish (4.0%), European (2.5%).
Current Local Time: EST time zone
Incorporated in 1931
Elevation: 320 feet
Land area: 0.59 square miles.
Population density: 5,082 people per square mile (average).
140 residents are foreign born (2.2% Latin America, 1.7% Europe, 0.6% Africa).
This borough:
4.7%
Pennsylvania:
7.3%
Median real estate property taxes paid for housing units with mortgages in 2022: $2,665 (1.5%) Median real estate property taxes paid for housing units with no mortgage in 2022: $3,581 (2.1%)
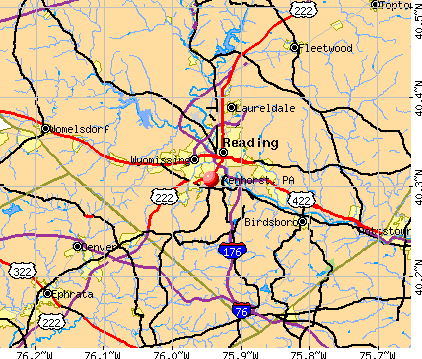
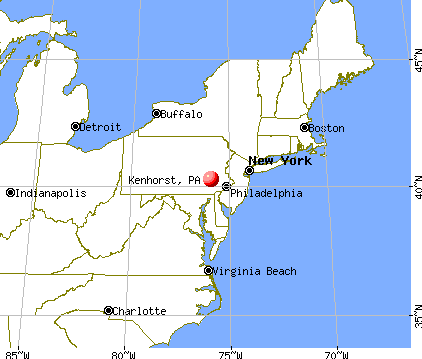
Nearest city with pop. 50,000+: Reading, PA (2.5 miles , pop. 81,207).
Nearest city with pop. 200,000+: Philadelphia, PA (47.4 miles , pop. 1,517,550).
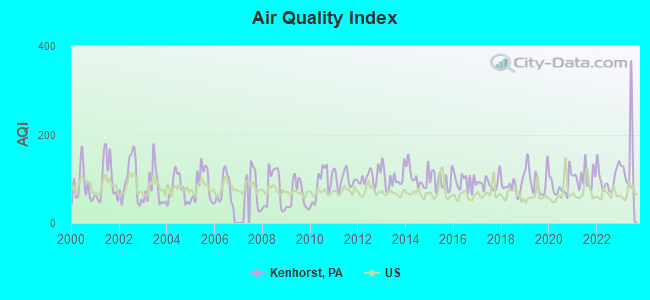
Air Quality Index (AQI) level in 2023 was 130. This is significantly worse than average.
City:
130
U.S.:
73
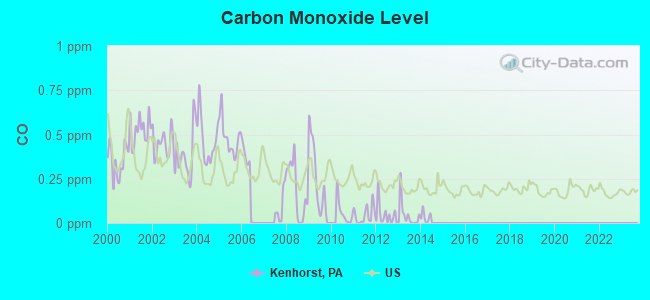
Carbon Monoxide (CO) [ppm] level in 2013 was 0.0450. This is significantly better than average.Closest monitor was 1.2 miles away from the city center.
City:
0.0450
U.S.:
0.2513
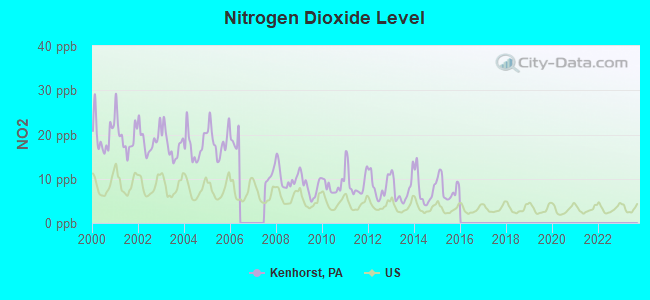
Nitrogen Dioxide (NO2) [ppb] level in 2015 was 7.80. This is significantly worse than average.Closest monitor was 1.2 miles away from the city center.
City:
7.80
U.S.:
5.11
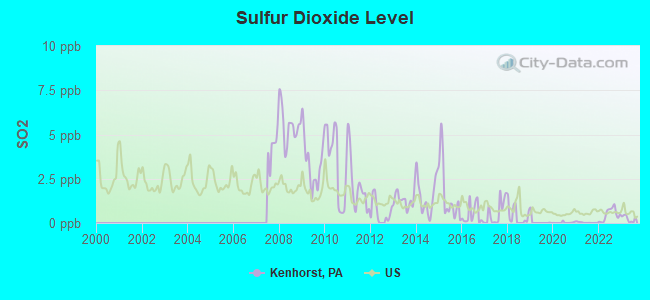
Sulfur Dioxide (SO2) [ppb] level in 2023 was 0.247. This is significantly better than average.Closest monitor was 2.1 miles away from the city center.
City:
0.247
U.S.:
1.515
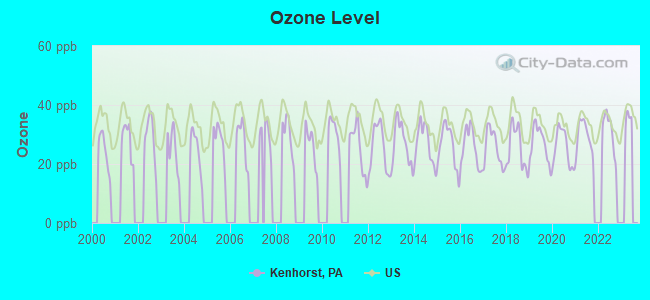
Ozone [ppb] level in 2022 was 30.9. This is about average.Closest monitor was 1.2 miles away from the city center.
City:
30.9
U.S.:
33.3
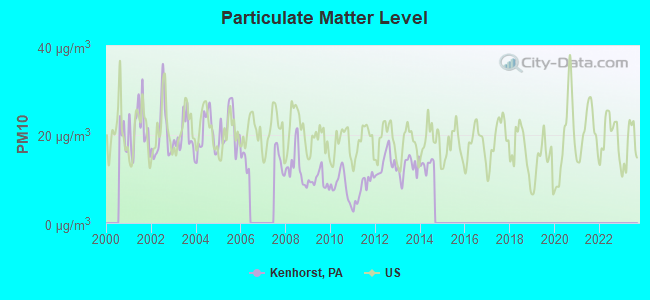
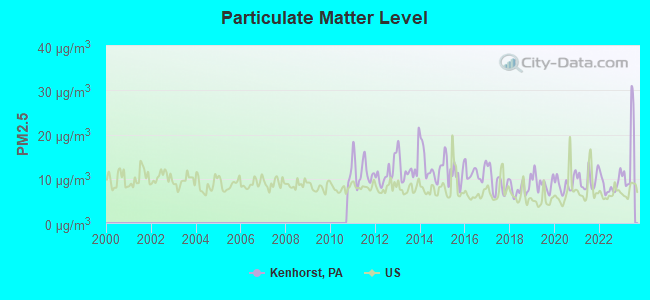
Particulate Matter (PM10) [µg/m3] level in 2014 was 13.2. This is significantly better than average.Closest monitor was 1.2 miles away from the city center.
City:
13.2
U.S.:
19.2
Particulate Matter (PM2.5) [µg/m3] level in 2023 was 15.1. This is significantly worse than average.Closest monitor was 1.2 miles away from the city center.
City:
15.1
U.S.:
8.1
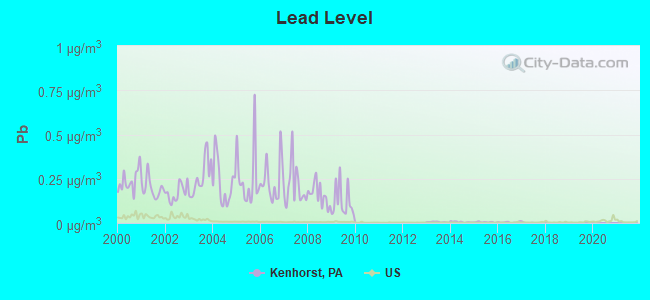
Lead (Pb) [µg/m3] level in 2016 was 0.00391. This is significantly better than average.Closest monitor was 1.3 miles away from the city center.
City:
0.00391
U.S.:
0.00931
Tornado activity:
Kenhorst-area historical tornado activity is slightly above Pennsylvania state average. It is 16% greater than the overall U.S. average.
On 11/4/1950, a category F3 (max. wind speeds 158-206 mph) tornado 6.4 miles away from the Kenhorst borough center injured one personand causedbetween $50,000 and $500,000 in damages.
On 5/31/1998, a category F3 tornado 12.1 miles away from the borough center injured 7 peopleand caused $1 million in damages.
Earthquake activity:
Kenhorst-area historical earthquake activity is significantly above Pennsylvania state average. It is 65% smaller than the overall U.S. average.
On 8/23/2011 at 17:51:04, a magnitude 5.8 (5.8 MW, Depth: 3.7 mi, Class: Moderate, Intensity: VI - VII) earthquake occurred 197.4 miles away from Kenhorst center On 1/16/1994 at 01:49:16, a magnitude 4.6 (4.6 MB, 4.6 LG, Depth: 3.1 mi, Class: Light, Intensity: IV - V) earthquake occurred 5.1 miles away from Kenhorst center On 1/16/1994 at 00:42:43, a magnitude 4.2 (4.2 MB, 4.0 LG, Depth: 3.1 mi) earthquake occurred 3.6 miles away from Kenhorst center On 10/7/1983 at 10:18:46, a magnitude 5.3 (5.1 MB, 5.3 LG, 5.1 ML) earthquake occurred 265.1 miles away from Kenhorst center On 9/25/1998 at 19:52:52, a magnitude 5.2 (4.8 MB, 4.3 MS, 5.2 LG, 4.5 MW, Depth: 3.1 mi) earthquake occurred 246.7 miles away from the city center On 4/20/2002 at 10:50:47, a magnitude 5.3 (5.3 ML, Depth: 3.0 mi) earthquake occurred 312.6 miles away from the city center Magnitude types: regional Lg-wave magnitude (LG), body-wave magnitude (MB), local magnitude (ML), surface-wave magnitude (MS), moment magnitude (MW)
Natural disasters:
The number of natural disasters in Berks County (19) is greater than the US average (15). Major Disasters (Presidential) Declared: 15 Emergencies Declared: 4
Causes of natural disasters: Floods: 5, Storms: 5, Tropical Storms: 4, Hurricanes: 3, Winter Storms: 3, Snowstorms: 2, Blizzard: 1, Heavy Rain: 1, Mudslide: 1, Snowfall: 1, Tornado: 1, Water Shortage: 1, Other: 1 (Note: some incidents may be assigned to more than one category).
Hospitals and medical centers near Kenhorst:
KINDRED TRANSITIONAL CARE AND REHABILITATION-WYOMI (Nursing Home, about 2 miles away; READING, PA)
MIFFLIN CENTER (Nursing Home, about 2 miles away; SHILLINGTON, PA)
HEALTHSOUTH READING REHAB AT HOME (Home Health Center, about 2 miles away; READING, PA)
READING NSG CTR WEST READING (Nursing Home, about 2 miles away; WEST READING, PA)
HIGHLANDS AT WYOMISSING (Nursing Home, about 2 miles away; WYOMISSING, PA)
ADVANCE HOMEHEALTH CARE (Home Health Center, about 2 miles away; READING, PA)
LEADER NSG/REHAB CTR (Nursing Home, about 3 miles away; WEST READING, PA)
Operable nuclear power plants near Kenhorst:
17 miles: Limerick 1 and 2 in Pottstown, PA.
Colleges/universities with over 2000 students nearest to Kenhorst:
Alvernia University (about 1 miles; Reading, PA; Full-time enrollment: 2,461)
Reading Area Community College (about 2 miles; Reading, PA; FT enrollment: 2,941)
Pennsylvania State University-Penn State Berks (about 4 miles; Reading, PA; FT enrollment: 2,605)
Albright College (about 5 miles; Reading, PA; FT enrollment: 2,319)
Kutztown University of Pennsylvania (about 17 miles; Kutztown, PA; FT enrollment: 9,099)
Universal Technical Institute of Pennsylvania Inc (about 22 miles; Exton, PA; FT enrollment: 2,731)
Franklin and Marshall College (about 27 miles; Lancaster, PA; FT enrollment: 2,585)
Notable locations in Kenhorst: Kenhorst Plaza (A), Clare Hall (B), Assist Hall (C), Freedom Gate Ministries (D), Anthony Hall (E), Berks County Service Center-Girl Scouts of America (F), Siena Hall (G), Kengrill Recreation Center (H), Kenhorst Borough Garage (I), Kenhorst Borough Hall (J), Kenhorst Family Medical Center (K), Kenhorst Volunteer Fire Company (L), Kenhorst Professional Center (M). Display/hide their locations on the map
Berks County has a predicted average indoor radon screening level greater than 4 pCi/L (pico curies per liter) - Highest Potential
Average household size:
This borough:
2.4 people
Pennsylvania:
2.5 people
Percentage of family households:
This borough:
65.3%
Whole state:
65.0%
Percentage of households with unmarried partners:
This borough:
7.2%
Whole state:
6.6%
Likely homosexual households (counted as self-reported same-sex unmarried-partner households)
Lesbian couples: 0.5% of all households
Gay men: 0.1% of all households
7 people in group homes intended for adults in 2010
Banks with branches in Kenhorst (2011 data):
Susquehanna Bank: Kenhorst Branch at 800 Kenhorst Plaza, branch established on 1992/09/14. Info updated 2012/02/28: Bank assets: $14,849.0 mil, Deposits: $10,294.4 mil, headquarters in Lititz, PA, positive income, Commercial Lending Specialization, 308 total offices, Holding Company: Susquehanna Bancshares, Inc.
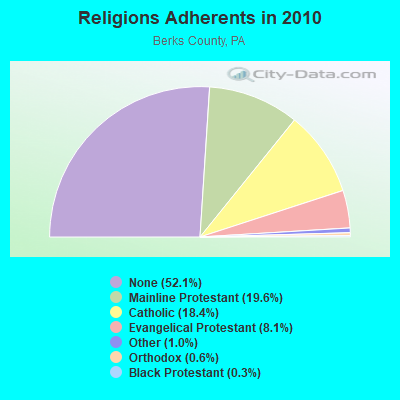
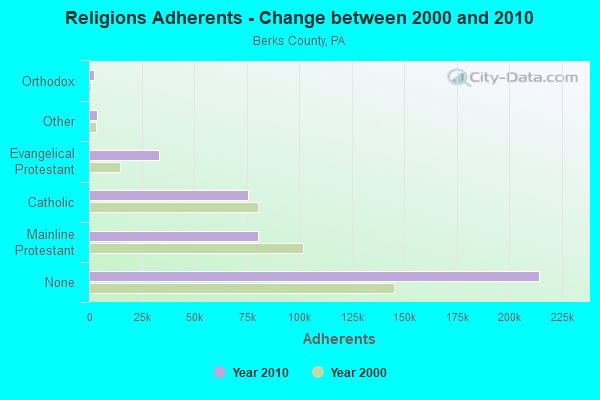
Religion statistics for Kenhorst, PA (based on Berks County data)
Religion
Adherents
Congregations
Mainline Protestant
80,575
177
Catholic
75,672
22
Evangelical Protestant
33,376
168
Other
3,996
23
Orthodox
2,275
5
Black Protestant
1,062
7
None
214,486
-
Source: Clifford Grammich, Kirk Hadaway, Richard Houseal, Dale E.Jones, Alexei Krindatch, Richie Stanley and Richard H.Taylor. 2012. 2010 U.S.Religion Census: Religious Congregations & Membership Study. Association of Statisticians of American Religious Bodies. Jones, Dale E., et al. 2002. Congregations and Membership in the United States 2000. Nashville, TN: Glenmary Research Center. Graphs represent county-level data
21,664Total future (year 2030) average daily traffic
FCC Registered Amateur Radio Licenses:
2
Call Sign: N3TJN, Licensee ID: L00324130, Grant Date: 09/14/2004, Expiration Date: 09/19/2014, Cancellation Date: 09/20/2016, Certifier: James E Showalter, Registrant: James E Showalter, 1129 Brooke Blvd, Kenhorst, PA 19607
Call Sign: KB3RFE, Licensee ID: L01400053, Grant Date: 03/30/2018, Expiration Date: 05/15/2028, Certifier: Nicholas F Briaka, Registrant: Nicholas F Briaka, 1503 Lacrosse Ave, Kenhorst, PA 19607
Home Mortgage Disclosure Act Aggregated Statistics For Year 2009 (Based on 1 full tract)
A) FHA, FSA/RHS & VA Home Purchase Loans
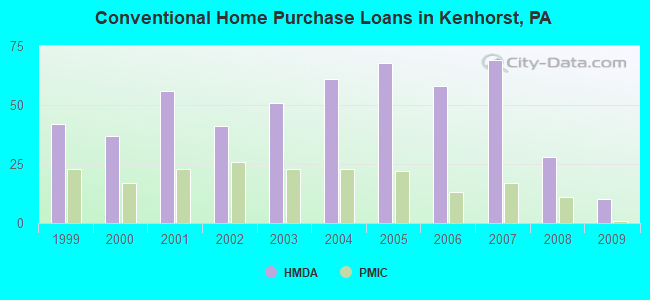
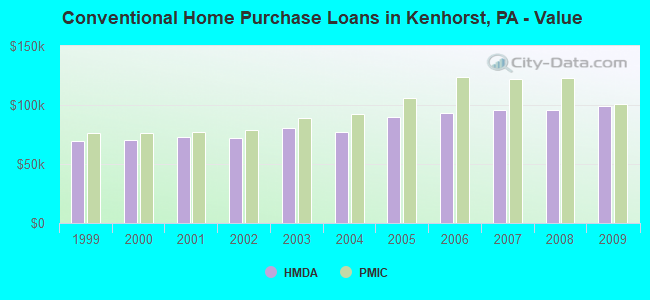
B) Conventional Home Purchase Loans
C) Refinancings
D) Home Improvement Loans
F) Non-occupant Loans on < 5 Family Dwellings (A B C & D)
Number
Average Value
Number
Average Value
Number
Average Value
Number
Average Value
Number
Average Value
LOANS ORIGINATED
36
$129,389
10
$99,100
65
$101,862
7
$47,714
1
$110,000
APPLICATIONS APPROVED, NOT ACCEPTED
1
$108,000
0
$0
8
$104,125
3
$13,667
1
$86,000
APPLICATIONS DENIED
1
$94,000
2
$99,000
21
$119,714
9
$26,889
0
$0
APPLICATIONS WITHDRAWN
2
$98,000
0
$0
20
$126,400
0
$0
0
$0
FILES CLOSED FOR INCOMPLETENESS
0
$0
0
$0
2
$108,500
0
$0
0
$0
Aggregated Statistics For Year 2008 (Based on 1 full tract)
A) FHA, FSA/RHS & VA Home Purchase Loans
B) Conventional Home Purchase Loans
C) Refinancings
D) Home Improvement Loans
F) Non-occupant Loans on < 5 Family Dwellings (A B C & D)
Number
Average Value
Number
Average Value
Number
Average Value
Number
Average Value
Number
Average Value
LOANS ORIGINATED
21
$131,048
28
$95,571
43
$98,837
16
$21,062
5
$111,400
APPLICATIONS APPROVED, NOT ACCEPTED
0
$0
3
$86,667
4
$108,000
3
$22,000
1
$90,000
APPLICATIONS DENIED
1
$124,000
6
$124,500
41
$121,854
21
$40,952
2
$139,000
APPLICATIONS WITHDRAWN
2
$151,000
1
$144,000
18
$112,667
0
$0
1
$148,000
FILES CLOSED FOR INCOMPLETENESS
0
$0
5
$119,000
4
$117,250
0
$0
0
$0
Aggregated Statistics For Year 2007 (Based on 1 full tract)
A) FHA, FSA/RHS & VA Home Purchase Loans
B) Conventional Home Purchase Loans
C) Refinancings
D) Home Improvement Loans
F) Non-occupant Loans on < 5 Family Dwellings (A B C & D)
G) Loans On Manufactured Home Dwelling (A B C & D)
Number
Average Value
Number
Average Value
Number
Average Value
Number
Average Value
Number
Average Value
Number
Average Value
LOANS ORIGINATED
2
$119,500
69
$95,391
62
$84,048
24
$39,958
14
$87,929
0
$0
APPLICATIONS APPROVED, NOT ACCEPTED
0
$0
8
$111,875
9
$101,111
2
$29,000
1
$25,000
1
$40,000
APPLICATIONS DENIED
0
$0
12
$109,000
70
$115,800
12
$76,917
0
$0
0
$0
APPLICATIONS WITHDRAWN
1
$136,000
4
$97,000
24
$101,958
3
$65,000
1
$135,000
0
$0
FILES CLOSED FOR INCOMPLETENESS
0
$0
0
$0
11
$109,455
0
$0
1
$60,000
0
$0
Aggregated Statistics For Year 2006 (Based on 1 full tract)
A) FHA, FSA/RHS & VA Home Purchase Loans
B) Conventional Home Purchase Loans
C) Refinancings
D) Home Improvement Loans
F) Non-occupant Loans on < 5 Family Dwellings (A B C & D)
Number
Average Value
Number
Average Value
Number
Average Value
Number
Average Value
Number
Average Value
LOANS ORIGINATED
12
$127,333
58
$93,431
92
$76,446
26
$30,154
8
$66,750
APPLICATIONS APPROVED, NOT ACCEPTED
2
$151,000
3
$100,667
18
$80,000
3
$18,000
4
$71,000
APPLICATIONS DENIED
0
$0
17
$98,000
63
$96,365
23
$45,652
1
$6,000
APPLICATIONS WITHDRAWN
0
$0
2
$95,000
43
$100,814
4
$68,750
0
$0
FILES CLOSED FOR INCOMPLETENESS
0
$0
1
$119,000
10
$111,400
0
$0
0
$0
Aggregated Statistics For Year 2005 (Based on 1 full tract)
A) FHA, FSA/RHS & VA Home Purchase Loans
B) Conventional Home Purchase Loans
C) Refinancings
D) Home Improvement Loans
F) Non-occupant Loans on < 5 Family Dwellings (A B C & D)
G) Loans On Manufactured Home Dwelling (A B C & D)
Number
Average Value
Number
Average Value
Number
Average Value
Number
Average Value
Number
Average Value
Number
Average Value
LOANS ORIGINATED
2
$88,000
68
$89,853
92
$77,391
28
$23,357
15
$75,333
1
$45,000
APPLICATIONS APPROVED, NOT ACCEPTED
0
$0
5
$89,600
17
$84,412
3
$37,333
0
$0
0
$0
APPLICATIONS DENIED
0
$0
8
$59,000
49
$101,163
35
$21,714
7
$78,714
1
$18,000
APPLICATIONS WITHDRAWN
0
$0
4
$76,000
58
$99,828
2
$105,500
4
$52,000
0
$0
FILES CLOSED FOR INCOMPLETENESS
1
$85,000
1
$105,000
4
$88,250
0
$0
0
$0
0
$0
Aggregated Statistics For Year 2004 (Based on 1 full tract)
A) FHA, FSA/RHS & VA Home Purchase Loans
B) Conventional Home Purchase Loans
C) Refinancings
D) Home Improvement Loans
F) Non-occupant Loans on < 5 Family Dwellings (A B C & D)
G) Loans On Manufactured Home Dwelling (A B C & D)
Number
Average Value
Number
Average Value
Number
Average Value
Number
Average Value
Number
Average Value
Number
Average Value
LOANS ORIGINATED
8
$88,375
61
$77,475
108
$76,583
18
$20,278
8
$74,875
0
$0
APPLICATIONS APPROVED, NOT ACCEPTED
0
$0
6
$68,833
30
$85,867
3
$50,333
1
$38,000
0
$0
APPLICATIONS DENIED
0
$0
8
$64,000
54
$84,685
25
$30,360
4
$29,250
3
$39,667
APPLICATIONS WITHDRAWN
0
$0
4
$73,250
55
$87,818
0
$0
0
$0
0
$0
FILES CLOSED FOR INCOMPLETENESS
0
$0
1
$90,000
8
$65,875
2
$25,000
0
$0
0
$0
Aggregated Statistics For Year 2003 (Based on 1 full tract)
A) FHA, FSA/RHS & VA Home Purchase Loans
B) Conventional Home Purchase Loans
C) Refinancings
D) Home Improvement Loans
F) Non-occupant Loans on < 5 Family Dwellings (A B C & D)
Number
Average Value
Number
Average Value
Number
Average Value
Number
Average Value
Number
Average Value
LOANS ORIGINATED
7
$92,571
51
$80,314
131
$73,473
4
$32,500
6
$59,833
APPLICATIONS APPROVED, NOT ACCEPTED
0
$0
8
$58,625
24
$82,042
0
$0
0
$0
APPLICATIONS DENIED
0
$0
3
$70,000
57
$81,158
9
$44,778
5
$77,400
APPLICATIONS WITHDRAWN
0
$0
2
$70,000
41
$99,683
2
$7,000
0
$0
FILES CLOSED FOR INCOMPLETENESS
0
$0
0
$0
6
$83,833
2
$20,500
0
$0
Aggregated Statistics For Year 2002 (Based on 1 full tract)
A) FHA, FSA/RHS & VA Home Purchase Loans
B) Conventional Home Purchase Loans
C) Refinancings
D) Home Improvement Loans
F) Non-occupant Loans on < 5 Family Dwellings (A B C & D)
Number
Average Value
Number
Average Value
Number
Average Value
Number
Average Value
Number
Average Value
LOANS ORIGINATED
15
$85,467
41
$71,707
73
$73,795
9
$18,556
5
$85,400
APPLICATIONS APPROVED, NOT ACCEPTED
0
$0
1
$66,000
22
$63,909
4
$19,750
1
$30,000
APPLICATIONS DENIED
0
$0
3
$48,667
43
$73,047
6
$44,167
3
$66,667
APPLICATIONS WITHDRAWN
0
$0
4
$98,750
34
$82,088
1
$100,000
1
$84,000
FILES CLOSED FOR INCOMPLETENESS
0
$0
2
$217,000
4
$103,750
0
$0
0
$0
Aggregated Statistics For Year 2001 (Based on 1 full tract)
A) FHA, FSA/RHS & VA Home Purchase Loans
B) Conventional Home Purchase Loans
C) Refinancings
D) Home Improvement Loans
F) Non-occupant Loans on < 5 Family Dwellings (A B C & D)
Number
Average Value
Number
Average Value
Number
Average Value
Number
Average Value
Number
Average Value
LOANS ORIGINATED
19
$78,474
56
$73,196
61
$72,607
5
$23,200
7
$68,000
APPLICATIONS APPROVED, NOT ACCEPTED
1
$129,000
6
$62,000
12
$66,083
2
$32,500
3
$66,333
APPLICATIONS DENIED
1
$86,000
8
$74,375
38
$66,737
4
$15,750
2
$94,000
APPLICATIONS WITHDRAWN
1
$92,000
2
$67,000
23
$75,870
3
$13,667
0
$0
FILES CLOSED FOR INCOMPLETENESS
0
$0
1
$58,000
5
$71,400
1
$2,000
0
$0
Aggregated Statistics For Year 2000 (Based on 1 full tract)
A) FHA, FSA/RHS & VA Home Purchase Loans
B) Conventional Home Purchase Loans
C) Refinancings
D) Home Improvement Loans
F) Non-occupant Loans on < 5 Family Dwellings (A B C & D)
Number
Average Value
Number
Average Value
Number
Average Value
Number
Average Value
Number
Average Value
LOANS ORIGINATED
23
$85,130
37
$70,162
16
$66,375
15
$14,733
4
$56,250
APPLICATIONS APPROVED, NOT ACCEPTED
0
$0
3
$42,667
6
$42,167
11
$19,636
2
$12,000
APPLICATIONS DENIED
1
$70,000
7
$65,143
33
$52,091
12
$20,500
3
$50,000
APPLICATIONS WITHDRAWN
1
$89,000
7
$55,857
27
$60,741
1
$5,000
4
$35,500
FILES CLOSED FOR INCOMPLETENESS
0
$0
0
$0
3
$94,000
0
$0
0
$0
Aggregated Statistics For Year 1999 (Based on 1 partial tract)
A) FHA, FSA/RHS & VA Home Purchase Loans
B) Conventional Home Purchase Loans
C) Refinancings
D) Home Improvement Loans
F) Non-occupant Loans on < 5 Family Dwellings (A B C & D)
Detailed PMIC statistics for the following Tracts:0113.00
2002 - 2018 National Fire Incident Reporting System (NFIRS) incidents
Based on the data from the years 2002 - 2018 the average number of fires per year is 6. The highest number of reported fires - 16 took place in 2016, and the least - 0 in 2011. The data has a growing trend.
When looking into fire subcategories, the most reports belonged to: Structure Fires (64.8%), and Outside Fires (16.2%).
Fire incident types reported to NFIRS in Kenhorst, PA
#66 on the list of "Top 101 cities with the most residents born in Romania (population 500+)"
#26 on the list of "Top 101 counties with the largest increase in the number of infant deaths per 1000 residents 2000-2006 to 2007-2013 (pop. 50,000+)"
#28 on the list of "Top 101 counties with the lowest percentage of residents relocating from other counties between 2010 and 2011 (pop. 50,000+)"
#28 on the list of "Top 101 counties with the most Mainline Protestant adherents"
#35 on the list of "Top 101 counties with the most Mainline Protestant congregations"
#40 on the list of "Top 101 counties with the lowest percentage of residents relocating to other counties in 2011 (pop. 50,000+)"


 Recent articles from our blog. Our writers, many of them Ph.D. graduates or candidates, create easy-to-read articles on a wide variety of topics.

 (2.5 miles


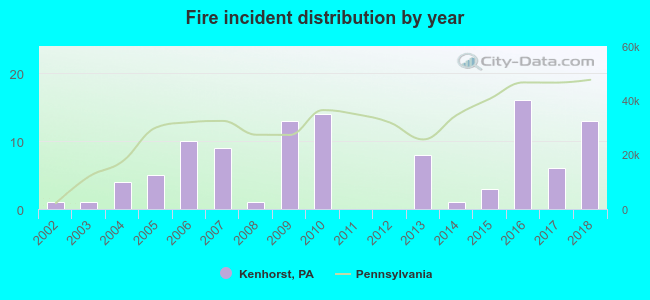 Based on the data from the years 2002 - 2018 the average number of fires per year is 6. The highest number of reported fires - 16 took place in 2016, and the least - 0 in 2011. The data has a growing trend.
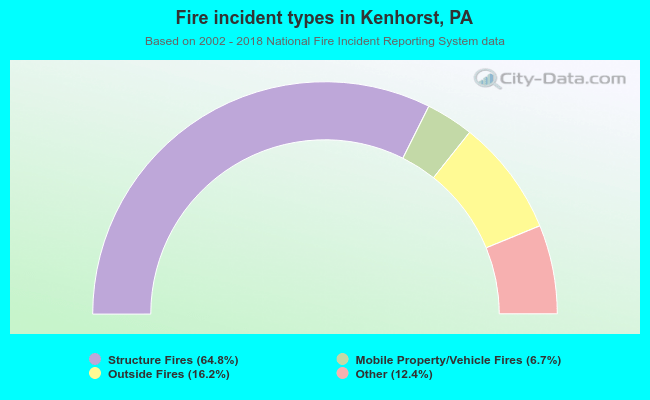 When looking into fire subcategories, the most reports belonged to: Structure Fires (64.8%), and Outside Fires (16.2%).