John Sam Lake, Washington
Submit your own pictures of this place and show them to the world
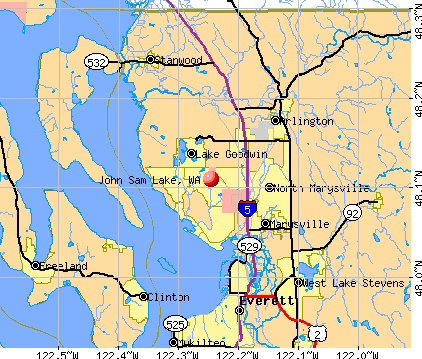
- OSM Map
- General Map
- Google Map
- MSN Map
| Males: 409 | |
| Females: 426 |
| Median resident age: | 36.7 years |
| Washington median age: | 35.3 years |
Zip codes: 98271.
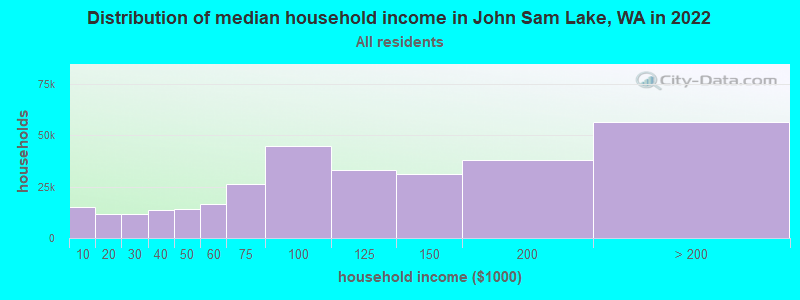
| John Sam Lake: | $100,759 |
| WA: | $91,306 |
Estimated per capita income in 2022: $43,642 (it was $19,907 in 2000)
John Sam Lake CDP income, earnings, and wages data
Estimated median house or condo value in 2022: $674,250 (it was $178,300 in 2000)
| John Sam Lake: | $674,250 |
| WA: | $569,500 |
Mean prices in 2022: all housing units: $766,619; detached houses: $825,949; townhouses or other attached units: $643,803; in 2-unit structures: $530,516; in 3-to-4-unit structures: $479,562; in 5-or-more-unit structures: $400,308; mobile homes: $303,974; occupied boats, rvs, vans, etc.: $101,172
Detailed information about poverty and poor residents in John Sam Lake, WA
Compare current foreclosures near John Sam Lake, WA:
| Photo | Address | Area | Beds / Baths | Price | Details |
|---|---|---|---|---|---|

|
#1
W Marion St
Arlington, WA 98223
|
840 sq. feet
|
1 baths 2 beds |
show details | |

|
#2
Admiralty Way Apt B104
Everett, WA 98204
|
1,278 sq. feet
|
2 baths 2 beds |
show details | |

|
#3
Grand Ave
Everett, WA 98201
|
864 sq. feet
|
1 baths 3 beds |
show details | |

|
#4
60th Ave NE
Marysville, WA 98270
|
1,396 sq. feet
|
2 baths 4 beds |
show details | |

|
#5
114th Dr NE
Lake Stevens, WA 98258
|
1,631 sq. feet
|
2 baths 3 beds |
show details | |

|
#6
Oakes Ave
Everett, WA 98201
|
1,360 sq. feet
|
1 baths 4 beds |
show details | |

|
#7
Bayview Dr
Mukilteo, WA 98275
|
2,989 sq. feet
|
2 baths 4 beds |
show details | |

|
#8
63rd Pl NE
Marysville, WA 98270
|
2,082 sq. feet
|
2 baths 4 beds |
show details | |

|
#9
Colby Ave
Everett, WA 98201
|
1,366 sq. feet
|
1 baths 1 beds |
show details | |

|
#10
E Casino Rd
Everett, WA 98203
|
988 sq. feet
|
1 baths 3 beds |
show details |
| Photo | Address | Area | Beds / Baths | Price | Details |
|---|---|---|---|---|---|

|
#11
Market Pl Unit K104
Lake Stevens, WA 98258
|
711 sq. feet
|
1 baths 1 beds |
show details | |

|
#12
State Route 9 NE
Arlington, WA 98223
|
1,404 sq. feet
|
1 baths 3 beds |
show details | |

|
#13
Lexington Ave
Everett, WA 98203
|
944 sq. feet
|
1 baths 2 beds |
show details | |

|
#14
89th St NE
Marysville, WA 98270
|
1,612 sq. feet
|
1 baths 3 beds |
show details | |

|
#15
66th Ave NW
Stanwood, WA 98292
|
1,315 sq. feet
|
2 baths 3 beds |
show details | |

|
#16
SE Camano Dr
Camano Island, WA 98282
|
1,816 sq. feet
|
1 baths 2 beds |
show details | |

|
#17
135th Pl NW
Marysville, WA 98271
|
1,404 sq. feet
|
2 baths 3 beds |
show details | |

|
#18
135th Pl NW
Marysville, WA 98271
|
1,404 sq. feet
|
2 baths 3 beds |
show details | |

|
#19
19th Dr NE
Arlington, WA 98223
|
1,877 sq. feet
|
1 baths 2 beds |
show details | |

|
#20
31st Dr SE
Everett, WA 98208
|
2,523 sq. feet
|
4 baths 4 beds |
show details |
| Photo | Address | Area | Beds / Baths | Price | Details |
|---|---|---|---|---|---|

|
#21
59th Ave SE
Snohomish, WA 98296
|
2,641 sq. feet
|
2 baths 5 beds |
show details | |

|
#22
122nd St SE
Everett, WA 98208
|
1,576 sq. feet
|
2 baths 3 beds |
show details | |

|
#23
102nd Pl NE
Marysville, WA 98270
|
1,498 sq. feet
|
2 baths 3 beds |
show details | |

|
#24
Herring Street And 4361 Douglas Street
Langley, WA 98260
|
1,191 sq. feet
|
1 baths 2 beds |
show details | |

|
#25
Cedar Ave
Marysville, WA 98270
|
- sq. feet
|
1 baths 2 beds |
show details | |

|
#26
80th St SW
Mukilteo, WA 98275
|
2,567 sq. feet
|
3 baths 4 beds |
show details | |

|
#27
177th Pl NE
Arlington, WA 98223
|
1,640 sq. feet
|
2 baths 3 beds |
show details | |

|
#28
81st Dr SE
Lake Stevens, WA 98258
|
1,196 sq. feet
|
2 baths 3 beds |
show details | |

|
#29
111th Dr NE
Lake Stevens, WA 98258
|
2,606 sq. feet
|
3 baths 4 beds |
show details | |

|
#30
110th Pl SE
Everett, WA 98208
|
1,620 sq. feet
|
3 baths 3 beds |
show details |
| Photo | Address | Area | Beds / Baths | Price | Details |
|---|---|---|---|---|---|

|
#31
268th St NW
Stanwood, WA 98292
|
1,420 sq. feet
|
4 baths 6 beds |
show details | |

|
#32
Harrison Ave
Everett, WA 98201
|
735 sq. feet
|
1 baths 2 beds |
show details | |

|
#33
Walnut St
Everett, WA 98201
|
1,908 sq. feet
|
2 baths 4 beds |
show details | |

|
#34
183rd St NW
Stanwood, WA 98292
|
1,824 sq. feet
|
2 baths 3 beds |
show details | |

|
#35
Jordan Rd
Arlington, WA 98223
|
2,609 sq. feet
|
3 baths 2 beds |
show details | |

|
#36
13th St NE
Lake Stevens, WA 98258
|
832 sq. feet
|
1 baths 3 beds |
show details | |

|
#37
155th St NE
Arlington, WA 98223
|
1,440 sq. feet
|
2 baths 2 beds |
show details | |

|
#38
78th Dr NW
Stanwood, WA 98292
|
1,072 sq. feet
|
1 baths 3 beds |
show details | |

|
#39
56th Ave NE
Marysville, WA 98270
|
1,620 sq. feet
|
2 baths 3 beds |
show details | |

|
#40
200th St NE
Arlington, WA 98223
|
1,116 sq. feet
|
2 baths 3 beds |
show details |
| Photo | Address | Area | Beds / Baths | Price | Details |
|---|---|---|---|---|---|

|
#41
N Ridge Dr
Snohomish, WA 98290
|
2,033 sq. feet
|
3 baths 3 beds |
show details | |

|
#42
Autumn Ln
Clinton, WA 98236
|
1,940 sq. feet
|
3 baths 2 beds |
show details | |

|
#43
Mcdougall Ave
Everett, WA 98201
|
1,307 sq. feet
|
1 baths 4 beds |
show details | |

|
#44
28th St NE
Lake Stevens, WA 98258
|
1,412 sq. feet
|
2 baths 3 beds |
show details | |

|
#45
74th St SE
Everett, WA 98203
|
1,784 sq. feet
|
3 baths 4 beds |
show details | |

|
#46
Tveit Rd
Arlington, WA 98223
|
1,344 sq. feet
|
2 baths 2 beds |
show details | |

|
#47
65th Dr NE
Marysville, WA 98270
|
1,008 sq. feet
|
2 baths 3 beds |
show details | |

|
#48
Mcelroy Rd
Arlington, WA 98223
|
1,824 sq. feet
|
2 baths 3 beds |
show details | |

|
#49
1st Ave SE
Everett, WA 98208
|
1,164 sq. feet
|
2 baths 3 beds |
show details | |

|
Check over 1 million property listings on Foreclosure.com!
|
browse all offers | |||

- 65286.6%White alone
- 577.6%American Indian alone
- 202.7%Two or more races
- 152.0%Hispanic
- 81.1%Asian alone
- 10.1%Native Hawaiian and Other
Pacific Islander alone
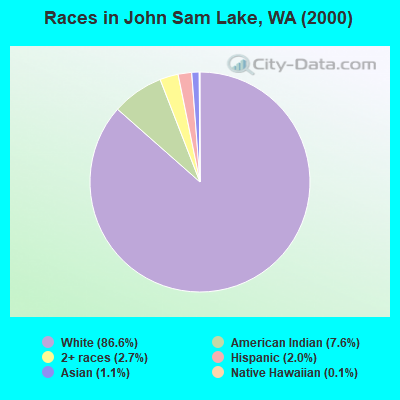
Races in John Sam Lake detailed stats: ancestries, foreign born residents, place of birth
 Recent articles from our blog. Our writers, many of them Ph.D. graduates or candidates, create easy-to-read articles on a wide variety of topics.

Latest news from John Sam Lake, WA collected exclusively by city-data.com from local newspapers, TV, and radio stations
Ancestries: German (23.2%), Irish (16.6%), English (12.0%), Norwegian (11.3%), United States (9.6%), French (5.3%).
Current Local Time: PST time zone
Land area: 4.90 square miles.
Population density: 170 people per square mile (very low).
39 residents are foreign born (1.9% Asia, 1.7% Europe, 1.6% North America).
| This place: | 5.2% |
| Washington: | 10.4% |
| John Sam Lake CDP: | 1.1% ($1,927) |
| Washington: | 1.2% ($1,915) |
Nearest city with pop. 50,000+: Everett, WA  (10.3 miles , pop. 91,488).
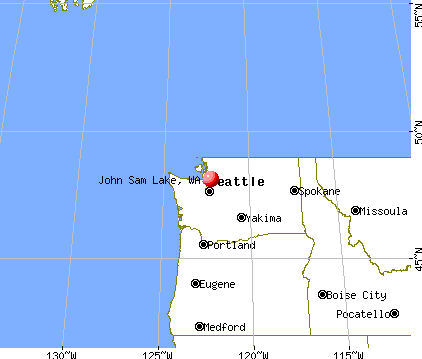
Nearest city with pop. 200,000+: Seattle, WA (33.6 miles , pop. 563,374).
Nearest city with pop. 1,000,000+: Los Angeles, CA (990.4 miles , pop. 3,694,820).
Nearest cities:
), ), ), ), )Latitude: 48.11 N, Longitude: 122.25 W
| Here: | 3.6% |
| Washington: | 4.6% |
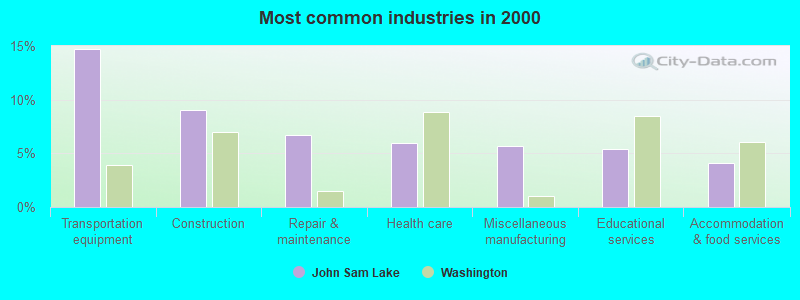
- Transportation equipment (14.8%)
- Construction (9.1%)
- Repair & maintenance (6.7%)
- Health care (6.0%)
- Miscellaneous manufacturing (5.7%)
- Educational services (5.4%)
- Accommodation & food services (4.1%)
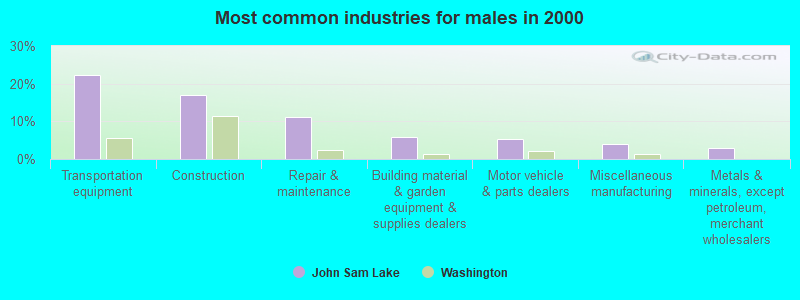
- Transportation equipment (22.3%)
- Construction (17.0%)
- Repair & maintenance (11.2%)
- Building material & garden equipment & supplies dealers (5.8%)
- Motor vehicle & parts dealers (5.3%)
- Miscellaneous manufacturing (3.9%)
- Metals & minerals, except petroleum, merchant wholesalers (2.9%)
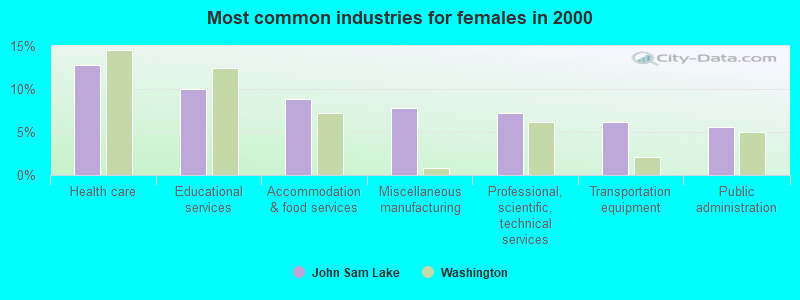
- Health care (12.8%)
- Educational services (10.0%)
- Accommodation & food services (8.9%)
- Miscellaneous manufacturing (7.8%)
- Professional, scientific, technical services (7.2%)
- Transportation equipment (6.1%)
- Public administration (5.6%)
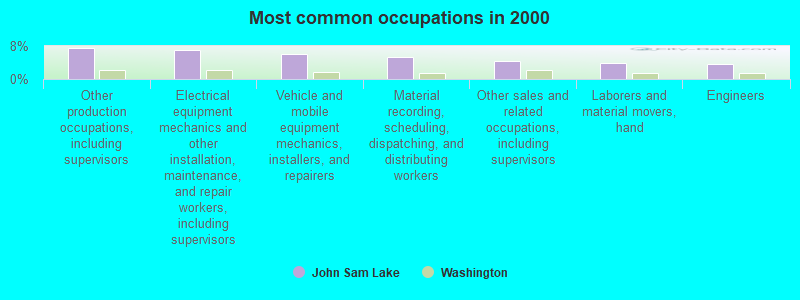
- Other production occupations, including supervisors (7.5%)
- Electrical equipment mechanics and other installation, maintenance, and repair workers, including supervisors (7.0%)
- Vehicle and mobile equipment mechanics, installers, and repairers (6.0%)
- Material recording, scheduling, dispatching, and distributing workers (5.4%)
- Other sales and related occupations, including supervisors (4.4%)
- Laborers and material movers, hand (3.9%)
- Engineers (3.6%)
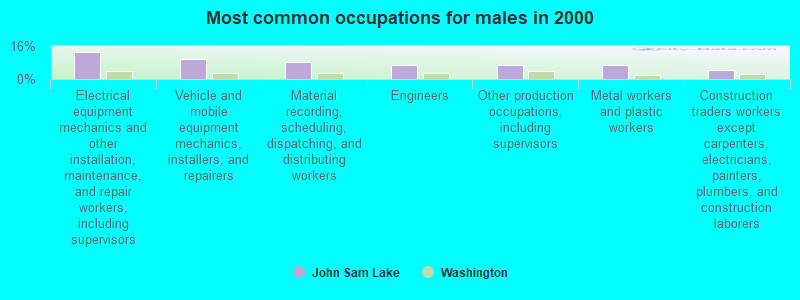
- Electrical equipment mechanics and other installation, maintenance, and repair workers, including supervisors (13.1%)
- Vehicle and mobile equipment mechanics, installers, and repairers (9.7%)
- Material recording, scheduling, dispatching, and distributing workers (8.3%)
- Engineers (6.8%)
- Other production occupations, including supervisors (6.8%)
- Metal workers and plastic workers (6.8%)
- Construction traders workers except carpenters, electricians, painters, plumbers, and construction laborers (4.4%)
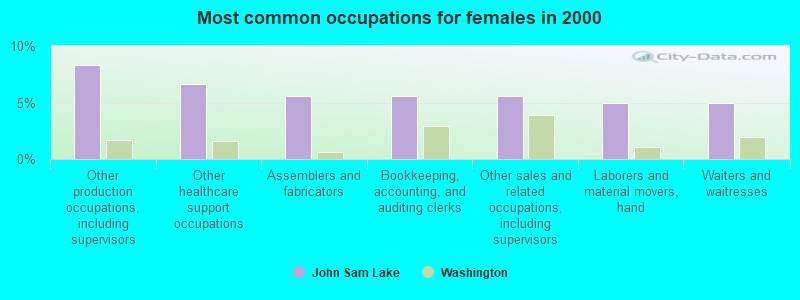
- Other production occupations, including supervisors (8.3%)
- Other healthcare support occupations (6.7%)
- Assemblers and fabricators (5.6%)
- Bookkeeping, accounting, and auditing clerks (5.6%)
- Other sales and related occupations, including supervisors (5.6%)
- Laborers and material movers, hand (5.0%)
- Waiters and waitresses (5.0%)
Average climate in John Sam Lake, Washington
Based on data reported by over 4,000 weather stations


(lower is better)
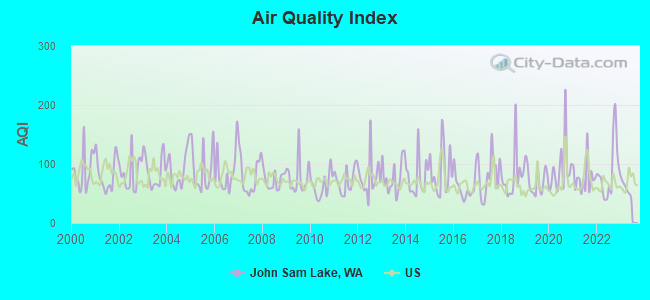
Air Quality Index (AQI) level in 2022 was 87.7. This is worse than average.
| City: | 87.7 |
| U.S.: | 72.6 |
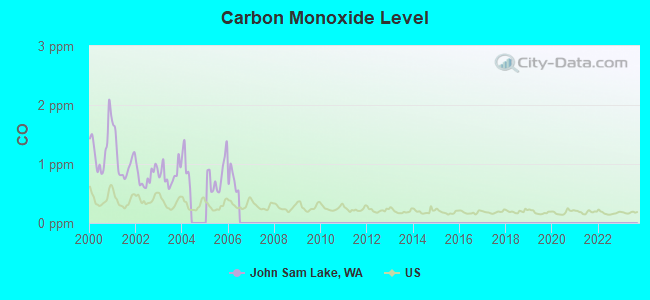
Carbon Monoxide (CO) [ppm] level in 2005 was 0.803. This is significantly worse than average. Closest monitor was 9.2 miles away from the city center.
| City: | 0.803 |
| U.S.: | 0.251 |
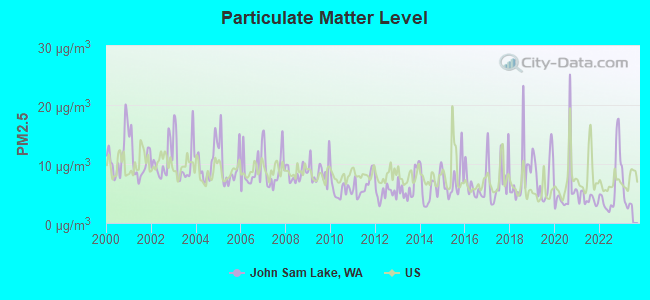
Particulate Matter (PM2.5) [µg/m3] level in 2022 was 6.23. This is better than average. Closest monitor was 5.1 miles away from the city center.
| City: | 6.23 |
| U.S.: | 8.11 |
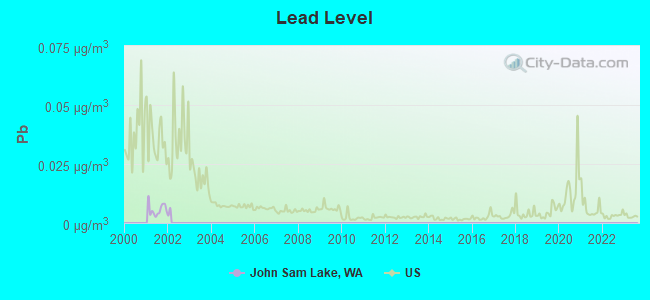
Lead (Pb) [µg/m3] level in 2001 was 0.00573. This is significantly better than average. Closest monitor was 24.6 miles away from the city center.
| City: | 0.00573 |
| U.S.: | 0.00931 |
Earthquake activity:
John Sam Lake-area historical earthquake activity is significantly above Washington state average. It is 1174% greater than the overall U.S. average.On 4/13/1949 at 19:55:42, a magnitude 7.0 (7.0 UK, Class: Major, Intensity: VIII - XII) earthquake occurred 60.6 miles away from the city center, causing $80,000,000 total damage
On 2/28/2001 at 18:54:32, a magnitude 6.8 (6.8 MD, Depth: 32.2 mi, Class: Strong, Intensity: VII - IX) earthquake occurred 70.1 miles away from John Sam Lake center
On 2/28/2001 at 18:54:32, a magnitude 6.8 (6.5 MB, 6.6 MS, 6.8 MW) earthquake occurred 72.2 miles away from the city center, causing $2,000,000,000 total damage and $305,000,000 insured losses
On 4/29/1965 at 15:28:43, a magnitude 6.6 (6.6 UK) earthquake occurred 55.0 miles away from John Sam Lake center, causing $28,000,000 total damage
On 7/3/1999 at 01:43:54, a magnitude 5.8 (5.4 MB, 5.5 MS, 5.8 MW, 5.3 ME, Depth: 25.2 mi, Class: Moderate, Intensity: VI - VII) earthquake occurred 86.0 miles away from the city center
On 5/3/1996 at 04:04:22, a magnitude 5.5 (5.2 MB, 5.3 MD, 5.5 ML, Depth: 2.5 mi) earthquake occurred 30.0 miles away from John Sam Lake center
Magnitude types: body-wave magnitude (MB), duration magnitude (MD), energy magnitude (ME), local magnitude (ML), surface-wave magnitude (MS), moment magnitude (MW)
Natural disasters:
The number of natural disasters in Snohomish County (31) is a lot greater than the US average (15).Major Disasters (Presidential) Declared: 27
Emergencies Declared: 2
Causes of natural disasters: Floods: 21, Storms: 17, Mudslides: 14, Landslides: 10, Winter Storms: 6, Winds: 5, Earthquakes: 2, Heavy Rain: 1, Hurricane: 1, Snow: 1, Tornado: 1, Volcanic Eruption: 1, Other: 1 (Note: some incidents may be assigned to more than one category).
Hospitals and medical centers near John Sam Lake:
- PUGET SOUND KIDNEY CENTER SMOKEY POINT (Dialysis Facility, about 5 miles away; ARLINGTON, WA)
- LIFE CARE AT HOME OF WA (Home Health Center, about 5 miles away; MARYSVILLE, WA)
- HAVENWOOD CARE CENTER (Nursing Home, about 6 miles away; MARYSVILLE, WA)
- MARYSVILLE CARE CENTER (Nursing Home, about 6 miles away; MARYSVILLE, WA)
- MADELEINE VILLA HEALTH CARE C (Nursing Home, about 6 miles away; MARYSVILLE, WA)
- WARM BEACH HEALTH CARE CENTER (Nursing Home, about 7 miles away; STANWOOD, WA)
- REGENCY CARE CENTER AT ARLINGTON (Nursing Home, about 8 miles away; ARLINGTON, WA)
Colleges/universities with over 2000 students nearest to John Sam Lake:
- Everett Community College (about 8 miles; Everett, WA; Full-time enrollment: 5,818)
- Edmonds Community College (about 21 miles; Lynnwood, WA; FT enrollment: 7,271)
- Skagit Valley College (about 23 miles; Mount Vernon, WA; FT enrollment: 3,803)
- University of Washington-Bothell Campus (about 25 miles; Bothell, WA; FT enrollment: 3,902)
- Cascadia Community College (about 25 miles; Bothell, WA; FT enrollment: 2,238)
- Shoreline Community College (about 26 miles; Shoreline, WA; FT enrollment: 5,026)
- Lake Washington Institute of Technology (about 29 miles; Kirkland, WA; FT enrollment: 2,947)
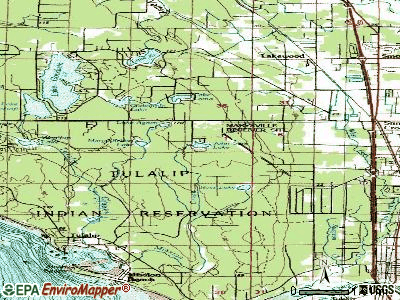
Points of interest:
Church in John Sam Lake: North Country Chapel (A). Display/hide its location on the map
Lakes: Lake Agnes (A), Ross Lake (B), Fryberg Lake (C), John Sam Lake (D). Display/hide their locations on the map
| This place: | 3.0 people |
| Washington: | 2.5 people |
| This place: | 79.7% |
| Whole state: | 66.5% |
| This place: | 6.0% |
| Whole state: | 6.1% |
No gay or lesbian households reported
| This place: | 3.0% |
| Whole state: | 10.6% |
| This place: | 1.1% |
| Whole state: | 4.6% |
For population 15 years and over in John Sam Lake:
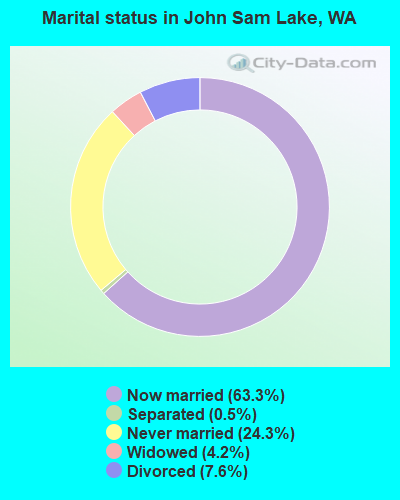
- Never married: 24.3%
- Now married: 63.3%
- Separated: 0.5%
- Widowed: 4.2%
- Divorced: 7.6%
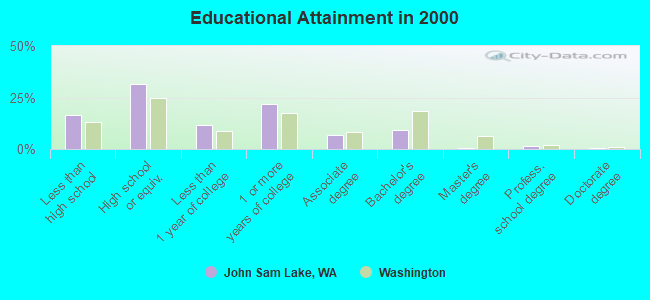
For population 25 years and over in John Sam Lake:
- High school or higher: 83.3%
- Bachelor's degree or higher: 11.6%
- Graduate or professional degree: 2.2%
- Unemployed: 10.4%
- Mean travel time to work (commute): 34.5 minutes
| Here: | 7.9 |
| Washington average: | 11.3 |
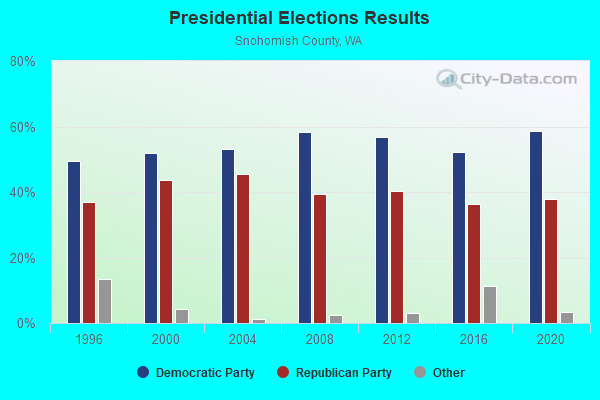
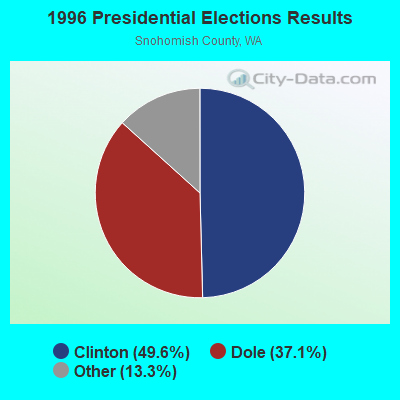
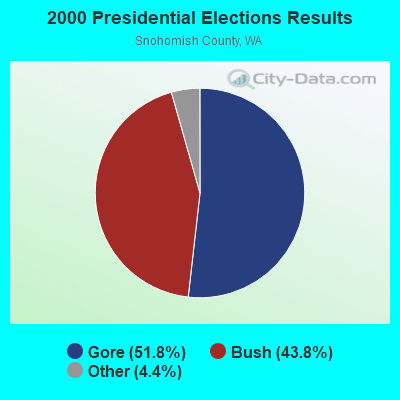
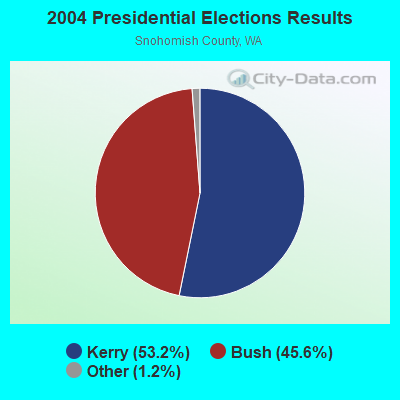
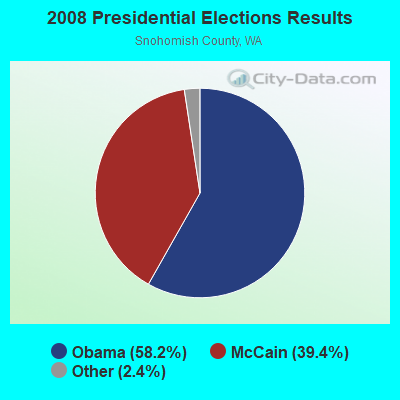

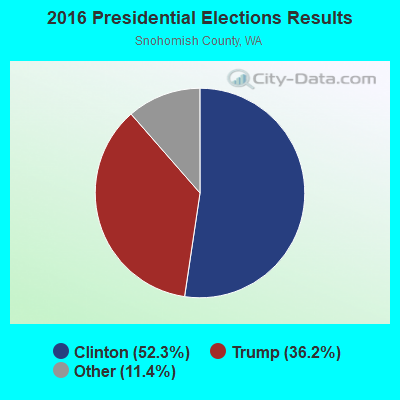
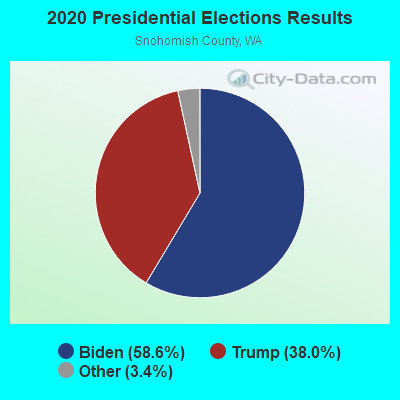
Graphs represent county-level data. Detailed 2008 Election Results
Religion statistics for John Sam Lake, WA (based on Snohomish County data)
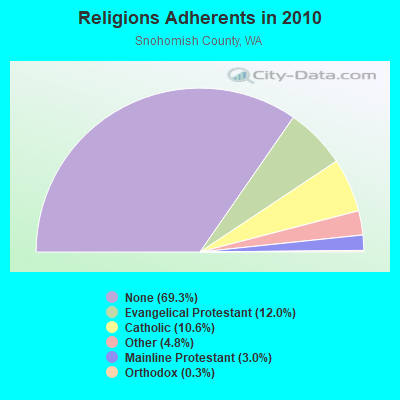
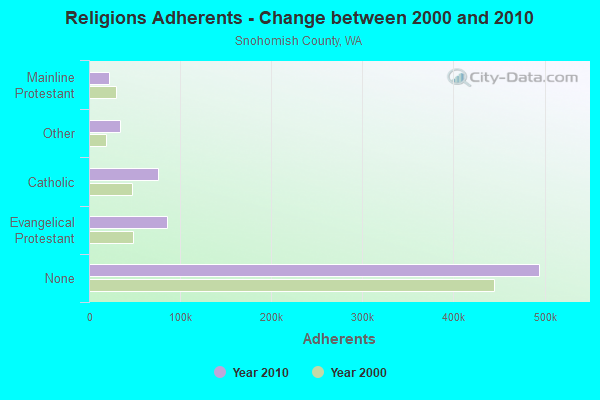
| Religion | Adherents | Congregations |
|---|---|---|
| Evangelical Protestant | 85,354 | 327 |
| Catholic | 75,393 | 16 |
| Other | 34,270 | 90 |
| Mainline Protestant | 21,642 | 71 |
| Orthodox | 1,943 | 6 |
| Black Protestant | 406 | 4 |
| None | 494,327 | - |
Food Environment Statistics:
| This county: | 1.79 / 10,000 pop. |
| Washington: | 2.06 / 10,000 pop. |
| Snohomish County: | 0.18 / 10,000 pop. |
| State: | 0.19 / 10,000 pop. |
| Snohomish County: | 1.42 / 10,000 pop. |
| Washington: | 1.18 / 10,000 pop. |
| Here: | 2.55 / 10,000 pop. |
| Washington: | 2.67 / 10,000 pop. |
| This county: | 6.95 / 10,000 pop. |
| Washington: | 8.26 / 10,000 pop. |
| Here: | 7.5% |
| Washington: | 7.7% |
| This county: | 27.4% |
| Washington: | 25.7% |
| This county: | 14.3% |
| State: | 13.9% |
7.60% of this county's 2021 resident taxpayers lived in other counties in 2020 ($97,930 average adjusted gross income)
| Here: | 7.60% |
| Washington average: | 7.53% |
0.04% of residents moved from foreign countries ($285 average AGI)
Snohomish County: 0.04% Washington average: 0.05%
Top counties from which taxpayers relocated into this county between 2020 and 2021:
| from King County, WA | |
| from Pierce County, WA | |
| from Skagit County, WA |
7.20% of this county's 2020 resident taxpayers moved to other counties in 2021 ($85,049 average adjusted gross income)
| Here: | 7.20% |
| Washington average: | 7.40% |
0.02% of residents moved to foreign countries ($153 average AGI)
Snohomish County: 0.02% Washington average: 0.04%
Top counties to which taxpayers relocated from this county between 2020 and 2021:
| to King County, WA | |
| to Pierce County, WA | |
| to Skagit County, WA |
Strongest AM radio stations in John Sam Lake:
- KRKO (1380 AM; 50 kW; EVERETT, WA; Owner: S-R BROADCASTING, CO.)
- KIXI (880 AM; 50 kW; MERCER ISLAND/SEATTL, WA; Owner: BELLEVUE RADIO, INC.)
- KKOL (1300 AM; 50 kW; SEATTLE, WA; Owner: INSPIRATION MEDIA, INC.)
- KIRO (710 AM; 50 kW; SEATTLE, WA; Owner: ENTERCOM SEATTLE LICENSE, LLC)
- KAPS (660 AM; 10 kW; MOUNT VERNON, WA; Owner: VALLEY BROADCASTERS, INC.)
- KGNW (820 AM; 50 kW; BURIEN-SEATTLE, WA; Owner: INSPIRATION MEDIA, INC.)
- KTTH (770 AM; 50 kW; SEATTLE, WA; Owner: ENTERCOM SEATTLE LICENSE, LLC)
- KOMO (1000 AM; 50 kW; SEATTLE, WA; Owner: FISHER BROADCASTING - SEATTLE RADIO, L.L.C.)
- KYCW (1090 AM; 50 kW; SEATTLE, WA; Owner: INFINITY RADIO SUBSIDIARY OPERATIONS INC.)
- KJR (950 AM; 50 kW; SEATTLE, WA)
- KCIS (630 AM; 5 kW; EDMONDS, WA; Owner: CRISTA MINISTRIES)
- KRPI (1550 AM; 50 kW; FERNDALE, WA; Owner: BBC BROADCASTING, INC.)
- KARI (550 AM; 25 kW; BLAINE, WA; Owner: WAY BROADCASTING, INC.)
Strongest FM radio stations in John Sam Lake:
- KSER (90.7 FM; EVERETT, WA; Owner: KSER FOUNDATION)
- K206CU (89.1 FM; MOUNT VERNON, WA; Owner: CALVARY CHAPEL OF TWIN FALLS, INC.)
- KISW (99.9 FM; SEATTLE, WA; Owner: ENTERCOM SEATTLE LICENSE, LLC)
- K205DL (88.9 FM; GRANITE FALLS/EVERET, WA; Owner: CALVARY CHAPEL OF TWIN FALLS, INC.)
- KSVR (91.7 FM; MOUNT VERNON, WA; Owner: BOARD OF TRUSTEES OF SKAGIT VALLEY COLLEGE)
- KQBZ (100.7 FM; SEATTLE, WA; Owner: ENTERCOM SEATTLE LICENSE, LLC)
- KCMS (105.3 FM; EDMONDS, WA; Owner: CRISTA MINISTRIES, INC.)
- KMTT (103.7 FM; TACOMA, WA; Owner: ENTERCOM SEATTLE LICENSE, LLC)
- KNDD (107.7 FM; SEATTLE, WA; Owner: ENTERCOM SEATTLE LICENSE, LLC)
- KYPT (96.5 FM; SEATTLE, WA; Owner: INFINITY RADIO SUBSIDIARY OPERATIONS INC.)
- KBSG-FM (97.3 FM; TACOMA, WA; Owner: ENTERCOM SEATTLE LICENSE, LLC)
- KZOK-FM (102.5 FM; SEATTLE, WA; Owner: INFINITY RADIO SUBSIDIARY OPERATIONS INC.)
- KBKS (106.1 FM; TACOMA, WA; Owner: INFINITY RADIO SUBSIDIARY OPERATIONS INC.)
- KING-FM (98.1 FM; SEATTLE, WA; Owner: CLASSIC RADIO, INC.)
- KLSY-FM (92.5 FM; BELLEVUE, WA; Owner: BELLEVUE RADIO INC.)
- KPLU-FM (88.5 FM; TACOMA, WA; Owner: PACIFIC LUTHERAN UNIVERSITY, INC.)
- KWJZ (98.9 FM; SEATTLE, WA; Owner: ORCA RADIO, INC.)
- KMPS-FM (94.1 FM; SEATTLE, WA; Owner: INFINITY RADIO SUBSIDIARY OPERATIONS INC.)
- K213BM (90.5 FM; EVERETT, ETC., WA; Owner: JACK STRAW FOUNDATION)
- KISM (92.9 FM; BELLINGHAM, WA; Owner: SAGA BROADCASTING, LLC)
TV broadcast stations around John Sam Lake:
- KING-TV (Channel 5; SEATTLE, WA; Owner: KING BROADCASTING COMPANY)
- KSTW (Channel 11; TACOMA, WA; Owner: UPN TELEVISION STATIONS INC.)
- K58DP (Channel 58; SEATTLE, WA; Owner: WORD OF GOD FELLOWSHIP, INC.)
- KTWB-TV (Channel 22; SEATTLE, WA; Owner: TRIBUNE TELEVISION HOLDINGS, INC.)
- KOMO-TV (Channel 4; SEATTLE, WA; Owner: FISHER BROADCASTING - SEATTLE TV, L.L.C.)
- KIRO-TV (Channel 7; SEATTLE, WA; Owner: KIRO-TV HOLDINGS, INC.)
- KHCV (Channel 45; SEATTLE, WA; Owner: NORTH PACIFIC INTERNATIONAL TELEVISION, INC.)
- K57HB (Channel 57; EUREKA, CA; Owner: MS COMMUNICATIONS, LLC)
- K29ED (Channel 29; EVERETT, WA; Owner: TRIBUNE TELEVISION HOLDINGS, INC.)
- K58BW (Channel 58; EVERETT, WA; Owner: KIRO-TV HOLDINGS, INC.)
John Sam Lake fatal accident list:
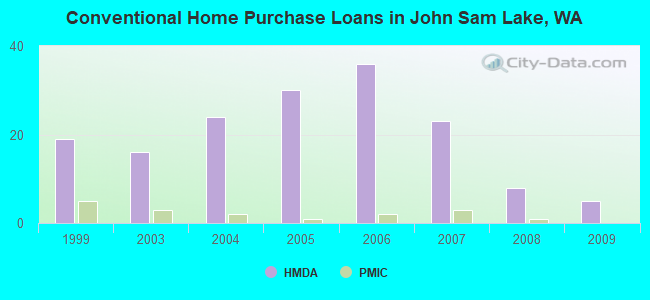
| Home Mortgage Disclosure Act Aggregated Statistics For Year 2009 (Based on 2 partial tracts) | ||||||||||||
| A) FHA, FSA/RHS & VA Home Purchase Loans | B) Conventional Home Purchase Loans | C) Refinancings | D) Home Improvement Loans | F) Non-occupant Loans on < 5 Family Dwellings (A B C & D) | G) Loans On Manufactured Home Dwelling (A B C & D) | |||||||
|---|---|---|---|---|---|---|---|---|---|---|---|---|
| Number | Average Value | Number | Average Value | Number | Average Value | Number | Average Value | Number | Average Value | Number | Average Value | |
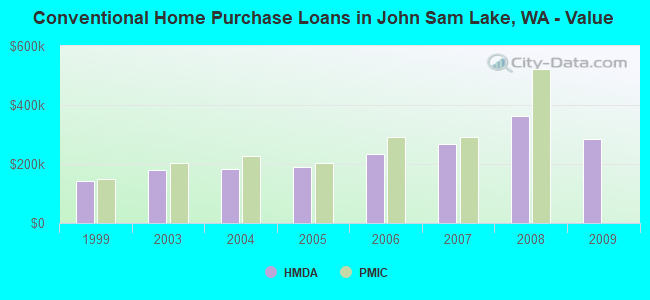
| LOANS ORIGINATED | 7 | $240,019 | 5 | $283,420 | 37 | $242,107 | 2 | $118,845 | 3 | $239,117 | 6 | $200,185 |
| APPLICATIONS APPROVED, NOT ACCEPTED | 0 | $0 | 1 | $215,070 | 4 | $300,748 | 1 | $36,950 | 0 | $0 | 1 | $191,230 |
| APPLICATIONS DENIED | 2 | $168,615 | 2 | $319,855 | 14 | $277,098 | 1 | $91,810 | 1 | $253,530 | 2 | $205,815 |
| APPLICATIONS WITHDRAWN | 2 | $237,560 | 1 | $366,940 | 10 | $276,454 | 0 | $0 | 1 | $198,080 | 2 | $223,020 |
| FILES CLOSED FOR INCOMPLETENESS | 0 | $0 | 0 | $0 | 3 | $237,650 | 0 | $0 | 1 | $116,960 | 1 | $107,820 |
Detailed HMDA statistics for the following Tracts: 0530.01 , 0530.02
| Private Mortgage Insurance Companies Aggregated Statistics For Year 2008 (Based on 2 partial tracts) | ||||
| A) Conventional Home Purchase Loans | B) Refinancings | |||
|---|---|---|---|---|
| Number | Average Value | Number | Average Value | |
| LOANS ORIGINATED | 1 | $521,070 | 1 | $306,930 |
| APPLICATIONS APPROVED, NOT ACCEPTED | 0 | $0 | 1 | $180,910 |
| APPLICATIONS DENIED | 0 | $0 | 0 | $0 |
| APPLICATIONS WITHDRAWN | 0 | $0 | 0 | $0 |
| FILES CLOSED FOR INCOMPLETENESS | 0 | $0 | 0 | $0 |
Detailed PMIC statistics for the following Tracts: 0530.01 , 0530.02
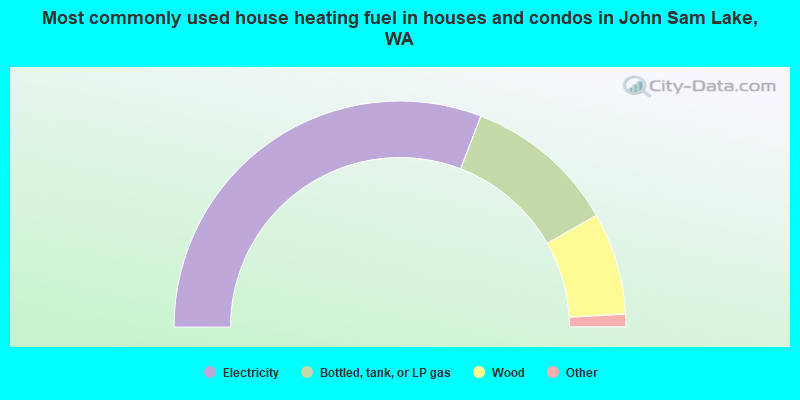
- 61.6%Electricity
- 21.9%Bottled, tank, or LP gas
- 14.6%Wood
- 0.9%Utility gas
- 0.9%Other fuel
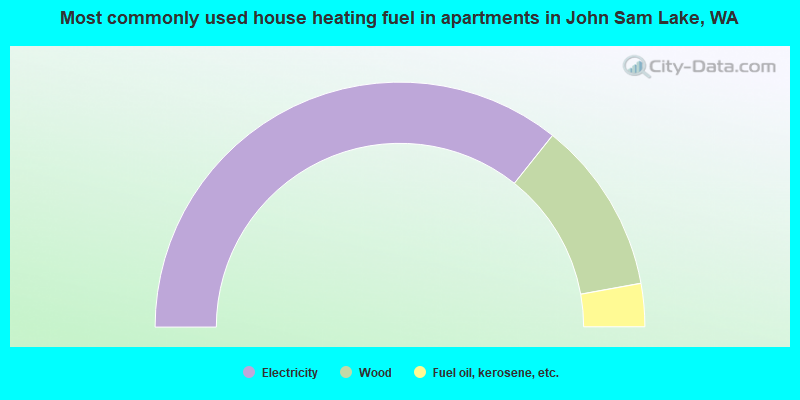
- 71.4%Electricity
- 22.9%Wood
- 5.7%Fuel oil, kerosene, etc.
John Sam Lake compared to Washington state average:
- Black race population percentage significantly below state average.
- Hispanic race population percentage significantly below state average.
- Median age above state average.
- Foreign-born population percentage significantly below state average.
- Renting percentage significantly below state average.
- Length of stay since moving in significantly above state average.
- Number of rooms per house significantly below state average.
- House age significantly below state average.
- Number of college students below state average.
- Percentage of population with a bachelor's degree or higher significantly below state average.