Holmes Beach, Florida Submit your own pictures of this city and show them to the world
OSM Map
General Map
Google Map
MSN Map
OSM Map
General Map
Google Map
MSN Map
OSM Map
General Map
Google Map
MSN Map
OSM Map
General Map
Google Map
MSN Map
Please wait while loading the map...
Population in 2022: 3,043 (100% urban, 0% rural). Population change since 2000: -38.7%Males: 1,408 Females: 1,635
March 2022 cost of living index in Holmes Beach: 102.6 (near average, U.S. average is 100) Percentage of residents living in poverty in 2022: 6.8%for White Non-Hispanic residents , 6.7% for two or more races residents )
Profiles of local businesses
Business Search - 14 Million verified businesses
Data:
Median household income ($)
Median household income (% change since 2000)
Household income diversity
Ratio of average income to average house value (%)
Ratio of average income to average rent
Median household income ($) - White
Median household income ($) - Black or African American
Median household income ($) - Asian
Median household income ($) - Hispanic or Latino
Median household income ($) - American Indian and Alaska Native
Median household income ($) - Multirace
Median household income ($) - Other Race
Median household income for houses/condos with a mortgage ($)
Median household income for apartments without a mortgage ($)
Races - White alone (%)
Races - White alone (% change since 2000)
Races - Black alone (%)
Races - Black alone (% change since 2000)
Races - American Indian alone (%)
Races - American Indian alone (% change since 2000)
Races - Asian alone (%)
Races - Asian alone (% change since 2000)
Races - Hispanic (%)
Races - Hispanic (% change since 2000)
Races - Native Hawaiian and Other Pacific Islander alone (%)
Races - Native Hawaiian and Other Pacific Islander alone (% change since 2000)
Races - Two or more races (%)
Races - Two or more races (% change since 2000)
Races - Other race alone (%)
Races - Other race alone (% change since 2000)
Racial diversity
Unemployment (%)
Unemployment (% change since 2000)
Unemployment (%) - White
Unemployment (%) - Black or African American
Unemployment (%) - Asian
Unemployment (%) - Hispanic or Latino
Unemployment (%) - American Indian and Alaska Native
Unemployment (%) - Multirace
Unemployment (%) - Other Race
Population density (people per square mile)
Population - Males (%)
Population - Females (%)
Population - Males (%) - White
Population - Males (%) - Black or African American
Population - Males (%) - Asian
Population - Males (%) - Hispanic or Latino
Population - Males (%) - American Indian and Alaska Native
Population - Males (%) - Multirace
Population - Males (%) - Other Race
Population - Females (%) - White
Population - Females (%) - Black or African American
Population - Females (%) - Asian
Population - Females (%) - Hispanic or Latino
Population - Females (%) - American Indian and Alaska Native
Population - Females (%) - Multirace
Population - Females (%) - Other Race
Coronavirus confirmed cases (May 11, 2024)
Deaths caused by coronavirus (May 11, 2024)
Coronavirus confirmed cases (per 100k population) (May 11, 2024)
Deaths caused by coronavirus (per 100k population) (May 11, 2024)
Daily increase in number of cases (May 11, 2024)
Weekly increase in number of cases (May 11, 2024)
Cases doubled (in days) (May 11, 2024)
Hospitalized patients (Apr 18, 2022)
Negative test results (Apr 18, 2022)
Total test results (Apr 18, 2022)
COVID Vaccine doses distributed (per 100k population) (Sep 19, 2023)
COVID Vaccine doses administered (per 100k population) (Sep 19, 2023)
COVID Vaccine doses distributed (Sep 19, 2023)
COVID Vaccine doses administered (Sep 19, 2023)
Likely homosexual households (%)
Likely homosexual households (% change since 2000)
Likely homosexual households - Lesbian couples (%)
Likely homosexual households - Lesbian couples (% change since 2000)
Likely homosexual households - Gay men (%)
Likely homosexual households - Gay men (% change since 2000)
Cost of living index
Median gross rent ($)
Median contract rent ($)
Median monthly housing costs ($)
Median house or condo value ($)
Median house or condo value ($ change since 2000)
Mean house or condo value by units in structure - 1, detached ($)
Mean house or condo value by units in structure - 1, attached ($)
Mean house or condo value by units in structure - 2 ($)
Mean house or condo value by units in structure by units in structure - 3 or 4 ($)
Mean house or condo value by units in structure - 5 or more ($)
Mean house or condo value by units in structure - Boat, RV, van, etc. ($)
Mean house or condo value by units in structure - Mobile home ($)
Median house or condo value ($) - White
Median house or condo value ($) - Black or African American
Median house or condo value ($) - Asian
Median house or condo value ($) - Hispanic or Latino
Median house or condo value ($) - American Indian and Alaska Native
Median house or condo value ($) - Multirace
Median house or condo value ($) - Other Race
Median resident age
Resident age diversity
Median resident age - Males
Median resident age - Females
Median resident age - White
Median resident age - Black or African American
Median resident age - Asian
Median resident age - Hispanic or Latino
Median resident age - American Indian and Alaska Native
Median resident age - Multirace
Median resident age - Other Race
Median resident age - Males - White
Median resident age - Males - Black or African American
Median resident age - Males - Asian
Median resident age - Males - Hispanic or Latino
Median resident age - Males - American Indian and Alaska Native
Median resident age - Males - Multirace
Median resident age - Males - Other Race
Median resident age - Females - White
Median resident age - Females - Black or African American
Median resident age - Females - Asian
Median resident age - Females - Hispanic or Latino
Median resident age - Females - American Indian and Alaska Native
Median resident age - Females - Multirace
Median resident age - Females - Other Race
Commute - mean travel time to work (minutes)
Travel time to work - Less than 5 minutes (%)
Travel time to work - Less than 5 minutes (% change since 2000)
Travel time to work - 5 to 9 minutes (%)
Travel time to work - 5 to 9 minutes (% change since 2000)
Travel time to work - 10 to 19 minutes (%)
Travel time to work - 10 to 19 minutes (% change since 2000)
Travel time to work - 20 to 29 minutes (%)
Travel time to work - 20 to 29 minutes (% change since 2000)
Travel time to work - 30 to 39 minutes (%)
Travel time to work - 30 to 39 minutes (% change since 2000)
Travel time to work - 40 to 59 minutes (%)
Travel time to work - 40 to 59 minutes (% change since 2000)
Travel time to work - 60 to 89 minutes (%)
Travel time to work - 60 to 89 minutes (% change since 2000)
Travel time to work - 90 or more minutes (%)
Travel time to work - 90 or more minutes (% change since 2000)
Marital status - Never married (%)
Marital status - Now married (%)
Marital status - Separated (%)
Marital status - Widowed (%)
Marital status - Divorced (%)
Median family income ($)
Median family income (% change since 2000)
Median non-family income ($)
Median non-family income (% change since 2000)
Median per capita income ($)
Median per capita income (% change since 2000)
Median family income ($) - White
Median family income ($) - Black or African American
Median family income ($) - Asian
Median family income ($) - Hispanic or Latino
Median family income ($) - American Indian and Alaska Native
Median family income ($) - Multirace
Median family income ($) - Other Race
Median year house/condo built
Median year apartment built
Year house built - Built 2005 or later (%)
Year house built - Built 2000 to 2004 (%)
Year house built - Built 1990 to 1999 (%)
Year house built - Built 1980 to 1989 (%)
Year house built - Built 1970 to 1979 (%)
Year house built - Built 1960 to 1969 (%)
Year house built - Built 1950 to 1959 (%)
Year house built - Built 1940 to 1949 (%)
Year house built - Built 1939 or earlier (%)
Average household size
Household density (households per square mile)
Average household size - White
Average household size - Black or African American
Average household size - Asian
Average household size - Hispanic or Latino
Average household size - American Indian and Alaska Native
Average household size - Multirace
Average household size - Other Race
Occupied housing units (%)
Vacant housing units (%)
Owner occupied housing units (%)
Renter occupied housing units (%)
Vacancy status - For rent (%)
Vacancy status - For sale only (%)
Vacancy status - Rented or sold, not occupied (%)
Vacancy status - For seasonal, recreational, or occasional use (%)
Vacancy status - For migrant workers (%)
Vacancy status - Other vacant (%)
Residents with income below the poverty level (%)
Residents with income below 50% of the poverty level (%)
Children below poverty level (%)
Poor families by family type - Married-couple family (%)
Poor families by family type - Male, no wife present (%)
Poor families by family type - Female, no husband present (%)
Poverty status for native-born residents (%)
Poverty status for foreign-born residents (%)
Poverty among high school graduates not in families (%)
Poverty among people who did not graduate high school not in families (%)
Residents with income below the poverty level (%) - White
Residents with income below the poverty level (%) - Black or African American
Residents with income below the poverty level (%) - Asian
Residents with income below the poverty level (%) - Hispanic or Latino
Residents with income below the poverty level (%) - American Indian and Alaska Native
Residents with income below the poverty level (%) - Multirace
Residents with income below the poverty level (%) - Other Race
Air pollution - Air Quality Index (AQI)
Air pollution - CO
Air pollution - NO2
Air pollution - SO2
Air pollution - Ozone
Air pollution - PM10
Air pollution - PM25
Air pollution - Pb
Crime - Murders per 100,000 population
Crime - Rapes per 100,000 population
Crime - Robberies per 100,000 population
Crime - Assaults per 100,000 population
Crime - Burglaries per 100,000 population
Crime - Thefts per 100,000 population
Crime - Auto thefts per 100,000 population
Crime - Arson per 100,000 population
Crime - City-data.com crime index
Crime - Violent crime index
Crime - Property crime index
Crime - Murders per 100,000 population (5 year average)
Crime - Rapes per 100,000 population (5 year average)
Crime - Robberies per 100,000 population (5 year average)
Crime - Assaults per 100,000 population (5 year average)
Crime - Burglaries per 100,000 population (5 year average)
Crime - Thefts per 100,000 population (5 year average)
Crime - Auto thefts per 100,000 population (5 year average)
Crime - Arson per 100,000 population (5 year average)
Crime - City-data.com crime index (5 year average)
Crime - Violent crime index (5 year average)
Crime - Property crime index (5 year average)
1996 Presidential Elections Results (%) - Democratic Party (Clinton)
1996 Presidential Elections Results (%) - Republican Party (Dole)
1996 Presidential Elections Results (%) - Other
2000 Presidential Elections Results (%) - Democratic Party (Gore)
2000 Presidential Elections Results (%) - Republican Party (Bush)
2000 Presidential Elections Results (%) - Other
2004 Presidential Elections Results (%) - Democratic Party (Kerry)
2004 Presidential Elections Results (%) - Republican Party (Bush)
2004 Presidential Elections Results (%) - Other
2008 Presidential Elections Results (%) - Democratic Party (Obama)
2008 Presidential Elections Results (%) - Republican Party (McCain)
2008 Presidential Elections Results (%) - Other
2012 Presidential Elections Results (%) - Democratic Party (Obama)
2012 Presidential Elections Results (%) - Republican Party (Romney)
2012 Presidential Elections Results (%) - Other
2016 Presidential Elections Results (%) - Democratic Party (Clinton)
2016 Presidential Elections Results (%) - Republican Party (Trump)
2016 Presidential Elections Results (%) - Other
2020 Presidential Elections Results (%) - Democratic Party (Biden)
2020 Presidential Elections Results (%) - Republican Party (Trump)
2020 Presidential Elections Results (%) - Other
Ancestries Reported - Arab (%)
Ancestries Reported - Czech (%)
Ancestries Reported - Danish (%)
Ancestries Reported - Dutch (%)
Ancestries Reported - English (%)
Ancestries Reported - French (%)
Ancestries Reported - French Canadian (%)
Ancestries Reported - German (%)
Ancestries Reported - Greek (%)
Ancestries Reported - Hungarian (%)
Ancestries Reported - Irish (%)
Ancestries Reported - Italian (%)
Ancestries Reported - Lithuanian (%)
Ancestries Reported - Norwegian (%)
Ancestries Reported - Polish (%)
Ancestries Reported - Portuguese (%)
Ancestries Reported - Russian (%)
Ancestries Reported - Scotch-Irish (%)
Ancestries Reported - Scottish (%)
Ancestries Reported - Slovak (%)
Ancestries Reported - Subsaharan African (%)
Ancestries Reported - Swedish (%)
Ancestries Reported - Swiss (%)
Ancestries Reported - Ukrainian (%)
Ancestries Reported - United States (%)
Ancestries Reported - Welsh (%)
Ancestries Reported - West Indian (%)
Ancestries Reported - Other (%)
Educational Attainment - No schooling completed (%)
Educational Attainment - Less than high school (%)
Educational Attainment - High school or equivalent (%)
Educational Attainment - Less than 1 year of college (%)
Educational Attainment - 1 or more years of college (%)
Educational Attainment - Associate degree (%)
Educational Attainment - Bachelor's degree (%)
Educational Attainment - Master's degree (%)
Educational Attainment - Professional school degree (%)
Educational Attainment - Doctorate degree (%)
School Enrollment - Nursery, preschool (%)
School Enrollment - Kindergarten (%)
School Enrollment - Grade 1 to 4 (%)
School Enrollment - Grade 5 to 8 (%)
School Enrollment - Grade 9 to 12 (%)
School Enrollment - College undergrad (%)
School Enrollment - Graduate or professional (%)
School Enrollment - Not enrolled in school (%)
School enrollment - Public schools (%)
School enrollment - Private schools (%)
School enrollment - Not enrolled (%)
Median number of rooms in houses and condos
Median number of rooms in apartments
Housing units lacking complete plumbing facilities (%)
Housing units lacking complete kitchen facilities (%)
Density of houses
Urban houses (%)
Rural houses (%)
Households with people 60 years and over (%)
Households with people 65 years and over (%)
Households with people 75 years and over (%)
Households with one or more nonrelatives (%)
Households with no nonrelatives (%)
Population in households (%)
Family households (%)
Nonfamily households (%)
Population in families (%)
Family households with own children (%)
Median number of bedrooms in owner occupied houses
Mean number of bedrooms in owner occupied houses
Median number of bedrooms in renter occupied houses
Mean number of bedrooms in renter occupied houses
Median number of vehichles in owner occupied houses
Mean number of vehichles in owner occupied houses
Median number of vehichles in renter occupied houses
Mean number of vehichles in renter occupied houses
Mortgage status - with mortgage (%)
Mortgage status - with second mortgage (%)
Mortgage status - with home equity loan (%)
Mortgage status - with both second mortgage and home equity loan (%)
Mortgage status - without a mortgage (%)
Average family size
Average family size - White
Average family size - Black or African American
Average family size - Asian
Average family size - Hispanic or Latino
Average family size - American Indian and Alaska Native
Average family size - Multirace
Average family size - Other Race
Geographical mobility - Same house 1 year ago (%)
Geographical mobility - Moved within same county (%)
Geographical mobility - Moved from different county within same state (%)
Geographical mobility - Moved from different state (%)
Geographical mobility - Moved from abroad (%)
Place of birth - Born in state of residence (%)
Place of birth - Born in other state (%)
Place of birth - Native, outside of US (%)
Place of birth - Foreign born (%)
Housing units in structures - 1, detached (%)
Housing units in structures - 1, attached (%)
Housing units in structures - 2 (%)
Housing units in structures - 3 or 4 (%)
Housing units in structures - 5 to 9 (%)
Housing units in structures - 10 to 19 (%)
Housing units in structures - 20 to 49 (%)
Housing units in structures - 50 or more (%)
Housing units in structures - Mobile home (%)
Housing units in structures - Boat, RV, van, etc. (%)
House/condo owner moved in on average (years ago)
Renter moved in on average (years ago)
Year householder moved into unit - Moved in 1999 to March 2000 (%)
Year householder moved into unit - Moved in 1995 to 1998 (%)
Year householder moved into unit - Moved in 1990 to 1994 (%)
Year householder moved into unit - Moved in 1980 to 1989 (%)
Year householder moved into unit - Moved in 1970 to 1979 (%)
Year householder moved into unit - Moved in 1969 or earlier (%)
Means of transportation to work - Drove car alone (%)
Means of transportation to work - Carpooled (%)
Means of transportation to work - Public transportation (%)
Means of transportation to work - Bus or trolley bus (%)
Means of transportation to work - Streetcar or trolley car (%)
Means of transportation to work - Subway or elevated (%)
Means of transportation to work - Railroad (%)
Means of transportation to work - Ferryboat (%)
Means of transportation to work - Taxicab (%)
Means of transportation to work - Motorcycle (%)
Means of transportation to work - Bicycle (%)
Means of transportation to work - Walked (%)
Means of transportation to work - Other means (%)
Working at home (%)
Industry diversity
Most Common Industries - Agriculture, forestry, fishing and hunting, and mining (%)
Most Common Industries - Agriculture, forestry, fishing and hunting (%)
Most Common Industries - Mining, quarrying, and oil and gas extraction (%)
Most Common Industries - Construction (%)
Most Common Industries - Manufacturing (%)
Most Common Industries - Wholesale trade (%)
Most Common Industries - Retail trade (%)
Most Common Industries - Transportation and warehousing, and utilities (%)
Most Common Industries - Transportation and warehousing (%)
Most Common Industries - Utilities (%)
Most Common Industries - Information (%)
Most Common Industries - Finance and insurance, and real estate and rental and leasing (%)
Most Common Industries - Finance and insurance (%)
Most Common Industries - Real estate and rental and leasing (%)
Most Common Industries - Professional, scientific, and management, and administrative and waste management services (%)
Most Common Industries - Professional, scientific, and technical services (%)
Most Common Industries - Management of companies and enterprises (%)
Most Common Industries - Administrative and support and waste management services (%)
Most Common Industries - Educational services, and health care and social assistance (%)
Most Common Industries - Educational services (%)
Most Common Industries - Health care and social assistance (%)
Most Common Industries - Arts, entertainment, and recreation, and accommodation and food services (%)
Most Common Industries - Arts, entertainment, and recreation (%)
Most Common Industries - Accommodation and food services (%)
Most Common Industries - Other services, except public administration (%)
Most Common Industries - Public administration (%)
Occupation diversity
Most Common Occupations - Management, business, science, and arts occupations (%)
Most Common Occupations - Management, business, and financial occupations (%)
Most Common Occupations - Management occupations (%)
Most Common Occupations - Business and financial operations occupations (%)
Most Common Occupations - Computer, engineering, and science occupations (%)
Most Common Occupations - Computer and mathematical occupations (%)
Most Common Occupations - Architecture and engineering occupations (%)
Most Common Occupations - Life, physical, and social science occupations (%)
Most Common Occupations - Education, legal, community service, arts, and media occupations (%)
Most Common Occupations - Community and social service occupations (%)
Most Common Occupations - Legal occupations (%)
Most Common Occupations - Education, training, and library occupations (%)
Most Common Occupations - Arts, design, entertainment, sports, and media occupations (%)
Most Common Occupations - Healthcare practitioners and technical occupations (%)
Most Common Occupations - Health diagnosing and treating practitioners and other technical occupations (%)
Most Common Occupations - Health technologists and technicians (%)
Most Common Occupations - Service occupations (%)
Most Common Occupations - Healthcare support occupations (%)
Most Common Occupations - Protective service occupations (%)
Most Common Occupations - Fire fighting and prevention, and other protective service workers including supervisors (%)
Most Common Occupations - Law enforcement workers including supervisors (%)
Most Common Occupations - Food preparation and serving related occupations (%)
Most Common Occupations - Building and grounds cleaning and maintenance occupations (%)
Most Common Occupations - Personal care and service occupations (%)
Most Common Occupations - Sales and office occupations (%)
Most Common Occupations - Sales and related occupations (%)
Most Common Occupations - Office and administrative support occupations (%)
Most Common Occupations - Natural resources, construction, and maintenance occupations (%)
Most Common Occupations - Farming, fishing, and forestry occupations (%)
Most Common Occupations - Construction and extraction occupations (%)
Most Common Occupations - Installation, maintenance, and repair occupations (%)
Most Common Occupations - Production, transportation, and material moving occupations (%)
Most Common Occupations - Production occupations (%)
Most Common Occupations - Transportation occupations (%)
Most Common Occupations - Material moving occupations (%)
People in Group quarters - Institutionalized population (%)
People in Group quarters - Correctional institutions (%)
People in Group quarters - Federal prisons and detention centers (%)
People in Group quarters - Halfway houses (%)
People in Group quarters - Local jails and other confinement facilities (including police lockups) (%)
People in Group quarters - Military disciplinary barracks (%)
People in Group quarters - State prisons (%)
People in Group quarters - Other types of correctional institutions (%)
People in Group quarters - Nursing homes (%)
People in Group quarters - Hospitals/wards, hospices, and schools for the handicapped (%)
People in Group quarters - Hospitals/wards and hospices for chronically ill (%)
People in Group quarters - Hospices or homes for chronically ill (%)
People in Group quarters - Military hospitals or wards for chronically ill (%)
People in Group quarters - Other hospitals or wards for chronically ill (%)
People in Group quarters - Hospitals or wards for drug/alcohol abuse (%)
People in Group quarters - Mental (Psychiatric) hospitals or wards (%)
People in Group quarters - Schools, hospitals, or wards for the mentally retarded (%)
People in Group quarters - Schools, hospitals, or wards for the physically handicapped (%)
People in Group quarters - Institutions for the deaf (%)
People in Group quarters - Institutions for the blind (%)
People in Group quarters - Orthopedic wards and institutions for the physically handicapped (%)
People in Group quarters - Wards in general hospitals for patients who have no usual home elsewhere (%)
People in Group quarters - Wards in military hospitals for patients who have no usual home elsewhere (%)
People in Group quarters - Juvenile institutions (%)
People in Group quarters - Long-term care (%)
People in Group quarters - Homes for abused, dependent, and neglected children (%)
People in Group quarters - Residential treatment centers for emotionally disturbed children (%)
People in Group quarters - Training schools for juvenile delinquents (%)
People in Group quarters - Short-term care, detention or diagnostic centers for delinquent children (%)
People in Group quarters - Type of juvenile institution unknown (%)
People in Group quarters - Noninstitutionalized population (%)
People in Group quarters - College dormitories (includes college quarters off campus) (%)
People in Group quarters - Military quarters (%)
People in Group quarters - On base (%)
People in Group quarters - Barracks, unaccompanied personnel housing (UPH), (Enlisted/Officer), ;and similar group living quarters for military personnel (%)
People in Group quarters - Transient quarters for temporary residents (%)
People in Group quarters - Military ships (%)
People in Group quarters - Group homes (%)
People in Group quarters - Homes or halfway houses for drug/alcohol abuse (%)
People in Group quarters - Homes for the mentally ill (%)
People in Group quarters - Homes for the mentally retarded (%)
People in Group quarters - Homes for the physically handicapped (%)
People in Group quarters - Other group homes (%)
People in Group quarters - Religious group quarters (%)
People in Group quarters - Dormitories (%)
People in Group quarters - Agriculture workers' dormitories on farms (%)
People in Group quarters - Job Corps and vocational training facilities (%)
People in Group quarters - Other workers' dormitories (%)
People in Group quarters - Crews of maritime vessels (%)
People in Group quarters - Other nonhousehold living situations (%)
People in Group quarters - Other noninstitutional group quarters (%)
Residents speaking English at home (%)
Residents speaking English at home - Born in the United States (%)
Residents speaking English at home - Native, born elsewhere (%)
Residents speaking English at home - Foreign born (%)
Residents speaking Spanish at home (%)
Residents speaking Spanish at home - Born in the United States (%)
Residents speaking Spanish at home - Native, born elsewhere (%)
Residents speaking Spanish at home - Foreign born (%)
Residents speaking other language at home (%)
Residents speaking other language at home - Born in the United States (%)
Residents speaking other language at home - Native, born elsewhere (%)
Residents speaking other language at home - Foreign born (%)
Class of Workers - Employee of private company (%)
Class of Workers - Self-employed in own incorporated business (%)
Class of Workers - Private not-for-profit wage and salary workers (%)
Class of Workers - Local government workers (%)
Class of Workers - State government workers (%)
Class of Workers - Federal government workers (%)
Class of Workers - Self-employed workers in own not incorporated business and Unpaid family workers (%)
House heating fuel used in houses and condos - Utility gas (%)
House heating fuel used in houses and condos - Bottled, tank, or LP gas (%)
House heating fuel used in houses and condos - Electricity (%)
House heating fuel used in houses and condos - Fuel oil, kerosene, etc. (%)
House heating fuel used in houses and condos - Coal or coke (%)
House heating fuel used in houses and condos - Wood (%)
House heating fuel used in houses and condos - Solar energy (%)
House heating fuel used in houses and condos - Other fuel (%)
House heating fuel used in houses and condos - No fuel used (%)
House heating fuel used in apartments - Utility gas (%)
House heating fuel used in apartments - Bottled, tank, or LP gas (%)
House heating fuel used in apartments - Electricity (%)
House heating fuel used in apartments - Fuel oil, kerosene, etc. (%)
House heating fuel used in apartments - Coal or coke (%)
House heating fuel used in apartments - Wood (%)
House heating fuel used in apartments - Solar energy (%)
House heating fuel used in apartments - Other fuel (%)
House heating fuel used in apartments - No fuel used (%)
Armed forces status - In Armed Forces (%)
Armed forces status - Civilian (%)
Armed forces status - Civilian - Veteran (%)
Armed forces status - Civilian - Nonveteran (%)
Fatal accidents locations in years 2005-2021
Fatal accidents locations in 2005
Fatal accidents locations in 2006
Fatal accidents locations in 2007
Fatal accidents locations in 2008
Fatal accidents locations in 2009
Fatal accidents locations in 2010
Fatal accidents locations in 2011
Fatal accidents locations in 2012
Fatal accidents locations in 2013
Fatal accidents locations in 2014
Fatal accidents locations in 2015
Fatal accidents locations in 2016
Fatal accidents locations in 2017
Fatal accidents locations in 2018
Fatal accidents locations in 2019
Fatal accidents locations in 2020
Fatal accidents locations in 2021
Alcohol use - People drinking some alcohol every month (%)
Alcohol use - People not drinking at all (%)
Alcohol use - Average days/month drinking alcohol
Alcohol use - Average drinks/week
Alcohol use - Average days/year people drink much
Audiometry - Average condition of hearing (%)
Audiometry - People that can hear a whisper from across a quiet room (%)
Audiometry - People that can hear normal voice from across a quiet room (%)
Audiometry - Ears ringing, roaring, buzzing (%)
Audiometry - Had a job exposure to loud noise (%)
Audiometry - Had off-work exposure to loud noise (%)
Blood Pressure & Cholesterol - Has high blood pressure (%)
Blood Pressure & Cholesterol - Checking blood pressure at home (%)
Blood Pressure & Cholesterol - Frequently checking blood cholesterol (%)
Blood Pressure & Cholesterol - Has high cholesterol level (%)
Consumer Behavior - Money monthly spent on food at supermarket/grocery store
Consumer Behavior - Money monthly spent on food at other stores
Consumer Behavior - Money monthly spent on eating out
Consumer Behavior - Money monthly spent on carryout/delivered foods
Consumer Behavior - Income spent on food at supermarket/grocery store (%)
Consumer Behavior - Income spent on food at other stores (%)
Consumer Behavior - Income spent on eating out (%)
Consumer Behavior - Income spent on carryout/delivered foods (%)
Current Health Status - General health condition (%)
Current Health Status - Blood donors (%)
Current Health Status - Has blood ever tested for HIV virus (%)
Current Health Status - Left-handed people (%)
Dermatology - People using sunscreen (%)
Diabetes - Diabetics (%)
Diabetes - Had a blood test for high blood sugar (%)
Diabetes - People taking insulin (%)
Diet Behavior & Nutrition - Diet health (%)
Diet Behavior & Nutrition - Milk product consumption (# of products/month)
Diet Behavior & Nutrition - Meals not home prepared (#/week)
Diet Behavior & Nutrition - Meals from fast food or pizza place (#/week)
Diet Behavior & Nutrition - Ready-to-eat foods (#/month)
Diet Behavior & Nutrition - Frozen meals/pizza (#/month)
Drug Use - People that ever used marijuana or hashish (%)
Drug Use - Ever used hard drugs (%)
Drug Use - Ever used any form of cocaine (%)
Drug Use - Ever used heroin (%)
Drug Use - Ever used methamphetamine (%)
Health Insurance - People covered by health insurance (%)
Kidney Conditions-Urology - Avg. # of times urinating at night
Medical Conditions - People with asthma (%)
Medical Conditions - People with anemia (%)
Medical Conditions - People with psoriasis (%)
Medical Conditions - People with overweight (%)
Medical Conditions - Elderly people having difficulties in thinking or remembering (%)
Medical Conditions - People who ever received blood transfusion (%)
Medical Conditions - People having trouble seeing even with glass/contacts (%)
Medical Conditions - People with arthritis (%)
Medical Conditions - People with gout (%)
Medical Conditions - People with congestive heart failure (%)
Medical Conditions - People with coronary heart disease (%)
Medical Conditions - People with angina pectoris (%)
Medical Conditions - People who ever had heart attack (%)
Medical Conditions - People who ever had stroke (%)
Medical Conditions - People with emphysema (%)
Medical Conditions - People with thyroid problem (%)
Medical Conditions - People with chronic bronchitis (%)
Medical Conditions - People with any liver condition (%)
Medical Conditions - People who ever had cancer or malignancy (%)
Mental Health - People who have little interest in doing things (%)
Mental Health - People feeling down, depressed, or hopeless (%)
Mental Health - People who have trouble sleeping or sleeping too much (%)
Mental Health - People feeling tired or having little energy (%)
Mental Health - People with poor appetite or overeating (%)
Mental Health - People feeling bad about themself (%)
Mental Health - People who have trouble concentrating on things (%)
Mental Health - People moving or speaking slowly or too fast (%)
Mental Health - People having thoughts they would be better off dead (%)
Oral Health - Average years since last visit a dentist
Oral Health - People embarrassed because of mouth (%)
Oral Health - People with gum disease (%)
Oral Health - General health of teeth and gums (%)
Oral Health - Average days a week using dental floss/device
Oral Health - Average days a week using mouthwash for dental problem
Oral Health - Average number of teeth
Pesticide Use - Households using pesticides to control insects (%)
Pesticide Use - Households using pesticides to kill weeds (%)
Physical Activity - People doing vigorous-intensity work activities (%)
Physical Activity - People doing moderate-intensity work activities (%)
Physical Activity - People walking or bicycling (%)
Physical Activity - People doing vigorous-intensity recreational activities (%)
Physical Activity - People doing moderate-intensity recreational activities (%)
Physical Activity - Average hours a day doing sedentary activities
Physical Activity - Average hours a day watching TV or videos
Physical Activity - Average hours a day using computer
Physical Functioning - People having limitations keeping them from working (%)
Physical Functioning - People limited in amount of work they can do (%)
Physical Functioning - People that need special equipment to walk (%)
Physical Functioning - People experiencing confusion/memory problems (%)
Physical Functioning - People requiring special healthcare equipment (%)
Prescription Medications - Average number of prescription medicines taking
Preventive Aspirin Use - Adults 40+ taking low-dose aspirin (%)
Reproductive Health - Vaginal deliveries (%)
Reproductive Health - Cesarean deliveries (%)
Reproductive Health - Deliveries resulted in a live birth (%)
Reproductive Health - Pregnancies resulted in a delivery (%)
Reproductive Health - Women breastfeeding newborns (%)
Reproductive Health - Women that had a hysterectomy (%)
Reproductive Health - Women that had both ovaries removed (%)
Reproductive Health - Women that have ever taken birth control pills (%)
Reproductive Health - Women taking birth control pills (%)
Reproductive Health - Women that have ever used Depo-Provera or injectables (%)
Reproductive Health - Women that have ever used female hormones (%)
Sexual Behavior - People 18+ that ever had sex (vaginal, anal, or oral) (%)
Sexual Behavior - Males 18+ that ever had vaginal sex with a woman (%)
Sexual Behavior - Males 18+ that ever performed oral sex on a woman (%)
Sexual Behavior - Males 18+ that ever had anal sex with a woman (%)
Sexual Behavior - Males 18+ that ever had any sex with a man (%)
Sexual Behavior - Females 18+ that ever had vaginal sex with a man (%)
Sexual Behavior - Females 18+ that ever performed oral sex on a man (%)
Sexual Behavior - Females 18+ that ever had anal sex with a man (%)
Sexual Behavior - Females 18+ that ever had any kind of sex with a woman (%)
Sexual Behavior - Average age people first had sex
Sexual Behavior - Average number of female sex partners in lifetime (males 18+)
Sexual Behavior - Average number of female vaginal sex partners in lifetime (males 18+)
Sexual Behavior - Average age people first performed oral sex on a woman (18+)
Sexual Behavior - Average number of woman performed oral sex on in lifetime (18+)
Sexual Behavior - Average number of male sex partners in lifetime (males 18+)
Sexual Behavior - Average number of male anal sex partners in lifetime (males 18+)
Sexual Behavior - Average age people first performed oral sex on a man (18+)
Sexual Behavior - Average number of male oral sex partners in lifetime (18+)
Sexual Behavior - People using protection when performing oral sex (%)
Sexual Behavior - Average number of times people have vaginal or anal sex a year
Sexual Behavior - People having sex without condom (%)
Sexual Behavior - Average number of male sex partners in lifetime (females 18+)
Sexual Behavior - Average number of male vaginal sex partners in lifetime (females 18+)
Sexual Behavior - Average number of female sex partners in lifetime (females 18+)
Sexual Behavior - Circumcised males 18+ (%)
Sleep Disorders - Average hours sleeping at night
Sleep Disorders - People that has trouble sleeping (%)
Smoking-Cigarette Use - People smoking cigarettes (%)
Taste & Smell - People 40+ having problems with smell (%)
Taste & Smell - People 40+ having problems with taste (%)
Taste & Smell - People 40+ that ever had wisdom teeth removed (%)
Taste & Smell - People 40+ that ever had tonsils teeth removed (%)
Taste & Smell - People 40+ that ever had a loss of consciousness because of a head injury (%)
Taste & Smell - People 40+ that ever had a broken nose or other serious injury to face or skull (%)
Taste & Smell - People 40+ that ever had two or more sinus infections (%)
Weight - Average height (inches)
Weight - Average weight (pounds)
Weight - Average BMI
Weight - People that are obese (%)
Weight - People that ever were obese (%)
Weight - People trying to lose weight (%)
Officers per 1,000 residents here:
4.14Florida average:
2.33
Latest news from Holmes Beach, FL collected exclusively by city-data.com from local newspapers, TV, and radio stations
Ancestries: Italian (13.3%), American (11.7%), Irish (10.9%), English (10.5%), European (8.3%), German (7.5%).
Current Local Time:
Land area: 1.62 square miles.
Population density: 1,877 people per square mile (low).
425 residents are foreign born (8.0% Europe , 3.7% North America ).
This city:
13.0%Florida:
21.1%
Median real estate property taxes paid for housing units with mortgages in 2022: $7,339 (0.8%)Median real estate property taxes paid for housing units with no mortgage in 2022: $7,668 (1.0%)
Nearest city with pop. 50,000+: Sarasota, FL
Nearest city with pop. 200,000+: St. Petersburg, FL
Nearest city with pop. 1,000,000+: Houston, TX
Nearest cities:
Latitude: 27.51 N, Longitude: 82.72 W
Area code commonly used in this area: 941
Single-family new house construction building permits:
2022: 28 buildings , average cost: $1,019,7002021: 23 buildings , average cost: $889,2002020: 15 buildings , average cost: $808,3002019: 19 buildings , average cost: $750,2002018: 24 buildings , average cost: $528,0002017: 19 buildings , average cost: $623,5002016: 17 buildings , average cost: $611,1002015: 16 buildings , average cost: $395,4002014: 25 buildings , average cost: $456,2002013: 19 buildings , average cost: $448,9002012: 15 buildings , average cost: $368,5002011: 24 buildings , average cost: $264,2002010: 26 buildings , average cost: $377,0002009: 18 buildings , average cost: $299,0002008: 62 buildings , average cost: $210,0002007: 12 buildings , average cost: $448,8002006: 25 buildings , average cost: $350,5002005: 39 buildings , average cost: $326,3002004: 22 buildings , average cost: $260,7002003: 20 buildings , average cost: $214,4002002: 21 buildings , average cost: $243,3002001: 8 buildings , average cost: $336,2002000: 28 buildings , average cost: $134,8001999: 9 buildings , average cost: $122,6001998: 8 buildings , average cost: $110,2001997: 9 buildings , average cost: $162,500Unemployment in December 2023:
Population change in the 1990s: +106 (+2.2%).
Most common occupations in Holmes Beach, FL (%)
Both Males Females
Other sales and related occupations, including supervisors (6.8%)
Other management occupations, except farmers and farm managers (6.5%)
Waiters and waitresses (5.1%)
Other office and administrative support workers, including supervisors (4.9%)
Building and grounds cleaning and maintenance occupations (4.4%)
Retail sales workers, except cashiers (3.4%)
Sales representatives, services, wholesale and manufacturing (3.3%)
Other sales and related occupations, including supervisors (8.4%)
Sales representatives, services, wholesale and manufacturing (5.2%)
Other management occupations, except farmers and farm managers (5.2%)
Other food preparation and serving workers, including supervisors (4.2%)
Top executives (4.1%)
Building and grounds cleaning and maintenance occupations (4.1%)
Carpenters (3.8%)
Other office and administrative support workers, including supervisors (8.5%)
Waiters and waitresses (7.9%)
Other management occupations, except farmers and farm managers (7.8%)
Other sales and related occupations, including supervisors (5.2%)
Secretaries and administrative assistants (4.8%)
Building and grounds cleaning and maintenance occupations (4.8%)
Retail sales workers, except cashiers (3.9%)
Tornado activity:
Holmes Beach-area historical tornado activity is slightly above Florida state average. It is 19% greater than the overall U.S. average.
On 4/4/1966, a category F4 (max. wind speeds 207-260 mph) tornado 28.8 miles away from the Holmes Beach city center killed 11 people and injured 530 people and caused between $5,000,000 and $50,000,000 in damages.
On 10/31/1958, a category F3 (max. wind speeds 158-206 mph) tornado 5.4 miles away from the city center injured 4 people and caused between $5000 and $50,000 in damages.
Earthquake activity:
Holmes Beach-area historical earthquake activity is significantly above Florida state average. It is 90% smaller than the overall U.S. average. On 9/10/2006 at 14:56:08, a magnitude 5.9 (5.9 MB, 5.5 MS, 5.8 MW, Class: Moderate, Intensity: VI - VII) earthquake occurred 256.7 miles away from Holmes Beach center On 10/24/1997 at 08:35:17, a magnitude 4.9 (4.8 MB, 4.2 MS, 4.9 LG, Depth: 6.2 mi, Class: Light, Intensity: IV - V) earthquake occurred 371.4 miles away from the city center On 3/31/1992 at 14:59:39, a magnitude 3.8 (3.8 MB, Depth: 3.1 mi, Class: Light, Intensity: II - III) earthquake occurred 212.8 miles away from Holmes Beach center On 5/6/2018 at 16:47:09, a magnitude 4.6 (4.6 MB, Depth: 6.2 mi) earthquake occurred 366.0 miles away from Holmes Beach center On 4/18/1997 at 14:57:35, a magnitude 3.9 (3.9 MB, Depth: 20.5 mi) earthquake occurred 265.5 miles away from Holmes Beach center On 11/22/1974 at 05:25:55, a magnitude 4.7 (4.7 MB) earthquake occurred 403.2 miles away from the city center Magnitude types: regional Lg-wave magnitude (LG), body-wave magnitude (MB), surface-wave magnitude (MS), moment magnitude (MW) Natural disasters: The number of natural disasters in Manatee County (27) is a lot greater than the US average (15).Major Disasters (Presidential) Declared: 18Emergencies Declared: 5Hurricanes: 11, Tropical Storms: 6, Floods: 5, Fires: 4, Storms: 4, Tornadoes: 2, Freeze: 1, Wind: 1, Other: 1 (Note: some incidents may be assigned to more than one category). Hospitals and medical centers near Holmes Beach: NURSING CENTER AT FREEDOM VILLAGE, THE (Nursing Home, about 6 miles away; BRADENTON, FL)
CASA MORA REHABILITATION AND EXTENDED CARE (Nursing Home, about 7 miles away; BRADENTON, FL)
BLAKE MEDICAL CENTER (about 7 miles away; BRADENTON, FL)
BRADENTON DIALYSIS CENTER LLC (Dialysis Facility, about 7 miles away; BRADENTON, FL)
HERITAGE PARK CARE AND REHABILITATION CENTER (Nursing Home, about 7 miles away; BRADENTON, FL)
SURREY PLACE HEALTHCARE AND REHABILITATION (Nursing Home, about 7 miles away; BRADENTON, FL)
BRADENTON HEALTH CARE (Nursing Home, about 7 miles away; BRADENTON, FL)
Amtrak station near Holmes Beach: 16 miles: BRADENTON (I-75 & RTE. 64) - Bus Station Services: public payphones, call for taxi service.
Colleges/universities with over 2000 students nearest to Holmes Beach:
State College of Florida-Manatee-Sarasota (about 10 miles; Bradenton, FL ; Full-time enrollment: 8,012)
Eckerd College (about 15 miles; Saint Petersburg, FL ; FT enrollment: 2,437)
University of South Florida-St Petersburg (about 19 miles; St. Petersburg, FL ; FT enrollment: 4,459)
St Petersburg College (about 28 miles; Clearwater, FL ; FT enrollment: 21,467)
Hillsborough Community College (about 34 miles; Tampa, FL ; FT enrollment: 19,838)
The University of Tampa (about 34 miles; Tampa, FL ; FT enrollment: 7,216)
Strayer University-Florida (about 35 miles; Tampa, FL ; FT enrollment: 2,723)
Public elementary/middle school in Holmes Beach:
See full list of schools located in Holmes Beach
Notable locations in Holmes Beach: (A) , West Manatee Fire and Rescue Station 1 (B) , Holmes Beach Police Department (C) , West Manatee Fire and Rescue Department (D) . Display/hide their locations on the map
Church in Holmes Beach: (A) . Display/hide its location on the map
Beach: (A) . Display/hide its location on the map
Tourist attraction:
Hotels:
Manatee County has a predicted average indoor radon screening level less than 2 pCi/L (pico curies per liter) - Low Potential Average household size: This city:
1.9 peopleFlorida:
2.5 people
Percentage of family households: This city:
56.9%Whole state:
65.2%
Percentage of households with unmarried partners: This city:
7.3%Whole state:
7.3%
Likely homosexual households (counted as self-reported same-sex unmarried-partner households)
Lesbian couples: 0.6% of all households Gay men: 0.6% of all households
Banks with branches in Holmes Beach (2011 data):
Whitney Bank: Island Branch at 5324 Gulf Drive, branch established on 1994/11/01. Info updated 2011/06/14: Bank assets: $14,882.3 mil, Deposits: $11,630.0 mil, headquarters in New Orleans, LA, positive income , Commercial Lending Specialization, 189 total offices , Holding Company: Hancock Holding Company
Regions Bank: Anna Maria Island Branch at 3900 6th Avenue, branch established on 2007/02/26. Info updated 2011/02/24: Bank assets: $123,368.2 mil, Deposits: $98,301.3 mil, headquarters in Birmingham, AL, positive income , Commercial Lending Specialization, 1778 total offices , Holding Company: Regions Financial Corporation
Bank of America, National Association: Beaches Branch at 699 Manatee Avenue, branch established on 1984/01/27. Info updated 2009/11/18: Bank assets: $1,451,969.3 mil, Deposits: $1,077,176.8 mil, headquarters in Charlotte, NC, positive income , 5782 total offices , Holding Company: Bank Of America Corporation
Wells Fargo Bank, National Association: Holmes Beach Branch at 5327 Gulf Drive, branch established on 1961/04/25. Info updated 2011/04/05: Bank assets: $1,161,490.0 mil, Deposits: $905,653.0 mil, headquarters in Sioux Falls, SD, positive income , 6395 total offices , Holding Company: Wells Fargo & Company
For population 15 years and over in Holmes Beach:
Never married: 6.1%Now married: 70.7%Separated: 1.0%Widowed: 9.3%Divorced: 12.9% For population 25 years and over in Holmes Beach:
High school or higher: 98.4%Bachelor's degree or higher: 61.9%Graduate or professional degree: 28.7%Unemployed: 3.1%Mean travel time to work (commute): 23.8 minutes
Education Gini index (Inequality in education) Here:
9.0Florida average:
12.2
Religion statistics for Holmes Beach, FL (based on Manatee County data)
Religion Adherents Congregations Catholic 50,700 9 Evangelical Protestant 48,255 158 Mainline Protestant 17,180 40 Black Protestant 2,519 18 Other 2,347 17 Orthodox 960 2 None 200,872 -
Source: Clifford Grammich, Kirk Hadaway, Richard Houseal, Dale E.Jones, Alexei Krindatch, Richie Stanley and Richard H.Taylor. 2012. 2010 U.S.Religion Census: Religious Congregations & Membership Study. Association of Statisticians of American Religious Bodies. Jones, Dale E., et al. 2002. Congregations and Membership in the United States 2000. Nashville, TN: Glenmary Research Center. Graphs represent county-level data
Food Environment Statistics: Number of grocery stores : 63Manatee County :
2.01 / 10,000 pop.State :
2.04 / 10,000 pop.
Number of supercenters and club stores : 4Manatee County :
0.13 / 10,000 pop.Florida :
0.11 / 10,000 pop.
Number of convenience stores (no gas) : 44This county :
1.40 / 10,000 pop.Florida :
1.28 / 10,000 pop.
Number of convenience stores (with gas) : 73Manatee County :
2.32 / 10,000 pop.Florida :
3.04 / 10,000 pop.
Number of full-service restaurants : 211This county :
6.72 / 10,000 pop.Florida :
7.45 / 10,000 pop.
Adult diabetes rate : Manatee County :
9.1%State :
9.2%
Low-income preschool obesity rate : This county :
19.8%Florida :
14.0%
Health and Nutrition: Healthy diet rate : Holmes Beach:
55.9%Florida:
51.4%
Average overall health of teeth and gums : This city:
50.6%State:
49.4%
Average BMI : Holmes Beach:
28.5Florida:
28.6
People feeling badly about themselves : Holmes Beach:
19.3%Florida:
19.5%
People not drinking alcohol at all : This city:
4.9%Florida:
10.7%
Average hours sleeping at night : Overweight people : Holmes Beach:
32.3%State:
34.7%
General health condition : Holmes Beach:
59.0%Florida:
57.0%
Average condition of hearing : This city:
72.7%Florida:
79.2%
More about Health and Nutrition of Holmes Beach, FL Residents
Local government employment and payroll (March 2022)
Function
Full-time employees
Monthly full-time payroll
Average yearly full-time wage
Part-time employees
Monthly part-time payroll
Police Protection - Officers
18 $114,156 $76,104 0 $0 Streets and Highways
13 $59,163 $54,612 0 $0 Other and Unallocable
10 $65,267 $78,320 0 $0 Other Government Administration
8 $20,193 $30,290 1 $849 Police - Other
7 $28,490 $48,840 0 $0 Financial Administration
2 $16,338 $98,028 0 $0
Totals for Government
58 $303,607 $62,815 1 $849
Holmes Beach government finances - Expenditure in 2017 (per resident):
Construction - Regular Highways: $220,000 ($72.30)
Current Operations - Police Protection: $2,881,000 ($946.76)
Natural Resources - Other: $1,629,000 ($535.33)Financial Administration: $849,000 ($279.00)Regular Highways: $121,000 ($39.76)Other Capital Outlay - Natural Resources - Other: $457,000 ($150.18)
Police Protection: $56,000 ($18.40)Financial Administration: $15,000 ($4.93)
Holmes Beach government finances - Revenue in 2017 (per resident):
Charges - Other: $14,000 ($4.60)
Miscellaneous - Fines and Forfeits: $108,000 ($35.49)
General Revenue - Other: $98,000 ($32.21)Donations From Private Sources: $54,000 ($17.75)Interest Earnings: $24,000 ($7.89)State Intergovernmental - Other: $523,000 ($171.87)
General Local Government Support: $438,000 ($143.94)Tax - Property: $3,378,000 ($1110.09)
Other License: $1,047,000 ($344.07)Occupation and Business License - Other: $603,000 ($198.16)Public Utilities Sales: $451,000 ($148.21)Motor Fuels Sales: $239,000 ($78.54)Other Selective Sales: $119,000 ($39.11)Insurance Premiums Sales: $43,000 ($14.13)
Holmes Beach government finances - Cash and Securities in 2017 (per resident):
Other Funds - Cash and Securities: $3,556,000 ($1168.58)
11.28% of this county's 2021 resident taxpayers lived in other counties in 2020 ($111,415 average adjusted gross income )
Here:
11.28%Florida average:
8.80%
0.02% of residents moved from foreign countries ($122 average AGI )Manatee County:
0.02%Florida average:
0.05%
Top counties from which taxpayers relocated into this county between 2020 and 2021:
7.71% of this county's 2020 resident taxpayers moved to other counties in 2021 ($72,040 average adjusted gross income )
Here:
7.71%Florida average:
7.45%
0.02% of residents moved to foreign countries ($96 average AGI )Manatee County:
0.02%Florida average:
0.04%
Top counties to which taxpayers relocated from this county between 2020 and 2021:
Businesses in Holmes Beach, FL
Name Count Name Count
Ace Hardware 1 Publix Super Markets 1 Domino's Pizza 1 Subway 1 FedEx 2 True Value 1 Goodwill 2 UPS 2
Strongest AM radio stations in Holmes Beach:
WMGG (820 AM; 50 kW; LARGO, FL; Owner: MEGA COMMUNICATIONS OF ST. PETERSBURG LICENSEE)
WQYK (1010 AM; 50 kW; SEFFNER, FL; Owner: INFINITY BROADCASTING CORPORATION OF TAMPA)
WBRD (1420 AM; 2 kW; PALMETTO, FL; Owner: METROPOLITAN RADIO GROUP, INC.)
WFLA (970 AM; 25 kW; TAMPA, FL; Owner: CITICASTERS LICENSES, L.P.)
WHNZ (1250 AM; 25 kW; TAMPA, FL; Owner: CITICASTERS LICENSES, L.P.)
WTIS (1110 AM; daytime; 10 kW; TAMPA, FL; Owner: WTIS-AM, INC.)
WRXB (1590 AM; 5 kW; ST. PETERSBURG BEACH, FL; Owner: METROPOLITAN RADIO GROUP OF FLORIDA, INC.)
WFLF (540 AM; 50 kW; PINE HILLS, FL; Owner: CLEAR CHANNEL BROADCASTING LICENSES, INC.)
WDAE (620 AM; 5 kW; ST. PETERSBURG, FL; Owner: CLEAR CHANNEL BROADCASTING LICENSES, INC.)
WLSS (930 AM; 5 kW; SARASOTA, FL; Owner: WGUL-FM, INC.)
WWPR (1490 AM; 1 kW; BRADENTON, FL; Owner: GREENROSE BROADCASTING SERVICES, INC)
WIBQ (1220 AM; 5 kW; SARASOTA, FL; Owner: NOVA BROADCASTING COMPANY)
WQTM (740 AM; 50 kW; ORLANDO, FL; Owner: CLEAR CHANNEL BROADCASTING LICENSES, INC.)
Strongest FM radio stations in Holmes Beach:
WHPT (102.5 FM; SARASOTA, FL; Owner: CXR HOLDINGS, INC.)
WCTQ (106.5 FM; SARASOTA, FL; Owner: CITICASTERS LICENSES, L.P.)
WLLD (98.7 FM; HOLMES BEACH, FL; Owner: INFINITY RADIO OPERATIONS INC.)
WPOI (101.5 FM; ST. PETERSBURG, FL; Owner: CXR HOLDINGS, INC.)
WWRM (94.9 FM; TAMPA, FL; Owner: COX RADIO, INC.)
WRBQ-FM (104.7 FM; TAMPA, FL; Owner: INFINITY RADIO OPERATIONS INC.)
WFLZ-FM (93.3 FM; TAMPA, FL; Owner: CITICASTERS LICENSES, L.P.)
WMTX (100.7 FM; TAMPA, FL; Owner: CITICASTERS LICENSES, L.P.)
WQYK-FM (99.5 FM; ST. PETERSBURG, FL; Owner: INFINITY BROADCASTING CORPORATION OF FLORIDA)
WTBT (103.5 FM; BRADENTON, FL; Owner: CITICASTERS LICENSES, L.P.)
WSJT (94.1 FM; LAKELAND, FL; Owner: INFINITY RADIO OPERATIONS INC.)
WSSR (95.7 FM; CLEARWATER, FL; Owner: CLEAR CHANNEL BROADCASTING LICENSES, INC.)
WXTB (97.9 FM; CLEARWATER, FL; Owner: CITICASTERS LICENSES, L.P.)
WBVM (90.5 FM; TAMPA, FL; Owner: BISHOP OF THE DIOCESE/ST. PETERSBURG)
WUSF (89.7 FM; TAMPA, FL; Owner: UNIVERSITY OF S. FLORIDA)
WYUU (92.5 FM; SAFETY HARBOR, FL; Owner: INFINITY RADIO OPERATIONS INC.)
WDUV (105.5 FM; NEW PORT RICHEY, FL; Owner: CXR HOLDINGS, INC.)
WBBY (107.3 FM; ST. PETERSBURG, FL; Owner: COX RADIO, INC.)
WSRZ-FM (107.9 FM; CORAL COVE, FL; Owner: CITICASTERS LICENSES, L.P.)
WFTI-FM (91.7 FM; ST. PETERSBURG, FL; Owner: FAMILY STATIONS, INC.)
TV broadcast stations around Holmes Beach:
WSVT-LP (Channel 18; BRADENTON, FL; Owner: WORD OF GOD FELLOWSHIP, INC.)
WEDU (Channel 3; TAMPA, FL; Owner: FLORIDA WEST COAST PUBLIC BROADCASTING, INC.)
WXPX (Channel 66; BRADENTON, FL; Owner: PAXSON COMMUNICATION LICENSE COMPANY, LLC)
WVEA-TV (Channel 62; VENICE, FL; Owner: ENTRAVISION HOLDINGS, LLC)
WTOG (Channel 44; ST. PETERSBURG, FL; Owner: VIACOM INTERNATIONAL INC.)
WFLA-TV (Channel 8; TAMPA, FL; Owner: MEDIA GENERAL COMMUNICATIONS, INC.)
WFTS-TV (Channel 28; TAMPA, FL; Owner: TAMPA BAY TELEVISION, INC.)
WWSB (Channel 40; SARASOTA, FL; Owner: SOUTHERN BROADCAST CORPORATION OF SARASOTA)
WUSF-TV (Channel 16; TAMPA, FL; Owner: UNIVERSITY OF SOUTH FLORIDA)
WTTA (Channel 38; ST. PETERSBURG, FL; Owner: BAY TELEVISION, INC.)
WFTT (Channel 50; TAMPA, FL; Owner: TELEFUTURA TAMPA LLC)
WTVT (Channel 13; TAMPA, FL; Owner: TVT LICENSE, INC.)
WCLF (Channel 22; CLEARWATER, FL; Owner: CHRISTIAN TELEVISION CORPORATION, INC.)
W61AI (Channel 61; ROCK HARBOR, FL; Owner: MAKO COMMUNICATIONS, LLC)
WTAM-LP (Channel 6; TAMPA, FL; Owner: U.S. INTERACTIVE, L.L.C.)
W33CC (Channel 33; ST. PETERSBURG, FL; Owner: VENTANA TELEVISION, INC.)
WTSP (Channel 10; ST. PETERSBURG, FL; Owner: PACIFIC AND SOUTHERN COMPANY, INC.)
W34AW (Channel 34; SARASOTA, FL; Owner: THREE ANGELS BROADCASTING NETWORK, INC.)
W48CN (Channel 48; SARASOTA, FL; Owner: NATIONAL MINORITY T.V., INC.)
WMOR-TV (Channel 32; LAKELAND, FL; Owner: WMOR-TV COMPANY)
WSPF-CA (Channel 35; ST. PETERSBURG, FL; Owner: CITY OF ST. PETERSBURG)
WARP-CA (Channel 20; TAMPA-ST. PETERSBURG, FL; Owner: SUNSHINE BROADCASTING COMPANY, INC.)
WXAX-LP (Channel 26; CLEARWATER, FL; Owner: TIGER EYE BROADCASTING CORP.)
WRMD-LP (Channel 57; TAMPA, FL; Owner: ZGS TELEVISION OF TAMPA, INC.)
W56EB (Channel 56; TAMPA, FL; Owner: TRINITY BROADCASTING NETWORK)
National Bridge Inventory (NBI) Statistics 1 Number of bridges16ft / 4.6m Total length300 Total average daily traffic3 Total average daily truck traffic521 Total future (year 2042) average daily traffic
FCC Registered Cell Phone Towers: 1
5910 Marina Drive (7541) (Lat: 27.510583 Lon: -82.715667), Type: Mtower, Structure height: 48.8 m, Call Sign: KNKA647Assigned Frequencies: 869.040 MHz, 869.040 MHz, 869.040 MHz, 824.040 MHz, 824.040 MHz, 824.040 MHz, 890.010 MHz, 890.010 MHz, 890.010 MHz, 845.010 MHz, 845.010 MHz, 845.010 MHzGrant Date: 08/29/2017, Expiration Date: 10/01/2027, Certifier: Michael P GogginRegistrant: At&t Services, Inc., 208 S Akard St, 20f, Dallas, TX 75202, Phone: (855) 699-7073, Fax: (214) 746-6410, Email:
FCC Registered Antenna Towers: 3
JOAN ROBBINS, 5910 Marina Drive (Lat: 27.510556 Lon: -82.715556), Type: 53.3, Overall height: 45.7 m, Registrant: Gte Service Corporation, Scarmel@dcoffice.Gte.Com, , Washi-ngton, Phone: (202) 463-5295 JOAN ROBBINS, 5910 Marina Drive (Lat: 27.510556 Lon: -82.715556), Type: 53.3, Overall height: 45.7 m, Registrant: Gte Service Corporation, Scarmel@dcoffice.Gte.Com, , Washi-ngton, Phone: (202) 463-5295 Jerri L Janjua, 5910 Marina Drive (Lat: 27.510556 Lon: -82.715556), Type: 53.3, Overall height: 45.7 m, Registrant: Gte Service Corporation, Scarmel@dcoffice.Gte.Com, , Washi-ngton, Phone: (202) 463-5295 FCC Registered Broadcast Land Mobile Towers: 4
5901 Marina Dr (Lat: 27.507250 Lon: -82.717056), Call Sign: KXO907, Assigned Frequencies: 155.985 MHz, Grant Date: 06/07/2011, Expiration Date: 09/02/2021, Cancellation Date: 11/06/2021, Registrant: City Of Holmes Beach, 5801 Marina Drive, Holmes Beach, FL 34217, Phone: (941) 708-5833, Fax: (941) 708-5812, Email:
5901 Marina Dr (Lat: 27.510583 Lon: -82.715389), Call Sign: KZC405, Assigned Frequencies: 154.860 MHz, 154.950 MHz, 155.370 MHz, Grant Date: 08/29/1996, Expiration Date: 10/10/2001, Cancellation Date: 03/10/2002, Registrant: Anna Maria, Island Of, 5901 Marina Dr, Holmes Beach, FL 33501, Phone: (813) 778-2221 6900 Holmes Blvd (Lat: 27.514750 Lon: -82.721500), Structure height: 12 m, Call Sign: WPEK912, Assigned Frequencies: 452.275 MHz, Grant Date: 01/13/2004, Expiration Date: 03/18/2014, Cancellation Date: 10/03/2005, Registrant: Data Flow Systems, Inc., 605 North John Rodes Blvd., Melbourne, FL 32934-9105, Phone: (321) 259-5009, Fax: (321) 259-4006, Email:
Lat: 27.501944 Lon: -82.712861, Call Sign: WQEJ899, Assigned Frequencies: 451.462 MHz, 456.462 MHz, 452.137 MHz, Grant Date: 01/20/2016, Expiration Date: 02/15/2026, Certifier: Kathy Hayes, Registrant: Manatee County School District, One Matzke Way, Bradenton, FL 34208, Phone: (941) 708-8800, Fax: (941) 708-8844, Email:
FCC Registered Maritime Coast & Aviation Ground Towers: 2
Brdg Tenders Cntrl Hse Anna Maria Bridge On Sr64 Over Intracoastal Waterway (Lat: 27.496694 Lon: -82.694833), Type: Building, Overall height: 4 m, Call Sign: WHW343, Assigned Frequencies: 156.650 MHz, 156.800 MHz, 156.450 MHz, 156.600 MHz, Grant Date: 04/02/2021, Expiration Date: 06/21/2031, Registrant: State Of Florida, 605 Suwannee Street, Ms 90, Tallahassee, FL 32399-0450, Phone: (850) 410-5600, Fax: (850) 410-5601, Email:
Lat: 27.507861 Lon: -82.713250, Call Sign: WQZX886, Assigned Frequencies: 156.475 MHz, 156.800 MHz, 156.575 MHz, 156.925 MHz, Grant Date: 09/01/2017, Expiration Date: 09/01/2027, Certifier: Sandy L Zinck, Registrant: Mainsail Ami Marina Lllp, 4602 Eisenhower Blvd, Tampa, FL 33634, Phone: (813) 849-4114, Email:
FCC Registered Amateur Radio Licenses: 37 (
See the full list of FCC Registered Amateur Radio Licenses in Holmes Beach )
FAA Registered Aircraft: 5
Aircraft: CESSNA 195A (Category: Land, Seats: 5, Weight: Up to 12,499 Pounds, Speed: 146 mph), Engine: JACOBS L4 /R755-7 (245 HP) (Reciprocating)N-Number: 1082D, N1082D, N-1082D, Serial Number: 7694, Year manufactured: 1951, Airworthiness Date: 10/25/1955, Certificate Issue Date: 07/25/2013Registrant (Individual): Curtis F Simonye, Po Box 1937, Holmes Beach, FL 34218Aircraft: WALEN THORP T-18 (Category: Land, Weight: Up to 12,499 Pounds, Speed: 97 mph), Engine: LYCOMING O&VO-360 SER (180 HP) (Reciprocating)N-Number: 11RW, N11RW, N-11RW, Serial Number: 336, Year manufactured: 1970, Airworthiness Date: 05/13/1976, Certificate Issue Date: 01/11/2006Registrant (Individual): Curtis F Simonye, Po Box 1937, Holmes Beach, FL 34218Aircraft: MOONEY M20E (Category: Land, Seats: 4, Weight: Up to 12,499 Pounds, Speed: 127 mph), Engine: LYCOMING I0360 SER (180 HP) (Reciprocating)N-Number: 1952Y, N1952Y, N-1952Y, Serial Number: 259, Year manufactured: 1964, Airworthiness Date: 02/24/1964, Certificate Issue Date: 05/22/2000Registrant (Co-Owned): Jeffrey M Trustee Mcmaster, 600 Manatee Ave Apt 126, Holmes Beach, FL 34217, Other Owners: Teresa D Trustee McmasterAircraft: CHAMPION 7FC (Category: Land, Seats: 2, Weight: Up to 12,499 Pounds, Speed: 90 mph), Engine: CONT MOTOR C90 SERIES (95 HP) (Reciprocating)N-Number: 7513B, N7513B, N-7513B, Serial Number: 7FC-17, Year manufactured: 1957, Airworthiness Date: 04/30/1957, Certificate Issue Date: 10/07/2019Registrant (Individual): Kent A Wood, 109 49th St, Holmes Beach, FL 34217Aircraft: CESSNA 182E (Category: Land, Seats: 4, Weight: Up to 12,499 Pounds, Speed: 119 mph), Engine: CONT MOTOR O-470 SERIES (230 HP) (Reciprocating)N-Number: 9270X, N9270X, N-9270X, Serial Number: 18253670, Year manufactured: 1961, Airworthiness Date: 01/11/1962, Certificate Issue Date: 01/04/1989Registrant (Corporation): Skylane Corporation, 528 56th St, Holmes Beach, FL 34217
Home Mortgage Disclosure Act Aggregated Statistics For Year 2009(Based on 2 partial tracts) A) FHA, FSA/RHS & VA B) Conventional C) Refinancings D) Home Improvement Loans F) Non-occupant Loans on Number Average Value Number Average Value Number Average Value Number Average Value Number Average Value
LOANS ORIGINATED 1 $221,470 62 $321,605 85 $285,107 2 $114,980 82 $317,731 APPLICATIONS APPROVED, NOT ACCEPTED 0 $0 5 $460,886 10 $282,943 0 $0 9 $394,076 APPLICATIONS DENIED 2 $302,405 20 $314,474 49 $317,001 0 $0 40 $328,468 APPLICATIONS WITHDRAWN 1 $171,170 9 $325,049 24 $289,500 0 $0 14 $294,733 FILES CLOSED FOR INCOMPLETENESS 0 $0 1 $365,070 5 $285,232 0 $0 1 $408,020
Aggregated Statistics For Year 2008(Based on 2 partial tracts) B) Conventional C) Refinancings D) Home Improvement Loans E) Loans on Dwellings For 5+ Families F) Non-occupant Loans on Number Average Value Number Average Value Number Average Value Number Average Value Number Average Value
LOANS ORIGINATED 55 $419,164 61 $339,331 4 $265,055 1 $211,660 77 $364,915 APPLICATIONS APPROVED, NOT ACCEPTED 8 $338,815 13 $301,456 0 $0 0 $0 7 $380,289 APPLICATIONS DENIED 18 $445,923 42 $510,727 6 $141,265 0 $0 30 $437,455 APPLICATIONS WITHDRAWN 10 $376,788 18 $383,696 0 $0 0 $0 14 $408,676 FILES CLOSED FOR INCOMPLETENESS 5 $588,450 5 $460,374 0 $0 0 $0 6 $487,798
Aggregated Statistics For Year 2007(Based on 2 partial tracts) B) Conventional C) Refinancings D) Home Improvement Loans E) Loans on Dwellings For 5+ Families F) Non-occupant Loans on G) Loans On Manufactured Number Average Value Number Average Value Number Average Value Number Average Value Number Average Value Number Average Value
LOANS ORIGINATED 81 $430,258 94 $422,236 8 $474,979 1 $2,289,340 110 $429,504 0 $0 APPLICATIONS APPROVED, NOT ACCEPTED 8 $477,136 19 $539,047 2 $405,325 0 $0 14 $432,481 0 $0 APPLICATIONS DENIED 18 $439,606 42 $506,711 5 $346,348 0 $0 27 $416,782 1 $63,640 APPLICATIONS WITHDRAWN 10 $522,874 27 $538,633 1 $575,300 0 $0 15 $471,481 0 $0 FILES CLOSED FOR INCOMPLETENESS 3 $763,400 8 $503,989 1 $560,130 0 $0 7 $488,200 0 $0
Aggregated Statistics For Year 2006(Based on 2 partial tracts) A) FHA, FSA/RHS & VA B) Conventional C) Refinancings D) Home Improvement Loans F) Non-occupant Loans on G) Loans On Manufactured Number Average Value Number Average Value Number Average Value Number Average Value Number Average Value Number Average Value
LOANS ORIGINATED 0 $0 80 $575,986 115 $482,054 12 $262,095 102 $516,855 1 $33,170 APPLICATIONS APPROVED, NOT ACCEPTED 1 $26,990 12 $631,098 27 $393,973 3 $127,247 20 $432,370 1 $34,040 APPLICATIONS DENIED 0 $0 21 $468,560 50 $555,106 7 $193,900 35 $491,953 0 $0 APPLICATIONS WITHDRAWN 0 $0 11 $583,179 29 $443,993 1 $94,480 18 $546,486 0 $0 FILES CLOSED FOR INCOMPLETENESS 0 $0 3 $496,133 7 $484,319 0 $0 5 $562,296 0 $0
Aggregated Statistics For Year 2005(Based on 2 partial tracts) B) Conventional C) Refinancings D) Home Improvement Loans E) Loans on Dwellings For 5+ Families F) Non-occupant Loans on G) Loans On Manufactured Number Average Value Number Average Value Number Average Value Number Average Value Number Average Value Number Average Value
LOANS ORIGINATED 224 $477,126 115 $384,406 7 $282,374 2 $552,975 205 $466,894 1 $118,540 APPLICATIONS APPROVED, NOT ACCEPTED 17 $395,000 14 $305,959 0 $0 0 $0 16 $396,095 0 $0 APPLICATIONS DENIED 55 $519,917 28 $431,693 5 $341,942 0 $0 43 $531,257 1 $90,440 APPLICATIONS WITHDRAWN 31 $636,612 26 $383,678 1 $487,870 0 $0 26 $538,040 0 $0 FILES CLOSED FOR INCOMPLETENESS 7 $426,413 8 $407,048 0 $0 0 $0 5 $501,096 0 $0
Aggregated Statistics For Year 2004(Based on 2 partial tracts) B) Conventional C) Refinancings D) Home Improvement Loans F) Non-occupant Loans on G) Loans On Manufactured Number Average Value Number Average Value Number Average Value Number Average Value Number Average Value
LOANS ORIGINATED 162 $393,613 123 $291,638 12 $306,022 162 $353,951 1 $72,610 APPLICATIONS APPROVED, NOT ACCEPTED 16 $414,276 18 $256,779 3 $312,477 15 $327,235 0 $0 APPLICATIONS DENIED 21 $350,691 33 $340,857 6 $407,128 21 $308,608 1 $76,260 APPLICATIONS WITHDRAWN 12 $388,824 22 $368,779 2 $116,425 13 $374,771 0 $0 FILES CLOSED FOR INCOMPLETENESS 2 $291,540 8 $399,322 1 $15,340 2 $437,665 0 $0
Aggregated Statistics For Year 2003(Based on 2 partial tracts) A) FHA, FSA/RHS & VA B) Conventional C) Refinancings D) Home Improvement Loans F) Non-occupant Loans on Number Average Value Number Average Value Number Average Value Number Average Value Number Average Value
LOANS ORIGINATED 0 $0 139 $326,482 324 $226,484 7 $67,641 227 $270,458 APPLICATIONS APPROVED, NOT ACCEPTED 0 $0 6 $241,610 38 $206,418 1 $92,030 19 $217,943 APPLICATIONS DENIED 0 $0 16 $301,131 55 $286,666 3 $168,250 24 $327,446 APPLICATIONS WITHDRAWN 1 $76,690 8 $316,599 28 $239,377 1 $3,680 10 $227,998 FILES CLOSED FOR INCOMPLETENESS 0 $0 4 $382,275 16 $237,489 1 $190,190 4 $200,800
Aggregated Statistics For Year 2002(Based on 2 partial tracts) A) FHA, FSA/RHS & VA B) Conventional C) Refinancings D) Home Improvement Loans F) Non-occupant Loans on Number Average Value Number Average Value Number Average Value Number Average Value Number Average Value
LOANS ORIGINATED 0 $0 138 $296,268 242 $212,185 12 $93,498 184 $248,393 APPLICATIONS APPROVED, NOT ACCEPTED 0 $0 13 $290,279 28 $179,408 4 $55,490 17 $220,456 APPLICATIONS DENIED 1 $88,960 10 $300,682 40 $266,797 10 $52,941 13 $304,563 APPLICATIONS WITHDRAWN 0 $0 9 $300,526 27 $232,871 1 $9,200 13 $269,958 FILES CLOSED FOR INCOMPLETENESS 0 $0 3 $262,860 8 $172,554 1 $198,160 3 $250,980
Aggregated Statistics For Year 2001(Based on 2 partial tracts) A) FHA, FSA/RHS & VA B) Conventional C) Refinancings D) Home Improvement Loans F) Non-occupant Loans on Number Average Value Number Average Value Number Average Value Number Average Value Number Average Value
LOANS ORIGINATED 1 $114,750 140 $230,199 178 $199,708 17 $67,701 144 $219,040 APPLICATIONS APPROVED, NOT ACCEPTED 0 $0 15 $256,984 23 $166,876 2 $52,075 14 $245,489 APPLICATIONS DENIED 0 $0 11 $273,889 34 $201,560 5 $83,450 12 $218,639 APPLICATIONS WITHDRAWN 0 $0 6 $259,132 19 $169,198 1 $19,780 10 $197,402 FILES CLOSED FOR INCOMPLETENESS 0 $0 4 $194,790 7 $155,861 0 $0 4 $213,875
Aggregated Statistics For Year 2000(Based on 2 partial tracts) B) Conventional C) Refinancings D) Home Improvement Loans F) Non-occupant Loans on Number Average Value Number Average Value Number Average Value Number Average Value
LOANS ORIGINATED 151 $205,348 31 $165,207 9 $45,748 95 $199,224 APPLICATIONS APPROVED, NOT ACCEPTED 9 $177,631 6 $138,547 4 $16,938 6 $207,398 APPLICATIONS DENIED 13 $154,816 14 $126,850 5 $23,054 7 $172,474 APPLICATIONS WITHDRAWN 7 $172,311 13 $104,907 2 $27,915 2 $229,555 FILES CLOSED FOR INCOMPLETENESS 4 $176,952 2 $170,245 0 $0 2 $153,905
Aggregated Statistics For Year 1999(Based on 2 partial tracts) A) FHA, FSA/RHS & VA B) Conventional C) Refinancings D) Home Improvement Loans F) Non-occupant Loans on Number Average Value Number Average Value Number Average Value Number Average Value Number Average Value
LOANS ORIGINATED 1 $66,840 99 $169,921 59 $143,185 6 $34,313 68 $158,719 APPLICATIONS APPROVED, NOT ACCEPTED 0 $0 9 $156,724 10 $160,805 1 $47,030 7 $138,871 APPLICATIONS DENIED 0 $0 14 $159,641 17 $155,388 2 $25,800 8 $136,550 APPLICATIONS WITHDRAWN 0 $0 8 $153,082 9 $131,226 1 $108,910 4 $152,700 FILES CLOSED FOR INCOMPLETENESS 0 $0 0 $0 6 $154,642 1 $47,780 1 $122,370
Detailed HMDA statistics for the following Tracts:
0017.01
, 0018.00
Private Mortgage Insurance Companies Aggregated Statistics For Year 2009(Based on 2 partial tracts) A) Conventional C) Non-occupant Loans on Number Average Value Number Average Value
LOANS ORIGINATED 0 $0 0 $0 APPLICATIONS APPROVED, NOT ACCEPTED 1 $276,080 1 $230,680 APPLICATIONS DENIED 0 $0 0 $0 APPLICATIONS WITHDRAWN 0 $0 0 $0 FILES CLOSED FOR INCOMPLETENESS 0 $0 0 $0
Aggregated Statistics For Year 2008(Based on 2 partial tracts) A) Conventional C) Non-occupant Loans on Number Average Value Number Average Value
LOANS ORIGINATED 3 $350,637 2 $398,085 APPLICATIONS APPROVED, NOT ACCEPTED 3 $414,287 1 $487,730 APPLICATIONS DENIED 0 $0 0 $0 APPLICATIONS WITHDRAWN 0 $0 0 $0 FILES CLOSED FOR INCOMPLETENESS 0 $0 0 $0
Aggregated Statistics For Year 2007(Based on 2 partial tracts) A) Conventional B) Refinancings C) Non-occupant Loans on Number Average Value Number Average Value Number Average Value
LOANS ORIGINATED 3 $471,480 1 $352,150 1 $288,150 APPLICATIONS APPROVED, NOT ACCEPTED 1 $157,670 1 $539,270 1 $539,270 APPLICATIONS DENIED 1 $659,880 0 $0 0 $0 APPLICATIONS WITHDRAWN 0 $0 1 $914,120 1 $914,120 FILES CLOSED FOR INCOMPLETENESS 0 $0 0 $0 0 $0
Aggregated Statistics For Year 2006(Based on 2 partial tracts) A) Conventional B) Refinancings C) Non-occupant Loans on Number Average Value Number Average Value Number Average Value
LOANS ORIGINATED 2 $449,810 0 $0 2 $340,605 APPLICATIONS APPROVED, NOT ACCEPTED 0 $0 0 $0 0 $0 APPLICATIONS DENIED 0 $0 1 $176,070 0 $0 APPLICATIONS WITHDRAWN 0 $0 0 $0 0 $0 FILES CLOSED FOR INCOMPLETENESS 0 $0 0 $0 0 $0
Aggregated Statistics For Year 2005(Based on 2 partial tracts) A) Conventional B) Refinancings C) Non-occupant Loans on Number Average Value Number Average Value Number Average Value
LOANS ORIGINATED 4 $499,925 1 $265,630 4 $404,065 APPLICATIONS APPROVED, NOT ACCEPTED 1 $270,550 0 $0 0 $0 APPLICATIONS DENIED 0 $0 0 $0 0 $0 APPLICATIONS WITHDRAWN 0 $0 0 $0 0 $0 FILES CLOSED FOR INCOMPLETENESS 0 $0 0 $0 0 $0
Aggregated Statistics For Year 2004(Based on 2 partial tracts) A) Conventional C) Non-occupant Loans on Number Average Value Number Average Value
LOANS ORIGINATED 5 $339,688 3 $374,400 APPLICATIONS APPROVED, NOT ACCEPTED 2 $360,150 1 $333,770 APPLICATIONS DENIED 0 $0 0 $0 APPLICATIONS WITHDRAWN 0 $0 0 $0 FILES CLOSED FOR INCOMPLETENESS 0 $0 0 $0
Aggregated Statistics For Year 2003(Based on 2 partial tracts) A) Conventional B) Refinancings C) Non-occupant Loans on Number Average Value Number Average Value Number Average Value
LOANS ORIGINATED 8 $289,992 0 $0 4 $288,658 APPLICATIONS APPROVED, NOT ACCEPTED 1 $442,410 1 $82,720 1 $351,510 APPLICATIONS DENIED 0 $0 0 $0 0 $0 APPLICATIONS WITHDRAWN 1 $104,910 1 $80,370 0 $0 FILES CLOSED FOR INCOMPLETENESS 0 $0 0 $0 0 $0
Aggregated Statistics For Year 2002(Based on 2 partial tracts) A) Conventional B) Refinancings C) Non-occupant Loans on Number Average Value Number Average Value Number Average Value
LOANS ORIGINATED 8 $226,412 2 $166,455 5 $220,346 APPLICATIONS APPROVED, NOT ACCEPTED 1 $343,140 1 $313,950 0 $0 APPLICATIONS DENIED 0 $0 0 $0 0 $0 APPLICATIONS WITHDRAWN 0 $0 0 $0 0 $0 FILES CLOSED FOR INCOMPLETENESS 0 $0 0 $0 0 $0
Aggregated Statistics For Year 2001(Based on 2 partial tracts) A) Conventional B) Refinancings C) Non-occupant Loans on Number Average Value Number Average Value Number Average Value
LOANS ORIGINATED 7 $221,807 2 $270,245 2 $208,775 APPLICATIONS APPROVED, NOT ACCEPTED 0 $0 1 $143,590 1 $140,060 APPLICATIONS DENIED 1 $156,440 0 $0 1 $156,440 APPLICATIONS WITHDRAWN 1 $132,520 0 $0 1 $132,520 FILES CLOSED FOR INCOMPLETENESS 0 $0 0 $0 0 $0
Aggregated Statistics For Year 2000(Based on 2 partial tracts) A) Conventional B) Refinancings C) Non-occupant Loans on Number Average Value Number Average Value Number Average Value
LOANS ORIGINATED 11 $197,523 1 $199,390 7 $201,243 APPLICATIONS APPROVED, NOT ACCEPTED 0 $0 1 $158,280 1 $68,710 APPLICATIONS DENIED 0 $0 0 $0 0 $0 APPLICATIONS WITHDRAWN 0 $0 0 $0 0 $0 FILES CLOSED FOR INCOMPLETENESS 0 $0 1 $112,270 0 $0
Aggregated Statistics For Year 1999(Based on 2 partial tracts) A) Conventional B) Refinancings C) Non-occupant Loans on Number Average Value Number Average Value Number Average Value
LOANS ORIGINATED 12 $152,555 1 $243,790 3 $140,697 APPLICATIONS APPROVED, NOT ACCEPTED 0 $0 0 $0 0 $0 APPLICATIONS DENIED 2 $124,935 0 $0 0 $0 APPLICATIONS WITHDRAWN 1 $105,190 0 $0 0 $0 FILES CLOSED FOR INCOMPLETENESS 0 $0 0 $0 0 $0
Detailed PMIC statistics for the following Tracts:
0017.01
, 0018.00 Holmes Beach compared to Florida state average:
Median house value significantly above state average. Unemployed percentage significantly below state average. Black race population percentage significantly below state average. Hispanic race population percentage significantly below state average. Median age significantly above state average. Foreign-born population percentage significantly below state average. Length of stay since moving in significantly above state average. Number of college students significantly below state average. Percentage of population with a bachelor's degree or higher significantly above state average. Holmes Beach on our top lists :
#87 on the list of "Top 101 cities with the most residents born in Russia (population 500+)"
#3 on the list of "Top 101 counties with the largest increase in the number of infant deaths per 1000 residents 2000-2006 to 2007-2013 (pop. 50,000+)"
#42 on the list of "Top 101 counties with the highest number of infant deaths per 1000 residents 2007-2013 (pop. 50,000+)"
#46 on the list of "Top 101 counties with the largest decrease in the number of deaths per 1000 residents 2000-2006 to 2007-2013 (pop. 50,000+)"
#50 on the list of "Top 101 counties with the largest number of people without health insurance coverage in 2000 (pop. 50,000+)"
#72 on the list of "Top 101 counties with the lowest Ozone (1-hour) air pollution readings in 2012 (ppm)"
Top Patent Applicants
Barbara S. Kitchell (6)
Adam N. Lindahl (5)
Werner Hendrik Grobler (1)
Jeffrey Wingrove Dentz (1)
Thomas J. Carlson (1)
Stephen A. Letourneau (1)
Christopher A. Mason (1)
Total of 16 patent applications in 2008-2024.

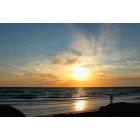

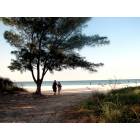
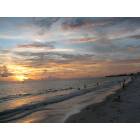

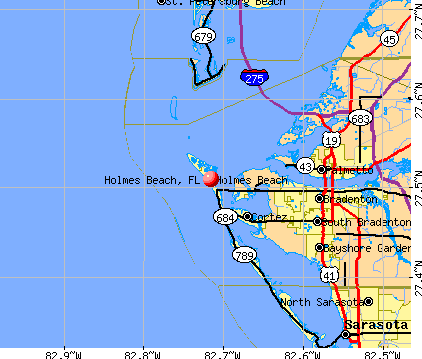


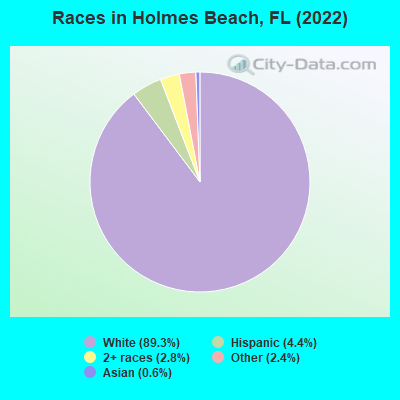
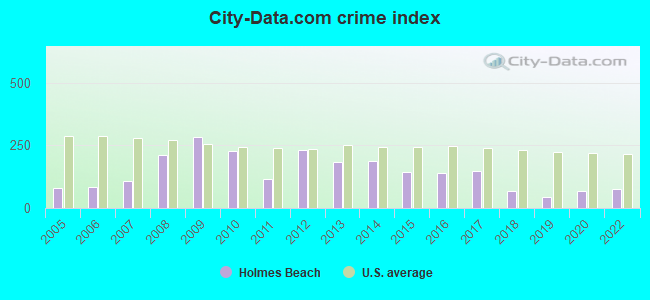
 Recent articles from our blog. Our writers, many of them Ph.D. graduates or candidates, create easy-to-read articles on a wide variety of topics.

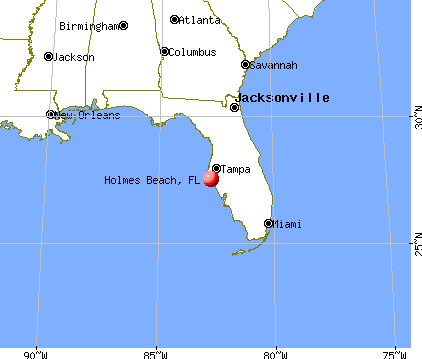
 (16.3 miles
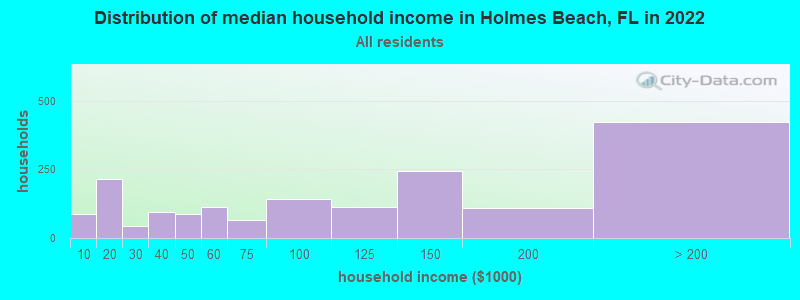
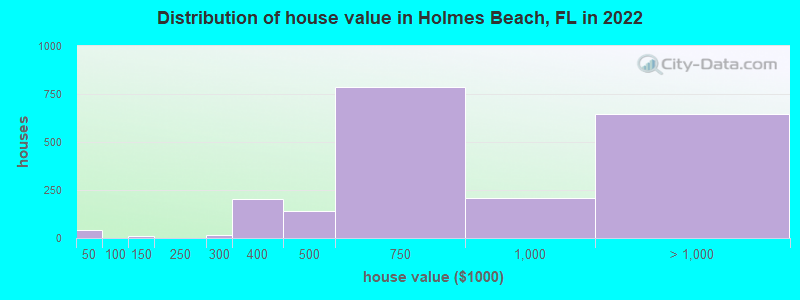
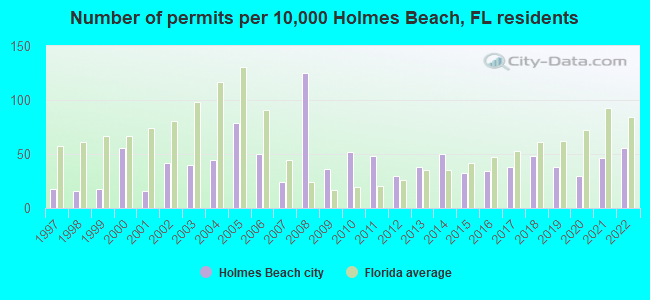
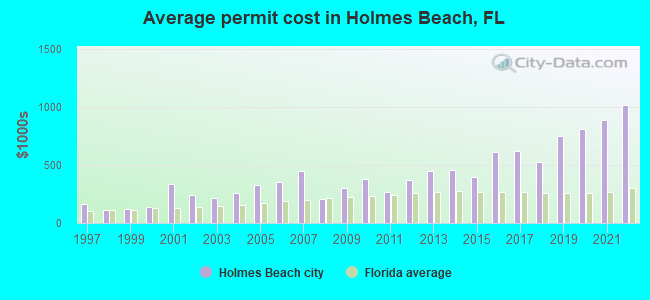
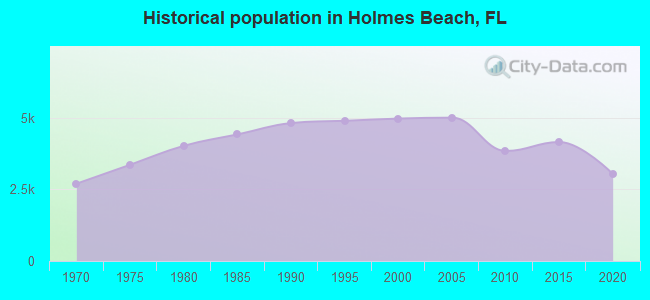
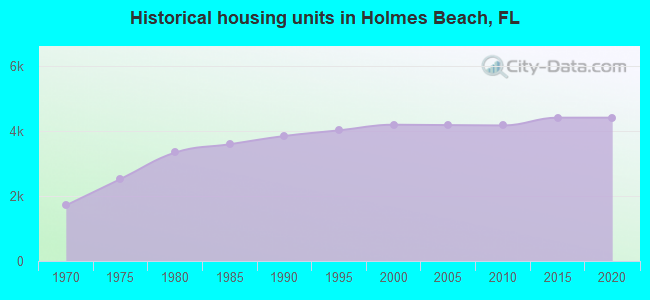
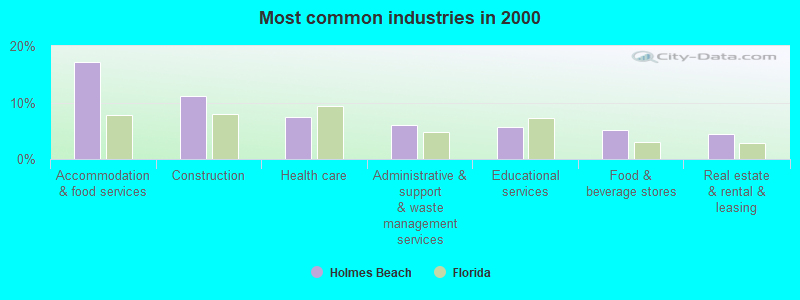
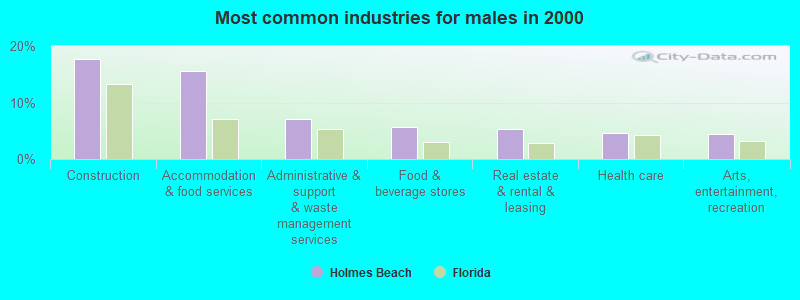
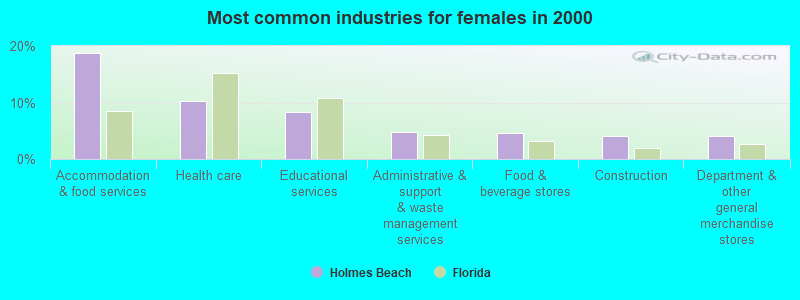
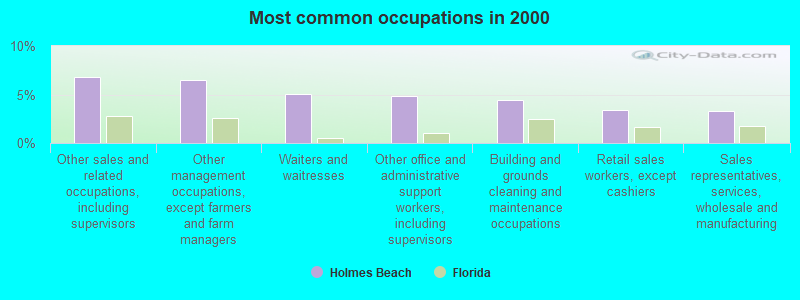
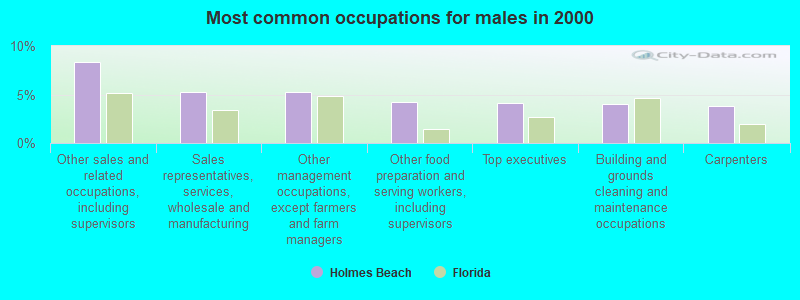
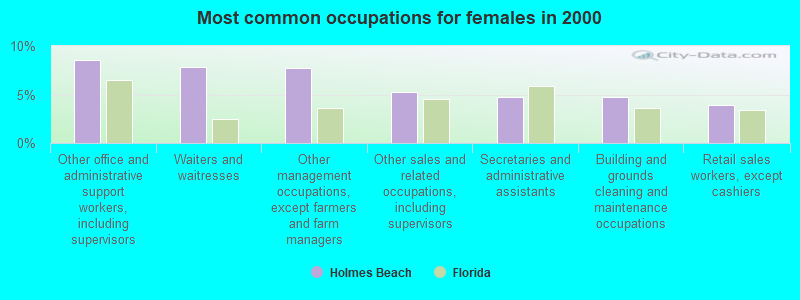
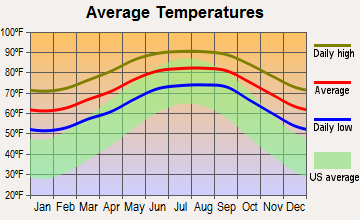
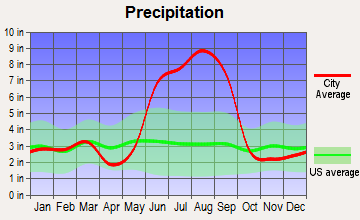
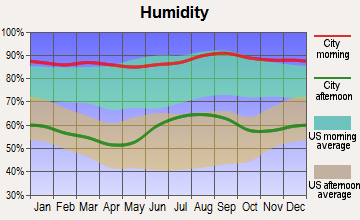
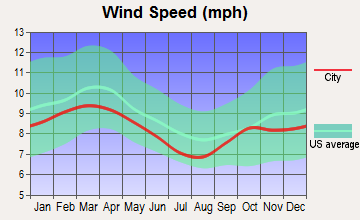
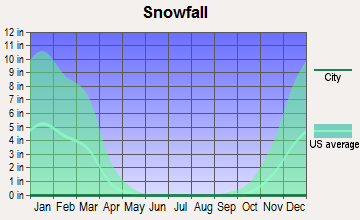
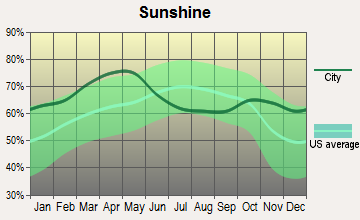
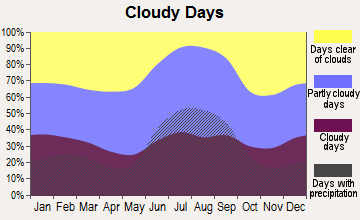
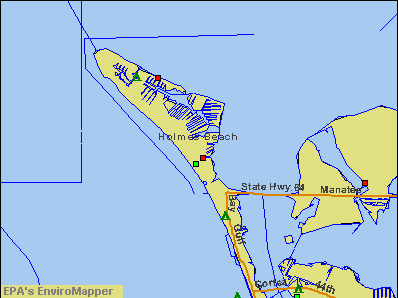

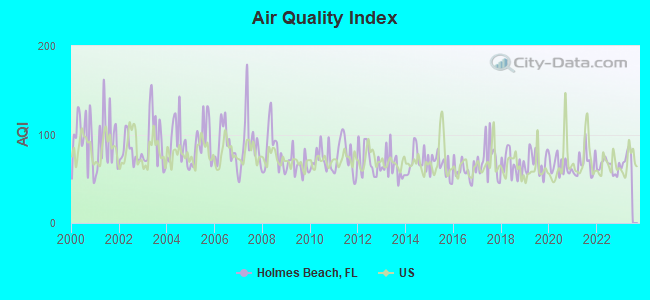
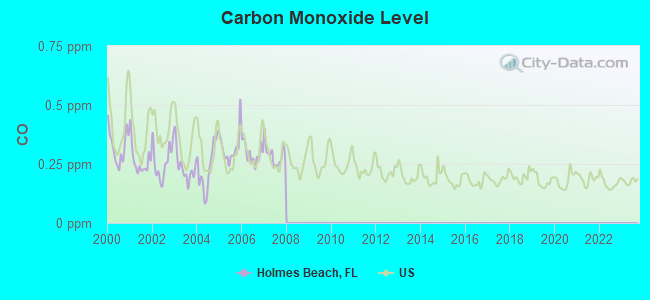
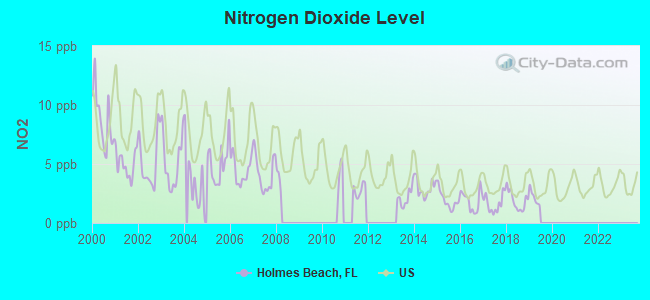
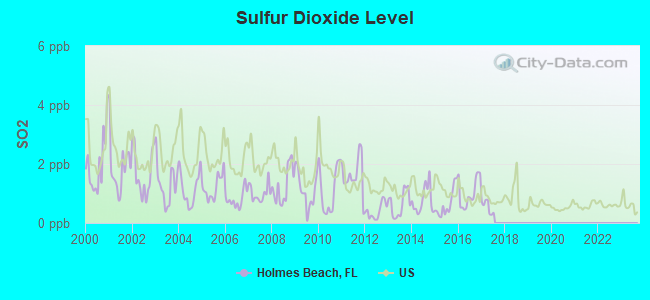
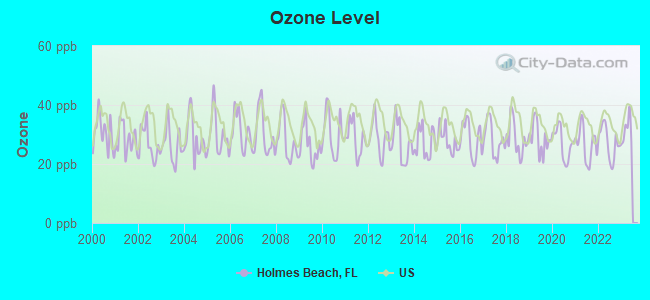
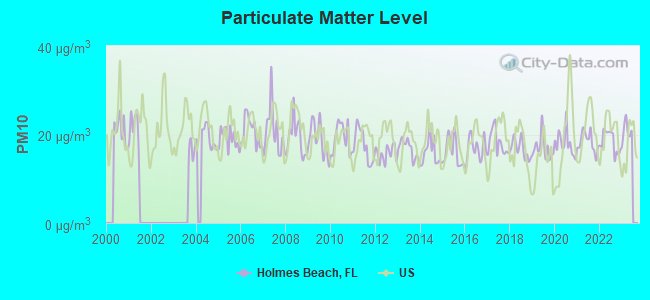
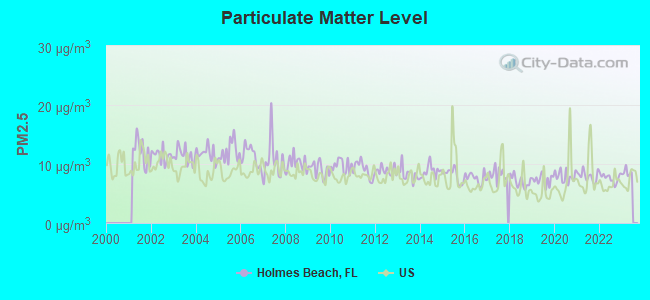
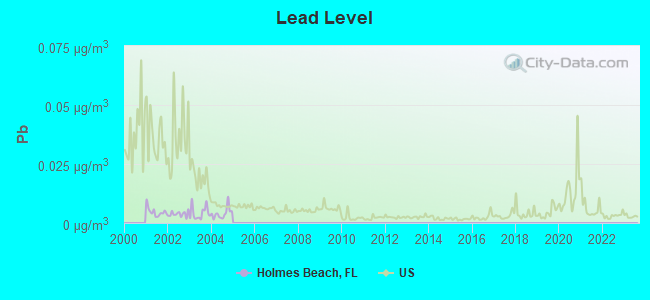
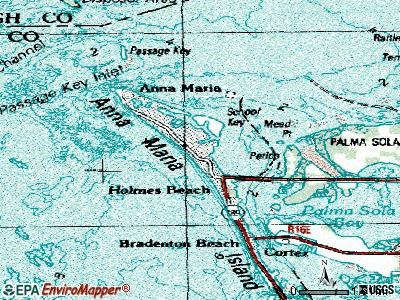
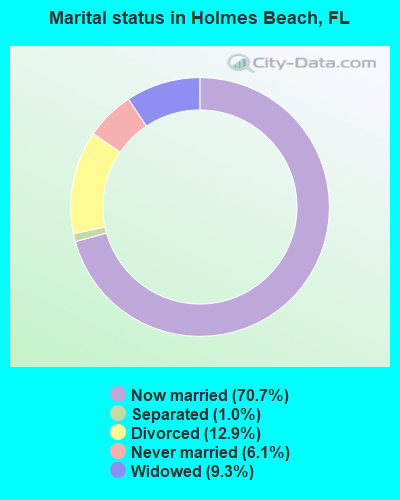
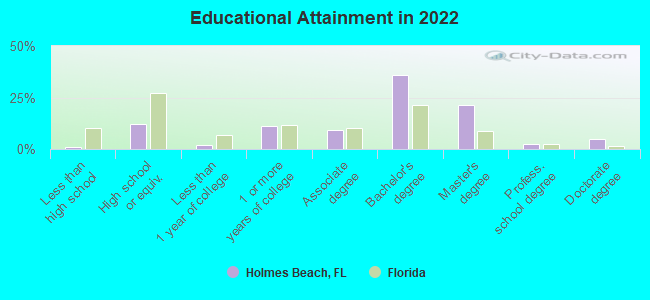
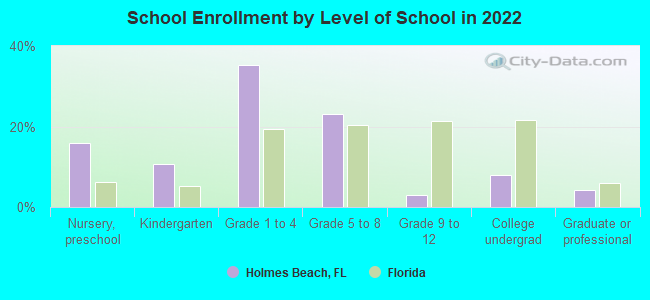
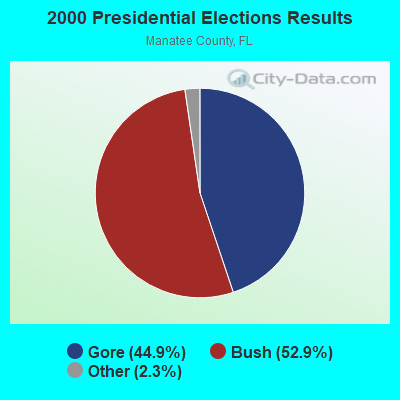
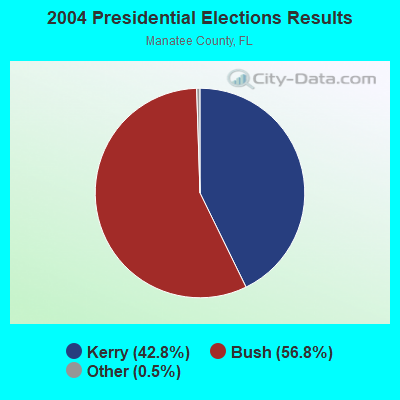
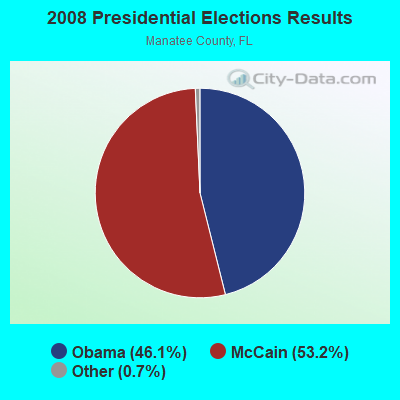
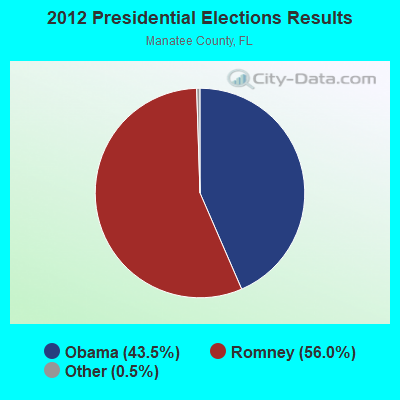
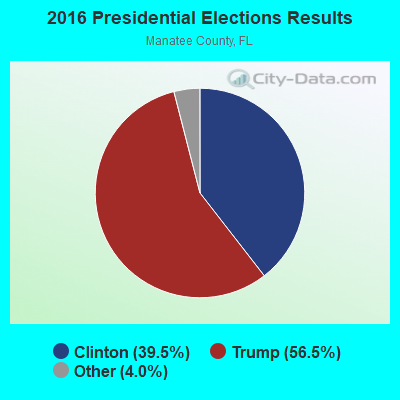
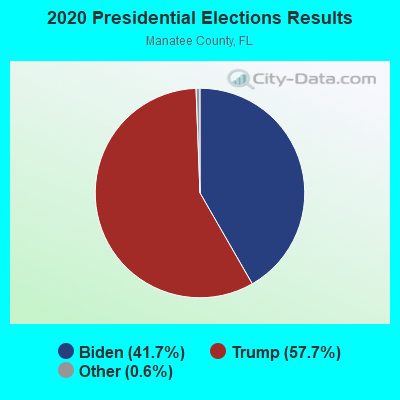
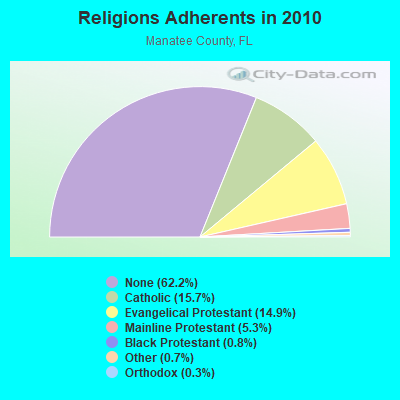
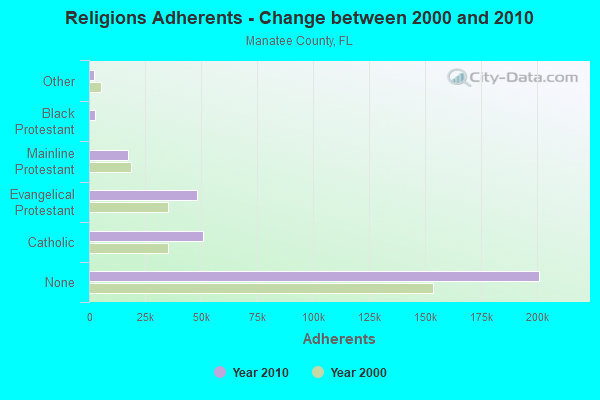
 According to the data from the years 2002 - 2018 the average number of fires per year is 8. The highest number of fire incidents - 13 took place in 2007, and the least - 2 in 2018. The data has a declining trend.
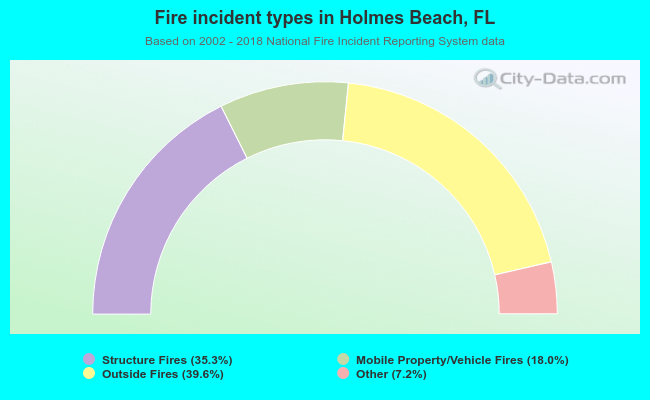 When looking into fire subcategories, the most incidents belonged to: Outside Fires (39.6%), and Structure Fires (35.3%).