According to our research of Texas and other state lists, there were 4 registered sex offenders living in Hickory Creek, Texas as of May 09, 2024. The ratio of all residents to sex offenders in Hickory Creek is 1,052 to 1. The ratio of registered sex offenders to all residents in this city is lower than the state average.
Crime rates in Hickory Creek by year
Type
2009
2010
2011
2012
2013
2014
2015
2016
2017
2018
2019
2020
2021
2022
Murders (per 100,000)
0 (0.0)
0 (0.0)
0 (0.0)
0 (0.0)
0 (0.0)
0 (0.0)
0 (0.0)
0 (0.0)
0 (0.0)
0 (0.0)
0 (0.0)
1 (20.1)
0 (0.0)
0 (0.0)
Rapes (per 100,000)
0 (0.0)
2 (61.6)
1 (30.2)
1 (29.3)
2 (57.3)
0 (0.0)
0 (0.0)
0 (0.0)
2 (45.3)
2 (41.7)
4 (81.1)
0 (0.0)
1 (19.3)
2 (34.6)
Robberies (per 100,000)
1 (24.8)
1 (30.8)
5 (150.8)
4 (117.2)
2 (57.3)
5 (119.8)
0 (0.0)
1 (23.0)
1 (22.7)
0 (0.0)
0 (0.0)
1 (20.1)
2 (38.5)
0 (0.0)
Assaults (per 100,000)
1 (24.8)
3 (92.4)
7 (211.2)
0 (0.0)
3 (85.9)
3 (71.9)
5 (118.4)
2 (46.0)
3 (68.0)
9 (187.7)
1 (20.3)
2 (40.2)
2 (38.5)
3 (51.8)
Burglaries (per 100,000)
12 (297.6)
9 (277.2)
7 (211.2)
4 (117.2)
2 (57.3)
5 (119.8)
11 (260.5)
6 (138.0)
6 (136.0)
8 (166.8)
5 (101.4)
6 (120.5)
5 (96.3)
5 (86.4)
Thefts (per 100,000)
68 (1,687)
89 (2,741)
58 (1,750)
74 (2,168)
97 (2,777)
58 (1,389)
51 (1,208)
67 (1,541)
69 (1,564)
89 (1,856)
48 (973.0)
54 (1,085)
58 (1,117)
79 (1,365)
Auto thefts (per 100,000)
11 (272.8)
6 (184.8)
6 (181.0)
4 (117.2)
9 (257.7)
2 (47.9)
2 (47.4)
4 (92.0)
6 (136.0)
4 (83.4)
4 (81.1)
10 (200.8)
7 (134.8)
9 (155.5)
Arson (per 100,000)
0 (0.0)
0 (0.0)
0 (0.0)
0 (0.0)
0 (0.0)
0 (0.0)
0 (0.0)
1 (23.0)
2 (45.3)
0 (0.0)
0 (0.0)
0 (0.0)
0 (0.0)
0 (0.0)
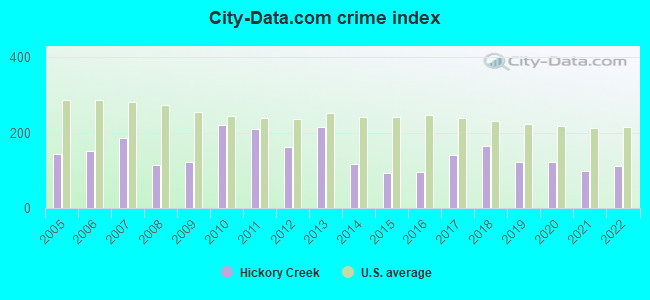
City-Data.com crime index
122.5
220.8
210.9
162.9
215.9
118.1
94.0
94.8
139.6
163.5
121.4
122.1
96.9
111.1
The City-Data.com crime index weighs serious crimes and violent crimes more heavily. Higher means more crime, U.S. average is 246.1. It adjusts for the number of visitors and daily workers commuting into cities.
Latest news from Hickory Creek, TX collected exclusively by city-data.com from local newspapers, TV, and radio stations
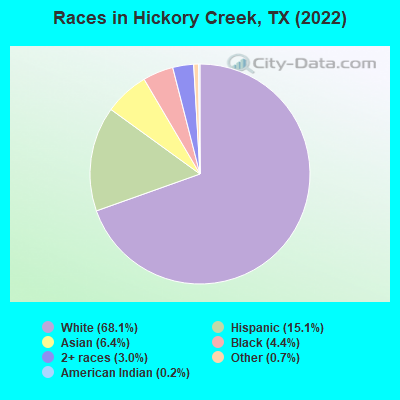
Ancestries: European (34.0%), English (9.0%), German (5.4%), American (3.8%), Irish (2.1%), Finnish (1.9%).
Current Local Time: CST time zone
Land area: 4.54 square miles.
Population density: 1,192 people per square mile (low).
520 residents are foreign born (4.3% Latin America, 3.6% Asia, 1.1% Africa, 1.0% Europe).
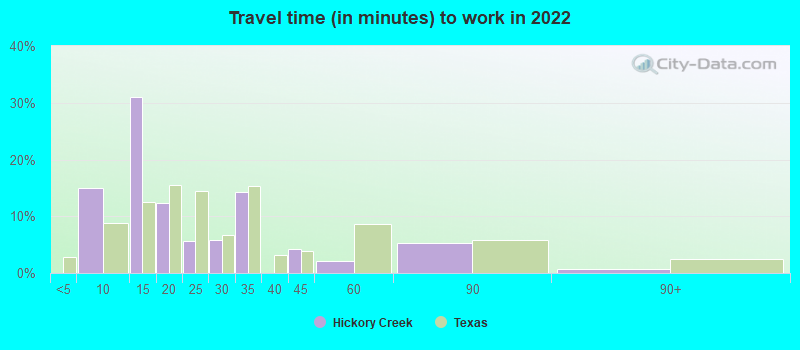
This town:
9.9%
Texas:
17.1%
Median real estate property taxes paid for housing units with mortgages in 2022: $8,548 (1.6%) Median real estate property taxes paid for housing units with no mortgage in 2022: $6,035 (1.6%)
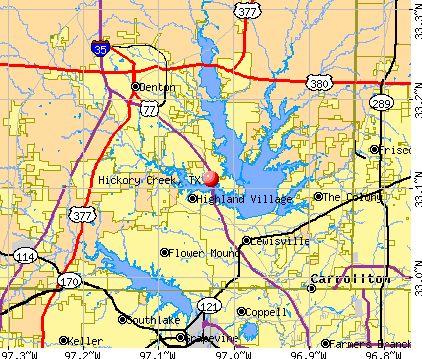
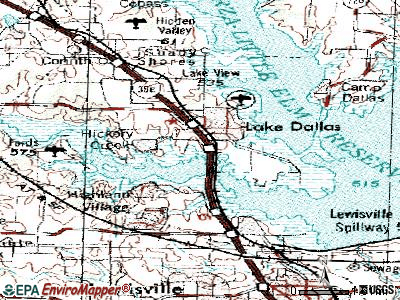
Nearest city with pop. 50,000+: Lewisville, TX (5.2 miles , pop. 77,737).
Nearest city with pop. 200,000+: Plano, TX (17.0 miles , pop. 222,030).
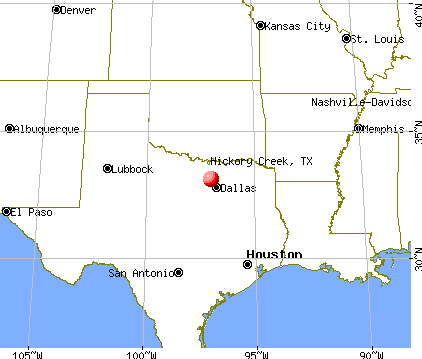
Nearest city with pop. 1,000,000+: Dallas, TX (25.7 miles , pop. 1,188,580).
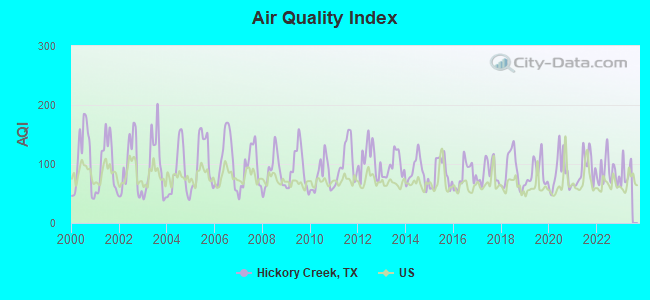
Air Quality Index (AQI) level in 2022 was 86.5. This is about average.
City:
86.5
U.S.:
72.6
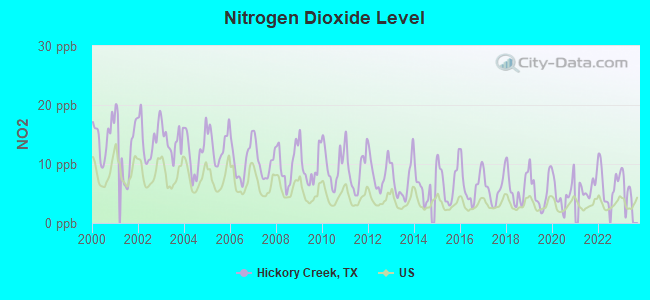
Nitrogen Dioxide (NO2) [ppb] level in 2022 was 6.77. This is worse than average.Closest monitor was 11.1 miles away from the city center.
City:
6.77
U.S.:
5.11
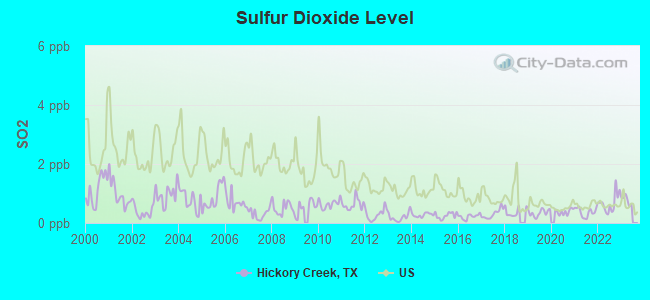
Sulfur Dioxide (SO2) [ppb] level in 2022 was 0.679. This is significantly better than average.Closest monitor was 9.5 miles away from the city center.
City:
0.679
U.S.:
1.515
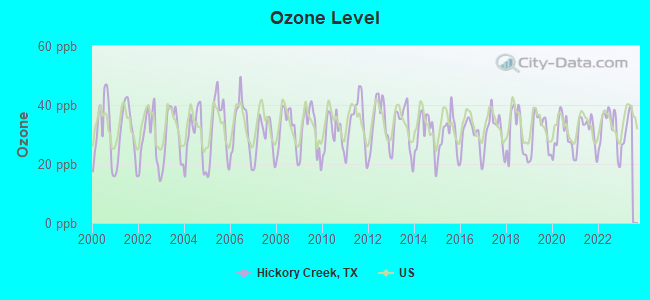
Ozone [ppb] level in 2022 was 32.0. This is about average.Closest monitor was 10.8 miles away from the city center.
City:
32.0
U.S.:
33.3
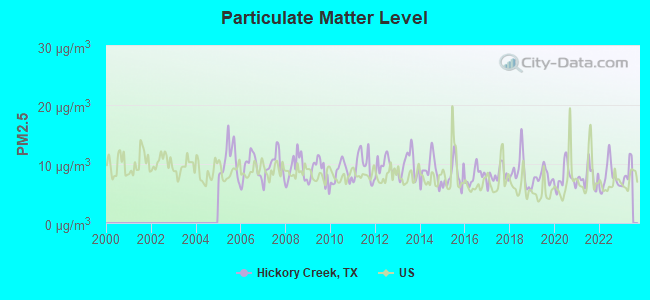
Particulate Matter (PM2.5) [µg/m3] level in 2022 was 7.76. This is about average.Closest monitor was 12.2 miles away from the city center.
City:
7.76
U.S.:
8.11
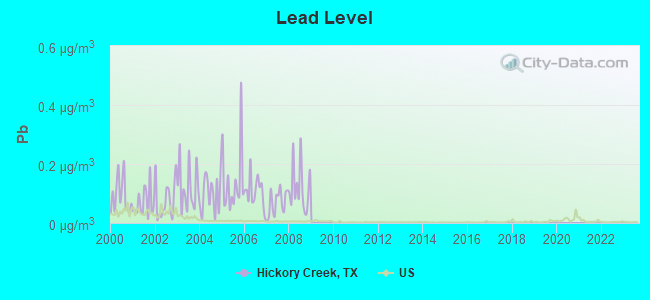
Lead (Pb) [µg/m3] level in 2008 was 0.121. This is significantly worse than average.Closest monitor was 3.5 miles away from the city center.
City:
0.121
U.S.:
0.009
Tornado activity:
Hickory Creek-area historical tornado activity is above Texas state average. It is 151% greater than the overall U.S. average.
On 4/2/1957, a category F3 (max. wind speeds 158-206 mph) tornado 11.6 miles away from the Hickory Creek town center killed 10 peopleand injured 200 peopleand causedbetween $500,000 and $5,000,000 in damages.
On 6/12/1966, a category F3 tornado 13.3 miles away from the town center .
Earthquake activity:
Hickory Creek-area historical earthquake activity is significantly above Texas state average. It is 507% greater than the overall U.S. average.
On 11/6/2011 at 03:53:10, a magnitude 5.7 (5.7 MW, Depth: 3.2 mi, Class: Moderate, Intensity: VI - VII) earthquake occurred 168.2 miles away from Hickory Creek center On 9/3/2016 at 12:02:44, a magnitude 5.8 (5.8 MW, Depth: 3.5 mi) earthquake occurred 229.4 miles away from Hickory Creek center On 6/16/1978 at 11:46:54, a magnitude 5.3 (4.4 MB, 4.6 UK, 5.3 ML) earthquake occurred 216.6 miles away from Hickory Creek center On 11/7/2016 at 01:44:24, a magnitude 5.0 (5.0 MW, Depth: 2.8 mi) earthquake occurred 199.7 miles away from the city center On 11/8/2011 at 02:46:57, a magnitude 4.8 (4.8 MW, Depth: 3.1 mi, Class: Light, Intensity: IV - V) earthquake occurred 168.0 miles away from Hickory Creek center On 11/5/2011 at 07:12:45, a magnitude 4.8 (4.8 MW, Depth: 1.9 mi) earthquake occurred 169.4 miles away from Hickory Creek center Magnitude types: body-wave magnitude (MB), local magnitude (ML), moment magnitude (MW)
Natural disasters:
The number of natural disasters in Denton County (18) is near the US average (15). Major Disasters (Presidential) Declared: 7 Emergencies Declared: 9
Causes of natural disasters: Storms: 6, Fires: 5, Floods: 5, Hurricanes: 5, Tornadoes: 5, Wind: 1, Other: 2 (Note: some incidents may be assigned to more than one category).
Hospitals and medical centers near Hickory Creek:
GLOW HEALTHCARE SOLUTIONS INCORPORATED (Home Health Center, about 3 miles away; LEWISVILLE, TX)
LAKE PARK NURSING AND REHAB CENTER (Nursing Home, about 3 miles away; LEWISVILLE, TX)
LAKE VILLAGE INC DBA LAKE VILLAGE NURSING AND REHA (Nursing Home, about 3 miles away; LEWISVILLE, TX)
CORINTH HOME HEALTH CARE SERVICES INC (Home Health Center, about 4 miles away; CORINTH, TX)
CORINTH REHABILITATION SUITES ON THE PARKWAY (Nursing Home, about 4 miles away; CORINTH, TX)
ZELANO HEALTHCARE LLC (Home Health Center, about 4 miles away; CORINTH, TX)
CORNERSTONE HOME HEALTH AGENCY (Home Health Center, about 4 miles away; LEWISVILLE, TX)
Parks in Hickory Creek include: Hickory Creek Park (1), Sycamore Bend Park (2), West Lake Park (3), Oakland Park (4). Display/hide their locations on the map
Denton County has a predicted average indoor radon screening level less than 2 pCi/L (pico curies per liter) - Low Potential
Average household size:
This town:
2.8 people
Texas:
2.8 people
Percentage of family households:
This town:
79.2%
Whole state:
69.9%
Percentage of households with unmarried partners:
This town:
4.9%
Whole state:
6.0%
Likely homosexual households (counted as self-reported same-sex unmarried-partner households)
Lesbian couples: 0.8% of all households
Gay men: 0.5% of all households
Banks with branches in Hickory Creek (2011 data):
First Security Bank, National Association: Hickory Creek - 3970 Fm - 2181 at 3970 Fm - 2181, Suite 100, branch established on 2002/08/22. Info updated 2006/11/03: Bank assets: $156.3 mil, Deposits: $129.9 mil, headquarters in Flower Mound, TX, positive income, Commercial Lending Specialization, 3 total offices, Holding Company: First Graham Bancorp, Inc.
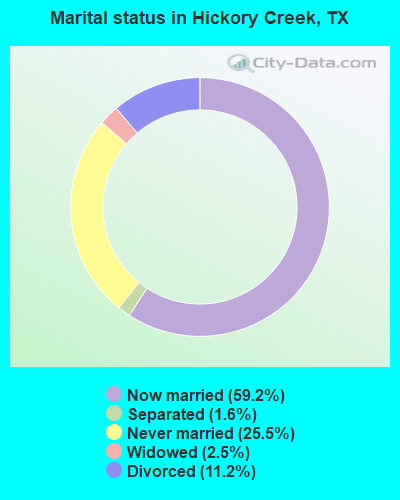
For population 15 years and over in Hickory Creek:
Never married: 25.5%
Now married: 59.2%
Separated: 1.6%
Widowed: 2.5%
Divorced: 11.2%
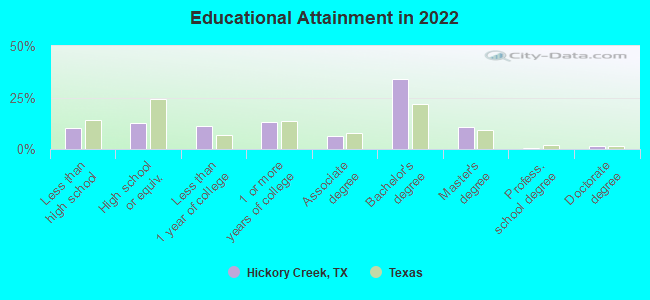
For population 25 years and over in Hickory Creek:
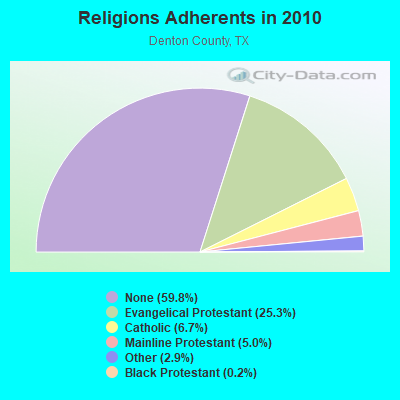
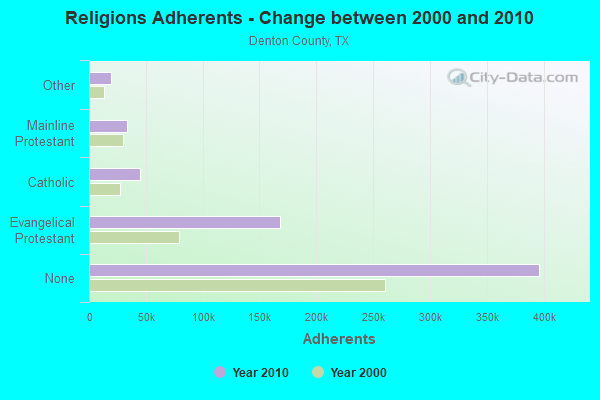
Religion statistics for Hickory Creek, TX (based on Denton County data)
Religion
Adherents
Congregations
Evangelical Protestant
167,945
321
Catholic
44,615
8
Mainline Protestant
33,340
56
Other
18,928
42
Black Protestant
1,354
8
Orthodox
120
1
None
396,312
-
Source: Clifford Grammich, Kirk Hadaway, Richard Houseal, Dale E.Jones, Alexei Krindatch, Richie Stanley and Richard H.Taylor. 2012. 2010 U.S.Religion Census: Religious Congregations & Membership Study. Association of Statisticians of American Religious Bodies. Jones, Dale E., et al. 2002. Congregations and Membership in the United States 2000. Nashville, TN: Glenmary Research Center. Graphs represent county-level data
3602 Fm 2181 (Lat: 33.130028 Lon: -97.050556), Type: Pole, Structure height: 4.6 m, Call Sign: WQHQ891, Assigned Frequencies: 154.478 MHz, Grant Date: 10/10/2007, Expiration Date: 10/10/2017, Cancellation Date: 12/16/2017, Certifier: Jeff L Knight, Registrant: Business Radio Licensing, 30251 Golden Alntern Suite E 501, Laguna Niguel, CA 92677-5993, Phone: (949) 348-8510, Fax: (949) 348-8514, Email:
300\' E. Main & Lakewood St (Lat: 33.110139 Lon: -97.016361), Type: Pole, Structure height: 4.6 m, Call Sign: WQHQ904, Assigned Frequencies: 154.478 MHz, Grant Date: 10/10/2007, Expiration Date: 10/10/2017, Cancellation Date: 12/16/2017, Certifier: Jeff L Knight, Registrant: Federal Licensing Inc, 1588 Fairfield Road, Gettysburg, PA 17325, Phone: (717) 334-9262, Fax: (717) 334-6440
MANSIONS HICKORY, Lat: 33.119250 Lon: -97.027389, Call Sign: WQRP964, Licensee ID: L01502812, Assigned Frequencies: 451.512 MHz, Grant Date: 07/04/2013, Expiration Date: 07/04/2023, Cancellation Date: 09/09/2023, Certifier: Jack Graudenz, Registrant: Cereniti Datasense Networks, 41 East Washington Street, Suite 110, Indianapolis, IN 46204, Phone: (877) 237-3648, Fax: (877) 362-6640, Email:
FCC Registered Microwave Towers:
3
DLS1313, 1.4m E/O 1000 S Main (Hwy 24) (Lat: 33.108333 Lon: -97.007778), Type: Tower, Structure height: 49.6 m, Call Sign: WQEN801, Licensee ID: L01728370, Assigned Frequencies: 17980.0 MHz, 18060.0 MHz, Grant Date: 03/14/2006, Expiration Date: 03/14/2016, Cancellation Date: 09/16/2013, Certifier: Joseph M Sandri Jr., Registrant: Fibertower Network Services, Corp., Debtor-In-Possession, 1875 Eye Street, Nw, 5th Floor, Room 505, Washington, DC 20006, Phone: (202) 223-1028, Email:
TX-DAL0917A, 1.4m E/O 1000 S Main (Hwy 24) (Lat: 33.108500 Lon: -97.007556), Type: Tower, Structure height: 46.3 m, Overall height: 46.9 m, Call Sign: WQLD687, Assigned Frequencies: 17965.0 MHz, 18115.0 MHz, Grant Date: 02/04/2020, Expiration Date: 12/15/2029, Cancellation Date: 05/09/2023, Certifier: Nadja S Sodos-Wallace, Registrant: T-Mobile Usa, Inc., 12920 Se 38th Street, Bellevue, WA 98006, Phone: (425) 383-8401, Email:
Aircraft: CAMERON BALLOONS Z-90 (Category: Land, Weight: Up to 12,499 Pounds), Engine: None N-Number: 2304A, N2304A, N-2304A, Serial Number: 6546, Year manufactured: 2008, Airworthiness Date: 11/20/2008, Certificate Issue Date: 10/21/2019 Registrant (Individual): Michael Wilson, 1 Lakewood Dr, Hickory Creek, TX 75065
Aircraft: PIPER PA-28-140 (Category: Land, Seats: 4, Weight: Up to 12,499 Pounds, Speed: 107 mph), Engine: LYCOMING 0-320 SERIES (180 HP) (Reciprocating) N-Number: 57350, N57350, N-57350, Serial Number: 28-7425096, Year manufactured: 1973, Certificate Issue Date: 06/05/2013 Registrant (Individual): Carmen F Minor, 15 Point Vista Dr, Hickory Creek, TX 75065
Aircraft: ARBC INC DBA LINDSTRAND 90A (Category: Land, Weight: Up to 12,499 Pounds), Engine: None N-Number: 766LB, N766LB, N-766LB, Serial Number: 5432, Year manufactured: 2009, Airworthiness Date: 04/10/2009, Certificate Issue Date: 04/30/2009 Registrant (Co-Owned): Joseph R Calabrette, 309 Eagle Mountain Dr, Hickory Creek, TX 75065, Other Owners: Susanne E Calabrette
Aircraft: BOEING PT-17 (Category: Land, Seats: 2, Weight: Up to 12,499 Pounds, Speed: 93 mph), Engine: CONT MOTOR W670 SERIES (250 HP) (Reciprocating) N-Number: 9998, N9998, N-9998, Serial Number: 41-1059, Year manufactured: 1941, Certificate Issue Date: 06/20/2014 Registrant (Co-Owned): James F Minor, 15 Point Vista Dr, Hickory Creek, TX 75065, Other Owners: James M Minor
Home Mortgage Disclosure Act Aggregated Statistics For Year 2009 (Based on 1 partial tract)
A) FHA, FSA/RHS & VA Home Purchase Loans
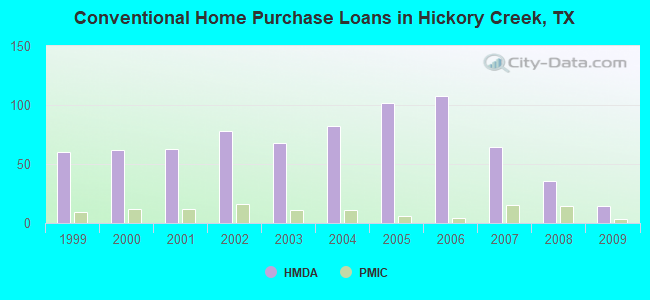
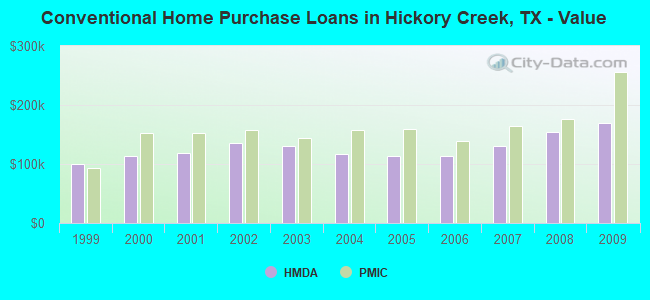
B) Conventional Home Purchase Loans
C) Refinancings
D) Home Improvement Loans
F) Non-occupant Loans on < 5 Family Dwellings (A B C & D)
G) Loans On Manufactured Home Dwelling (A B C & D)
Number
Average Value
Number
Average Value
Number
Average Value
Number
Average Value
Number
Average Value
Number
Average Value
LOANS ORIGINATED
21
$163,799
14
$169,785
51
$186,869
2
$68,450
2
$105,985
1
$48,580
APPLICATIONS APPROVED, NOT ACCEPTED
1
$176,350
3
$316,087
6
$131,107
0
$0
0
$0
0
$0
APPLICATIONS DENIED
4
$123,500
3
$150,143
20
$167,926
1
$109,810
2
$87,435
1
$52,990
APPLICATIONS WITHDRAWN
2
$236,255
2
$253,480
15
$153,755
0
$0
1
$161,630
0
$0
FILES CLOSED FOR INCOMPLETENESS
1
$97,150
1
$105,400
5
$180,468
0
$0
0
$0
0
$0
Aggregated Statistics For Year 2008 (Based on 1 partial tract)
A) FHA, FSA/RHS & VA Home Purchase Loans
B) Conventional Home Purchase Loans
C) Refinancings
D) Home Improvement Loans
F) Non-occupant Loans on < 5 Family Dwellings (A B C & D)
G) Loans On Manufactured Home Dwelling (A B C & D)
Number
Average Value
Number
Average Value
Number
Average Value
Number
Average Value
Number
Average Value
Number
Average Value
LOANS ORIGINATED
29
$165,859
36
$153,407
21
$164,065
8
$55,274
7
$126,046
1
$40,040
APPLICATIONS APPROVED, NOT ACCEPTED
1
$136,010
2
$117,320
3
$174,187
2
$60,645
1
$149,850
0
$0
APPLICATIONS DENIED
3
$102,550
6
$126,690
18
$170,376
8
$40,296
3
$121,000
1
$20,610
APPLICATIONS WITHDRAWN
3
$94,700
3
$144,353
13
$178,225
1
$49,460
1
$69,770
0
$0
FILES CLOSED FOR INCOMPLETENESS
0
$0
0
$0
3
$108,143
0
$0
0
$0
0
$0
Aggregated Statistics For Year 2007 (Based on 1 partial tract)
A) FHA, FSA/RHS & VA Home Purchase Loans
B) Conventional Home Purchase Loans
C) Refinancings
D) Home Improvement Loans
F) Non-occupant Loans on < 5 Family Dwellings (A B C & D)
G) Loans On Manufactured Home Dwelling (A B C & D)
Number
Average Value
Number
Average Value
Number
Average Value
Number
Average Value
Number
Average Value
Number
Average Value
LOANS ORIGINATED
13
$156,598
64
$130,654
32
$155,710
8
$43,535
13
$150,868
2
$49,605
APPLICATIONS APPROVED, NOT ACCEPTED
0
$0
9
$113,474
5
$125,296
4
$44,895
2
$75,955
1
$80,670
APPLICATIONS DENIED
0
$0
20
$135,115
21
$131,961
9
$43,277
5
$135,718
0
$0
APPLICATIONS WITHDRAWN
2
$132,920
9
$140,003
8
$145,324
1
$65,950
1
$131,010
0
$0
FILES CLOSED FOR INCOMPLETENESS
0
$0
3
$165,160
4
$180,835
0
$0
0
$0
0
$0
Aggregated Statistics For Year 2006 (Based on 1 partial tract)
A) FHA, FSA/RHS & VA Home Purchase Loans
B) Conventional Home Purchase Loans
C) Refinancings
D) Home Improvement Loans
F) Non-occupant Loans on < 5 Family Dwellings (A B C & D)
G) Loans On Manufactured Home Dwelling (A B C & D)
Number
Average Value
Number
Average Value
Number
Average Value
Number
Average Value
Number
Average Value
Number
Average Value
LOANS ORIGINATED
7
$145,097
108
$113,186
30
$148,495
10
$57,791
10
$94,591
0
$0
APPLICATIONS APPROVED, NOT ACCEPTED
1
$127,180
18
$98,232
4
$108,855
2
$25,320
2
$102,895
0
$0
APPLICATIONS DENIED
1
$156,920
27
$87,088
21
$120,185
8
$61,199
4
$132,775
3
$45,437
APPLICATIONS WITHDRAWN
0
$0
8
$129,868
13
$128,335
1
$70,660
1
$68,600
0
$0
FILES CLOSED FOR INCOMPLETENESS
0
$0
1
$162,510
7
$147,494
0
$0
1
$87,440
0
$0
Aggregated Statistics For Year 2005 (Based on 1 partial tract)
A) FHA, FSA/RHS & VA Home Purchase Loans
B) Conventional Home Purchase Loans
C) Refinancings
D) Home Improvement Loans
F) Non-occupant Loans on < 5 Family Dwellings (A B C & D)
G) Loans On Manufactured Home Dwelling (A B C & D)
Number
Average Value
Number
Average Value
Number
Average Value
Number
Average Value
Number
Average Value
Number
Average Value
LOANS ORIGINATED
8
$125,156
102
$113,728
34
$124,324
11
$45,044
14
$78,394
2
$38,715
APPLICATIONS APPROVED, NOT ACCEPTED
1
$63,880
15
$105,886
6
$131,155
2
$51,665
1
$55,940
1
$15,600
APPLICATIONS DENIED
2
$102,895
21
$103,475
36
$123,795
6
$38,517
4
$60,720
4
$49,900
APPLICATIONS WITHDRAWN
0
$0
10
$115,052
17
$167,998
4
$230,662
2
$111,725
0
$0
FILES CLOSED FOR INCOMPLETENESS
0
$0
5
$150,792
16
$159,841
0
$0
1
$79,490
0
$0
Aggregated Statistics For Year 2004 (Based on 1 partial tract)
A) FHA, FSA/RHS & VA Home Purchase Loans
B) Conventional Home Purchase Loans
C) Refinancings
D) Home Improvement Loans
F) Non-occupant Loans on < 5 Family Dwellings (A B C & D)
G) Loans On Manufactured Home Dwelling (A B C & D)
Number
Average Value
Number
Average Value
Number
Average Value
Number
Average Value
Number
Average Value
Number
Average Value
LOANS ORIGINATED
11
$122,792
82
$117,782
62
$131,193
5
$52,108
11
$100,792
1
$111,870
APPLICATIONS APPROVED, NOT ACCEPTED
1
$93,030
13
$122,244
11
$110,989
4
$42,762
2
$113,785
0
$0
APPLICATIONS DENIED
1
$230,520
16
$121,569
39
$115,888
8
$38,419
3
$86,160
1
$52,110
APPLICATIONS WITHDRAWN
2
$152,060
13
$128,834
20
$116,818
1
$40,330
2
$58,735
0
$0
FILES CLOSED FOR INCOMPLETENESS
1
$77,720
3
$127,573
16
$129,205
0
$0
1
$111,870
0
$0
Aggregated Statistics For Year 2003 (Based on 1 partial tract)
A) FHA, FSA/RHS & VA Home Purchase Loans
B) Conventional Home Purchase Loans
C) Refinancings
D) Home Improvement Loans
F) Non-occupant Loans on < 5 Family Dwellings (A B C & D)
Number
Average Value
Number
Average Value
Number
Average Value
Number
Average Value
Number
Average Value
LOANS ORIGINATED
14
$124,216
68
$130,895
133
$140,692
6
$40,137
11
$88,374
APPLICATIONS APPROVED, NOT ACCEPTED
1
$81,550
8
$123,132
15
$132,951
3
$26,200
1
$106,870
APPLICATIONS DENIED
0
$0
11
$119,660
45
$109,622
7
$22,627
1
$70,660
APPLICATIONS WITHDRAWN
1
$89,500
7
$119,989
32
$125,497
1
$24,440
1
$150,440
FILES CLOSED FOR INCOMPLETENESS
0
$0
5
$119,232
4
$188,195
0
$0
0
$0
Aggregated Statistics For Year 2002 (Based on 1 partial tract)
A) FHA, FSA/RHS & VA Home Purchase Loans
B) Conventional Home Purchase Loans
C) Refinancings
D) Home Improvement Loans
F) Non-occupant Loans on < 5 Family Dwellings (A B C & D)
Number
Average Value
Number
Average Value
Number
Average Value
Number
Average Value
Number
Average Value
LOANS ORIGINATED
15
$122,039
78
$135,220
71
$120,700
7
$37,977
6
$72,373
APPLICATIONS APPROVED, NOT ACCEPTED
0
$0
9
$125,741
17
$115,578
1
$41,800
0
$0
APPLICATIONS DENIED
2
$130,125
16
$115,037
26
$186,050
7
$21,029
3
$74,680
APPLICATIONS WITHDRAWN
2
$114,670
5
$161,096
21
$114,101
0
$0
1
$32,090
FILES CLOSED FOR INCOMPLETENESS
0
$0
3
$127,280
8
$144,366
0
$0
1
$35,920
Aggregated Statistics For Year 2001 (Based on 1 partial tract)
A) FHA, FSA/RHS & VA Home Purchase Loans
B) Conventional Home Purchase Loans
C) Refinancings
D) Home Improvement Loans
F) Non-occupant Loans on < 5 Family Dwellings (A B C & D)
Number
Average Value
Number
Average Value
Number
Average Value
Number
Average Value
Number
Average Value
LOANS ORIGINATED
17
$114,695
63
$117,886
50
$130,602
8
$17,811
5
$87,790
APPLICATIONS APPROVED, NOT ACCEPTED
1
$74,190
14
$77,490
7
$70,277
3
$26,987
1
$28,850
APPLICATIONS DENIED
1
$143,370
16
$50,029
17
$100,668
6
$18,988
2
$148,820
APPLICATIONS WITHDRAWN
2
$110,990
7
$144,677
11
$112,274
1
$13,540
1
$143,960
FILES CLOSED FOR INCOMPLETENESS
1
$68,600
1
$251,710
1
$147,490
0
$0
0
$0
Aggregated Statistics For Year 2000 (Based on 1 partial tract)
A) FHA, FSA/RHS & VA Home Purchase Loans
B) Conventional Home Purchase Loans
C) Refinancings
D) Home Improvement Loans
F) Non-occupant Loans on < 5 Family Dwellings (A B C & D)
Number
Average Value
Number
Average Value
Number
Average Value
Number
Average Value
Number
Average Value
LOANS ORIGINATED
23
$107,955
62
$112,883
12
$119,845
9
$24,501
3
$80,567
APPLICATIONS APPROVED, NOT ACCEPTED
2
$79,490
12
$97,348
2
$71,390
5
$22,374
1
$51,520
APPLICATIONS DENIED
2
$89,350
26
$60,329
5
$64,710
6
$18,105
0
$0
APPLICATIONS WITHDRAWN
3
$132,283
4
$154,340
3
$94,993
0
$0
0
$0
FILES CLOSED FOR INCOMPLETENESS
0
$0
2
$130,565
4
$92,958
0
$0
0
$0
Aggregated Statistics For Year 1999 (Based on 1 partial tract)
A) FHA, FSA/RHS & VA Home Purchase Loans
B) Conventional Home Purchase Loans
C) Refinancings
D) Home Improvement Loans
F) Non-occupant Loans on < 5 Family Dwellings (A B C & D)
Detailed PMIC statistics for the following Tracts:0214.03
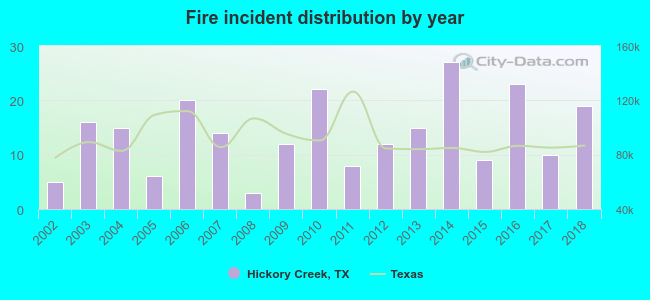
2002 - 2018 National Fire Incident Reporting System (NFIRS) incidents
According to the data from the years 2002 - 2018 the average number of fires per year is 14. The highest number of reported fire incidents - 27 took place in 2014, and the least - 3 in 2008. The data has a rising trend.
When looking into fire subcategories, the most incidents belonged to: Structure Fires (39.0%), and Outside Fires (34.3%).
Fire incident types reported to NFIRS in Hickory Creek, TX


 Recent articles from our blog. Our writers, many of them Ph.D. graduates or candidates, create easy-to-read articles on a wide variety of topics.

 (5.2 miles


 According to the data from the years 2002 - 2018 the average number of fires per year is 14. The highest number of reported fire incidents - 27 took place in 2014, and the least - 3 in 2008. The data has a rising trend.
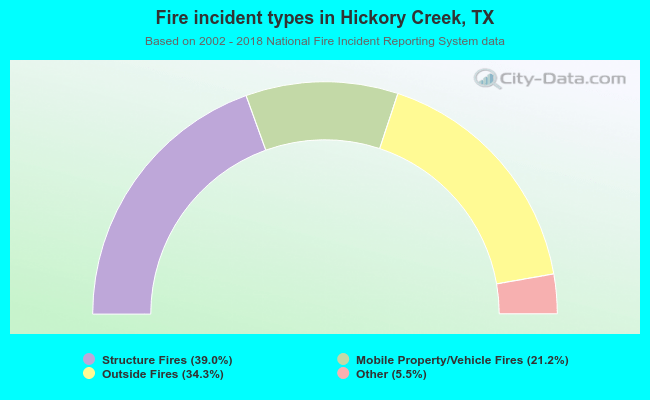 When looking into fire subcategories, the most incidents belonged to: Structure Fires (39.0%), and Outside Fires (34.3%).