Granite City, Illinois Submit your own pictures of this city and show them to the world
OSM Map
General Map
Google Map
MSN Map
OSM Map
General Map
Google Map
MSN Map
OSM Map
General Map
Google Map
MSN Map
OSM Map
General Map
Google Map
MSN Map
Please wait while loading the map...
Population in 2022: 27,121 (100% urban, 0% rural). Population change since 2000: -13.4%Males: 13,604 Females: 13,517
March 2022 cost of living index in Granite City: 93.9 (less than average, U.S. average is 100) Percentage of residents living in poverty in 2022: 18.6%for White Non-Hispanic residents , 41.6% for Black residents , 26.8% for Hispanic or Latino residents , 67.9% for American Indian residents , 22.7% for other race residents , 29.2% for two or more races residents )
Profiles of local businesses
Business Search - 14 Million verified businesses
Data:
Median household income ($)
Median household income (% change since 2000)
Household income diversity
Ratio of average income to average house value (%)
Ratio of average income to average rent
Median household income ($) - White
Median household income ($) - Black or African American
Median household income ($) - Asian
Median household income ($) - Hispanic or Latino
Median household income ($) - American Indian and Alaska Native
Median household income ($) - Multirace
Median household income ($) - Other Race
Median household income for houses/condos with a mortgage ($)
Median household income for apartments without a mortgage ($)
Races - White alone (%)
Races - White alone (% change since 2000)
Races - Black alone (%)
Races - Black alone (% change since 2000)
Races - American Indian alone (%)
Races - American Indian alone (% change since 2000)
Races - Asian alone (%)
Races - Asian alone (% change since 2000)
Races - Hispanic (%)
Races - Hispanic (% change since 2000)
Races - Native Hawaiian and Other Pacific Islander alone (%)
Races - Native Hawaiian and Other Pacific Islander alone (% change since 2000)
Races - Two or more races (%)
Races - Two or more races (% change since 2000)
Races - Other race alone (%)
Races - Other race alone (% change since 2000)
Racial diversity
Unemployment (%)
Unemployment (% change since 2000)
Unemployment (%) - White
Unemployment (%) - Black or African American
Unemployment (%) - Asian
Unemployment (%) - Hispanic or Latino
Unemployment (%) - American Indian and Alaska Native
Unemployment (%) - Multirace
Unemployment (%) - Other Race
Population density (people per square mile)
Population - Males (%)
Population - Females (%)
Population - Males (%) - White
Population - Males (%) - Black or African American
Population - Males (%) - Asian
Population - Males (%) - Hispanic or Latino
Population - Males (%) - American Indian and Alaska Native
Population - Males (%) - Multirace
Population - Males (%) - Other Race
Population - Females (%) - White
Population - Females (%) - Black or African American
Population - Females (%) - Asian
Population - Females (%) - Hispanic or Latino
Population - Females (%) - American Indian and Alaska Native
Population - Females (%) - Multirace
Population - Females (%) - Other Race
Coronavirus confirmed cases (Jul 02, 2024)
Deaths caused by coronavirus (Jul 02, 2024)
Coronavirus confirmed cases (per 100k population) (Jul 02, 2024)
Deaths caused by coronavirus (per 100k population) (Jul 02, 2024)
Daily increase in number of cases (Jul 02, 2024)
Weekly increase in number of cases (Jul 02, 2024)
Cases doubled (in days) (Jul 02, 2024)
Hospitalized patients (Apr 18, 2022)
Negative test results (Apr 18, 2022)
Total test results (Apr 18, 2022)
COVID Vaccine doses distributed (per 100k population) (Sep 19, 2023)
COVID Vaccine doses administered (per 100k population) (Sep 19, 2023)
COVID Vaccine doses distributed (Sep 19, 2023)
COVID Vaccine doses administered (Sep 19, 2023)
Likely homosexual households (%)
Likely homosexual households (% change since 2000)
Likely homosexual households - Lesbian couples (%)
Likely homosexual households - Lesbian couples (% change since 2000)
Likely homosexual households - Gay men (%)
Likely homosexual households - Gay men (% change since 2000)
Cost of living index
Median gross rent ($)
Median contract rent ($)
Median monthly housing costs ($)
Median house or condo value ($)
Median house or condo value ($ change since 2000)
Mean house or condo value by units in structure - 1, detached ($)
Mean house or condo value by units in structure - 1, attached ($)
Mean house or condo value by units in structure - 2 ($)
Mean house or condo value by units in structure by units in structure - 3 or 4 ($)
Mean house or condo value by units in structure - 5 or more ($)
Mean house or condo value by units in structure - Boat, RV, van, etc. ($)
Mean house or condo value by units in structure - Mobile home ($)
Median house or condo value ($) - White
Median house or condo value ($) - Black or African American
Median house or condo value ($) - Asian
Median house or condo value ($) - Hispanic or Latino
Median house or condo value ($) - American Indian and Alaska Native
Median house or condo value ($) - Multirace
Median house or condo value ($) - Other Race
Median resident age
Resident age diversity
Median resident age - Males
Median resident age - Females
Median resident age - White
Median resident age - Black or African American
Median resident age - Asian
Median resident age - Hispanic or Latino
Median resident age - American Indian and Alaska Native
Median resident age - Multirace
Median resident age - Other Race
Median resident age - Males - White
Median resident age - Males - Black or African American
Median resident age - Males - Asian
Median resident age - Males - Hispanic or Latino
Median resident age - Males - American Indian and Alaska Native
Median resident age - Males - Multirace
Median resident age - Males - Other Race
Median resident age - Females - White
Median resident age - Females - Black or African American
Median resident age - Females - Asian
Median resident age - Females - Hispanic or Latino
Median resident age - Females - American Indian and Alaska Native
Median resident age - Females - Multirace
Median resident age - Females - Other Race
Commute - mean travel time to work (minutes)
Travel time to work - Less than 5 minutes (%)
Travel time to work - Less than 5 minutes (% change since 2000)
Travel time to work - 5 to 9 minutes (%)
Travel time to work - 5 to 9 minutes (% change since 2000)
Travel time to work - 10 to 19 minutes (%)
Travel time to work - 10 to 19 minutes (% change since 2000)
Travel time to work - 20 to 29 minutes (%)
Travel time to work - 20 to 29 minutes (% change since 2000)
Travel time to work - 30 to 39 minutes (%)
Travel time to work - 30 to 39 minutes (% change since 2000)
Travel time to work - 40 to 59 minutes (%)
Travel time to work - 40 to 59 minutes (% change since 2000)
Travel time to work - 60 to 89 minutes (%)
Travel time to work - 60 to 89 minutes (% change since 2000)
Travel time to work - 90 or more minutes (%)
Travel time to work - 90 or more minutes (% change since 2000)
Marital status - Never married (%)
Marital status - Now married (%)
Marital status - Separated (%)
Marital status - Widowed (%)
Marital status - Divorced (%)
Median family income ($)
Median family income (% change since 2000)
Median non-family income ($)
Median non-family income (% change since 2000)
Median per capita income ($)
Median per capita income (% change since 2000)
Median family income ($) - White
Median family income ($) - Black or African American
Median family income ($) - Asian
Median family income ($) - Hispanic or Latino
Median family income ($) - American Indian and Alaska Native
Median family income ($) - Multirace
Median family income ($) - Other Race
Median year house/condo built
Median year apartment built
Year house built - Built 2005 or later (%)
Year house built - Built 2000 to 2004 (%)
Year house built - Built 1990 to 1999 (%)
Year house built - Built 1980 to 1989 (%)
Year house built - Built 1970 to 1979 (%)
Year house built - Built 1960 to 1969 (%)
Year house built - Built 1950 to 1959 (%)
Year house built - Built 1940 to 1949 (%)
Year house built - Built 1939 or earlier (%)
Average household size
Household density (households per square mile)
Average household size - White
Average household size - Black or African American
Average household size - Asian
Average household size - Hispanic or Latino
Average household size - American Indian and Alaska Native
Average household size - Multirace
Average household size - Other Race
Occupied housing units (%)
Vacant housing units (%)
Owner occupied housing units (%)
Renter occupied housing units (%)
Vacancy status - For rent (%)
Vacancy status - For sale only (%)
Vacancy status - Rented or sold, not occupied (%)
Vacancy status - For seasonal, recreational, or occasional use (%)
Vacancy status - For migrant workers (%)
Vacancy status - Other vacant (%)
Residents with income below the poverty level (%)
Residents with income below 50% of the poverty level (%)
Children below poverty level (%)
Poor families by family type - Married-couple family (%)
Poor families by family type - Male, no wife present (%)
Poor families by family type - Female, no husband present (%)
Poverty status for native-born residents (%)
Poverty status for foreign-born residents (%)
Poverty among high school graduates not in families (%)
Poverty among people who did not graduate high school not in families (%)
Residents with income below the poverty level (%) - White
Residents with income below the poverty level (%) - Black or African American
Residents with income below the poverty level (%) - Asian
Residents with income below the poverty level (%) - Hispanic or Latino
Residents with income below the poverty level (%) - American Indian and Alaska Native
Residents with income below the poverty level (%) - Multirace
Residents with income below the poverty level (%) - Other Race
Air pollution - Air Quality Index (AQI)
Air pollution - CO
Air pollution - NO2
Air pollution - SO2
Air pollution - Ozone
Air pollution - PM10
Air pollution - PM25
Air pollution - Pb
Crime - Murders per 100,000 population
Crime - Rapes per 100,000 population
Crime - Robberies per 100,000 population
Crime - Assaults per 100,000 population
Crime - Burglaries per 100,000 population
Crime - Thefts per 100,000 population
Crime - Auto thefts per 100,000 population
Crime - Arson per 100,000 population
Crime - City-data.com crime index
Crime - Violent crime index
Crime - Property crime index
Crime - Murders per 100,000 population (5 year average)
Crime - Rapes per 100,000 population (5 year average)
Crime - Robberies per 100,000 population (5 year average)
Crime - Assaults per 100,000 population (5 year average)
Crime - Burglaries per 100,000 population (5 year average)
Crime - Thefts per 100,000 population (5 year average)
Crime - Auto thefts per 100,000 population (5 year average)
Crime - Arson per 100,000 population (5 year average)
Crime - City-data.com crime index (5 year average)
Crime - Violent crime index (5 year average)
Crime - Property crime index (5 year average)
1996 Presidential Elections Results (%) - Democratic Party (Clinton)
1996 Presidential Elections Results (%) - Republican Party (Dole)
1996 Presidential Elections Results (%) - Other
2000 Presidential Elections Results (%) - Democratic Party (Gore)
2000 Presidential Elections Results (%) - Republican Party (Bush)
2000 Presidential Elections Results (%) - Other
2004 Presidential Elections Results (%) - Democratic Party (Kerry)
2004 Presidential Elections Results (%) - Republican Party (Bush)
2004 Presidential Elections Results (%) - Other
2008 Presidential Elections Results (%) - Democratic Party (Obama)
2008 Presidential Elections Results (%) - Republican Party (McCain)
2008 Presidential Elections Results (%) - Other
2012 Presidential Elections Results (%) - Democratic Party (Obama)
2012 Presidential Elections Results (%) - Republican Party (Romney)
2012 Presidential Elections Results (%) - Other
2016 Presidential Elections Results (%) - Democratic Party (Clinton)
2016 Presidential Elections Results (%) - Republican Party (Trump)
2016 Presidential Elections Results (%) - Other
2020 Presidential Elections Results (%) - Democratic Party (Biden)
2020 Presidential Elections Results (%) - Republican Party (Trump)
2020 Presidential Elections Results (%) - Other
Ancestries Reported - Arab (%)
Ancestries Reported - Czech (%)
Ancestries Reported - Danish (%)
Ancestries Reported - Dutch (%)
Ancestries Reported - English (%)
Ancestries Reported - French (%)
Ancestries Reported - French Canadian (%)
Ancestries Reported - German (%)
Ancestries Reported - Greek (%)
Ancestries Reported - Hungarian (%)
Ancestries Reported - Irish (%)
Ancestries Reported - Italian (%)
Ancestries Reported - Lithuanian (%)
Ancestries Reported - Norwegian (%)
Ancestries Reported - Polish (%)
Ancestries Reported - Portuguese (%)
Ancestries Reported - Russian (%)
Ancestries Reported - Scotch-Irish (%)
Ancestries Reported - Scottish (%)
Ancestries Reported - Slovak (%)
Ancestries Reported - Subsaharan African (%)
Ancestries Reported - Swedish (%)
Ancestries Reported - Swiss (%)
Ancestries Reported - Ukrainian (%)
Ancestries Reported - United States (%)
Ancestries Reported - Welsh (%)
Ancestries Reported - West Indian (%)
Ancestries Reported - Other (%)
Educational Attainment - No schooling completed (%)
Educational Attainment - Less than high school (%)
Educational Attainment - High school or equivalent (%)
Educational Attainment - Less than 1 year of college (%)
Educational Attainment - 1 or more years of college (%)
Educational Attainment - Associate degree (%)
Educational Attainment - Bachelor's degree (%)
Educational Attainment - Master's degree (%)
Educational Attainment - Professional school degree (%)
Educational Attainment - Doctorate degree (%)
School Enrollment - Nursery, preschool (%)
School Enrollment - Kindergarten (%)
School Enrollment - Grade 1 to 4 (%)
School Enrollment - Grade 5 to 8 (%)
School Enrollment - Grade 9 to 12 (%)
School Enrollment - College undergrad (%)
School Enrollment - Graduate or professional (%)
School Enrollment - Not enrolled in school (%)
School enrollment - Public schools (%)
School enrollment - Private schools (%)
School enrollment - Not enrolled (%)
Median number of rooms in houses and condos
Median number of rooms in apartments
Housing units lacking complete plumbing facilities (%)
Housing units lacking complete kitchen facilities (%)
Density of houses
Urban houses (%)
Rural houses (%)
Households with people 60 years and over (%)
Households with people 65 years and over (%)
Households with people 75 years and over (%)
Households with one or more nonrelatives (%)
Households with no nonrelatives (%)
Population in households (%)
Family households (%)
Nonfamily households (%)
Population in families (%)
Family households with own children (%)
Median number of bedrooms in owner occupied houses
Mean number of bedrooms in owner occupied houses
Median number of bedrooms in renter occupied houses
Mean number of bedrooms in renter occupied houses
Median number of vehichles in owner occupied houses
Mean number of vehichles in owner occupied houses
Median number of vehichles in renter occupied houses
Mean number of vehichles in renter occupied houses
Mortgage status - with mortgage (%)
Mortgage status - with second mortgage (%)
Mortgage status - with home equity loan (%)
Mortgage status - with both second mortgage and home equity loan (%)
Mortgage status - without a mortgage (%)
Average family size
Average family size - White
Average family size - Black or African American
Average family size - Asian
Average family size - Hispanic or Latino
Average family size - American Indian and Alaska Native
Average family size - Multirace
Average family size - Other Race
Geographical mobility - Same house 1 year ago (%)
Geographical mobility - Moved within same county (%)
Geographical mobility - Moved from different county within same state (%)
Geographical mobility - Moved from different state (%)
Geographical mobility - Moved from abroad (%)
Place of birth - Born in state of residence (%)
Place of birth - Born in other state (%)
Place of birth - Native, outside of US (%)
Place of birth - Foreign born (%)
Housing units in structures - 1, detached (%)
Housing units in structures - 1, attached (%)
Housing units in structures - 2 (%)
Housing units in structures - 3 or 4 (%)
Housing units in structures - 5 to 9 (%)
Housing units in structures - 10 to 19 (%)
Housing units in structures - 20 to 49 (%)
Housing units in structures - 50 or more (%)
Housing units in structures - Mobile home (%)
Housing units in structures - Boat, RV, van, etc. (%)
House/condo owner moved in on average (years ago)
Renter moved in on average (years ago)
Year householder moved into unit - Moved in 1999 to March 2000 (%)
Year householder moved into unit - Moved in 1995 to 1998 (%)
Year householder moved into unit - Moved in 1990 to 1994 (%)
Year householder moved into unit - Moved in 1980 to 1989 (%)
Year householder moved into unit - Moved in 1970 to 1979 (%)
Year householder moved into unit - Moved in 1969 or earlier (%)
Means of transportation to work - Drove car alone (%)
Means of transportation to work - Carpooled (%)
Means of transportation to work - Public transportation (%)
Means of transportation to work - Bus or trolley bus (%)
Means of transportation to work - Streetcar or trolley car (%)
Means of transportation to work - Subway or elevated (%)
Means of transportation to work - Railroad (%)
Means of transportation to work - Ferryboat (%)
Means of transportation to work - Taxicab (%)
Means of transportation to work - Motorcycle (%)
Means of transportation to work - Bicycle (%)
Means of transportation to work - Walked (%)
Means of transportation to work - Other means (%)
Working at home (%)
Industry diversity
Most Common Industries - Agriculture, forestry, fishing and hunting, and mining (%)
Most Common Industries - Agriculture, forestry, fishing and hunting (%)
Most Common Industries - Mining, quarrying, and oil and gas extraction (%)
Most Common Industries - Construction (%)
Most Common Industries - Manufacturing (%)
Most Common Industries - Wholesale trade (%)
Most Common Industries - Retail trade (%)
Most Common Industries - Transportation and warehousing, and utilities (%)
Most Common Industries - Transportation and warehousing (%)
Most Common Industries - Utilities (%)
Most Common Industries - Information (%)
Most Common Industries - Finance and insurance, and real estate and rental and leasing (%)
Most Common Industries - Finance and insurance (%)
Most Common Industries - Real estate and rental and leasing (%)
Most Common Industries - Professional, scientific, and management, and administrative and waste management services (%)
Most Common Industries - Professional, scientific, and technical services (%)
Most Common Industries - Management of companies and enterprises (%)
Most Common Industries - Administrative and support and waste management services (%)
Most Common Industries - Educational services, and health care and social assistance (%)
Most Common Industries - Educational services (%)
Most Common Industries - Health care and social assistance (%)
Most Common Industries - Arts, entertainment, and recreation, and accommodation and food services (%)
Most Common Industries - Arts, entertainment, and recreation (%)
Most Common Industries - Accommodation and food services (%)
Most Common Industries - Other services, except public administration (%)
Most Common Industries - Public administration (%)
Occupation diversity
Most Common Occupations - Management, business, science, and arts occupations (%)
Most Common Occupations - Management, business, and financial occupations (%)
Most Common Occupations - Management occupations (%)
Most Common Occupations - Business and financial operations occupations (%)
Most Common Occupations - Computer, engineering, and science occupations (%)
Most Common Occupations - Computer and mathematical occupations (%)
Most Common Occupations - Architecture and engineering occupations (%)
Most Common Occupations - Life, physical, and social science occupations (%)
Most Common Occupations - Education, legal, community service, arts, and media occupations (%)
Most Common Occupations - Community and social service occupations (%)
Most Common Occupations - Legal occupations (%)
Most Common Occupations - Education, training, and library occupations (%)
Most Common Occupations - Arts, design, entertainment, sports, and media occupations (%)
Most Common Occupations - Healthcare practitioners and technical occupations (%)
Most Common Occupations - Health diagnosing and treating practitioners and other technical occupations (%)
Most Common Occupations - Health technologists and technicians (%)
Most Common Occupations - Service occupations (%)
Most Common Occupations - Healthcare support occupations (%)
Most Common Occupations - Protective service occupations (%)
Most Common Occupations - Fire fighting and prevention, and other protective service workers including supervisors (%)
Most Common Occupations - Law enforcement workers including supervisors (%)
Most Common Occupations - Food preparation and serving related occupations (%)
Most Common Occupations - Building and grounds cleaning and maintenance occupations (%)
Most Common Occupations - Personal care and service occupations (%)
Most Common Occupations - Sales and office occupations (%)
Most Common Occupations - Sales and related occupations (%)
Most Common Occupations - Office and administrative support occupations (%)
Most Common Occupations - Natural resources, construction, and maintenance occupations (%)
Most Common Occupations - Farming, fishing, and forestry occupations (%)
Most Common Occupations - Construction and extraction occupations (%)
Most Common Occupations - Installation, maintenance, and repair occupations (%)
Most Common Occupations - Production, transportation, and material moving occupations (%)
Most Common Occupations - Production occupations (%)
Most Common Occupations - Transportation occupations (%)
Most Common Occupations - Material moving occupations (%)
People in Group quarters - Institutionalized population (%)
People in Group quarters - Correctional institutions (%)
People in Group quarters - Federal prisons and detention centers (%)
People in Group quarters - Halfway houses (%)
People in Group quarters - Local jails and other confinement facilities (including police lockups) (%)
People in Group quarters - Military disciplinary barracks (%)
People in Group quarters - State prisons (%)
People in Group quarters - Other types of correctional institutions (%)
People in Group quarters - Nursing homes (%)
People in Group quarters - Hospitals/wards, hospices, and schools for the handicapped (%)
People in Group quarters - Hospitals/wards and hospices for chronically ill (%)
People in Group quarters - Hospices or homes for chronically ill (%)
People in Group quarters - Military hospitals or wards for chronically ill (%)
People in Group quarters - Other hospitals or wards for chronically ill (%)
People in Group quarters - Hospitals or wards for drug/alcohol abuse (%)
People in Group quarters - Mental (Psychiatric) hospitals or wards (%)
People in Group quarters - Schools, hospitals, or wards for the mentally retarded (%)
People in Group quarters - Schools, hospitals, or wards for the physically handicapped (%)
People in Group quarters - Institutions for the deaf (%)
People in Group quarters - Institutions for the blind (%)
People in Group quarters - Orthopedic wards and institutions for the physically handicapped (%)
People in Group quarters - Wards in general hospitals for patients who have no usual home elsewhere (%)
People in Group quarters - Wards in military hospitals for patients who have no usual home elsewhere (%)
People in Group quarters - Juvenile institutions (%)
People in Group quarters - Long-term care (%)
People in Group quarters - Homes for abused, dependent, and neglected children (%)
People in Group quarters - Residential treatment centers for emotionally disturbed children (%)
People in Group quarters - Training schools for juvenile delinquents (%)
People in Group quarters - Short-term care, detention or diagnostic centers for delinquent children (%)
People in Group quarters - Type of juvenile institution unknown (%)
People in Group quarters - Noninstitutionalized population (%)
People in Group quarters - College dormitories (includes college quarters off campus) (%)
People in Group quarters - Military quarters (%)
People in Group quarters - On base (%)
People in Group quarters - Barracks, unaccompanied personnel housing (UPH), (Enlisted/Officer), ;and similar group living quarters for military personnel (%)
People in Group quarters - Transient quarters for temporary residents (%)
People in Group quarters - Military ships (%)
People in Group quarters - Group homes (%)
People in Group quarters - Homes or halfway houses for drug/alcohol abuse (%)
People in Group quarters - Homes for the mentally ill (%)
People in Group quarters - Homes for the mentally retarded (%)
People in Group quarters - Homes for the physically handicapped (%)
People in Group quarters - Other group homes (%)
People in Group quarters - Religious group quarters (%)
People in Group quarters - Dormitories (%)
People in Group quarters - Agriculture workers' dormitories on farms (%)
People in Group quarters - Job Corps and vocational training facilities (%)
People in Group quarters - Other workers' dormitories (%)
People in Group quarters - Crews of maritime vessels (%)
People in Group quarters - Other nonhousehold living situations (%)
People in Group quarters - Other noninstitutional group quarters (%)
Residents speaking English at home (%)
Residents speaking English at home - Born in the United States (%)
Residents speaking English at home - Native, born elsewhere (%)
Residents speaking English at home - Foreign born (%)
Residents speaking Spanish at home (%)
Residents speaking Spanish at home - Born in the United States (%)
Residents speaking Spanish at home - Native, born elsewhere (%)
Residents speaking Spanish at home - Foreign born (%)
Residents speaking other language at home (%)
Residents speaking other language at home - Born in the United States (%)
Residents speaking other language at home - Native, born elsewhere (%)
Residents speaking other language at home - Foreign born (%)
Class of Workers - Employee of private company (%)
Class of Workers - Self-employed in own incorporated business (%)
Class of Workers - Private not-for-profit wage and salary workers (%)
Class of Workers - Local government workers (%)
Class of Workers - State government workers (%)
Class of Workers - Federal government workers (%)
Class of Workers - Self-employed workers in own not incorporated business and Unpaid family workers (%)
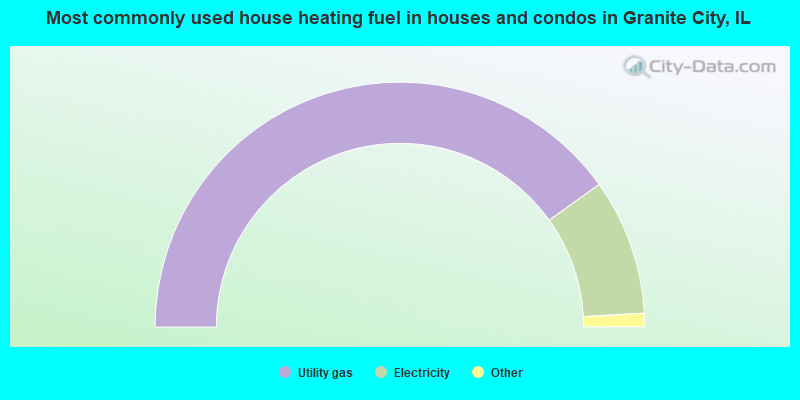
House heating fuel used in houses and condos - Utility gas (%)
House heating fuel used in houses and condos - Bottled, tank, or LP gas (%)
House heating fuel used in houses and condos - Electricity (%)
House heating fuel used in houses and condos - Fuel oil, kerosene, etc. (%)
House heating fuel used in houses and condos - Coal or coke (%)
House heating fuel used in houses and condos - Wood (%)
House heating fuel used in houses and condos - Solar energy (%)
House heating fuel used in houses and condos - Other fuel (%)
House heating fuel used in houses and condos - No fuel used (%)
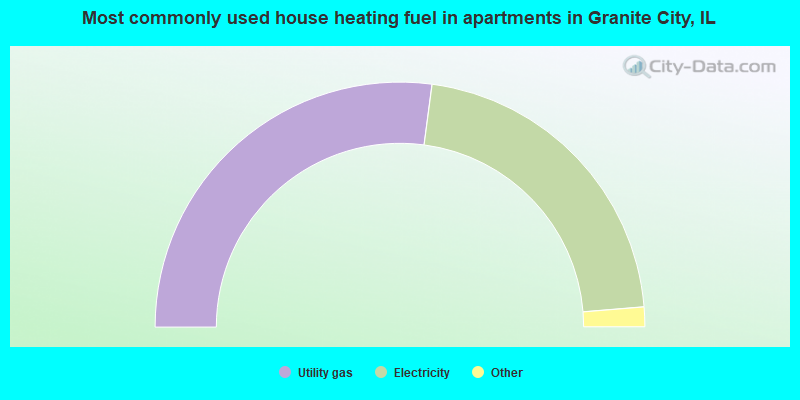
House heating fuel used in apartments - Utility gas (%)
House heating fuel used in apartments - Bottled, tank, or LP gas (%)
House heating fuel used in apartments - Electricity (%)
House heating fuel used in apartments - Fuel oil, kerosene, etc. (%)
House heating fuel used in apartments - Coal or coke (%)
House heating fuel used in apartments - Wood (%)
House heating fuel used in apartments - Solar energy (%)
House heating fuel used in apartments - Other fuel (%)
House heating fuel used in apartments - No fuel used (%)
Armed forces status - In Armed Forces (%)
Armed forces status - Civilian (%)
Armed forces status - Civilian - Veteran (%)
Armed forces status - Civilian - Nonveteran (%)
Fatal accidents locations in years 2005-2021
Fatal accidents locations in 2005
Fatal accidents locations in 2006
Fatal accidents locations in 2007
Fatal accidents locations in 2008
Fatal accidents locations in 2009
Fatal accidents locations in 2010
Fatal accidents locations in 2011
Fatal accidents locations in 2012
Fatal accidents locations in 2013
Fatal accidents locations in 2014
Fatal accidents locations in 2015
Fatal accidents locations in 2016
Fatal accidents locations in 2017
Fatal accidents locations in 2018
Fatal accidents locations in 2019
Fatal accidents locations in 2020
Fatal accidents locations in 2021
Alcohol use - People drinking some alcohol every month (%)
Alcohol use - People not drinking at all (%)
Alcohol use - Average days/month drinking alcohol
Alcohol use - Average drinks/week
Alcohol use - Average days/year people drink much
Audiometry - Average condition of hearing (%)
Audiometry - People that can hear a whisper from across a quiet room (%)
Audiometry - People that can hear normal voice from across a quiet room (%)
Audiometry - Ears ringing, roaring, buzzing (%)
Audiometry - Had a job exposure to loud noise (%)
Audiometry - Had off-work exposure to loud noise (%)
Blood Pressure & Cholesterol - Has high blood pressure (%)
Blood Pressure & Cholesterol - Checking blood pressure at home (%)
Blood Pressure & Cholesterol - Frequently checking blood cholesterol (%)
Blood Pressure & Cholesterol - Has high cholesterol level (%)
Consumer Behavior - Money monthly spent on food at supermarket/grocery store
Consumer Behavior - Money monthly spent on food at other stores
Consumer Behavior - Money monthly spent on eating out
Consumer Behavior - Money monthly spent on carryout/delivered foods
Consumer Behavior - Income spent on food at supermarket/grocery store (%)
Consumer Behavior - Income spent on food at other stores (%)
Consumer Behavior - Income spent on eating out (%)
Consumer Behavior - Income spent on carryout/delivered foods (%)
Current Health Status - General health condition (%)
Current Health Status - Blood donors (%)
Current Health Status - Has blood ever tested for HIV virus (%)
Current Health Status - Left-handed people (%)
Dermatology - People using sunscreen (%)
Diabetes - Diabetics (%)
Diabetes - Had a blood test for high blood sugar (%)
Diabetes - People taking insulin (%)
Diet Behavior & Nutrition - Diet health (%)
Diet Behavior & Nutrition - Milk product consumption (# of products/month)
Diet Behavior & Nutrition - Meals not home prepared (#/week)
Diet Behavior & Nutrition - Meals from fast food or pizza place (#/week)
Diet Behavior & Nutrition - Ready-to-eat foods (#/month)
Diet Behavior & Nutrition - Frozen meals/pizza (#/month)
Drug Use - People that ever used marijuana or hashish (%)
Drug Use - Ever used hard drugs (%)
Drug Use - Ever used any form of cocaine (%)
Drug Use - Ever used heroin (%)
Drug Use - Ever used methamphetamine (%)
Health Insurance - People covered by health insurance (%)
Kidney Conditions-Urology - Avg. # of times urinating at night
Medical Conditions - People with asthma (%)
Medical Conditions - People with anemia (%)
Medical Conditions - People with psoriasis (%)
Medical Conditions - People with overweight (%)
Medical Conditions - Elderly people having difficulties in thinking or remembering (%)
Medical Conditions - People who ever received blood transfusion (%)
Medical Conditions - People having trouble seeing even with glass/contacts (%)
Medical Conditions - People with arthritis (%)
Medical Conditions - People with gout (%)
Medical Conditions - People with congestive heart failure (%)
Medical Conditions - People with coronary heart disease (%)
Medical Conditions - People with angina pectoris (%)
Medical Conditions - People who ever had heart attack (%)
Medical Conditions - People who ever had stroke (%)
Medical Conditions - People with emphysema (%)
Medical Conditions - People with thyroid problem (%)
Medical Conditions - People with chronic bronchitis (%)
Medical Conditions - People with any liver condition (%)
Medical Conditions - People who ever had cancer or malignancy (%)
Mental Health - People who have little interest in doing things (%)
Mental Health - People feeling down, depressed, or hopeless (%)
Mental Health - People who have trouble sleeping or sleeping too much (%)
Mental Health - People feeling tired or having little energy (%)
Mental Health - People with poor appetite or overeating (%)
Mental Health - People feeling bad about themself (%)
Mental Health - People who have trouble concentrating on things (%)
Mental Health - People moving or speaking slowly or too fast (%)
Mental Health - People having thoughts they would be better off dead (%)
Oral Health - Average years since last visit a dentist
Oral Health - People embarrassed because of mouth (%)
Oral Health - People with gum disease (%)
Oral Health - General health of teeth and gums (%)
Oral Health - Average days a week using dental floss/device
Oral Health - Average days a week using mouthwash for dental problem
Oral Health - Average number of teeth
Pesticide Use - Households using pesticides to control insects (%)
Pesticide Use - Households using pesticides to kill weeds (%)
Physical Activity - People doing vigorous-intensity work activities (%)
Physical Activity - People doing moderate-intensity work activities (%)
Physical Activity - People walking or bicycling (%)
Physical Activity - People doing vigorous-intensity recreational activities (%)
Physical Activity - People doing moderate-intensity recreational activities (%)
Physical Activity - Average hours a day doing sedentary activities
Physical Activity - Average hours a day watching TV or videos
Physical Activity - Average hours a day using computer
Physical Functioning - People having limitations keeping them from working (%)
Physical Functioning - People limited in amount of work they can do (%)
Physical Functioning - People that need special equipment to walk (%)
Physical Functioning - People experiencing confusion/memory problems (%)
Physical Functioning - People requiring special healthcare equipment (%)
Prescription Medications - Average number of prescription medicines taking
Preventive Aspirin Use - Adults 40+ taking low-dose aspirin (%)
Reproductive Health - Vaginal deliveries (%)
Reproductive Health - Cesarean deliveries (%)
Reproductive Health - Deliveries resulted in a live birth (%)
Reproductive Health - Pregnancies resulted in a delivery (%)
Reproductive Health - Women breastfeeding newborns (%)
Reproductive Health - Women that had a hysterectomy (%)
Reproductive Health - Women that had both ovaries removed (%)
Reproductive Health - Women that have ever taken birth control pills (%)
Reproductive Health - Women taking birth control pills (%)
Reproductive Health - Women that have ever used Depo-Provera or injectables (%)
Reproductive Health - Women that have ever used female hormones (%)
Sexual Behavior - People 18+ that ever had sex (vaginal, anal, or oral) (%)
Sexual Behavior - Males 18+ that ever had vaginal sex with a woman (%)
Sexual Behavior - Males 18+ that ever performed oral sex on a woman (%)
Sexual Behavior - Males 18+ that ever had anal sex with a woman (%)
Sexual Behavior - Males 18+ that ever had any sex with a man (%)
Sexual Behavior - Females 18+ that ever had vaginal sex with a man (%)
Sexual Behavior - Females 18+ that ever performed oral sex on a man (%)
Sexual Behavior - Females 18+ that ever had anal sex with a man (%)
Sexual Behavior - Females 18+ that ever had any kind of sex with a woman (%)
Sexual Behavior - Average age people first had sex
Sexual Behavior - Average number of female sex partners in lifetime (males 18+)
Sexual Behavior - Average number of female vaginal sex partners in lifetime (males 18+)
Sexual Behavior - Average age people first performed oral sex on a woman (18+)
Sexual Behavior - Average number of woman performed oral sex on in lifetime (18+)
Sexual Behavior - Average number of male sex partners in lifetime (males 18+)
Sexual Behavior - Average number of male anal sex partners in lifetime (males 18+)
Sexual Behavior - Average age people first performed oral sex on a man (18+)
Sexual Behavior - Average number of male oral sex partners in lifetime (18+)
Sexual Behavior - People using protection when performing oral sex (%)
Sexual Behavior - Average number of times people have vaginal or anal sex a year
Sexual Behavior - People having sex without condom (%)
Sexual Behavior - Average number of male sex partners in lifetime (females 18+)
Sexual Behavior - Average number of male vaginal sex partners in lifetime (females 18+)
Sexual Behavior - Average number of female sex partners in lifetime (females 18+)
Sexual Behavior - Circumcised males 18+ (%)
Sleep Disorders - Average hours sleeping at night
Sleep Disorders - People that has trouble sleeping (%)
Smoking-Cigarette Use - People smoking cigarettes (%)
Taste & Smell - People 40+ having problems with smell (%)
Taste & Smell - People 40+ having problems with taste (%)
Taste & Smell - People 40+ that ever had wisdom teeth removed (%)
Taste & Smell - People 40+ that ever had tonsils teeth removed (%)
Taste & Smell - People 40+ that ever had a loss of consciousness because of a head injury (%)
Taste & Smell - People 40+ that ever had a broken nose or other serious injury to face or skull (%)
Taste & Smell - People 40+ that ever had two or more sinus infections (%)
Weight - Average height (inches)
Weight - Average weight (pounds)
Weight - Average BMI
Weight - People that are obese (%)
Weight - People that ever were obese (%)
Weight - People trying to lose weight (%)
Officers per 1,000 residents here:
2.04Illinois average:
3.04
Latest news from Granite City, IL collected exclusively by city-data.com from local newspapers, TV, and radio stations
Granite City, IL City Guides: Ancestries: German (15.3%), Irish (8.0%), American (7.9%), English (7.9%), Italian (3.9%), Scotch-Irish (3.5%).
Current Local Time:
Incorporated on 06/08/1896
Land area: 16.7 square miles.
Population density: 1,626 people per square mile (low).
707 residents are foreign born (1.3% Latin America , 0.5% Europe , 0.4% Asia ).
This city:
2.6%Illinois:
14.1%
Median real estate property taxes paid for housing units with mortgages in 2022: $2,305 (2.2%)Median real estate property taxes paid for housing units with no mortgage in 2022: $1,731 (1.7%)
Nearest city with pop. 50,000+: St. Louis, MO
Nearest city with pop. 1,000,000+: Chicago, IL
Nearest cities:
Latitude: 38.72 N, Longitude: 90.13 W
Daytime population change due to commuting: +732 (+2.7%)Workers who live and work in this city: 4,336 (36.1%)
Single-family new house construction building permits:
2022: 7 buildings , average cost: $164,4002021: 4 buildings , average cost: $158,1002020: 6 buildings , average cost: $117,5002019: 7 buildings , average cost: $129,3002018: 6 buildings , average cost: $153,3002017: 5 buildings , average cost: $120,0002016: 3 buildings , average cost: $118,3002015: 7 buildings , average cost: $119,4002014: 6 buildings , average cost: $147,3002013: 12 buildings , average cost: $108,3002012: 12 buildings , average cost: $103,3002011: 7 buildings , average cost: $132,1002010: 15 buildings , average cost: $97,3002009: 31 buildings , average cost: $155,5002008: 53 buildings , average cost: $125,8002007: 80 buildings , average cost: $112,0002006: 46 buildings , average cost: $132,6002005: 36 buildings , average cost: $157,0002004: 27 buildings , average cost: $128,5002003: 36 buildings , average cost: $119,4002002: 29 buildings , average cost: $99,0002001: 18 buildings , average cost: $95,3002000: 15 buildings , average cost: $81,1001999: 7 buildings , average cost: $110,7001998: 15 buildings , average cost: $97,6001997: 12 buildings , average cost: $77,300Unemployment in December 2023:
Most common occupations in Granite City, IL (%)
Both Males Females
Laborers and material movers, hand (5.5%)
Other production occupations, including supervisors (4.9%)
Secretaries and administrative assistants (4.9%)
Metal workers and plastic workers (3.9%)
Other management occupations, except farmers and farm managers (3.9%)
Building and grounds cleaning and maintenance occupations (3.8%)
Material recording, scheduling, dispatching, and distributing workers (3.3%)
Laborers and material movers, hand (7.9%)
Other production occupations, including supervisors (7.0%)
Metal workers and plastic workers (6.9%)
Electrical equipment mechanics and other installation, maintenance, and repair workers, including supervisors (5.9%)
Driver/sales workers and truck drivers (5.2%)
Building and grounds cleaning and maintenance occupations (4.8%)
Other material moving workers, except laborers (4.2%)
Secretaries and administrative assistants (10.1%)
Other office and administrative support workers, including supervisors (5.9%)
Information and record clerks, except customer service representatives (4.7%)
Preschool, kindergarten, elementary, and middle school teachers (4.7%)
Other management occupations, except farmers and farm managers (3.6%)
Cashiers (3.5%)
Nursing, psychiatric, and home health aides (3.4%)
Tornado activity:
Granite City-area historical tornado activity is near Illinois state average. It is 85% greater than the overall U.S. average.
On 4/3/1981, a category F4 (max. wind speeds 207-260 mph) tornado 0.2 miles away from the Granite City city center injured 32 people and caused between $5,000,000 and $50,000,000 in damages.
On 2/10/1959, a category F4 tornado 3.5 miles away from the city center killed 21 people and injured 345 people and caused between $5,000,000 and $50,000,000 in damages.
Earthquake activity:
Granite City-area historical earthquake activity is significantly above Illinois state average. It is 302% greater than the overall U.S. average. On 4/18/2008 at 09:36:59, a magnitude 5.4 (5.1 MB, 4.8 MS, 5.4 MW, 5.2 MW, Class: Moderate, Intensity: VI - VII) earthquake occurred 122.7 miles away from Granite City center On 4/18/2008 at 09:36:59, a magnitude 5.2 (5.2 MW, Depth: 8.9 mi) earthquake occurred 122.7 miles away from Granite City center On 6/10/1987 at 23:48:54, a magnitude 5.1 (4.9 MB, 4.4 MS, 4.6 MS, 5.1 LG) earthquake occurred 121.2 miles away from the city center On 9/26/1990 at 13:18:51, a magnitude 5.0 (4.7 MB, 4.8 LG, 5.0 LG, Depth: 7.7 mi) earthquake occurred 112.1 miles away from the city center On 6/18/2002 at 17:37:15, a magnitude 5.0 (4.3 MB, 4.6 MW, 5.0 LG) earthquake occurred 137.1 miles away from the city center On 5/4/1991 at 01:18:54, a magnitude 5.0 (4.4 MB, 4.6 LG, 5.0 LG, Depth: 3.1 mi) earthquake occurred 149.9 miles away from the city center Magnitude types: regional Lg-wave magnitude (LG), body-wave magnitude (MB), surface-wave magnitude (MS), moment magnitude (MW) Natural disasters: The number of natural disasters in Madison County (14) is near the US average (15).Major Disasters (Presidential) Declared: 11Emergencies Declared: 1Floods: 11, Storms: 10, Tornadoes: 3, Heavy Rain: 1, Hurricane: 1, Winter Storm: 1, Other: 1 (Note: some incidents may be assigned to more than one category). Hospitals and medical centers in Granite City: GATEWAY REGIONAL MEDICAL CENTER (Proprietary, 2100 MADISON AVENUE) LYNHAVEN (1108 ENGINEER ROAD) GRANITE NURSING AND REHABILITATION (3500 CENTURY DRIVE)
STEARNS NURSING AND REHAB CENTER (3900 STEARNS AVENUE)
DAVITA - GRANITE CITY DIALYSIS CENTER (9 AMERICAN VILLAGE)
GATEWAY REGIONAL HOME HEALTH - GRANITE CITY (2100 MADISON AVENUE)
Heliports located in Granite City: Amtrak stations near Granite City: 8 miles: ST. LOUIS (550 S. 16TH ST.) Services: ticket office, partially wheelchair accessible, enclosed waiting area, public restrooms, public payphones, vending machines, free short-term parking, free long-term parking, call for car rental service, taxi stand.
13 miles: ALTON (3400 COLLEGE AVE.) Services: ticket office, fully wheelchair accessible, public payphones, vending machines, free short-term parking, free long-term parking, call for taxi service.
18 miles: KIRKWOOD (110 W. ARGONNE RD.) Services: ticket office, partially wheelchair accessible, enclosed waiting area, public restrooms, public payphones, free short-term parking, free long-term parking, taxi stand, intercity bus service, public transit connection.
Colleges/universities with over 2000 students nearest to Granite City:
Saint Louis Community College (about 8 miles; Saint Louis, MO ; Full-time enrollment: 18,019)
Ranken Technical College (about 8 miles; Saint Louis, MO ; FT enrollment: 2,134)
Saint Louis University (about 8 miles; Saint Louis, MO ; FT enrollment: 11,606)
Southern Illinois University-Edwardsville (about 9 miles; Edwardsville, IL ; FT enrollment: 11,933)
University of Missouri-St Louis (about 10 miles; Saint Louis, MO ; FT enrollment: 10,322)
Washington University in St Louis (about 11 miles; Saint Louis, MO ; FT enrollment: 10,823)
Webster University (about 15 miles; Saint Louis, MO ; FT enrollment: 12,406)
Public high school in Granite City:
Private high schools in Granite City: COORDINATED YOUTH & HUMAN SERVICES Students: 53, Location: 1611 W 3RD ST, Grades: 5-12)
CENTRAL BAPTIST SCHOOL Students: 15, Location: 3940 HIGHWAY 111, Grades: KG-12)
Public elementary/middle schools in Granite City: PRATHER ELEMENTARY SCHOOL Students: 454, Location: 2300 W 25TH ST, Grades: KG-4)MARYVILLE ELEM SCHOOL Students: 442, Location: 4651 MARYVILLE RD, Grades: KG-4)FROHARDT ELEM SCHOOL Students: 410, Location: 2040 JOHNSON RD, Grades: KG-4)WORTHEN ELEM SCHOOL Students: 410, Location: 3200 MARYVILLE RD, Grades: KG-4)COOLIDGE JUNIOR HIGH SCH Students: 361, Location: 3231 NAMEOKI RD, Grades: 7-8)GRIGSBY INTERMEDIATE SCH Location: 3801 CARGILL RD, Grades: 5-6)
MITCHELL ELEMENTARY SCHOOL Location: 316 E CHAIN OF ROCKS RD, Grades: KG-4)
WILSON ELEM SCHOOL Location: 2400 WILSON AVE, Grades: KG-4)
Private elementary/middle schools in Granite City: ST ELIZABETH ELEMENTARY SCHOOL Students: 210, Location: 2300 PONTOON RD, Grades: PK-8)
HOLY FAMILY SCHOOL Students: 190, Location: 1900 SAINT CLAIR AVE, Grades: KG-8)
METRO EAST MONTESSORI SCHOOL Students: 56, Location: 4405 HIGHWAY 163, Grades: PK-6)
See full list of schools located in Granite City Library in Granite City: SIX MILE REGIONAL LIBRARY DISTRICT Operating income: $1,288,448; Location: 2001 DELMAR AVENUE; 95,021 books ; 4,956 audio materials ; 3,946 video materials ; 9 local licensed databases ; 16 state licensed databases ; 1 other licensed databases ; 265 print serial subscriptions )
User-submitted facts and corrections:
Southwestern Illinois College is located in Granite City, 4950 Maryville Road. It is a Community College that services about 3500 area residents.
St. Elizabeth's Hospital is now Gateway Regional Medical Center.
There is an additional private school in Granite City, that's K-12. Enrollment is 20 students. The name is Liberty Christian Academy. It's located on Maryville Road.
First United Pentecostal Church located at 2450 Pontoon Road, Granite City, IL was established in the early 1900's
Notable locations in Granite City: (A) , Granite City Public Library (B) , Granite City City Hall (C) , Granite City Fire Department Station 1 (D) , Granite City Fire Department Station 3 (E) . Display/hide their locations on the map
Shopping Centers: (1) , Nameoki Village Shopping Center (2) , Bellemore Village Shopping Center (3) . Display/hide their locations on the map
Churches in Granite City include: (A) , Bethel Chapel Pentecostal Church (B) , Calvary Baptist Church (C) , Central Christian Church (D) , Central Free Methodist Church (E) , Church of Christ (F) , City Temple Church (G) , Concordia Evangelical Lutheran Church (H) , Dewey Avenue United Methodist Church (I) . Display/hide their locations on the map
Cemeteries: (1) , Emmert Cemetery (2) , Kirkpatrick Cemetery (3) , New Methodist Cemetery (4) , Saint John United Church of Christ (5) , Odd Fellows Cemetery (6) . Display/hide their locations on the map
Lake: (A) . Display/hide its location on the map
Park in Granite City: (1) . Display/hide its location on the map
Hotels: (1) , First Western Inn (3236 West Chain Of Rocks Road) (2) , Best Western Camelot Inn (1240 East Chain Of Rocks Road) (3) , Holiday Inn Exp Stes Pontoon (14 Regency Park Drive) (4) , Budget Motel (3220 West Chain Of Rocks Road) (5) , Apple-Valley Motel (709 East Chain Of Rocks Road) (6) , Canal Motel (3317 West Chain Of Rocks Road) (7) . Display/hide their approximate locations on the map
Court: (1) . Display/hide its approximate location on the map
Birthplace of: Robert Olen Butler - Novelist, Andrew Goodpaster - Army general, Andy Phillip - Basketball player-coach, Whip Wilson - Actor, Dal Maxvill - Baseball player and coach, Charlie Jackson (baseball) - Baseball player, Gerry Kissell - Comic artist, Harry Boyles - Major League Baseball pitcher, John van Buskirk - Soccer player-coach, Mike Brotherton - Science fiction writer.
Madison County has a predicted average indoor radon screening level between 2 and 4 pCi/L (pico curies per liter) - Moderate Potential Average household size: This city:
2.4 peopleIllinois:
2.6 people
Percentage of family households: This city:
63.8%Whole state:
65.8%
Percentage of households with unmarried partners: This city:
8.2%Whole state:
6.3%
Likely homosexual households (counted as self-reported same-sex unmarried-partner households)
Lesbian couples: 0.3% of all households Gay men: 0.3% of all households
People in group quarters in Granite City in 2010:
158 people in nursing facilities/skilled-nursing facilities
42 people in other noninstitutional facilities
26 people in group homes intended for adults
18 people in emergency and transitional shelters (with sleeping facilities) for people experiencing homelessness
12 people in residential treatment centers for adults
People in group quarters in Granite City in 2000:
209 people in nursing homes
55 people in other noninstitutional group quarters
21 people in homes or halfway houses for drug/alcohol abuse
9 people in religious group quarters
Banks with branches in Granite City (2011 data):
The Bank of Edwardsville: Granite City - Nameoki Road Center at 3830 Nameoki Road, branch established on 1995/08/01; Granite City - Maryville Road Center at 3502 Maryville Road, branch established on 2000/06/01. Info updated 2006/11/03: Bank assets: $1,559.6 mil, Deposits: $1,289.3 mil, headquarters in Edwardsville, IL, positive income , 20 total offices , Holding Company: Banc Ed Corp., The
Regions Bank: Bellemore Facility at 3206 Nameoki Road, branch established on 1980/07/28; Colonial Facility at 2400 Pontoon Road, branch established on 1976/06/28. Info updated 2011/02/24: Bank assets: $123,368.2 mil, Deposits: $98,301.3 mil, headquarters in Birmingham, AL, positive income , Commercial Lending Specialization, 1778 total offices , Holding Company: Regions Financial Corporation
Guardian Savings Bank: at 3800 Nameoki Road, branch established on 1919/01/01. Info updated 2011/07/21: Bank assets: $38.9 mil, Deposits: $31.2 mil, local headquarters , positive income , Mortgage Lending Specialization, 1 total offices
First Bank: Granite City Branch at 3600 Nameoki Road, branch established on 1923/01/01. Info updated 2007/12/04: Bank assets: $6,579.8 mil, Deposits: $5,800.6 mil, headquarters in Creve Coeur, MO, negative income in the last year , Commercial Lending Specialization, 148 total offices , Holding Company: First Banks, Inc.
U.S. Bank National Association: Granite City Branch at 3303 Nameoki Road, branch established on 1959/03/19. Info updated 2012/01/30: Bank assets: $330,470.8 mil, Deposits: $236,091.5 mil, headquarters in Cincinnati, OH, positive income , 3121 total offices , Holding Company: U.S. Bancorp
For population 15 years and over in Granite City:
Never married: 37.8%Now married: 38.9%Separated: 2.1%Widowed: 6.6%Divorced: 14.5% For population 25 years and over in Granite City:
High school or higher: 89.2%Bachelor's degree or higher: 14.6%Graduate or professional degree: 4.3%Unemployed: 7.6%Mean travel time to work (commute): 19.9 minutes
Education Gini index (Inequality in education) Here:
10.1Illinois average:
12.5
Religion statistics for Granite City, IL (based on Madison County data)
Religion Adherents Congregations Evangelical Protestant 59,455 212 Catholic 37,243 21 Mainline Protestant 24,545 79 Other 5,330 20 Black Protestant 3,942 21 Orthodox 590 4 None 138,177 -
Source: Clifford Grammich, Kirk Hadaway, Richard Houseal, Dale E.Jones, Alexei Krindatch, Richie Stanley and Richard H.Taylor. 2012. 2010 U.S.Religion Census: Religious Congregations & Membership Study. Association of Statisticians of American Religious Bodies. Jones, Dale E., et al. 2002. Congregations and Membership in the United States 2000. Nashville, TN: Glenmary Research Center. Graphs represent county-level data
Food Environment Statistics: Number of grocery stores : 48Madison County :
1.80 / 10,000 pop.Illinois :
2.24 / 10,000 pop.
Number of supercenters and club stores : 1This county :
0.04 / 10,000 pop.Illinois :
0.08 / 10,000 pop.
Number of convenience stores (no gas) : 18Madison County :
0.67 / 10,000 pop.Illinois :
0.75 / 10,000 pop.
Number of convenience stores (with gas) : 100Here :
3.74 / 10,000 pop.Illinois :
2.61 / 10,000 pop.
Number of full-service restaurants : 190Here :
7.11 / 10,000 pop.Illinois :
6.86 / 10,000 pop.
Adult diabetes rate : Madison County :
9.2%State :
8.3%
Adult obesity rate : Madison County :
27.8%Illinois :
25.2%
Low-income preschool obesity rate : Madison County :
9.6%State :
14.5%
Health and Nutrition: Healthy diet rate : This city:
49.7%Illinois:
49.5%
Average overall health of teeth and gums : This city:
46.1%State:
47.2%
Average BMI : Granite City:
29.0Illinois:
28.6
People feeling badly about themselves : Granite City:
20.9%State:
20.5%
People not drinking alcohol at all : Granite City:
11.6%State:
10.8%
Average hours sleeping at night : Granite City:
6.8Illinois:
6.8
Overweight people : Granite City:
35.3%Illinois:
33.4%
General health condition : This city:
55.9%Illinois:
56.4%
Average condition of hearing : More about Health and Nutrition of Granite City, IL Residents
Local government employment and payroll (March 2022)
Function
Full-time employees
Monthly full-time payroll
Average yearly full-time wage
Part-time employees
Monthly part-time payroll
Police Protection - Officers
54 $384,576 $85,461 0 $0 Firefighters
51 $351,163 $82,627 0 $0 Streets and Highways
31 $171,757 $66,487 0 $0 Sewerage
30 $183,751 $73,500 0 $0 Other and Unallocable
15 $54,264 $43,411 0 $0 Police - Other
13 $65,963 $60,889 0 $0 Financial Administration
9 $42,737 $56,983 1 $2,900 Other Government Administration
8 $38,907 $58,361 13 $5,867 Fire - Other
3 $21,127 $84,508 0 $0 Solid Waste Management
2 $11,081 $66,486 0 $0 Judicial and Legal
1 $7,578 $90,936 3 $7,103 Housing and Community Development (Local)
1 $4,729 $56,748 0 $0 Parks and Recreation
1 $2,718 $32,616 9 $4,811
Totals for Government
219 $1,340,352 $73,444 26 $20,681
Granite City government finances - Expenditure in 2021 (per resident):
Construction - Regular Highways: $2,684,000 ($98.96)
Solid Waste Management: $277,000 ($10.21)Police Protection: $175,000 ($6.45)Current Operations - Police Protection: $14,493,000 ($534.38)
Local Fire Protection: $13,180,000 ($485.97)General - Other: $12,751,000 ($470.15)Regular Highways: $8,500,000 ($313.41)Financial Administration: $4,366,000 ($160.98)Parks and Recreation: $225,000 ($8.30)General - Interest on Debt: $9,793,000 ($361.09)
Other Capital Outlay - Regular Highways: $493,000 ($18.18)
Local Fire Protection: $492,000 ($18.14)Police Protection: $312,000 ($11.50)Solid Waste Management: $126,000 ($4.65)Central Staff Services: $8,000 ($0.29)Total Salaries and Wages: $17,740,000 ($654.11)
Granite City government finances - Revenue in 2021 (per resident):
Charges - Sewerage: $8,320,000 ($306.77)
Other: $1,997,000 ($73.63)Federal Intergovernmental - General Local Government Support: $1,231,000 ($45.39)
Public Welfare: $69,000 ($2.54)Local Intergovernmental - Other: $1,003,000 ($36.98)
Miscellaneous - General Revenue - Other: $4,900,000 ($180.67)
Interest Earnings: $400,000 ($14.75)Fines and Forfeits: $308,000 ($11.36)State Intergovernmental - General Local Government Support: $13,837,000 ($510.20)
Highways: $2,601,000 ($95.90)Public Welfare: $46,000 ($1.70)Tax - Property: $20,986,000 ($773.79)
General Sales and Gross Receipts: $3,192,000 ($117.69)Public Utilities Sales: $975,000 ($35.95)Other License: $626,000 ($23.08)Other Selective Sales: $41,000 ($1.51)
Granite City government finances - Debt in 2021 (per resident):
Long Term Debt - Beginning Outstanding - Unspecified Public Purpose: $244,814,000 ($9026.73)
Outstanding Unspecified Public Purpose: $188,564,000 ($6952.69)Retired Unspecified Public Purpose: $56,250,000 ($2074.04)
Granite City government finances - Cash and Securities in 2021 (per resident):
Other Funds - Cash and Securities: $33,557,000 ($1237.31)
Businesses in Granite City, IL
Name Count Name Count
7-Eleven 1 Lane Furniture 1 AMF Bowling 1 Little Caesars Pizza 1 AT&T 1 Long John Silver's 1 Advance Auto Parts 1 Lowe's 1 Applebee's 1 MasterBrand Cabinets 4 Arby's 1 McDonald's 2 AutoZone 1 Nike 2 Blockbuster 1 Papa John's Pizza 1 Burger King 1 Payless 1 Chevrolet 1 Pizza Hut 1 Church's Chicken 1 Quiznos 1 Cricket Wireless 2 RadioShack 1 Dairy Queen 1 Subway 2 Domino's Pizza 2 T-Mobile 2 Econo Lodge 1 Taco Bell 2 Fashion Bug 1 True Value 1 FedEx 4 U-Haul 2 Ford 1 U.S. Cellular 1 GameStop 1 UPS 8 H&R Block 2 Vans 1 Hardee's 1 Waffle House 1 KFC 1 Walmart 1 Kmart 1 YMCA 1
Strongest AM radio stations in Granite City:
KMOX (1120 AM; 50 kW; ST. LOUIS, MO; Owner: INFINITY BROADCASTING OPERATIONS, INC.)
KXEN (1010 AM; 50 kW; FESTUS-ST. LOUIS, MO; Owner: BDJ RADIO ENTERPRISES, LLC)
KJSL (630 AM; 5 kW; ST. LOUIS, MO; Owner: WMUZ RADIO, INC.)
KRFT (1190 AM; 10 kW; DE SOTO, MO; Owner: ALL SPORTS RADIO, LLC)
KTRS (550 AM; 5 kW; ST. LOUIS, MO; Owner: KTRS-AM LICENSE, L.L.C.)
KATZ (1600 AM; 5 kW; ST. LOUIS, MO; Owner: CITICASTERS LICENSES, L.P.)
KFUO (850 AM; 5 kW; CLAYTON, MO; Owner: LUTHERAN CHURCH-MISSOURI SYNOD)
WSDZ (1260 AM; 20 kW; BELLEVILLE, IL)
KSTL (690 AM; 1 kW; ST. LOUIS, MO; Owner: WMUZ RADIO, INC.)
WEW (770 AM; daytime; 1 kW; ST. LOUIS, MO; Owner: METROPOLITAN RADIO GROUP, INC.)
WRTH (1430 AM; 5 kW; ST. LOUIS, MO)
WGNU (920 AM; 0 kW; GRANITE CITY, IL; Owner: NORMAN BROADCASTING CO.)
KSLG (1380 AM; 5 kW; ST. LOUIS, MO; Owner: NEW HORIZON 7TH-DAY CHRISTIAN CHURCH, INC.)
Strongest FM radio stations in Granite City:
WVRV (101.1 FM; EAST ST. LOUIS, IL; Owner: BONNEVILLE HOLDING COMPANY)
W211AD (90.1 FM; GRANITE CITY, IL; Owner: FIRST ASSEMBLY OF GOD, INC.)
KSIV-FM (91.5 FM; ST. LOUIS, MO; Owner: COMMUNITY BROADCASTING, INC.)
WSIE (88.7 FM; EDWARDSVILLE, IL; Owner: BOARD OF TRUSTEES, S. ILLINOIS UNIV.)
KFTK-FM1 (97.1 FM; ST. LOUIS, MO; Owner: EMMIS RADIO LICENSE CORPORATION)
KEZK-FM (102.5 FM; ST. LOUIS, MO; Owner: INFINITY RADIO SUBSIDIARY OPERATIONS INC.)
KIHT (96.3 FM; ST. LOUIS, MO; Owner: EMMIS RADIO LICENSE CORPORATION)
KSHE (94.7 FM; CRESTWOOD, MO; Owner: EMMIS RADIO LICENSE CORPORATION)
KSLZ (107.7 FM; ST. LOUIS, MO; Owner: CITICASTERS LICENSES, L.P.)
KFUO-FM (99.1 FM; CLAYTON, MO; Owner: THE LUTHERAN CHURCH-MISSOURI SYNOD)
KYKY (98.1 FM; ST. LOUIS, MO; Owner: INFINITY RADIO SUBSIDIARY OPERATIONS INC.)
WSSM (106.5 FM; GRANITE CITY, IL; Owner: BONNEVILLE HOLDING COMPANY)
KWMU (90.7 FM; ST. LOUIS, MO; Owner: THE CURATORS OF THE UNIVERSITY OF MISSOURI)
KSD (93.7 FM; ST. LOUIS, MO; Owner: CITICASTERS LICENSES, L.P.)
KLOU (103.3 FM; ST. LOUIS, MO; Owner: CITICASTERS LICENSES, L.P.)
KMJM-FM (104.9 FM; COLUMBIA, IL; Owner: CITICASTERS LICENSES, L.P.)
WMLL (104.1 FM; JERSEYVILLE, IL; Owner: EMMIS RADIO LICENSE CORPORATION)
WIL-FM (92.3 FM; ST. LOUIS, MO; Owner: BONNEVILLE HOLDING COMPANY)
WFUN-FM (95.5 FM; BETHALTO, IL; Owner: RADIO ONE LICENSES, LLC)
WCBW-FM (89.7 FM; EAST ST. LOUIS, IL; Owner: NEW LIFE EVANGELISTIC CENTER, INC.)
TV broadcast stations around Granite City:
K40FF (Channel 40; ST. LOUIS, MO; Owner: EBC ST. LOUIS, INC.)
K64DT (Channel 64; ST. LOUIS, MO; Owner: WORD OF GOD FELLOWSHIP, INC.)
KSDK (Channel 5; ST. LOUIS, MO; Owner: MULTIMEDIA KSDK, INC.)
KPLR-TV (Channel 11; ST. LOUIS, MO; Owner: KPLR, INC.)
K49FC (Channel 49; ST. LOUIS, MO; Owner: THREE ANGELS BROADCASTING NETWORK)
KDNL-TV (Channel 30; ST. LOUIS, MO; Owner: KDNL LICENSEE, LLC)
KMOV (Channel 4; ST. LOUIS, MO; Owner: KMOV-TV, INC.)
KTVI (Channel 2; ST. LOUIS, MO; Owner: KTVI LICENSE, INC.)
KPTN-LP (Channel 58; ST. LOUIS, MO; Owner: KURT J. PETERSEN)
KETC (Channel 9; ST. LOUIS, MO; Owner: ST. LOUIS REGIONAL & EDUCATIONAL PUBLIC TV COMMISSION)
K38HD (Channel 38; ST. LOUIS, MO; Owner: VENTANA TELEVISION, INC.)
K18BT (Channel 18; ST. LOUIS, MO; Owner: TRINITY BROADCASTING NETWORK)
K65FN (Channel 65; BATESVILLE, AR; Owner: MS COMMUNICATIONS, LLC)
WRBU (Channel 46; EAST ST. LOUIS, IL; Owner: ROBERTS BROADCASTING COMPANY)
KNLC (Channel 24; ST. LOUIS, MO; Owner: NEW LIFE EVANGELISTIC CENTER, INC.)
WPXS (Channel 13; MT. VERNON, IL; Owner: EBC ST. LOUIS, INC.)
K63FW (Channel 63; JAMESTOWN, MO; Owner: ROGER E. HARDERS)
K62EG (Channel 62; ST. LOUIS, MO; Owner: ETERNAL FAMILY NETWORK)
K59GP (Channel 59; ST. CHARLES, MO; Owner: TRINITY BROADCASTING NETWORK)
W50CH (Channel 50; ALTON, IL; Owner: LIBERTY CHRISTIAN CENTER)
Home Mortgage Disclosure Act Aggregated Statistics For Year 2009(Based on 7 full and 6 partial tracts) A) FHA, FSA/RHS & VA B) Conventional C) Refinancings D) Home Improvement Loans E) Loans on Dwellings For 5+ Families F) Non-occupant Loans on G) Loans On Manufactured Number Average Value Number Average Value Number Average Value Number Average Value Number Average Value Number Average Value Number Average Value
LOANS ORIGINATED 164 $78,074 115 $77,165 531 $89,727 72 $29,320 5 $530,808 75 $63,327 1 $38,050 APPLICATIONS APPROVED, NOT ACCEPTED 9 $75,624 6 $86,102 34 $99,429 7 $27,437 0 $0 2 $23,500 0 $0 APPLICATIONS DENIED 13 $100,805 22 $67,128 155 $87,293 70 $18,823 0 $0 14 $62,784 4 $38,520 APPLICATIONS WITHDRAWN 11 $79,870 13 $95,476 96 $86,050 9 $43,510 0 $0 7 $74,429 0 $0 FILES CLOSED FOR INCOMPLETENESS 0 $0 4 $68,622 23 $86,437 3 $47,803 0 $0 1 $86,000 0 $0
Aggregated Statistics For Year 2008(Based on 7 full and 6 partial tracts) A) FHA, FSA/RHS & VA B) Conventional C) Refinancings D) Home Improvement Loans E) Loans on Dwellings For 5+ Families F) Non-occupant Loans on G) Loans On Manufactured Number Average Value Number Average Value Number Average Value Number Average Value Number Average Value Number Average Value Number Average Value
LOANS ORIGINATED 175 $83,883 163 $71,878 410 $81,990 118 $36,622 7 $164,317 124 $58,514 2 $41,995 APPLICATIONS APPROVED, NOT ACCEPTED 10 $84,995 25 $68,042 57 $78,459 10 $33,351 1 $47,000 7 $72,173 1 $43,870 APPLICATIONS DENIED 34 $89,224 56 $53,054 249 $87,088 123 $34,005 3 $59,570 26 $48,045 12 $33,652 APPLICATIONS WITHDRAWN 18 $83,847 27 $97,697 120 $87,327 24 $65,426 1 $220,000 16 $66,294 0 $0 FILES CLOSED FOR INCOMPLETENESS 2 $53,075 3 $60,600 27 $88,387 8 $59,438 0 $0 4 $62,568 0 $0
Aggregated Statistics For Year 2007(Based on 7 full and 6 partial tracts) A) FHA, FSA/RHS & VA B) Conventional C) Refinancings D) Home Improvement Loans E) Loans on Dwellings For 5+ Families F) Non-occupant Loans on G) Loans On Manufactured Number Average Value Number Average Value Number Average Value Number Average Value Number Average Value Number Average Value Number Average Value
LOANS ORIGINATED 115 $80,580 381 $74,104 517 $77,023 168 $35,476 7 $446,699 162 $52,259 3 $34,813 APPLICATIONS APPROVED, NOT ACCEPTED 2 $72,320 41 $76,052 80 $80,369 24 $40,440 0 $0 14 $60,666 3 $61,370 APPLICATIONS DENIED 18 $76,162 105 $65,304 458 $75,329 160 $36,464 0 $0 35 $51,792 4 $57,970 APPLICATIONS WITHDRAWN 8 $91,691 47 $76,434 175 $83,778 22 $48,855 0 $0 12 $58,923 0 $0 FILES CLOSED FOR INCOMPLETENESS 0 $0 13 $76,786 57 $84,379 5 $67,836 0 $0 5 $54,722 0 $0
Aggregated Statistics For Year 2006(Based on 7 full and 6 partial tracts) A) FHA, FSA/RHS & VA B) Conventional C) Refinancings D) Home Improvement Loans E) Loans on Dwellings For 5+ Families F) Non-occupant Loans on G) Loans On Manufactured Number Average Value Number Average Value Number Average Value Number Average Value Number Average Value Number Average Value Number Average Value
LOANS ORIGINATED 128 $77,644 501 $65,212 520 $74,922 158 $26,391 4 $345,870 196 $46,650 4 $25,142 APPLICATIONS APPROVED, NOT ACCEPTED 5 $96,822 58 $74,076 141 $72,532 21 $25,942 1 $7,060 21 $51,861 4 $96,220 APPLICATIONS DENIED 11 $70,615 123 $66,724 388 $82,094 138 $39,544 1 $65,000 31 $52,631 7 $53,360 APPLICATIONS WITHDRAWN 9 $73,111 71 $72,635 252 $83,853 24 $80,021 1 $1,850,000 13 $73,395 0 $0 FILES CLOSED FOR INCOMPLETENESS 3 $80,967 10 $69,220 88 $85,170 5 $32,288 0 $0 2 $64,760 0 $0
Aggregated Statistics For Year 2005(Based on 7 full and 6 partial tracts) A) FHA, FSA/RHS & VA B) Conventional C) Refinancings D) Home Improvement Loans E) Loans on Dwellings For 5+ Families F) Non-occupant Loans on G) Loans On Manufactured Number Average Value Number Average Value Number Average Value Number Average Value Number Average Value Number Average Value Number Average Value
LOANS ORIGINATED 151 $75,549 424 $64,724 563 $72,678 170 $36,821 6 $764,833 141 $53,616 3 $36,973 APPLICATIONS APPROVED, NOT ACCEPTED 7 $70,724 57 $60,251 110 $76,188 20 $29,351 0 $0 13 $54,228 3 $35,340 APPLICATIONS DENIED 16 $76,601 144 $62,542 452 $74,953 110 $27,265 0 $0 35 $50,695 22 $50,770 APPLICATIONS WITHDRAWN 17 $63,189 57 $81,170 298 $87,511 40 $118,817 0 $0 26 $84,969 1 $35,050 FILES CLOSED FOR INCOMPLETENESS 4 $63,648 15 $68,458 66 $81,946 3 $27,633 0 $0 0 $0 0 $0
Aggregated Statistics For Year 2004(Based on 7 full and 6 partial tracts) A) FHA, FSA/RHS & VA B) Conventional C) Refinancings D) Home Improvement Loans E) Loans on Dwellings For 5+ Families F) Non-occupant Loans on G) Loans On Manufactured Number Average Value Number Average Value Number Average Value Number Average Value Number Average Value Number Average Value Number Average Value
LOANS ORIGINATED 155 $72,876 386 $65,905 662 $68,477 128 $32,464 4 $301,920 148 $49,444 3 $33,317 APPLICATIONS APPROVED, NOT ACCEPTED 7 $63,987 59 $62,893 115 $69,313 13 $27,232 0 $0 6 $74,578 6 $34,597 APPLICATIONS DENIED 18 $71,864 97 $58,472 444 $71,661 105 $20,915 1 $100,000 43 $50,017 15 $41,429 APPLICATIONS WITHDRAWN 7 $91,146 44 $64,795 304 $74,298 12 $37,352 0 $0 7 $65,197 2 $63,285 FILES CLOSED FOR INCOMPLETENESS 2 $60,925 7 $50,444 40 $78,189 3 $24,223 0 $0 2 $47,440 0 $0
Aggregated Statistics For Year 2003(Based on 7 full and 6 partial tracts) A) FHA, FSA/RHS & VA B) Conventional C) Refinancings D) Home Improvement Loans E) Loans on Dwellings For 5+ Families F) Non-occupant Loans on Number Average Value Number Average Value Number Average Value Number Average Value Number Average Value Number Average Value
LOANS ORIGINATED 167 $70,738 290 $64,928 1,278 $64,886 146 $25,745 1 $979,930 127 $50,836 APPLICATIONS APPROVED, NOT ACCEPTED 13 $66,003 44 $60,091 189 $69,780 20 $32,498 0 $0 9 $49,376 APPLICATIONS DENIED 15 $57,288 88 $61,371 479 $79,731 84 $19,214 0 $0 33 $43,664 APPLICATIONS WITHDRAWN 4 $64,545 40 $75,196 251 $74,752 18 $35,025 1 $73,000 8 $45,899 FILES CLOSED FOR INCOMPLETENESS 2 $56,000 9 $57,980 66 $76,737 6 $32,960 0 $0 4 $46,620
Aggregated Statistics For Year 2002(Based on 7 full and 4 partial tracts) A) FHA, FSA/RHS & VA B) Conventional C) Refinancings D) Home Improvement Loans E) Loans on Dwellings For 5+ Families F) Non-occupant Loans on Number Average Value Number Average Value Number Average Value Number Average Value Number Average Value Number Average Value
LOANS ORIGINATED 167 $61,696 206 $51,427 710 $62,039 82 $18,935 3 $280,353 96 $45,797 APPLICATIONS APPROVED, NOT ACCEPTED 9 $63,239 27 $62,169 115 $59,263 17 $22,615 0 $0 5 $47,636 APPLICATIONS DENIED 10 $60,047 71 $48,871 365 $55,349 75 $12,051 0 $0 15 $44,135 APPLICATIONS WITHDRAWN 8 $68,415 22 $46,163 137 $58,244 7 $30,434 0 $0 5 $37,962 FILES CLOSED FOR INCOMPLETENESS 1 $76,790 11 $33,664 48 $65,682 2 $28,735 0 $0 1 $30,000
Aggregated Statistics For Year 2001(Based on 7 full and 4 partial tracts) A) FHA, FSA/RHS & VA B) Conventional C) Refinancings D) Home Improvement Loans E) Loans on Dwellings For 5+ Families F) Non-occupant Loans on Number Average Value Number Average Value Number Average Value Number Average Value Number Average Value Number Average Value
LOANS ORIGINATED 156 $57,922 228 $57,133 727 $58,115 76 $20,247 0 $0 85 $41,633 APPLICATIONS APPROVED, NOT ACCEPTED 4 $60,785 31 $49,799 122 $57,346 13 $16,685 0 $0 3 $91,350 APPLICATIONS DENIED 10 $53,766 83 $43,195 387 $52,075 85 $11,237 1 $85,000 13 $32,652 APPLICATIONS WITHDRAWN 8 $52,065 24 $49,364 170 $57,482 14 $14,323 0 $0 8 $35,469 FILES CLOSED FOR INCOMPLETENESS 1 $75,060 2 $53,180 40 $54,850 1 $22,470 0 $0 0 $0
Aggregated Statistics For Year 2000(Based on 7 full and 4 partial tracts) A) FHA, FSA/RHS & VA B) Conventional C) Refinancings D) Home Improvement Loans E) Loans on Dwellings For 5+ Families F) Non-occupant Loans on Number Average Value Number Average Value Number Average Value Number Average Value Number Average Value Number Average Value
LOANS ORIGINATED 170 $55,342 253 $51,785 340 $47,616 115 $12,559 1 $13,570 62 $41,894 APPLICATIONS APPROVED, NOT ACCEPTED 8 $54,619 28 $32,464 123 $48,133 40 $16,764 0 $0 5 $37,202 APPLICATIONS DENIED 8 $54,471 214 $37,865 256 $44,111 107 $11,663 0 $0 21 $39,163 APPLICATIONS WITHDRAWN 7 $63,236 29 $59,748 120 $46,713 3 $10,920 0 $0 5 $37,598 FILES CLOSED FOR INCOMPLETENESS 3 $37,810 2 $22,680 23 $47,753 2 $23,775 0 $0 1 $19,110
Aggregated Statistics For Year 1999(Based on 7 full and 5 partial tracts) A) FHA, FSA/RHS & VA B) Conventional C) Refinancings D) Home Improvement Loans E) Loans on Dwellings For 5+ Families F) Non-occupant Loans on Number Average Value Number Average Value Number Average Value Number Average Value Number Average Value Number Average Value
LOANS ORIGINATED 201 $57,129 268 $49,932 619 $47,700 170 $14,809 1 $114,650 88 $33,927 APPLICATIONS APPROVED, NOT ACCEPTED 1 $76,670 39 $43,376 166 $50,512 34 $14,928 0 $0 10 $28,130 APPLICATIONS DENIED 19 $49,346 250 $35,920 326 $46,946 106 $13,020 0 $0 17 $39,107 APPLICATIONS WITHDRAWN 7 $56,449 30 $49,302 208 $47,511 27 $32,479 0 $0 7 $35,849 FILES CLOSED FOR INCOMPLETENESS 2 $76,500 9 $43,881 55 $44,428 1 $5,000 0 $0 3 $35,000
Detailed mortgage data for all 12 tracts in Granite City, IL
Private Mortgage Insurance Companies Aggregated Statistics For Year 2009(Based on 5 full and 6 partial tracts) A) Conventional B) Refinancings C) Non-occupant Loans on Number Average Value Number Average Value Number Average Value
LOANS ORIGINATED 18 $105,904 13 $110,815 0 $0 APPLICATIONS APPROVED, NOT ACCEPTED 3 $87,350 4 $103,252 0 $0 APPLICATIONS DENIED 2 $75,875 2 $77,520 0 $0 APPLICATIONS WITHDRAWN 2 $94,315 1 $91,000 0 $0 FILES CLOSED FOR INCOMPLETENESS 2 $65,375 1 $101,210 1 $43,000
Aggregated Statistics For Year 2008(Based on 7 full and 6 partial tracts) A) Conventional B) Refinancings C) Non-occupant Loans on Number Average Value Number Average Value Number Average Value
LOANS ORIGINATED 53 $79,280 40 $89,280 7 $49,637 APPLICATIONS APPROVED, NOT ACCEPTED 17 $88,626 17 $85,739 4 $49,430 APPLICATIONS DENIED 3 $72,637 3 $103,263 1 $39,000 APPLICATIONS WITHDRAWN 3 $71,713 3 $60,667 0 $0 FILES CLOSED FOR INCOMPLETENESS 4 $91,572 0 $0 1 $93,040
Aggregated Statistics For Year 2007(Based on 7 full and 6 partial tracts) A) Conventional B) Refinancings C) Non-occupant Loans on Number Average Value Number Average Value Number Average Value
LOANS ORIGINATED 196 $81,717 79 $91,689 10 $46,499 APPLICATIONS APPROVED, NOT ACCEPTED 15 $77,503 15 $92,039 1 $42,680 APPLICATIONS DENIED 9 $111,239 1 $86,110 1 $47,780 APPLICATIONS WITHDRAWN 7 $84,121 12 $105,318 0 $0 FILES CLOSED FOR INCOMPLETENESS 1 $62,000 0 $0 0 $0
Aggregated Statistics For Year 2006(Based on 6 full and 6 partial tracts) A) Conventional B) Refinancings C) Non-occupant Loans on Number Average Value Number Average Value Number Average Value
LOANS ORIGINATED 134 $76,969 47 $86,696 10 $56,331 APPLICATIONS APPROVED, NOT ACCEPTED 11 $77,252 17 $99,564 0 $0 APPLICATIONS DENIED 1 $59,000 0 $0 1 $59,000 APPLICATIONS WITHDRAWN 11 $62,392 4 $94,488 0 $0 FILES CLOSED FOR INCOMPLETENESS 0 $0 0 $0 0 $0
Aggregated Statistics For Year 2005(Based on 7 full and 6 partial tracts) A) Conventional B) Refinancings C) Non-occupant Loans on Number Average Value Number Average Value Number Average Value
LOANS ORIGINATED 115 $74,173 47 $89,821 19 $46,987 APPLICATIONS APPROVED, NOT ACCEPTED 13 $76,362 17 $83,506 2 $44,500 APPLICATIONS DENIED 2 $71,310 1 $132,420 0 $0 APPLICATIONS WITHDRAWN 3 $66,073 3 $71,020 1 $42,000 FILES CLOSED FOR INCOMPLETENESS 0 $0 0 $0 0 $0
Aggregated Statistics For Year 2004(Based on 7 full and 6 partial tracts) A) Conventional B) Refinancings C) Non-occupant Loans on Number Average Value Number Average Value Number Average Value
LOANS ORIGINATED 118 $67,713 83 $81,358 17 $42,389 APPLICATIONS APPROVED, NOT ACCEPTED 9 $53,638 23 $81,906 0 $0 APPLICATIONS DENIED 0 $0 1 $75,140 0 $0 APPLICATIONS WITHDRAWN 6 $64,393 12 $75,187 1 $49,730 FILES CLOSED FOR INCOMPLETENESS 0 $0 0 $0 0 $0
Aggregated Statistics For Year 2003(Based on 7 full and 6 partial tracts) A) Conventional B) Refinancings C) Non-occupant Loans on Number Average Value Number Average Value Number Average Value
LOANS ORIGINATED 96 $69,067 141 $78,711 9 $39,449 APPLICATIONS APPROVED, NOT ACCEPTED 6 $68,310 32 $77,068 1 $58,250 APPLICATIONS DENIED 4 $53,172 1 $114,950 1 $27,060 APPLICATIONS WITHDRAWN 2 $32,235 8 $78,761 1 $24,000 FILES CLOSED FOR INCOMPLETENESS 0 $0 0 $0 0 $0
Aggregated Statistics For Year 2002(Based on 7 full and 4 partial tracts) A) Conventional B) Refinancings C) Non-occupant Loans on Number Average Value Number Average Value Number Average Value
LOANS ORIGINATED 84 $67,228 105 $74,898 14 $48,361 APPLICATIONS APPROVED, NOT ACCEPTED 4 $68,848 15 $67,386 1 $70,140 APPLICATIONS DENIED 1 $86,000 1 $78,590 0 $0 APPLICATIONS WITHDRAWN 6 $57,307 4 $68,450 0 $0 FILES CLOSED FOR INCOMPLETENESS 0 $0 1 $54,000 0 $0
Aggregated Statistics For Year 2001(Based on 7 full and 4 partial tracts) A) Conventional B) Refinancings C) Non-occupant Loans on Number Average Value Number Average Value Number Average Value
LOANS ORIGINATED 73 $63,876 83 $69,228 8 $34,200 APPLICATIONS APPROVED, NOT ACCEPTED 5 $52,948 15 $58,082 0 $0 APPLICATIONS DENIED 0 $0 4 $70,025 0 $0 APPLICATIONS WITHDRAWN 2 $68,415 2 $66,065 0 $0 FILES CLOSED FOR INCOMPLETENESS 0 $0 2 $42,100 0 $0
Aggregated Statistics For Year 2000(Based on 7 full and 4 partial tracts) A) Conventional B) Refinancings C) Non-occupant Loans on Number Average Value Number Average Value Number Average Value
LOANS ORIGINATED 73 $51,344 13 $59,882 10 $36,167 APPLICATIONS APPROVED, NOT ACCEPTED 7 $54,659 1 $57,140 2 $42,040 APPLICATIONS DENIED 2 $47,500 1 $77,000 0 $0 APPLICATIONS WITHDRAWN 4 $54,750 0 $0 0 $0 FILES CLOSED FOR INCOMPLETENESS 1 $46,000 0 $0 1 $46,000
Aggregated Statistics For Year 1999(Based on 6 full and 5 partial tracts) A) Conventional B) Refinancings C) Non-occupant Loans on Number Average Value Number Average Value Number Average Value
LOANS ORIGINATED 75 $56,690 46 $59,918 11 $34,483 APPLICATIONS APPROVED, NOT ACCEPTED 8 $51,840 7 $57,269 2 $58,000 APPLICATIONS DENIED 2 $67,775 2 $56,200 0 $0 APPLICATIONS WITHDRAWN 3 $54,667 0 $0 0 $0 FILES CLOSED FOR INCOMPLETENESS 0 $0 0 $0 0 $0
Fire-safe hotels and motels in Granite City, Illinois:
Midwest Motel, 912 Thorngate Rd, Granite City, Illinois 62040 Phone: (618) 797-2400
Budget Motel, 3220 W Chain Of Rocks Rd, Granite City, Illinois 62040 Phone: (618) 931-1414
Granite City Lodge, 1200 19TH St, Granite City, Illinois 62040 Phone: (618) 876-2600
Apple Valley Motel, 709 E Chain Of Rocks Rd, Granite City, Illinois 62040 Phone: (618) 931-6085
Days Inn & Suites, 5105 Hwy 111, Granite City, Illinois 62040 Phone: (618) 797-2727, Fax: (618) 797-2995
Econo Lodge Inns And Suites, 3236 W Chain Of Rock Rd, Granite City, Illinois 62040 Phone: (618) 797-9835, Fax: (618) 797-9839
All 6 fire-safe hotels and motels in Granite City, Illinois Granite City compared to Illinois state average:
Median house value significantly below state average. Unemployed percentage below state average. Black race population percentage below state average. Hispanic race population percentage significantly below state average. Foreign-born population percentage significantly below state average. Length of stay since moving in significantly above state average. Percentage of population with a bachelor's degree or higher below state average.
Top Patent Applicants
Philip S. Johnson (16)
Timothy J. Druhe (3)
Thomas L. Talley (3)
Daryl R. Monroe (3)
Khambath Vichitvongsa (2)
Charles Brinza (2)
Richard Alan Mrozowicz (2)
Clifford A. Kinnunen, Jr. (2)
Edward A. Glass (2)
Ralph Walden (2)
Total of 46 patent applications in 2008-2024.


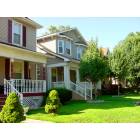

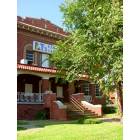
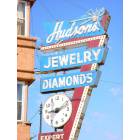

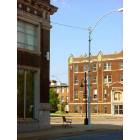
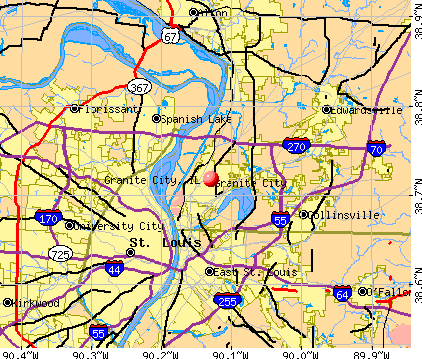


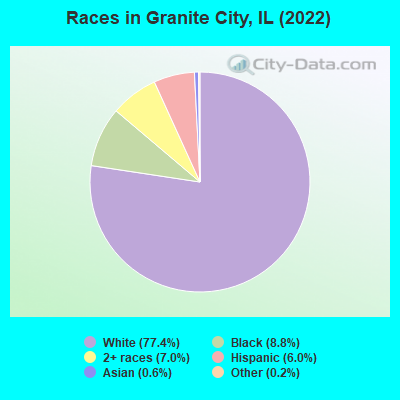
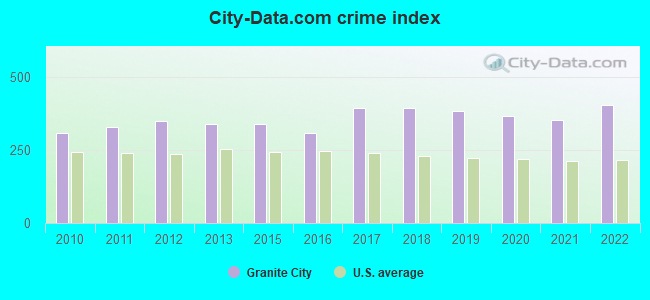
 Recent articles from our blog. Our writers, many of them Ph.D. graduates or candidates, create easy-to-read articles on a wide variety of topics.

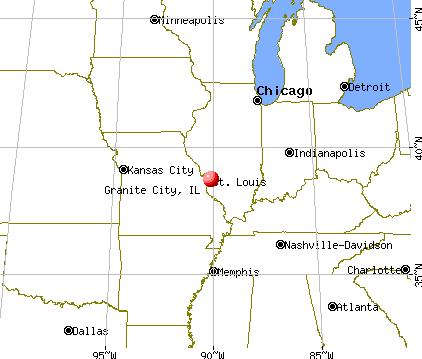
 (8.7 miles
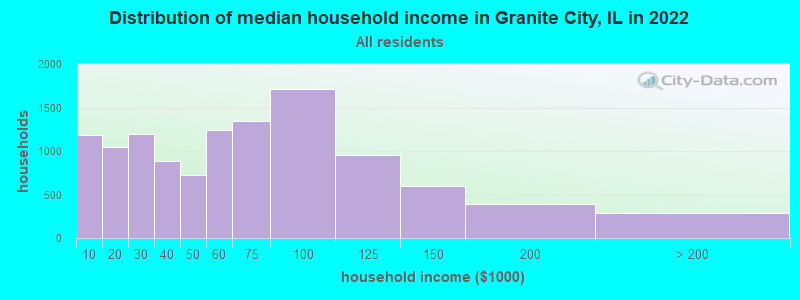
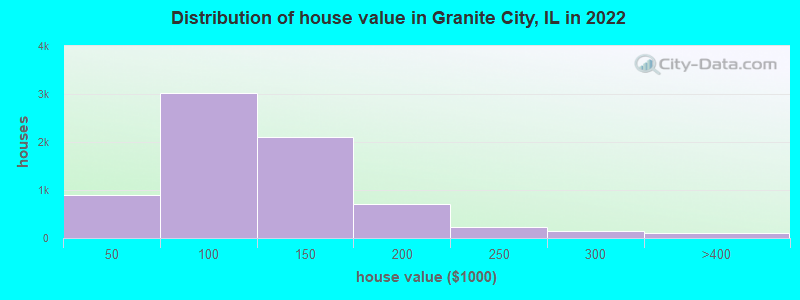

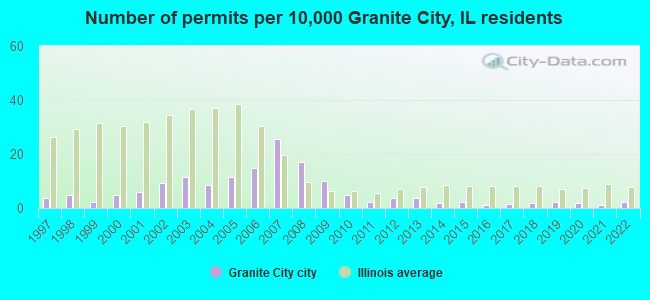
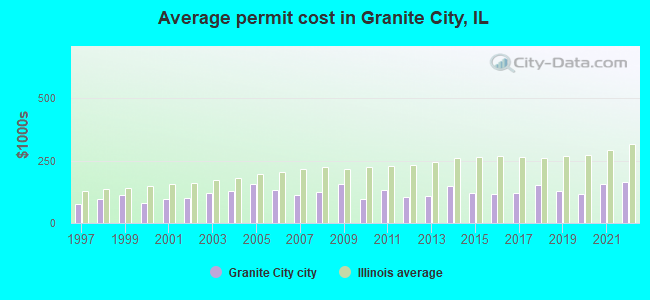
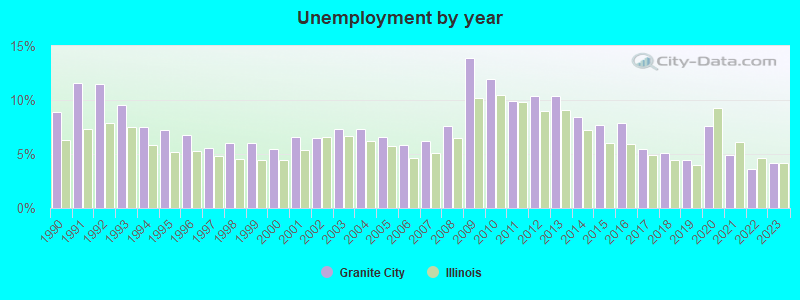
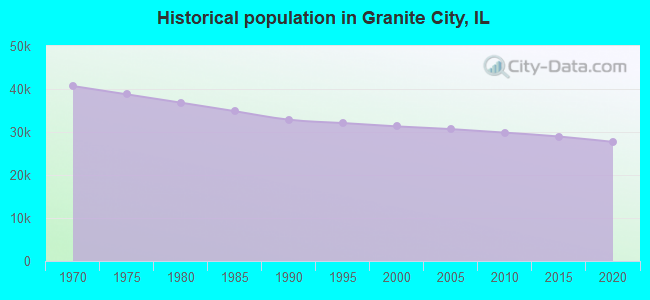
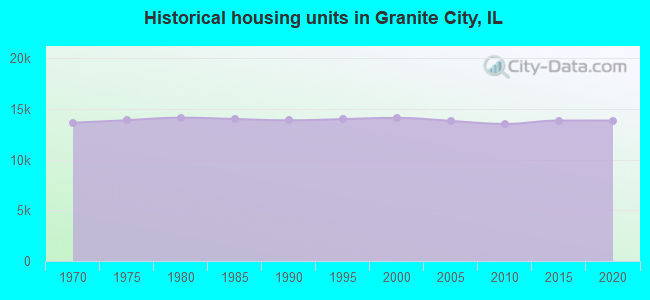
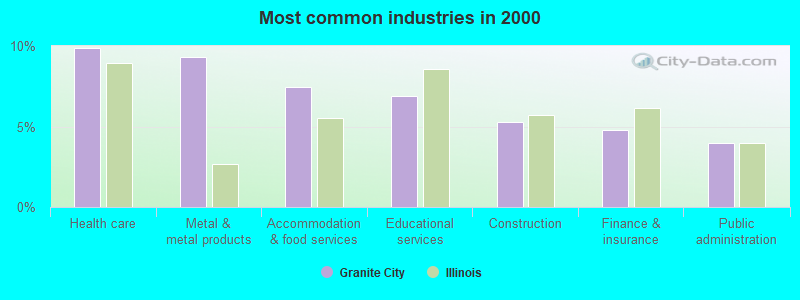
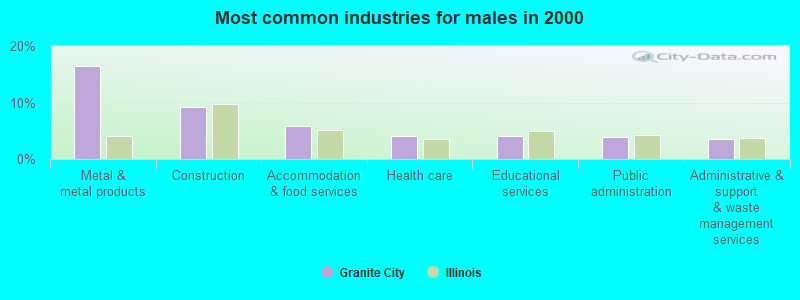
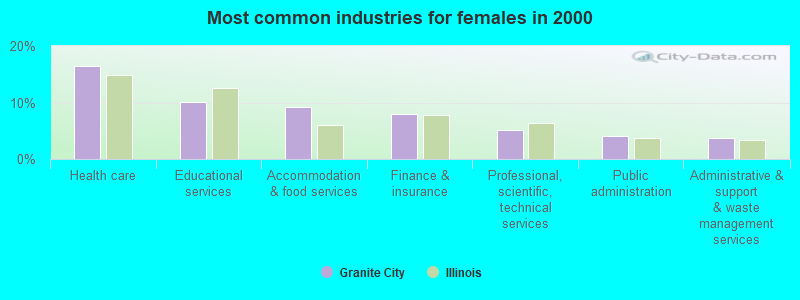
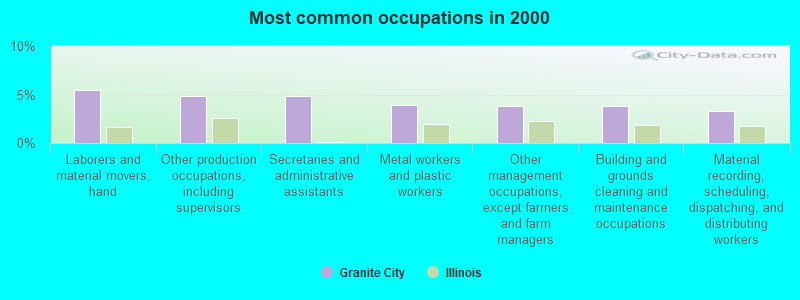
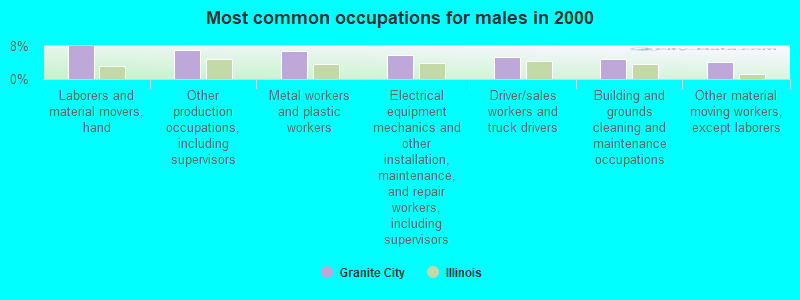
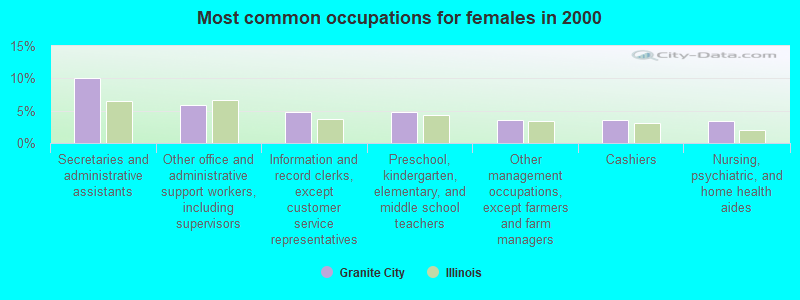


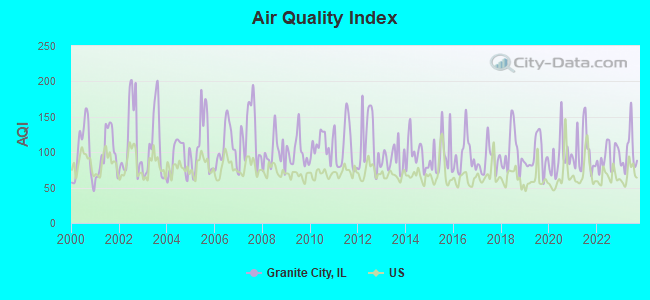
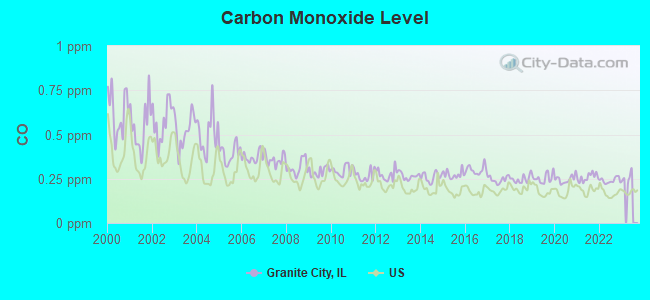
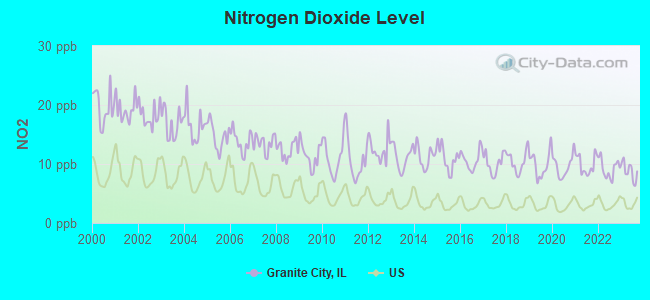
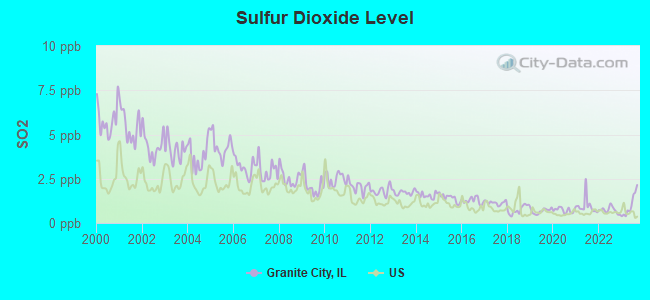
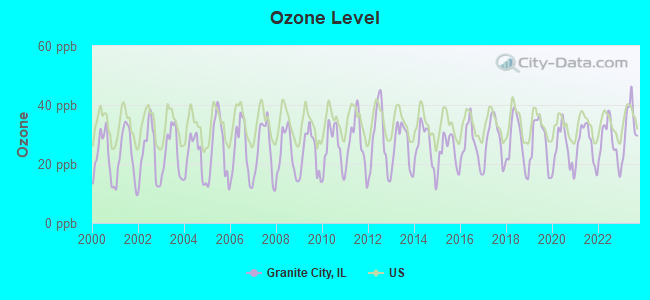
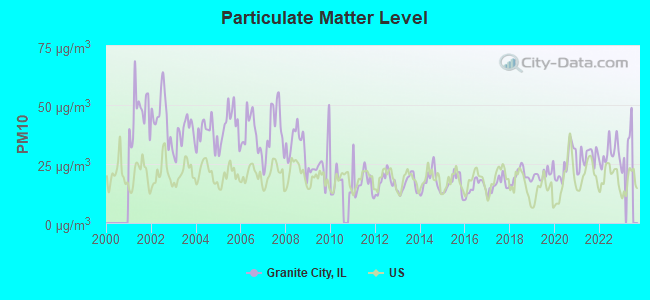
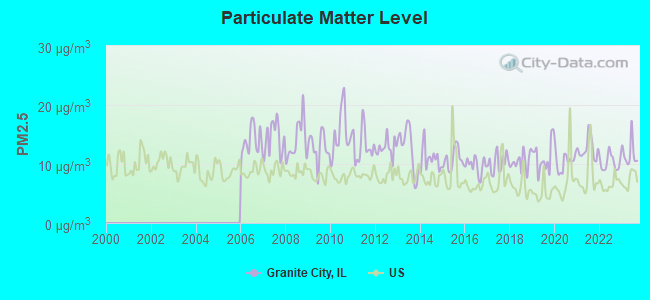
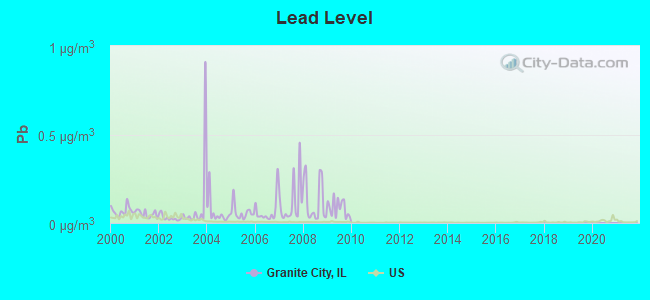
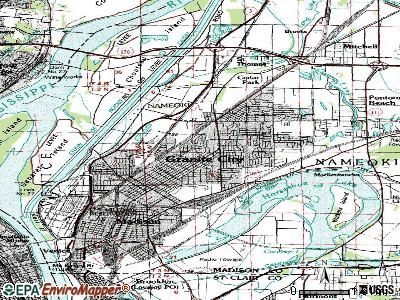
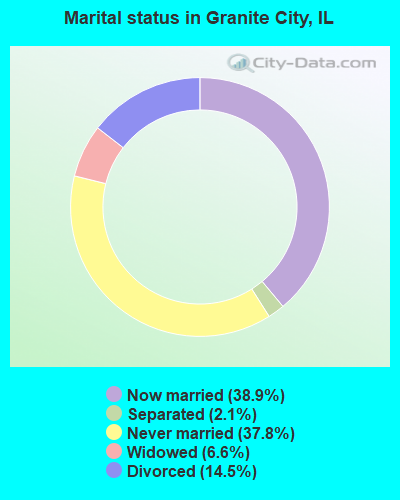
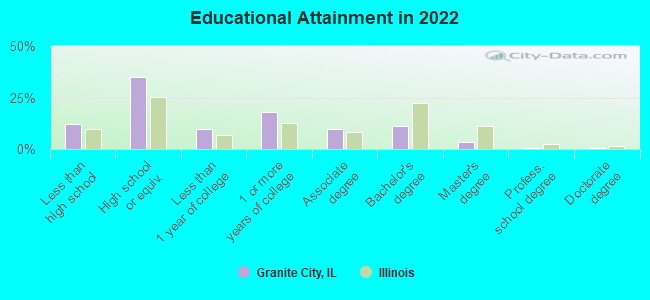
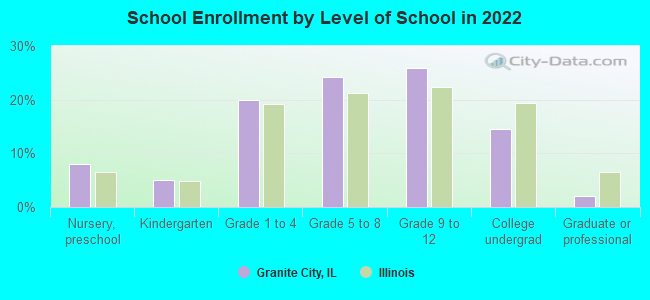
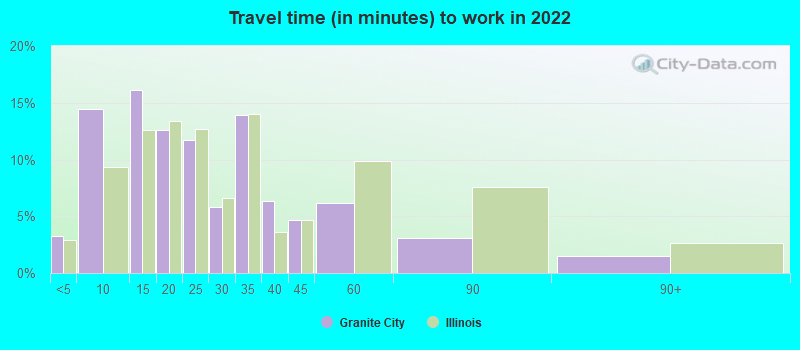
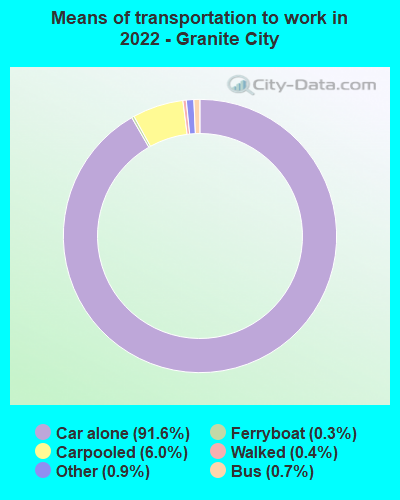
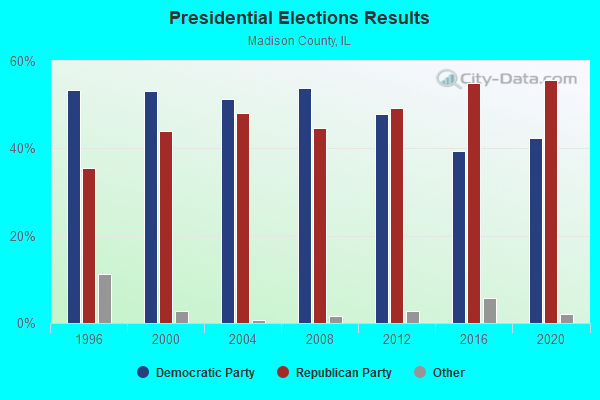
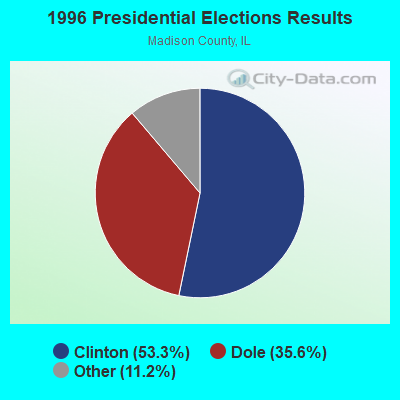
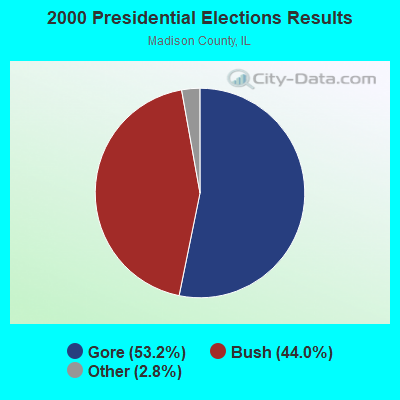
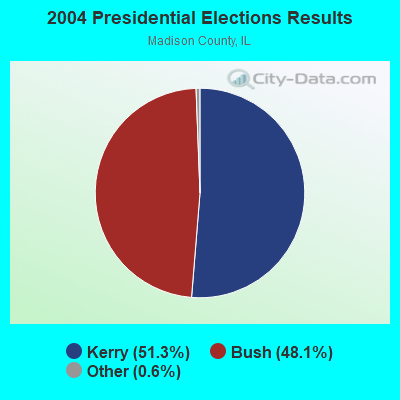
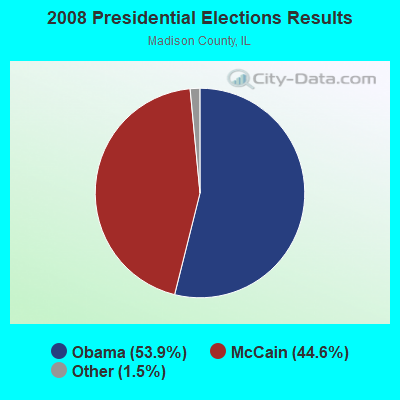
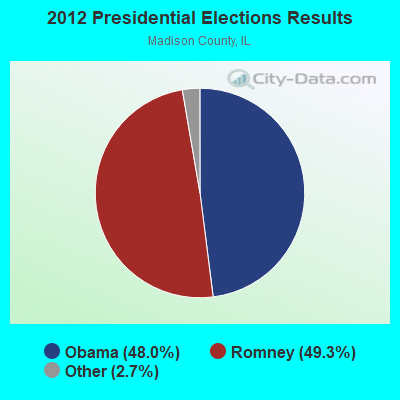
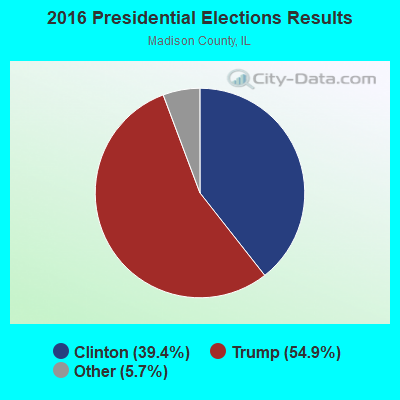
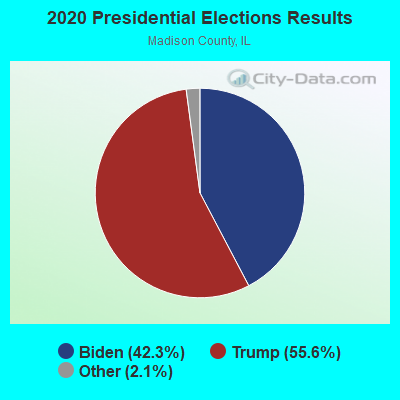
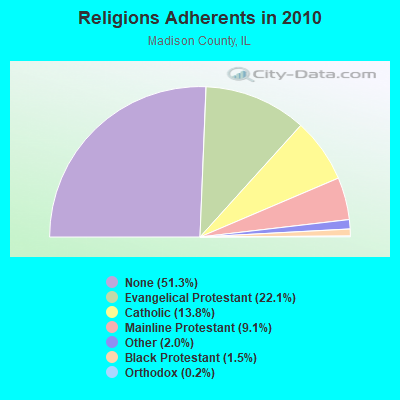
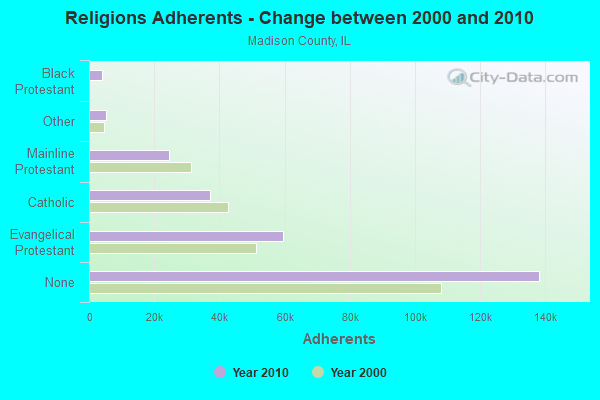
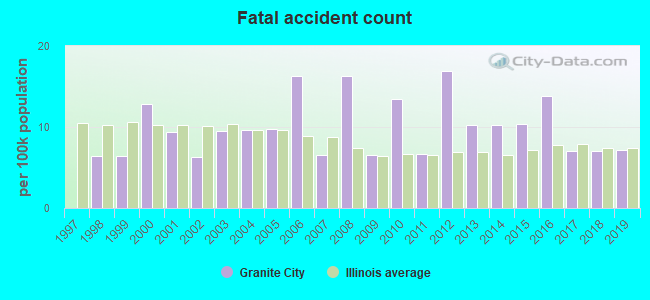
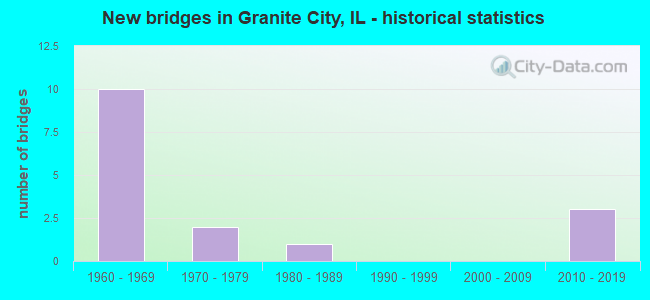
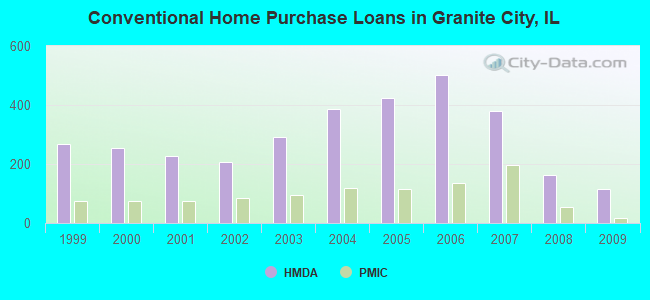
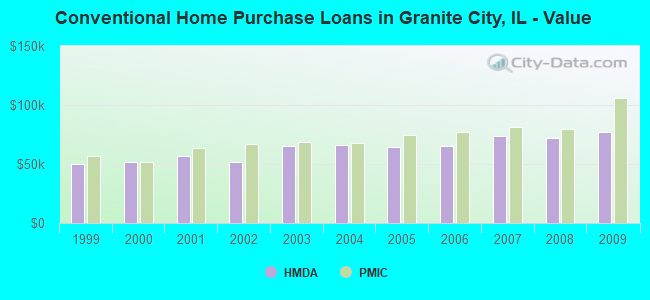
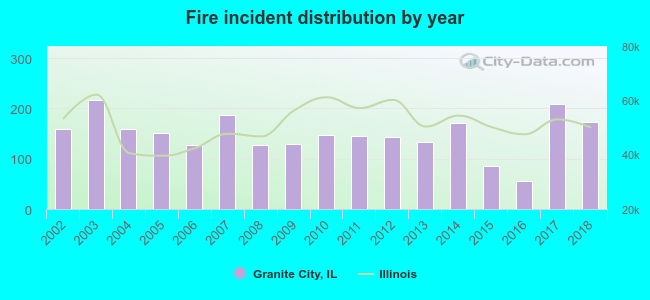 According to the data from the years 2002 - 2018 the average number of fire incidents per year is 148. The highest number of fires - 216 took place in 2003, and the least - 56 in 2016. The data has a rising trend.
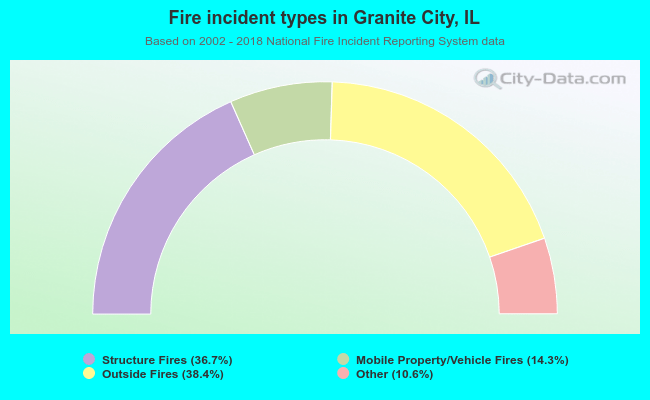 When looking into fire subcategories, the most reports belonged to: Outside Fires (38.4%), and Structure Fires (36.7%).