Fountain Valley, California Submit your own pictures of this city and show them to the world
OSM Map
General Map
Google Map
MSN Map
OSM Map
General Map
Google Map
MSN Map
OSM Map
General Map
Google Map
MSN Map
OSM Map
General Map
Google Map
MSN Map
Please wait while loading the map...
Population in 2022: 55,930 (100% urban, 0% rural). Population change since 2000: +1.7%Males: 28,039 Females: 27,891
March 2022 cost of living index in Fountain Valley: 89.4 (less than average, U.S. average is 100) Percentage of residents living in poverty in 2022: 7.0%for White Non-Hispanic residents , 2.9% for Black residents , 8.8% for Hispanic or Latino residents , 11.9% for American Indian residents , 3.0% for Native Hawaiian and other Pacific Islander residents , 10.3% for other race residents , 4.5% for two or more races residents )
Profiles of local businesses
Business Search - 14 Million verified businesses
Data:
Median household income ($)
Median household income (% change since 2000)
Household income diversity
Ratio of average income to average house value (%)
Ratio of average income to average rent
Median household income ($) - White
Median household income ($) - Black or African American
Median household income ($) - Asian
Median household income ($) - Hispanic or Latino
Median household income ($) - American Indian and Alaska Native
Median household income ($) - Multirace
Median household income ($) - Other Race
Median household income for houses/condos with a mortgage ($)
Median household income for apartments without a mortgage ($)
Races - White alone (%)
Races - White alone (% change since 2000)
Races - Black alone (%)
Races - Black alone (% change since 2000)
Races - American Indian alone (%)
Races - American Indian alone (% change since 2000)
Races - Asian alone (%)
Races - Asian alone (% change since 2000)
Races - Hispanic (%)
Races - Hispanic (% change since 2000)
Races - Native Hawaiian and Other Pacific Islander alone (%)
Races - Native Hawaiian and Other Pacific Islander alone (% change since 2000)
Races - Two or more races (%)
Races - Two or more races (% change since 2000)
Races - Other race alone (%)
Races - Other race alone (% change since 2000)
Racial diversity
Unemployment (%)
Unemployment (% change since 2000)
Unemployment (%) - White
Unemployment (%) - Black or African American
Unemployment (%) - Asian
Unemployment (%) - Hispanic or Latino
Unemployment (%) - American Indian and Alaska Native
Unemployment (%) - Multirace
Unemployment (%) - Other Race
Population density (people per square mile)
Population - Males (%)
Population - Females (%)
Population - Males (%) - White
Population - Males (%) - Black or African American
Population - Males (%) - Asian
Population - Males (%) - Hispanic or Latino
Population - Males (%) - American Indian and Alaska Native
Population - Males (%) - Multirace
Population - Males (%) - Other Race
Population - Females (%) - White
Population - Females (%) - Black or African American
Population - Females (%) - Asian
Population - Females (%) - Hispanic or Latino
Population - Females (%) - American Indian and Alaska Native
Population - Females (%) - Multirace
Population - Females (%) - Other Race
Coronavirus confirmed cases (Apr 17, 2024)
Deaths caused by coronavirus (Apr 17, 2024)
Coronavirus confirmed cases (per 100k population) (Apr 17, 2024)
Deaths caused by coronavirus (per 100k population) (Apr 17, 2024)
Daily increase in number of cases (Apr 17, 2024)
Weekly increase in number of cases (Apr 17, 2024)
Cases doubled (in days) (Apr 17, 2024)
Hospitalized patients (Apr 18, 2022)
Negative test results (Apr 18, 2022)
Total test results (Apr 18, 2022)
COVID Vaccine doses distributed (per 100k population) (Sep 19, 2023)
COVID Vaccine doses administered (per 100k population) (Sep 19, 2023)
COVID Vaccine doses distributed (Sep 19, 2023)
COVID Vaccine doses administered (Sep 19, 2023)
Likely homosexual households (%)
Likely homosexual households (% change since 2000)
Likely homosexual households - Lesbian couples (%)
Likely homosexual households - Lesbian couples (% change since 2000)
Likely homosexual households - Gay men (%)
Likely homosexual households - Gay men (% change since 2000)
Cost of living index
Median gross rent ($)
Median contract rent ($)
Median monthly housing costs ($)
Median house or condo value ($)
Median house or condo value ($ change since 2000)
Mean house or condo value by units in structure - 1, detached ($)
Mean house or condo value by units in structure - 1, attached ($)
Mean house or condo value by units in structure - 2 ($)
Mean house or condo value by units in structure by units in structure - 3 or 4 ($)
Mean house or condo value by units in structure - 5 or more ($)
Mean house or condo value by units in structure - Boat, RV, van, etc. ($)
Mean house or condo value by units in structure - Mobile home ($)
Median house or condo value ($) - White
Median house or condo value ($) - Black or African American
Median house or condo value ($) - Asian
Median house or condo value ($) - Hispanic or Latino
Median house or condo value ($) - American Indian and Alaska Native
Median house or condo value ($) - Multirace
Median house or condo value ($) - Other Race
Median resident age
Resident age diversity
Median resident age - Males
Median resident age - Females
Median resident age - White
Median resident age - Black or African American
Median resident age - Asian
Median resident age - Hispanic or Latino
Median resident age - American Indian and Alaska Native
Median resident age - Multirace
Median resident age - Other Race
Median resident age - Males - White
Median resident age - Males - Black or African American
Median resident age - Males - Asian
Median resident age - Males - Hispanic or Latino
Median resident age - Males - American Indian and Alaska Native
Median resident age - Males - Multirace
Median resident age - Males - Other Race
Median resident age - Females - White
Median resident age - Females - Black or African American
Median resident age - Females - Asian
Median resident age - Females - Hispanic or Latino
Median resident age - Females - American Indian and Alaska Native
Median resident age - Females - Multirace
Median resident age - Females - Other Race
Commute - mean travel time to work (minutes)
Travel time to work - Less than 5 minutes (%)
Travel time to work - Less than 5 minutes (% change since 2000)
Travel time to work - 5 to 9 minutes (%)
Travel time to work - 5 to 9 minutes (% change since 2000)
Travel time to work - 10 to 19 minutes (%)
Travel time to work - 10 to 19 minutes (% change since 2000)
Travel time to work - 20 to 29 minutes (%)
Travel time to work - 20 to 29 minutes (% change since 2000)
Travel time to work - 30 to 39 minutes (%)
Travel time to work - 30 to 39 minutes (% change since 2000)
Travel time to work - 40 to 59 minutes (%)
Travel time to work - 40 to 59 minutes (% change since 2000)
Travel time to work - 60 to 89 minutes (%)
Travel time to work - 60 to 89 minutes (% change since 2000)
Travel time to work - 90 or more minutes (%)
Travel time to work - 90 or more minutes (% change since 2000)
Marital status - Never married (%)
Marital status - Now married (%)
Marital status - Separated (%)
Marital status - Widowed (%)
Marital status - Divorced (%)
Median family income ($)
Median family income (% change since 2000)
Median non-family income ($)
Median non-family income (% change since 2000)
Median per capita income ($)
Median per capita income (% change since 2000)
Median family income ($) - White
Median family income ($) - Black or African American
Median family income ($) - Asian
Median family income ($) - Hispanic or Latino
Median family income ($) - American Indian and Alaska Native
Median family income ($) - Multirace
Median family income ($) - Other Race
Median year house/condo built
Median year apartment built
Year house built - Built 2005 or later (%)
Year house built - Built 2000 to 2004 (%)
Year house built - Built 1990 to 1999 (%)
Year house built - Built 1980 to 1989 (%)
Year house built - Built 1970 to 1979 (%)
Year house built - Built 1960 to 1969 (%)
Year house built - Built 1950 to 1959 (%)
Year house built - Built 1940 to 1949 (%)
Year house built - Built 1939 or earlier (%)
Average household size
Household density (households per square mile)
Average household size - White
Average household size - Black or African American
Average household size - Asian
Average household size - Hispanic or Latino
Average household size - American Indian and Alaska Native
Average household size - Multirace
Average household size - Other Race
Occupied housing units (%)
Vacant housing units (%)
Owner occupied housing units (%)
Renter occupied housing units (%)
Vacancy status - For rent (%)
Vacancy status - For sale only (%)
Vacancy status - Rented or sold, not occupied (%)
Vacancy status - For seasonal, recreational, or occasional use (%)
Vacancy status - For migrant workers (%)
Vacancy status - Other vacant (%)
Residents with income below the poverty level (%)
Residents with income below 50% of the poverty level (%)
Children below poverty level (%)
Poor families by family type - Married-couple family (%)
Poor families by family type - Male, no wife present (%)
Poor families by family type - Female, no husband present (%)
Poverty status for native-born residents (%)
Poverty status for foreign-born residents (%)
Poverty among high school graduates not in families (%)
Poverty among people who did not graduate high school not in families (%)
Residents with income below the poverty level (%) - White
Residents with income below the poverty level (%) - Black or African American
Residents with income below the poverty level (%) - Asian
Residents with income below the poverty level (%) - Hispanic or Latino
Residents with income below the poverty level (%) - American Indian and Alaska Native
Residents with income below the poverty level (%) - Multirace
Residents with income below the poverty level (%) - Other Race
Air pollution - Air Quality Index (AQI)
Air pollution - CO
Air pollution - NO2
Air pollution - SO2
Air pollution - Ozone
Air pollution - PM10
Air pollution - PM25
Air pollution - Pb
Crime - Murders per 100,000 population
Crime - Rapes per 100,000 population
Crime - Robberies per 100,000 population
Crime - Assaults per 100,000 population
Crime - Burglaries per 100,000 population
Crime - Thefts per 100,000 population
Crime - Auto thefts per 100,000 population
Crime - Arson per 100,000 population
Crime - City-data.com crime index
Crime - Violent crime index
Crime - Property crime index
Crime - Murders per 100,000 population (5 year average)
Crime - Rapes per 100,000 population (5 year average)
Crime - Robberies per 100,000 population (5 year average)
Crime - Assaults per 100,000 population (5 year average)
Crime - Burglaries per 100,000 population (5 year average)
Crime - Thefts per 100,000 population (5 year average)
Crime - Auto thefts per 100,000 population (5 year average)
Crime - Arson per 100,000 population (5 year average)
Crime - City-data.com crime index (5 year average)
Crime - Violent crime index (5 year average)
Crime - Property crime index (5 year average)
1996 Presidential Elections Results (%) - Democratic Party (Clinton)
1996 Presidential Elections Results (%) - Republican Party (Dole)
1996 Presidential Elections Results (%) - Other
2000 Presidential Elections Results (%) - Democratic Party (Gore)
2000 Presidential Elections Results (%) - Republican Party (Bush)
2000 Presidential Elections Results (%) - Other
2004 Presidential Elections Results (%) - Democratic Party (Kerry)
2004 Presidential Elections Results (%) - Republican Party (Bush)
2004 Presidential Elections Results (%) - Other
2008 Presidential Elections Results (%) - Democratic Party (Obama)
2008 Presidential Elections Results (%) - Republican Party (McCain)
2008 Presidential Elections Results (%) - Other
2012 Presidential Elections Results (%) - Democratic Party (Obama)
2012 Presidential Elections Results (%) - Republican Party (Romney)
2012 Presidential Elections Results (%) - Other
2016 Presidential Elections Results (%) - Democratic Party (Clinton)
2016 Presidential Elections Results (%) - Republican Party (Trump)
2016 Presidential Elections Results (%) - Other
2020 Presidential Elections Results (%) - Democratic Party (Biden)
2020 Presidential Elections Results (%) - Republican Party (Trump)
2020 Presidential Elections Results (%) - Other
Ancestries Reported - Arab (%)
Ancestries Reported - Czech (%)
Ancestries Reported - Danish (%)
Ancestries Reported - Dutch (%)
Ancestries Reported - English (%)
Ancestries Reported - French (%)
Ancestries Reported - French Canadian (%)
Ancestries Reported - German (%)
Ancestries Reported - Greek (%)
Ancestries Reported - Hungarian (%)
Ancestries Reported - Irish (%)
Ancestries Reported - Italian (%)
Ancestries Reported - Lithuanian (%)
Ancestries Reported - Norwegian (%)
Ancestries Reported - Polish (%)
Ancestries Reported - Portuguese (%)
Ancestries Reported - Russian (%)
Ancestries Reported - Scotch-Irish (%)
Ancestries Reported - Scottish (%)
Ancestries Reported - Slovak (%)
Ancestries Reported - Subsaharan African (%)
Ancestries Reported - Swedish (%)
Ancestries Reported - Swiss (%)
Ancestries Reported - Ukrainian (%)
Ancestries Reported - United States (%)
Ancestries Reported - Welsh (%)
Ancestries Reported - West Indian (%)
Ancestries Reported - Other (%)
Educational Attainment - No schooling completed (%)
Educational Attainment - Less than high school (%)
Educational Attainment - High school or equivalent (%)
Educational Attainment - Less than 1 year of college (%)
Educational Attainment - 1 or more years of college (%)
Educational Attainment - Associate degree (%)
Educational Attainment - Bachelor's degree (%)
Educational Attainment - Master's degree (%)
Educational Attainment - Professional school degree (%)
Educational Attainment - Doctorate degree (%)
School Enrollment - Nursery, preschool (%)
School Enrollment - Kindergarten (%)
School Enrollment - Grade 1 to 4 (%)
School Enrollment - Grade 5 to 8 (%)
School Enrollment - Grade 9 to 12 (%)
School Enrollment - College undergrad (%)
School Enrollment - Graduate or professional (%)
School Enrollment - Not enrolled in school (%)
School enrollment - Public schools (%)
School enrollment - Private schools (%)
School enrollment - Not enrolled (%)
Median number of rooms in houses and condos
Median number of rooms in apartments
Housing units lacking complete plumbing facilities (%)
Housing units lacking complete kitchen facilities (%)
Density of houses
Urban houses (%)
Rural houses (%)
Households with people 60 years and over (%)
Households with people 65 years and over (%)
Households with people 75 years and over (%)
Households with one or more nonrelatives (%)
Households with no nonrelatives (%)
Population in households (%)
Family households (%)
Nonfamily households (%)
Population in families (%)
Family households with own children (%)
Median number of bedrooms in owner occupied houses
Mean number of bedrooms in owner occupied houses
Median number of bedrooms in renter occupied houses
Mean number of bedrooms in renter occupied houses
Median number of vehichles in owner occupied houses
Mean number of vehichles in owner occupied houses
Median number of vehichles in renter occupied houses
Mean number of vehichles in renter occupied houses
Mortgage status - with mortgage (%)
Mortgage status - with second mortgage (%)
Mortgage status - with home equity loan (%)
Mortgage status - with both second mortgage and home equity loan (%)
Mortgage status - without a mortgage (%)
Average family size
Average family size - White
Average family size - Black or African American
Average family size - Asian
Average family size - Hispanic or Latino
Average family size - American Indian and Alaska Native
Average family size - Multirace
Average family size - Other Race
Geographical mobility - Same house 1 year ago (%)
Geographical mobility - Moved within same county (%)
Geographical mobility - Moved from different county within same state (%)
Geographical mobility - Moved from different state (%)
Geographical mobility - Moved from abroad (%)
Place of birth - Born in state of residence (%)
Place of birth - Born in other state (%)
Place of birth - Native, outside of US (%)
Place of birth - Foreign born (%)
Housing units in structures - 1, detached (%)
Housing units in structures - 1, attached (%)
Housing units in structures - 2 (%)
Housing units in structures - 3 or 4 (%)
Housing units in structures - 5 to 9 (%)
Housing units in structures - 10 to 19 (%)
Housing units in structures - 20 to 49 (%)
Housing units in structures - 50 or more (%)
Housing units in structures - Mobile home (%)
Housing units in structures - Boat, RV, van, etc. (%)
House/condo owner moved in on average (years ago)
Renter moved in on average (years ago)
Year householder moved into unit - Moved in 1999 to March 2000 (%)
Year householder moved into unit - Moved in 1995 to 1998 (%)
Year householder moved into unit - Moved in 1990 to 1994 (%)
Year householder moved into unit - Moved in 1980 to 1989 (%)
Year householder moved into unit - Moved in 1970 to 1979 (%)
Year householder moved into unit - Moved in 1969 or earlier (%)
Means of transportation to work - Drove car alone (%)
Means of transportation to work - Carpooled (%)
Means of transportation to work - Public transportation (%)
Means of transportation to work - Bus or trolley bus (%)
Means of transportation to work - Streetcar or trolley car (%)
Means of transportation to work - Subway or elevated (%)
Means of transportation to work - Railroad (%)
Means of transportation to work - Ferryboat (%)
Means of transportation to work - Taxicab (%)
Means of transportation to work - Motorcycle (%)
Means of transportation to work - Bicycle (%)
Means of transportation to work - Walked (%)
Means of transportation to work - Other means (%)
Working at home (%)
Industry diversity
Most Common Industries - Agriculture, forestry, fishing and hunting, and mining (%)
Most Common Industries - Agriculture, forestry, fishing and hunting (%)
Most Common Industries - Mining, quarrying, and oil and gas extraction (%)
Most Common Industries - Construction (%)
Most Common Industries - Manufacturing (%)
Most Common Industries - Wholesale trade (%)
Most Common Industries - Retail trade (%)
Most Common Industries - Transportation and warehousing, and utilities (%)
Most Common Industries - Transportation and warehousing (%)
Most Common Industries - Utilities (%)
Most Common Industries - Information (%)
Most Common Industries - Finance and insurance, and real estate and rental and leasing (%)
Most Common Industries - Finance and insurance (%)
Most Common Industries - Real estate and rental and leasing (%)
Most Common Industries - Professional, scientific, and management, and administrative and waste management services (%)
Most Common Industries - Professional, scientific, and technical services (%)
Most Common Industries - Management of companies and enterprises (%)
Most Common Industries - Administrative and support and waste management services (%)
Most Common Industries - Educational services, and health care and social assistance (%)
Most Common Industries - Educational services (%)
Most Common Industries - Health care and social assistance (%)
Most Common Industries - Arts, entertainment, and recreation, and accommodation and food services (%)
Most Common Industries - Arts, entertainment, and recreation (%)
Most Common Industries - Accommodation and food services (%)
Most Common Industries - Other services, except public administration (%)
Most Common Industries - Public administration (%)
Occupation diversity
Most Common Occupations - Management, business, science, and arts occupations (%)
Most Common Occupations - Management, business, and financial occupations (%)
Most Common Occupations - Management occupations (%)
Most Common Occupations - Business and financial operations occupations (%)
Most Common Occupations - Computer, engineering, and science occupations (%)
Most Common Occupations - Computer and mathematical occupations (%)
Most Common Occupations - Architecture and engineering occupations (%)
Most Common Occupations - Life, physical, and social science occupations (%)
Most Common Occupations - Education, legal, community service, arts, and media occupations (%)
Most Common Occupations - Community and social service occupations (%)
Most Common Occupations - Legal occupations (%)
Most Common Occupations - Education, training, and library occupations (%)
Most Common Occupations - Arts, design, entertainment, sports, and media occupations (%)
Most Common Occupations - Healthcare practitioners and technical occupations (%)
Most Common Occupations - Health diagnosing and treating practitioners and other technical occupations (%)
Most Common Occupations - Health technologists and technicians (%)
Most Common Occupations - Service occupations (%)
Most Common Occupations - Healthcare support occupations (%)
Most Common Occupations - Protective service occupations (%)
Most Common Occupations - Fire fighting and prevention, and other protective service workers including supervisors (%)
Most Common Occupations - Law enforcement workers including supervisors (%)
Most Common Occupations - Food preparation and serving related occupations (%)
Most Common Occupations - Building and grounds cleaning and maintenance occupations (%)
Most Common Occupations - Personal care and service occupations (%)
Most Common Occupations - Sales and office occupations (%)
Most Common Occupations - Sales and related occupations (%)
Most Common Occupations - Office and administrative support occupations (%)
Most Common Occupations - Natural resources, construction, and maintenance occupations (%)
Most Common Occupations - Farming, fishing, and forestry occupations (%)
Most Common Occupations - Construction and extraction occupations (%)
Most Common Occupations - Installation, maintenance, and repair occupations (%)
Most Common Occupations - Production, transportation, and material moving occupations (%)
Most Common Occupations - Production occupations (%)
Most Common Occupations - Transportation occupations (%)
Most Common Occupations - Material moving occupations (%)
People in Group quarters - Institutionalized population (%)
People in Group quarters - Correctional institutions (%)
People in Group quarters - Federal prisons and detention centers (%)
People in Group quarters - Halfway houses (%)
People in Group quarters - Local jails and other confinement facilities (including police lockups) (%)
People in Group quarters - Military disciplinary barracks (%)
People in Group quarters - State prisons (%)
People in Group quarters - Other types of correctional institutions (%)
People in Group quarters - Nursing homes (%)
People in Group quarters - Hospitals/wards, hospices, and schools for the handicapped (%)
People in Group quarters - Hospitals/wards and hospices for chronically ill (%)
People in Group quarters - Hospices or homes for chronically ill (%)
People in Group quarters - Military hospitals or wards for chronically ill (%)
People in Group quarters - Other hospitals or wards for chronically ill (%)
People in Group quarters - Hospitals or wards for drug/alcohol abuse (%)
People in Group quarters - Mental (Psychiatric) hospitals or wards (%)
People in Group quarters - Schools, hospitals, or wards for the mentally retarded (%)
People in Group quarters - Schools, hospitals, or wards for the physically handicapped (%)
People in Group quarters - Institutions for the deaf (%)
People in Group quarters - Institutions for the blind (%)
People in Group quarters - Orthopedic wards and institutions for the physically handicapped (%)
People in Group quarters - Wards in general hospitals for patients who have no usual home elsewhere (%)
People in Group quarters - Wards in military hospitals for patients who have no usual home elsewhere (%)
People in Group quarters - Juvenile institutions (%)
People in Group quarters - Long-term care (%)
People in Group quarters - Homes for abused, dependent, and neglected children (%)
People in Group quarters - Residential treatment centers for emotionally disturbed children (%)
People in Group quarters - Training schools for juvenile delinquents (%)
People in Group quarters - Short-term care, detention or diagnostic centers for delinquent children (%)
People in Group quarters - Type of juvenile institution unknown (%)
People in Group quarters - Noninstitutionalized population (%)
People in Group quarters - College dormitories (includes college quarters off campus) (%)
People in Group quarters - Military quarters (%)
People in Group quarters - On base (%)
People in Group quarters - Barracks, unaccompanied personnel housing (UPH), (Enlisted/Officer), ;and similar group living quarters for military personnel (%)
People in Group quarters - Transient quarters for temporary residents (%)
People in Group quarters - Military ships (%)
People in Group quarters - Group homes (%)
People in Group quarters - Homes or halfway houses for drug/alcohol abuse (%)
People in Group quarters - Homes for the mentally ill (%)
People in Group quarters - Homes for the mentally retarded (%)
People in Group quarters - Homes for the physically handicapped (%)
People in Group quarters - Other group homes (%)
People in Group quarters - Religious group quarters (%)
People in Group quarters - Dormitories (%)
People in Group quarters - Agriculture workers' dormitories on farms (%)
People in Group quarters - Job Corps and vocational training facilities (%)
People in Group quarters - Other workers' dormitories (%)
People in Group quarters - Crews of maritime vessels (%)
People in Group quarters - Other nonhousehold living situations (%)
People in Group quarters - Other noninstitutional group quarters (%)
Residents speaking English at home (%)
Residents speaking English at home - Born in the United States (%)
Residents speaking English at home - Native, born elsewhere (%)
Residents speaking English at home - Foreign born (%)
Residents speaking Spanish at home (%)
Residents speaking Spanish at home - Born in the United States (%)
Residents speaking Spanish at home - Native, born elsewhere (%)
Residents speaking Spanish at home - Foreign born (%)
Residents speaking other language at home (%)
Residents speaking other language at home - Born in the United States (%)
Residents speaking other language at home - Native, born elsewhere (%)
Residents speaking other language at home - Foreign born (%)
Class of Workers - Employee of private company (%)
Class of Workers - Self-employed in own incorporated business (%)
Class of Workers - Private not-for-profit wage and salary workers (%)
Class of Workers - Local government workers (%)
Class of Workers - State government workers (%)
Class of Workers - Federal government workers (%)
Class of Workers - Self-employed workers in own not incorporated business and Unpaid family workers (%)
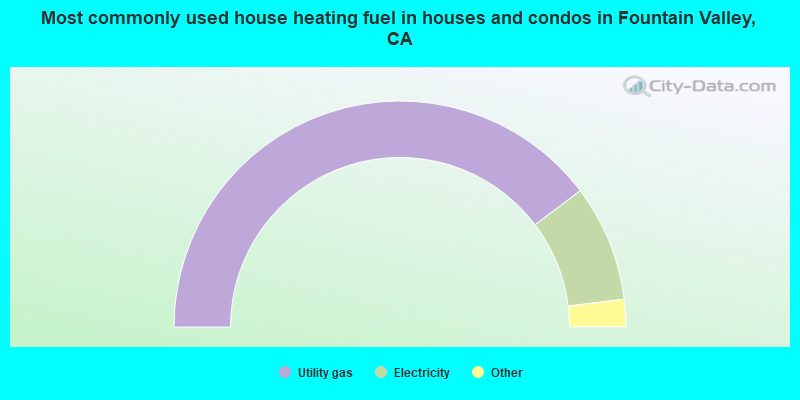
House heating fuel used in houses and condos - Utility gas (%)
House heating fuel used in houses and condos - Bottled, tank, or LP gas (%)
House heating fuel used in houses and condos - Electricity (%)
House heating fuel used in houses and condos - Fuel oil, kerosene, etc. (%)
House heating fuel used in houses and condos - Coal or coke (%)
House heating fuel used in houses and condos - Wood (%)
House heating fuel used in houses and condos - Solar energy (%)
House heating fuel used in houses and condos - Other fuel (%)
House heating fuel used in houses and condos - No fuel used (%)
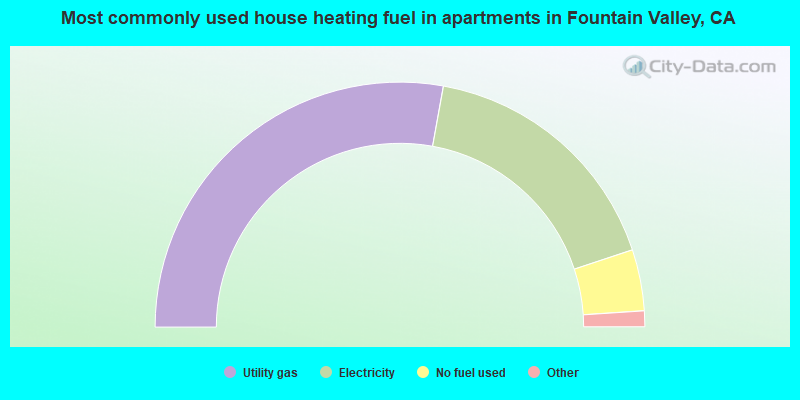
House heating fuel used in apartments - Utility gas (%)
House heating fuel used in apartments - Bottled, tank, or LP gas (%)
House heating fuel used in apartments - Electricity (%)
House heating fuel used in apartments - Fuel oil, kerosene, etc. (%)
House heating fuel used in apartments - Coal or coke (%)
House heating fuel used in apartments - Wood (%)
House heating fuel used in apartments - Solar energy (%)
House heating fuel used in apartments - Other fuel (%)
House heating fuel used in apartments - No fuel used (%)
Armed forces status - In Armed Forces (%)
Armed forces status - Civilian (%)
Armed forces status - Civilian - Veteran (%)
Armed forces status - Civilian - Nonveteran (%)
Fatal accidents locations in years 2005-2021
Fatal accidents locations in 2005
Fatal accidents locations in 2006
Fatal accidents locations in 2007
Fatal accidents locations in 2008
Fatal accidents locations in 2009
Fatal accidents locations in 2010
Fatal accidents locations in 2011
Fatal accidents locations in 2012
Fatal accidents locations in 2013
Fatal accidents locations in 2014
Fatal accidents locations in 2015
Fatal accidents locations in 2016
Fatal accidents locations in 2017
Fatal accidents locations in 2018
Fatal accidents locations in 2019
Fatal accidents locations in 2020
Fatal accidents locations in 2021
Alcohol use - People drinking some alcohol every month (%)
Alcohol use - People not drinking at all (%)
Alcohol use - Average days/month drinking alcohol
Alcohol use - Average drinks/week
Alcohol use - Average days/year people drink much
Audiometry - Average condition of hearing (%)
Audiometry - People that can hear a whisper from across a quiet room (%)
Audiometry - People that can hear normal voice from across a quiet room (%)
Audiometry - Ears ringing, roaring, buzzing (%)
Audiometry - Had a job exposure to loud noise (%)
Audiometry - Had off-work exposure to loud noise (%)
Blood Pressure & Cholesterol - Has high blood pressure (%)
Blood Pressure & Cholesterol - Checking blood pressure at home (%)
Blood Pressure & Cholesterol - Frequently checking blood cholesterol (%)
Blood Pressure & Cholesterol - Has high cholesterol level (%)
Consumer Behavior - Money monthly spent on food at supermarket/grocery store
Consumer Behavior - Money monthly spent on food at other stores
Consumer Behavior - Money monthly spent on eating out
Consumer Behavior - Money monthly spent on carryout/delivered foods
Consumer Behavior - Income spent on food at supermarket/grocery store (%)
Consumer Behavior - Income spent on food at other stores (%)
Consumer Behavior - Income spent on eating out (%)
Consumer Behavior - Income spent on carryout/delivered foods (%)
Current Health Status - General health condition (%)
Current Health Status - Blood donors (%)
Current Health Status - Has blood ever tested for HIV virus (%)
Current Health Status - Left-handed people (%)
Dermatology - People using sunscreen (%)
Diabetes - Diabetics (%)
Diabetes - Had a blood test for high blood sugar (%)
Diabetes - People taking insulin (%)
Diet Behavior & Nutrition - Diet health (%)
Diet Behavior & Nutrition - Milk product consumption (# of products/month)
Diet Behavior & Nutrition - Meals not home prepared (#/week)
Diet Behavior & Nutrition - Meals from fast food or pizza place (#/week)
Diet Behavior & Nutrition - Ready-to-eat foods (#/month)
Diet Behavior & Nutrition - Frozen meals/pizza (#/month)
Drug Use - People that ever used marijuana or hashish (%)
Drug Use - Ever used hard drugs (%)
Drug Use - Ever used any form of cocaine (%)
Drug Use - Ever used heroin (%)
Drug Use - Ever used methamphetamine (%)
Health Insurance - People covered by health insurance (%)
Kidney Conditions-Urology - Avg. # of times urinating at night
Medical Conditions - People with asthma (%)
Medical Conditions - People with anemia (%)
Medical Conditions - People with psoriasis (%)
Medical Conditions - People with overweight (%)
Medical Conditions - Elderly people having difficulties in thinking or remembering (%)
Medical Conditions - People who ever received blood transfusion (%)
Medical Conditions - People having trouble seeing even with glass/contacts (%)
Medical Conditions - People with arthritis (%)
Medical Conditions - People with gout (%)
Medical Conditions - People with congestive heart failure (%)
Medical Conditions - People with coronary heart disease (%)
Medical Conditions - People with angina pectoris (%)
Medical Conditions - People who ever had heart attack (%)
Medical Conditions - People who ever had stroke (%)
Medical Conditions - People with emphysema (%)
Medical Conditions - People with thyroid problem (%)
Medical Conditions - People with chronic bronchitis (%)
Medical Conditions - People with any liver condition (%)
Medical Conditions - People who ever had cancer or malignancy (%)
Mental Health - People who have little interest in doing things (%)
Mental Health - People feeling down, depressed, or hopeless (%)
Mental Health - People who have trouble sleeping or sleeping too much (%)
Mental Health - People feeling tired or having little energy (%)
Mental Health - People with poor appetite or overeating (%)
Mental Health - People feeling bad about themself (%)
Mental Health - People who have trouble concentrating on things (%)
Mental Health - People moving or speaking slowly or too fast (%)
Mental Health - People having thoughts they would be better off dead (%)
Oral Health - Average years since last visit a dentist
Oral Health - People embarrassed because of mouth (%)
Oral Health - People with gum disease (%)
Oral Health - General health of teeth and gums (%)
Oral Health - Average days a week using dental floss/device
Oral Health - Average days a week using mouthwash for dental problem
Oral Health - Average number of teeth
Pesticide Use - Households using pesticides to control insects (%)
Pesticide Use - Households using pesticides to kill weeds (%)
Physical Activity - People doing vigorous-intensity work activities (%)
Physical Activity - People doing moderate-intensity work activities (%)
Physical Activity - People walking or bicycling (%)
Physical Activity - People doing vigorous-intensity recreational activities (%)
Physical Activity - People doing moderate-intensity recreational activities (%)
Physical Activity - Average hours a day doing sedentary activities
Physical Activity - Average hours a day watching TV or videos
Physical Activity - Average hours a day using computer
Physical Functioning - People having limitations keeping them from working (%)
Physical Functioning - People limited in amount of work they can do (%)
Physical Functioning - People that need special equipment to walk (%)
Physical Functioning - People experiencing confusion/memory problems (%)
Physical Functioning - People requiring special healthcare equipment (%)
Prescription Medications - Average number of prescription medicines taking
Preventive Aspirin Use - Adults 40+ taking low-dose aspirin (%)
Reproductive Health - Vaginal deliveries (%)
Reproductive Health - Cesarean deliveries (%)
Reproductive Health - Deliveries resulted in a live birth (%)
Reproductive Health - Pregnancies resulted in a delivery (%)
Reproductive Health - Women breastfeeding newborns (%)
Reproductive Health - Women that had a hysterectomy (%)
Reproductive Health - Women that had both ovaries removed (%)
Reproductive Health - Women that have ever taken birth control pills (%)
Reproductive Health - Women taking birth control pills (%)
Reproductive Health - Women that have ever used Depo-Provera or injectables (%)
Reproductive Health - Women that have ever used female hormones (%)
Sexual Behavior - People 18+ that ever had sex (vaginal, anal, or oral) (%)
Sexual Behavior - Males 18+ that ever had vaginal sex with a woman (%)
Sexual Behavior - Males 18+ that ever performed oral sex on a woman (%)
Sexual Behavior - Males 18+ that ever had anal sex with a woman (%)
Sexual Behavior - Males 18+ that ever had any sex with a man (%)
Sexual Behavior - Females 18+ that ever had vaginal sex with a man (%)
Sexual Behavior - Females 18+ that ever performed oral sex on a man (%)
Sexual Behavior - Females 18+ that ever had anal sex with a man (%)
Sexual Behavior - Females 18+ that ever had any kind of sex with a woman (%)
Sexual Behavior - Average age people first had sex
Sexual Behavior - Average number of female sex partners in lifetime (males 18+)
Sexual Behavior - Average number of female vaginal sex partners in lifetime (males 18+)
Sexual Behavior - Average age people first performed oral sex on a woman (18+)
Sexual Behavior - Average number of woman performed oral sex on in lifetime (18+)
Sexual Behavior - Average number of male sex partners in lifetime (males 18+)
Sexual Behavior - Average number of male anal sex partners in lifetime (males 18+)
Sexual Behavior - Average age people first performed oral sex on a man (18+)
Sexual Behavior - Average number of male oral sex partners in lifetime (18+)
Sexual Behavior - People using protection when performing oral sex (%)
Sexual Behavior - Average number of times people have vaginal or anal sex a year
Sexual Behavior - People having sex without condom (%)
Sexual Behavior - Average number of male sex partners in lifetime (females 18+)
Sexual Behavior - Average number of male vaginal sex partners in lifetime (females 18+)
Sexual Behavior - Average number of female sex partners in lifetime (females 18+)
Sexual Behavior - Circumcised males 18+ (%)
Sleep Disorders - Average hours sleeping at night
Sleep Disorders - People that has trouble sleeping (%)
Smoking-Cigarette Use - People smoking cigarettes (%)
Taste & Smell - People 40+ having problems with smell (%)
Taste & Smell - People 40+ having problems with taste (%)
Taste & Smell - People 40+ that ever had wisdom teeth removed (%)
Taste & Smell - People 40+ that ever had tonsils teeth removed (%)
Taste & Smell - People 40+ that ever had a loss of consciousness because of a head injury (%)
Taste & Smell - People 40+ that ever had a broken nose or other serious injury to face or skull (%)
Taste & Smell - People 40+ that ever had two or more sinus infections (%)
Weight - Average height (inches)
Weight - Average weight (pounds)
Weight - Average BMI
Weight - People that are obese (%)
Weight - People that ever were obese (%)
Weight - People trying to lose weight (%)
21,824 38.7% Asian alone 20,906 37.1% White alone 9,645 17.1% Hispanic 3,056 5.4% Two or more races 540 1.0% Native Hawaiian and Other 380 0.7% Black alone 332 0.6% Other race alone 76 0.1% American Indian alone
Officers per 1,000 residents here:
1.05California average:
2.30
Latest news from Fountain Valley, CA collected exclusively by city-data.com from local newspapers, TV, and radio stations
Fountain Valley, CA City Guides: Ancestries: English (3.8%), American (3.5%), Egyptian (3.2%), German (3.0%), European (2.8%), Irish (2.6%).
Current Local Time:
Land area: 8.91 square miles.
Population density: 6,275 people per square mile (high).
18,360 residents are foreign born (23.3% Asia , 4.4% Latin America ).
This city:
32.6%California:
26.5%
Median real estate property taxes paid for housing units with mortgages in 2022: $6,297 (0.6%)Median real estate property taxes paid for housing units with no mortgage in 2022: $4,641 (0.5%)
Nearest city with pop. 200,000+: North Coast, CA (2.5 miles
Nearest city with pop. 1,000,000+: Los Angeles, CA
Nearest cities:
Latitude: 33.71 N, Longitude: 117.96 W
Daytime population change due to commuting: +1,780 (+3.2%)Workers who live and work in this city: 6,311 (23.2%)
Area code commonly used in this area: 714
Single-family new house construction building permits:
2022: 63 buildings , average cost: $354,0002021: 30 buildings , average cost: $168,6002020: 39 buildings , average cost: $160,5002019: 24 buildings , average cost: $228,4002018: 11 buildings , average cost: $263,9002017: 16 buildings , average cost: $314,6002016: 8 buildings , average cost: $567,3002015: 4 buildings , average cost: $264,7002014: 7 buildings , average cost: $261,2002013: 38 buildings , average cost: $192,9002012: 32 buildings , average cost: $244,1002011: 26 buildings , average cost: $238,8002010: 3 buildings , average cost: $334,0002009: 55 buildings , average cost: $331,2002008: 68 buildings , average cost: $311,0002007: 5 buildings , average cost: $328,0002006: 2 buildings , average cost: $357,5002005: 5 buildings , average cost: $313,8002004: 9 buildings , average cost: $302,9002003: 64 buildings , average cost: $240,9002002: 3 buildings , average cost: $172,6002000: 3 buildings , average cost: $265,4001999: 2 buildings , average cost: $243,7001998: 1 building , cost: $323,0001997: 58 buildings , average cost: $218,700Unemployment in December 2023:
Population change in the 1990s: +1,039 (+1.9%).
Most common occupations in Fountain Valley, CA (%)
Both Males Females
Other management occupations, except farmers and farm managers (5.3%)
Other sales and related occupations, including supervisors (5.1%)
Other office and administrative support workers, including supervisors (4.4%)
Engineers (4.4%)
Sales representatives, services, wholesale and manufacturing (4.2%)
Computer specialists (3.6%)
Preschool, kindergarten, elementary, and middle school teachers (3.5%)
Engineers (7.1%)
Other management occupations, except farmers and farm managers (6.5%)
Other sales and related occupations, including supervisors (6.2%)
Computer specialists (5.2%)
Sales representatives, services, wholesale and manufacturing (4.7%)
Electrical equipment mechanics and other installation, maintenance, and repair workers, including supervisors (4.1%)
Top executives (3.5%)
Other office and administrative support workers, including supervisors (6.7%)
Preschool, kindergarten, elementary, and middle school teachers (6.5%)
Secretaries and administrative assistants (5.9%)
Information and record clerks, except customer service representatives (4.2%)
Other management occupations, except farmers and farm managers (4.0%)
Other sales and related occupations, including supervisors (3.9%)
Sales representatives, services, wholesale and manufacturing (3.5%)
Earthquake activity:
Fountain Valley-area historical earthquake activity is significantly above California state average. It is 6758% greater than the overall U.S. average. On 7/21/1952 at 11:52:14, a magnitude 7.7 (7.7 UK, Class: Major, Intensity: VIII - XII) earthquake occurred 107.4 miles away from the city center, causing $50,000,000 total damage On 6/28/1992 at 11:57:34, a magnitude 7.6 (6.2 MB, 7.6 MS, 7.3 MW, Depth: 0.7 mi) earthquake occurred 88.1 miles away from the city center, causing 3 deaths ( 1 shaking deaths, 2 other deaths) and 400 injuries, causing $100,000,000 total damage and $40,000,000 insured lossesOn 10/16/1999 at 09:46:44, a magnitude 7.4 (6.3 MB, 7.4 MS, 7.2 MW, 7.3 ML) earthquake occurred 103.4 miles away from Fountain Valley center On 11/4/1927 at 13:51:53, a magnitude 7.5 (7.5 UK) earthquake occurred 194.5 miles away from Fountain Valley center On 4/21/1918 at 22:32:30, a magnitude 6.8 (6.8 UK, Class: Strong, Intensity: VII - IX) earthquake occurred 30.5 miles away from the city center On 5/19/1940 at 04:36:40, a magnitude 7.2 (7.2 UK) earthquake occurred 134.6 miles away from Fountain Valley center, causing $33,000,000 total damage Magnitude types: body-wave magnitude (MB), local magnitude (ML), surface-wave magnitude (MS), moment magnitude (MW) Natural disasters: The number of natural disasters in Orange County (32) is a lot greater than the US average (15).Major Disasters (Presidential) Declared: 22Emergencies Declared: 2Floods: 15, Fires: 13, Storms: 9, Landslides: 6, Winter Storms: 6, Mudslides: 5, Earthquakes: 2, Heavy Rain: 1, Hurricane: 1, Snow: 1, Tornado: 1, Wind: 1, Other: 1 (Note: some incidents may be assigned to more than one category). Main business address for: HYUNDAI ABS FUNDING CORP ASSET-BACKED SECURITIES ), CAM COMMERCE SOLUTIONS INC SERVICES-COMPUTER INTEGRATED SYSTEMS DESIGN ).
Hospitals and medical centers in Fountain Valley: CHARTER HOSPITAL OF FOUNTAIN VALLEY (11250 WARNER AVE) ENRICHING, INC (9514 SMOKETREE AVENUE) FOUNTAIN VALLEY REGIONAL HOSPITAL & MEDICAL CENTER (Proprietary, provides emergency services, 17100 EUCLID STREET) ORANGE COAST MEMORIAL MEDICAL CENTER (Proprietary, 9920 TALBERT AVENUE) FOUNTAIN VALLEY REG HOSPMED CTR DP/SNF (11250 WARNER AVE)
MANORCARE HEALTH SERVICES (FOUNTAIN VALLEY) (11680 WARNER AVENUE)
FOUNTAIN VALLEY REGIONAL DIALYSIS CENTER (17150 EUCLID STREET, SUITE 111)
RAI-NEWHOPE-FOUNTAIN VALLEY (17197 NEWHOPE STREET, SUITE A, B, C & D)
HEALTH FORCE OR ORANGE COUNTY (17151 NEWHOPE ST, SUITE 211)
SUNRISE HOME HEALTH CARE LLC (10840 WARNER AVE SUITE 105)
Heliports located in Fountain Valley: Amtrak stations near Fountain Valley: 7 miles: SANTA ANA (1000 E. SANTA ANA BLVD.) Services: ticket office, fully wheelchair accessible, enclosed waiting area, public restrooms, public payphones, snack bar, free short-term parking, free long-term parking, call for car rental service, taxi stand, intercity bus service, public transit connection.
8 miles: ANAHEIM (2150 KATELLA AVE.) Services: ticket office, fully wheelchair accessible, enclosed waiting area, public restrooms, public payphones, vending machines, free short-term parking, free long-term parking, call for car rental service, call for taxi service.
9 miles: NEWPORT BEACH (NEWPORT TRANS. CENTER, 1550 AVOCADO AVE.) - Bus Station Services: fully wheelchair accessible, public payphones, public transit connection.
Colleges/Universities in Fountain Valley: Coastline Community College Full-time enrollment: 4,591; Location: 11460 Warner Ave.; Public; Website: www.coastline.edu)
Modern Technology School Full-time enrollment: 209; Location: 16560 Harbor Blvd., Units K-Q; Private, for-profit; Website: www.mtschool.edu)
Coastline Beauty College Full-time enrollment: 152; Location: 16151 Harbor Blvd; Private, for-profit; Website: www.coastlinebeauty.edu)
Other colleges/universities with over 2000 students near Fountain Valley:
Golden West College (about 4 miles; Huntington Beach, CA ; Full-time enrollment: 7,358)
Orange Coast College (about 4 miles; Costa Mesa, CA ; FT enrollment: 12,918)
University of Phoenix-Southern California Campus (about 5 miles; Costa Mesa, CA ; FT enrollment: 8,110)
Vanguard University of Southern California (about 5 miles; Costa Mesa, CA ; FT enrollment: 2,104)
Santa Ana College (about 6 miles; Santa Ana, CA ; FT enrollment: 11,756)
West Coast University-Orange County (about 8 miles; Anaheim, CA ; FT enrollment: 2,464)
University of California-Irvine (about 8 miles; Irvine, CA ; FT enrollment: 28,587)
Public high schools in Fountain Valley:
Private high school in Fountain Valley: ALETHEIA CLASSICAL ACADEMY Students: 10, Location: 9041 CROCUS AVE, Grades: 1-9)
Biggest public elementary/middle schools in Fountain Valley: MASUDA (KAZUO) MIDDLE Students: 799, Location: 17415 LOS JARDINES W., Grades: 6-8)FULTON (HARRY C.) MIDDLE Students: 780, Location: 8778 EL LAGO ST., Grades: 6-8)VISTA VIEW MIDDLE Students: 747, Location: 16250 HICKORY ST., Grades: 6-8)ETHAN B. ALLEN ELEMENTARY Students: 536, Location: 16200 BUSHARD ST., Grades: KG-6)COX (JAMES H.) ELEMENTARY Students: 478, Location: 17615 LOS JARDINES E., Grades: KG-5)COURREGES (ROCH) ELEMENTARY Students: 437, Location: 18313 SANTA CARLOTTA, Grades: KG-5)GISLER (ROBERT) ELEMENTARY Students: 339, Location: 18720 LAS FLORES ST., Grades: KG-5)MAMIE L. NORTHCUTT ELEMENTARY Students: 322, Location: 11303 SANDSTONE ST., Grades: KG-6)PLAVAN (URBAIN H.) ELEMENTARY Students: 274, Location: 9675 WARNER AVE., Grades: KG-5)TAMURA (HISAMATSU) ELEMENTARY Students: 274, Location: 17340 SANTA SUZANNE ST., Grades: KG-5)Private elementary/middle schools in Fountain Valley: SHORELINE CHRISTIAN SCHOOL Students: 218, Location: 10350 ELLIS AVE, Grades: KG-8)
FOUNTAIN VALLEY MONTESSORI CENTER Students: 184, Location: 18410 BROOKHURST ST, Grades: PK-3)
SLATER MONTESSORI ACADEMY Students: 35, Location: 10316 SLATER AVE, Grades: PK-2)
See full list of schools located in Fountain Valley
Notable locations in Fountain Valley: (A) , Mile Square Golf Course (B) , David L Baker Golf Course (C) , Fountain Valley Branch Orange County Public Library (D) , Fountain Valley Fire Station 2 (E) , Fountain Valley Fire Department Station 1 (F) , Fountain Valley Recreational and Cultural Center (G) , Fountain Valley City Hall (H) . Display/hide their locations on the map
Shopping Centers: (1) , Brookhurst Plaza Shopping Center (2) , Plavan Plaza Shopping Center (3) , Fountain Shopping Center (4) , Fountain Valley Promenade Shopping Center (5) , Fountain Valley Plaza Shopping Center (6) , Callens Corner Shopping Center (7) . Display/hide their locations on the map
Main business address in Fountain Valley include: (A) , CAM COMMERCE SOLUTIONS INC (B) . Display/hide their locations on the map
Parks in Fountain Valley include: (1) , Green Valley Park (2) , Heritage Park (3) , Los Alamos Park (4) , Allen Park (5) , Cordata Park (6) , Courreges Park (7) , Fountain Valley Park (8) , Fulton Park (9) . Display/hide their locations on the map
Tourist attraction:
Birthplace of: Jack Evans - Professional wrestler, Keri Russell - (born 1976), actress, Andre Sommersell - 2005 NFL player (Indianapolis Colts, born : Jun 26, 1980), Brian Brushwood - Magician, Craig Wilson - 2005 Major League Baseball player (Pittsburgh Pirates, born : Nov 30, 1976), Freddie Freeman - Baseball player, Iakopo - Recording artist, Luke Hudson - 2005 Major League Baseball player (Cincinnati Reds, born : May 2, 1977), Mike Hessman - Baseball player, Ryan Hansen - Television actor.
Orange County has a predicted average indoor radon screening level less than 2 pCi/L (pico curies per liter) - Low Potential Average household size: This city:
2.9 peopleCalifornia:
2.9 people
Percentage of family households: This city:
76.2%Whole state:
68.7%
Percentage of households with unmarried partners: This city:
4.0%Whole state:
7.2%
Likely homosexual households (counted as self-reported same-sex unmarried-partner households)
Lesbian couples: 0.4% of all households Gay men: 0.2% of all households
People in group quarters in Fountain Valley in 2010:
160 people in nursing facilities/skilled-nursing facilities
154 people in group homes intended for adults
51 people in workers' group living quarters and job corps centers
47 people in other noninstitutional facilities
8 people in in-patient hospice facilities
6 people in group homes for juveniles (non-correctional)
6 people in residential treatment centers for juveniles (non-correctional)
5 people in residential treatment centers for adults
People in group quarters in Fountain Valley in 2000:
174 people in other nonhousehold living situations
167 people in nursing homes
155 people in other noninstitutional group quarters
6 people in other group homes
4 people in homes for the mentally retarded
4 people in religious group quarters
2 people in hospitals/wards and hospices for chronically ill
2 people in other hospitals or wards for chronically ill
Banks with most branches in Fountain Valley (2011 data):
Wells Fargo Bank, National Association: Brookhurst-Edinger Branch at 16025 Brookhurst Street, branch established on 1974/03/01; Fountain Valley Branch at 10060 Slater Ave, branch established on 1938/01/01. Info updated 2011/04/05: Bank assets: $1,161,490.0 mil, Deposits: $905,653.0 mil, headquarters in Sioux Falls, SD, positive income , 6395 total offices , Holding Company: Wells Fargo & Company
Bank of America, National Association: Harbor-Edinger Branch at 16192 Harbor Boulevard, branch established on 1970/09/24; Fountain Valley Branch at 17430 Brookhurst Street, branch established on 1964/01/16. Info updated 2009/11/18: Bank assets: $1,451,969.3 mil, Deposits: $1,077,176.8 mil, headquarters in Charlotte, NC, positive income , 5782 total offices , Holding Company: Bank Of America Corporation
JPMorgan Chase Bank, National Association: Fountain Valley At Costco at 17870 Newhope Street, Suite 106, branch established on 2005/12/05; Fountain Valley Branch at 18975 Brookhurst Avenue, branch established on 1889/01/01. Info updated 2011/11/10: Bank assets: $1,811,678.0 mil, Deposits: $1,190,738.0 mil, headquarters in Columbus, OH, positive income , International Specialization, 5577 total offices , Holding Company: Jpmorgan Chase & Co.
U.S. Bank National Association: Brookhurst & Edinger Albertsons at 16061 Brookhurst Street, branch established on 2008/10/20; Fountain Valley Branch at 17150 Magnolia Street, branch established on 1957/10/16. Info updated 2012/01/30: Bank assets: $330,470.8 mil, Deposits: $236,091.5 mil, headquarters in Cincinnati, OH, positive income , 3121 total offices , Holding Company: U.S. Bancorp
Independence Bank: Fountain Valley Branch at 18101 Magnolia Street, branch established on 2007/01/17. Info updated 2009/11/06: Bank assets: $294.2 mil, Deposits: $208.7 mil, headquarters in Newport Beach, CA, positive income , Commercial Lending Specialization, 4 total offices
Cathay Bank: Fountain Valley Branch at 17860 Newhope Street, Suite 104, branch established on 2005/08/22. Info updated 2010/12/08: Bank assets: $10,628.9 mil, Deposits: $7,249.8 mil, headquarters in Los Angeles, CA, positive income , Commercial Lending Specialization, 52 total offices , Holding Company: Cathay General Bancorp
Centennial Bank: at 18837 Brookhurst Street, Suite 100, branch established on 1979/10/25. Info updated 2007/05/14: Bank assets: $657.6 mil, Deposits: $457.9 mil, local headquarters , positive income , Commercial Lending Specialization, 1 total offices
Union Bank, National Association: Fountain Valley Branch at 18175 Brookhurst Street, branch established on 1990/06/14. Info updated 2011/09/01: Bank assets: $88,967.5 mil, Deposits: $65,286.4 mil, headquarters in San Francisco, CA, positive income , Commercial Lending Specialization, 403 total offices , Holding Company: Mitsubishi Ufj Financial Group, Inc.
Citibank, National Association: Fountain Valley Branch at 17400 Brookhurst Drive, branch established on 1934/12/17. Info updated 2012/01/10: Bank assets: $1,288,658.0 mil, Deposits: $882,541.0 mil, headquarters in Sioux Falls, SD, positive income , International Specialization, 1048 total offices , Holding Company: Citigroup Inc.
For population 15 years and over in Fountain Valley:
Never married: 32.9%Now married: 51.0%Separated: 1.7%Widowed: 5.7%Divorced: 8.7% For population 25 years and over in Fountain Valley:
High school or higher: 90.4%Bachelor's degree or higher: 43.8%Graduate or professional degree: 13.3%Unemployed: 4.8%Mean travel time to work (commute): 21.0 minutes
Education Gini index (Inequality in education) Here:
13.1California average:
15.5
Religion statistics for Fountain Valley, CA (based on Orange County data)
Religion Adherents Congregations Catholic 797,473 67 Evangelical Protestant 345,893 894 Other 141,815 329 Mainline Protestant 76,574 202 Orthodox 13,406 19 Black Protestant 2,424 8 None 1,632,647 -
Source: Clifford Grammich, Kirk Hadaway, Richard Houseal, Dale E.Jones, Alexei Krindatch, Richie Stanley and Richard H.Taylor. 2012. 2010 U.S.Religion Census: Religious Congregations & Membership Study. Association of Statisticians of American Religious Bodies. Jones, Dale E., et al. 2002. Congregations and Membership in the United States 2000. Nashville, TN: Glenmary Research Center. Graphs represent county-level data
Food Environment Statistics: Number of grocery stores : 530Orange County :
1.78 / 10,000 pop.State :
2.14 / 10,000 pop.
Number of supercenters and club stores : 18Orange County :
0.06 / 10,000 pop.California :
0.04 / 10,000 pop.
Number of convenience stores (no gas) : 147Orange County :
0.49 / 10,000 pop.California :
0.62 / 10,000 pop.
Number of convenience stores (with gas) : 434This county :
1.46 / 10,000 pop.State :
1.49 / 10,000 pop.
Number of full-service restaurants : 2,438This county :
8.19 / 10,000 pop.California :
7.42 / 10,000 pop.
Adult diabetes rate : Orange County :
6.3%State :
7.3%
Adult obesity rate : Here :
18.5%California :
21.3%
Low-income preschool obesity rate : Health and Nutrition: Healthy diet rate : This city:
53.6%California:
49.4%
Average overall health of teeth and gums : Here:
50.9%California:
48.0%
Average BMI : Fountain Valley:
27.5State:
28.1
People feeling badly about themselves : This city:
18.8%California:
20.2%
People not drinking alcohol at all : Average hours sleeping at night : General health condition : Fountain Valley:
58.4%California:
56.4%
Average condition of hearing : Here:
80.7%California:
80.9%
More about Health and Nutrition of Fountain Valley, CA Residents
Local government employment and payroll (March 2022)
Function
Full-time employees
Monthly full-time payroll
Average yearly full-time wage
Part-time employees
Monthly part-time payroll
Police Protection - Officers
62 $683,094 $132,212 0 $0 Firefighters
41 $568,343 $166,344 0 $0 Police - Other
23 $140,038 $73,063 9 $14,665 Water Supply
18 $126,039 $84,026 0 $0 Other Government Administration
16 $126,181 $94,636 1 $554 Streets and Highways
13 $101,915 $94,075 0 $0 Financial Administration
12 $97,612 $97,612 0 $0 Parks and Recreation
10 $74,790 $89,748 29 $31,494 Other and Unallocable
9 $59,420 $79,227 0 $0 Sewerage
4 $28,888 $86,664 0 $0 Fire - Other
4 $34,248 $102,744 0 $0 Housing and Community Development (Local)
2 $17,371 $104,226 0 $0 Solid Waste Management
1 $7,048 $84,576 0 $0 Health
1 $10,365 $124,380 0 $0 Welfare
0 $0 1 $1,461
Totals for Government
216 $2,075,353 $115,297 40 $48,174
Fountain Valley government finances - Expenditure in 2021 (per resident):
Construction - General - Other: $3,859,000 ($69.00)
Parks and Recreation: $1,435,000 ($25.66)Housing and Community Development: $260,000 ($4.65)Police Protection: $211,000 ($3.77)Regular Highways: $76,000 ($1.36)Current Operations - Police Protection: $18,508,000 ($330.91)
Water Utilities: $13,243,000 ($236.78)Regular Highways: $10,332,000 ($184.73)Local Fire Protection: $8,687,000 ($155.32)Central Staff Services: $8,631,000 ($154.32)Health - Other: $5,401,000 ($96.57)Parks and Recreation: $4,287,000 ($76.65)Solid Waste Management: $3,730,000 ($66.69)Protective Inspection and Regulation - Other: $1,686,000 ($30.14)Housing and Community Development: $870,000 ($15.56)Sewerage: $849,000 ($15.18)General - Other: $159,000 ($2.84)General - Interest on Debt: $3,129,000 ($55.94)
Water Utilities - Interest on Debt: $449,000 ($8.03)
Fountain Valley government finances - Revenue in 2021 (per resident):
Charges - Other: $10,510,000 ($187.91)
Solid Waste Management: $3,753,000 ($67.10)Sewerage: $2,385,000 ($42.64)Parks and Recreation: $157,000 ($2.81)Federal Intergovernmental - Housing and Community Development: $514,000 ($9.19)
Other: $269,000 ($4.81)Local Intergovernmental - Other: $2,214,000 ($39.59)
Water Utilities: $98,000 ($1.75)Miscellaneous - General Revenue - Other: $7,011,000 ($125.35)
Interest Earnings: $2,430,000 ($43.45)Rents: $733,000 ($13.11)Fines and Forfeits: $643,000 ($11.50)Donations From Private Sources: $108,000 ($1.93)Sale of Property: $5,000 ($0.09)Revenue - Water Utilities: $19,434,000 ($347.47)
State Intergovernmental - Other: $2,830,000 ($50.60)
Highways: $2,292,000 ($40.98)General Local Government Support: $57,000 ($1.02)Tax - General Sales and Gross Receipts: $28,802,000 ($514.97)
Property: $20,931,000 ($374.24)Other License: $1,976,000 ($35.33)Public Utilities Sales: $1,972,000 ($35.26)Other Selective Sales: $914,000 ($16.34)Occupation and Business License - Other: $465,000 ($8.31)Documentary and Stock Transfer: $312,000 ($5.58)
Fountain Valley government finances - Debt in 2021 (per resident):
Long Term Debt - Beginning Outstanding - Unspecified Public Purpose: $67,361,000 ($1204.38)
Outstanding Unspecified Public Purpose: $63,142,000 ($1128.95)Retired Unspecified Public Purpose: $4,218,000 ($75.42)
Fountain Valley government finances - Cash and Securities in 2021 (per resident):
Bond Funds - Cash and Securities: $23,000 ($0.41)
Other Funds - Cash and Securities: $98,541,000 ($1761.86)
Sinking Funds - Cash and Securities: $625,000 ($11.17)
4.86% of this county's 2021 resident taxpayers lived in other counties in 2020 ($95,983 average adjusted gross income )
Here:
4.86%California average:
5.19%
0.01% of residents moved from foreign countries ($132 average AGI )Orange County:
0.01%California average:
0.03%
Top counties from which taxpayers relocated into this county between 2020 and 2021:
5.71% of this county's 2020 resident taxpayers moved to other counties in 2021 ($106,828 average adjusted gross income )
Here:
5.71%California average:
6.14%
0.01% of residents moved to foreign countries ($180 average AGI )Orange County:
0.01%California average:
0.02%
Top counties to which taxpayers relocated from this county between 2020 and 2021:
Businesses in Fountain Valley, CA
Name Count Name Count
24 Hour Fitness 1 Jamba Juice 1 7-Eleven 5 Jones New York 3 Albertsons 2 KFC 1 Applebee's 1 Kroger 2 Ashley Furniture 1 LA Fitness 1 AutoZone 1 Little Caesars Pizza 1 Baskin-Robbins 1 Marriott 2 Blockbuster 1 MasterBrand Cabinets 10 Burger King 1 McDonald's 1 CVS 2 New Balance 1 Carl\s Jr. 2 Nike 11 Chipotle 1 Office Depot 1 Circle K 1 Panda Express 1 Costco 1 PetSmart 1 Curves 2 Quiznos 1 Days Inn 1 RadioShack 1 Decora Cabinetry 1 Rite Aid 2 Dennys 1 Sam's Club 1 Discount Tire 2 Sprint Nextel 1 DressBarn 1 Staples 1 Dressbarn 1 Starbucks 5 El Pollo Loco 1 T-Mobile 4 FedEx 7 T.J.Maxx 1 Firestone Complete Auto Care 1 Taco Bell 3 GNC 1 UPS 8 GameStop 2 Walgreens 3 Goodwill 1 Wendy's 1 H&R Block 2
Strongest AM radio stations in Fountain Valley:
KFI (640 AM; 50 kW; LOS ANGELES, CA; Owner: CAPSTAR TX LIMITED PARTNERSHIP)
KVNR (1480 AM; 5 kW; SANTA ANA, CA; Owner: LBI RADIO LICENSE CORP.)
KLAC (570 AM; 50 kW; LOS ANGELES, CA; Owner: AMFM RADIO LICENSES, L.L.C.)
KTNQ (1020 AM; 50 kW; LOS ANGELES, CA; Owner: KTNQ-AM LICENSE CORP.)
KPLS (830 AM; 50 kW; ORANGE, CA; Owner: CRN LICENSES, LLC)
KXTA (1150 AM; 50 kW; LOS ANGELES, CA; Owner: CITICASTERS LICENSES, L.P.)
KNX (1070 AM; 50 kW; LOS ANGELES, CA; Owner: INFINITY BROADCASTING OPERATIONS, INC.)
KFWB (980 AM; 50 kW; LOS ANGELES, CA; Owner: INFINITY BROADCASTING OPERATIONS, INC.)
KDIS (1110 AM; 50 kW; PASADENA, CA; Owner: ABC,INC.)
KMPC (1540 AM; 50 kW; LOS ANGELES, CA; Owner: ROSE CITY RADIO CORPORATION)
KSPN (710 AM; 50 kW; LOS ANGELES, CA; Owner: KABC-AM RADIO, INC.)
KBLA (1580 AM; 50 kW; SANTA MONICA, CA)
KXMX (1190 AM; 25 kW; ANAHEIM, CA; Owner: NEW INSPIRATION BROADCASTING COMPANY)
Strongest FM radio stations in Fountain Valley:
KDLE (103.1 FM; NEWPORT BEACH, CA; Owner: ENTRAVISION HOLDINGS, LLC.)
KWVE (107.9 FM; SAN CLEMENTE, CA; Owner: CALVARY CHAPEL OF COSTA MESA)
KCBS-FM (93.1 FM; LOS ANGELES, CA; Owner: INFINITY BROADCASTING OPERATIONS, INC.)
KZLA-FM (93.9 FM; LOS ANGELES, CA; Owner: EMMIS RADIO LICENSE CORPORATION)
KPWR (105.9 FM; LOS ANGELES, CA; Owner: EMMIS RADIO LICENSE CORPORATION)
KLSX (97.1 FM; LOS ANGELES, CA; Owner: INFINITY BROADCASTING OPERATIONS, INC.)
KUSC (91.5 FM; LOS ANGELES, CA; Owner: UNIVERSITY OF SOUTHERN CALIFORNIA)
KSCA (101.9 FM; GLENDALE, CA; Owner: HBC LICENSE CORPORATION)
KALI-FM (106.3 FM; SANTA ANA, CA; Owner: KALI-FM, INC.)
KLOS (95.5 FM; LOS ANGELES, CA; Owner: KLOS-FM RADIO, INC.)
K212FA (90.3 FM; TEMPLE CITY, CA; Owner: EDUCATIONAL MEDIA FOUNDATION)
KOST (103.5 FM; LOS ANGELES, CA; Owner: CAPSTAR TX LIMITED PARTNERSHIP)
KKLA-FM (99.5 FM; LOS ANGELES, CA; Owner: NEW INSPIRATION BROADCASTING CO., INC.)
KLVE (107.5 FM; LOS ANGELES, CA; Owner: KLVE-FM LICENSE CORP.)
KIIS-FM (102.7 FM; LOS ANGELES, CA; Owner: CITICASTERS LICENSES, L.P.)
KRTH-FM (101.1 FM; LOS ANGELES, CA; Owner: INFINITY BROADCASTING OPERATIONS, INC.)
KPCC (89.3 FM; PASADENA, CA; Owner: PASADENA AREA COMMUNITY COLLEGE DISTRICT)
KHHT (92.3 FM; LOS ANGELES, CA; Owner: AMFM RADIO LICENSES, L.L.C.)
KBIG-FM (104.3 FM; LOS ANGELES, CA; Owner: AMFM RADIO LICENSES, L.L.C.)
KMZT-FM (105.1 FM; LOS ANGELES, CA; Owner: MOUNT WILSON FM BROADCASTERS, INC.)
TV broadcast stations around Fountain Valley:
KTRO-LP (Channel 50; LANCASTER, CA; Owner: ROBERT D. ADELMAN)
KCBS-TV (Channel 2; LOS ANGELES, CA; Owner: CBS BROADCASTING INC.)
Home Mortgage Disclosure Act Aggregated Statistics For Year 2009(Based on 10 full and 5 partial tracts) A) FHA, FSA/RHS & VA B) Conventional C) Refinancings D) Home Improvement Loans E) Loans on Dwellings For 5+ Families F) Non-occupant Loans on G) Loans On Manufactured Number Average Value Number Average Value Number Average Value Number Average Value Number Average Value Number Average Value Number Average Value
LOANS ORIGINATED 48 $397,792 277 $401,663 1,481 $325,421 85 $282,813 0 $0 69 $317,497 8 $107,625 APPLICATIONS APPROVED, NOT ACCEPTED 5 $322,290 30 $420,905 185 $353,786 13 $147,155 0 $0 12 $329,836 3 $127,667 APPLICATIONS DENIED 16 $342,638 87 $418,495 345 $371,418 21 $215,397 0 $0 30 $338,377 11 $92,320 APPLICATIONS WITHDRAWN 9 $448,429 79 $389,464 266 $345,854 13 $235,600 1 $12,979,580 17 $343,732 0 $0 FILES CLOSED FOR INCOMPLETENESS 2 $606,380 10 $456,054 73 $366,462 1 $81,900 0 $0 3 $295,857 0 $0
Aggregated Statistics For Year 2008(Based on 10 full and 5 partial tracts) A) FHA, FSA/RHS & VA B) Conventional C) Refinancings D) Home Improvement Loans E) Loans on Dwellings For 5+ Families F) Non-occupant Loans on G) Loans On Manufactured Number Average Value Number Average Value Number Average Value Number Average Value Number Average Value Number Average Value Number Average Value
LOANS ORIGINATED 33 $471,691 324 $384,457 534 $315,544 63 $162,231 0 $0 58 $302,585 14 $84,742 APPLICATIONS APPROVED, NOT ACCEPTED 8 $397,889 82 $404,155 142 $333,780 13 $164,162 0 $0 8 $288,472 11 $120,461 APPLICATIONS DENIED 15 $357,006 110 $437,420 277 $387,088 58 $155,103 1 $357,900 23 $284,090 12 $118,392 APPLICATIONS WITHDRAWN 5 $483,952 88 $375,061 142 $369,245 16 $119,374 1 $2,800,000 12 $311,510 2 $87,805 FILES CLOSED FOR INCOMPLETENESS 1 $459,000 13 $402,616 45 $374,503 8 $213,395 0 $0 1 $375,000 0 $0
Aggregated Statistics For Year 2007(Based on 10 full and 5 partial tracts) A) FHA, FSA/RHS & VA B) Conventional C) Refinancings D) Home Improvement Loans E) Loans on Dwellings For 5+ Families F) Non-occupant Loans on G) Loans On Manufactured Number Average Value Number Average Value Number Average Value Number Average Value Number Average Value Number Average Value Number Average Value
LOANS ORIGINATED 1 $312,610 343 $374,866 915 $345,656 137 $194,285 2 $3,394,215 88 $334,751 19 $94,921 APPLICATIONS APPROVED, NOT ACCEPTED 0 $0 97 $342,571 244 $365,891 32 $252,323 0 $0 17 $351,183 20 $99,145 APPLICATIONS DENIED 1 $148,000 154 $426,712 477 $428,676 84 $245,883 2 $10,000 50 $351,809 15 $131,284 APPLICATIONS WITHDRAWN 0 $0 62 $374,198 208 $402,320 36 $275,676 0 $0 14 $276,889 4 $245,965 FILES CLOSED FOR INCOMPLETENESS 0 $0 23 $436,249 89 $435,679 7 $265,109 0 $0 8 $399,795 0 $0
Aggregated Statistics For Year 2006(Based on 10 full and 5 partial tracts) B) Conventional C) Refinancings D) Home Improvement Loans E) Loans on Dwellings For 5+ Families F) Non-occupant Loans on G) Loans On Manufactured Number Average Value Number Average Value Number Average Value Number Average Value Number Average Value Number Average Value
LOANS ORIGINATED 522 $397,855 1,237 $364,467 183 $197,455 1 $47,807,940 99 $358,561 20 $84,199 APPLICATIONS APPROVED, NOT ACCEPTED 143 $371,953 244 $359,978 27 $231,543 0 $0 20 $390,046 26 $70,624 APPLICATIONS DENIED 200 $404,217 440 $411,374 70 $222,218 0 $0 35 $395,361 12 $80,218 APPLICATIONS WITHDRAWN 94 $356,627 404 $380,560 28 $246,779 1 $187,000 30 $384,920 3 $130,333 FILES CLOSED FOR INCOMPLETENESS 34 $413,538 90 $387,110 10 $268,648 0 $0 9 $340,531 0 $0
Aggregated Statistics For Year 2005(Based on 10 full and 5 partial tracts) A) FHA, FSA/RHS & VA B) Conventional C) Refinancings D) Home Improvement Loans F) Non-occupant Loans on G) Loans On Manufactured Number Average Value Number Average Value Number Average Value Number Average Value Number Average Value Number Average Value
LOANS ORIGINATED 1 $178,000 700 $404,934 1,593 $355,811 237 $202,834 143 $345,652 16 $109,759 APPLICATIONS APPROVED, NOT ACCEPTED 0 $0 160 $369,602 250 $352,107 37 $155,270 31 $331,121 19 $83,114 APPLICATIONS DENIED 0 $0 209 $389,774 419 $387,676 95 $244,073 33 $434,559 30 $99,306 APPLICATIONS WITHDRAWN 0 $0 134 $388,223 422 $358,096 59 $237,670 30 $344,730 6 $130,980 FILES CLOSED FOR INCOMPLETENESS 0 $0 71 $370,026 202 $382,292 16 $173,769 7 $463,224 1 $460,000
Aggregated Statistics For Year 2004(Based on 10 full and 5 partial tracts) B) Conventional C) Refinancings D) Home Improvement Loans F) Non-occupant Loans on G) Loans On Manufactured Number Average Value Number Average Value Number Average Value Number Average Value Number Average Value
LOANS ORIGINATED 803 $354,255 2,109 $292,408 205 $179,481 170 $279,743 16 $98,730 APPLICATIONS APPROVED, NOT ACCEPTED 167 $375,062 352 $298,467 27 $131,188 20 $321,580 12 $70,351 APPLICATIONS DENIED 166 $352,927 431 $310,786 82 $187,435 47 $287,886 13 $95,295 APPLICATIONS WITHDRAWN 112 $355,849 395 $298,287 45 $132,159 18 $279,680 3 $125,000 FILES CLOSED FOR INCOMPLETENESS 35 $347,584 180 $323,920 10 $111,530 6 $350,472 1 $66,000
Aggregated Statistics For Year 2003(Based on 10 full and 5 partial tracts) A) FHA, FSA/RHS & VA B) Conventional C) Refinancings D) Home Improvement Loans E) Loans on Dwellings For 5+ Families F) Non-occupant Loans on Number Average Value Number Average Value Number Average Value Number Average Value Number Average Value Number Average Value
LOANS ORIGINATED 10 $197,749 831 $280,565 4,980 $232,550 95 $72,557 1 $2,397,870 245 $212,614 APPLICATIONS APPROVED, NOT ACCEPTED 1 $266,740 136 $273,304 680 $238,862 28 $47,969 0 $0 40 $200,567 APPLICATIONS DENIED 3 $122,660 132 $271,114 685 $243,335 30 $90,864 0 $0 50 $216,380 APPLICATIONS WITHDRAWN 0 $0 110 $274,091 693 $242,738 20 $86,384 0 $0 34 $189,775 FILES CLOSED FOR INCOMPLETENESS 0 $0 36 $298,191 151 $247,458 11 $72,580 0 $0 12 $246,485
Aggregated Statistics For Year 2002(Based on 8 full and 5 partial tracts) A) FHA, FSA/RHS & VA B) Conventional C) Refinancings D) Home Improvement Loans E) Loans on Dwellings For 5+ Families F) Non-occupant Loans on Number Average Value Number Average Value Number Average Value Number Average Value Number Average Value Number Average Value
LOANS ORIGINATED 24 $199,935 709 $232,817 3,296 $219,682 60 $82,532 2 $1,258,880 169 $180,809 APPLICATIONS APPROVED, NOT ACCEPTED 1 $36,000 106 $225,159 505 $216,033 21 $33,566 0 $0 27 $155,786 APPLICATIONS DENIED 3 $159,997 113 $200,467 455 $210,989 43 $59,621 0 $0 29 $189,306 APPLICATIONS WITHDRAWN 6 $238,317 71 $214,285 472 $215,613 14 $67,282 0 $0 17 $188,810 FILES CLOSED FOR INCOMPLETENESS 0 $0 22 $251,921 178 $238,693 1 $50,000 0 $0 7 $150,169
Aggregated Statistics For Year 2001(Based on 8 full and 5 partial tracts) A) FHA, FSA/RHS & VA B) Conventional C) Refinancings D) Home Improvement Loans E) Loans on Dwellings For 5+ Families F) Non-occupant Loans on Number Average Value Number Average Value Number Average Value Number Average Value Number Average Value Number Average Value
LOANS ORIGINATED 35 $172,410 730 $199,000 2,358 $201,225 115 $46,201 1 $399,640 98 $167,217 APPLICATIONS APPROVED, NOT ACCEPTED 4 $154,245 101 $177,479 316 $197,625 21 $46,834 0 $0 23 $146,482 APPLICATIONS DENIED 3 $152,227 129 $178,285 452 $194,955 49 $52,137 0 $0 30 $176,162 APPLICATIONS WITHDRAWN 6 $195,425 76 $180,757 434 $199,102 31 $57,525 0 $0 19 $155,426 FILES CLOSED FOR INCOMPLETENESS 1 $109,890 17 $226,146 116 $193,630 6 $89,388 0 $0 8 $146,265
Aggregated Statistics For Year 2000(Based on 8 full and 5 partial tracts) A) FHA, FSA/RHS & VA B) Conventional C) Refinancings D) Home Improvement Loans F) Non-occupant Loans on Number Average Value Number Average Value Number Average Value Number Average Value Number Average Value
LOANS ORIGINATED 38 $171,993 691 $195,916 547 $157,270 101 $43,828 52 $142,118 APPLICATIONS APPROVED, NOT ACCEPTED 2 $136,325 107 $178,340 97 $169,098 36 $45,434 3 $146,253 APPLICATIONS DENIED 4 $169,460 142 $152,144 246 $155,506 51 $34,592 9 $116,387 APPLICATIONS WITHDRAWN 7 $142,039 89 $184,021 130 $133,203 16 $48,538 7 $92,307 FILES CLOSED FOR INCOMPLETENESS 2 $176,655 31 $192,607 52 $208,861 5 $34,238 2 $173,695
Aggregated Statistics For Year 1999(Based on 9 full and 6 partial tracts) A) FHA, FSA/RHS & VA B) Conventional C) Refinancings D) Home Improvement Loans E) Loans on Dwellings For 5+ Families F) Non-occupant Loans on Number Average Value Number Average Value Number Average Value Number Average Value Number Average Value Number Average Value
LOANS ORIGINATED 45 $155,576 844 $182,390 1,287 $165,867 114 $38,961 3 $9,468,943 87 $136,155 APPLICATIONS APPROVED, NOT ACCEPTED 2 $128,040 108 $169,576 237 $169,954 30 $31,350 0 $0 7 $144,553 APPLICATIONS DENIED 11 $123,857 219 $133,790 380 $147,858 61 $39,144 0 $0 22 $116,728 APPLICATIONS WITHDRAWN 9 $112,849 129 $176,160 263 $173,394 17 $34,615 0 $0 15 $162,095 FILES CLOSED FOR INCOMPLETENESS 2 $129,620 32 $211,503 109 $184,251 9 $70,034 0 $0 4 $167,522
Detailed mortgage data for all 15 tracts in Fountain Valley, CA
Private Mortgage Insurance Companies Aggregated Statistics For Year 2009(Based on 6 full and 4 partial tracts) A) Conventional B) Refinancings Number Average Value Number Average Value
LOANS ORIGINATED 6 $358,502 2 $447,035 APPLICATIONS APPROVED, NOT ACCEPTED 3 $499,673 4 $420,068 APPLICATIONS DENIED 2 $303,175 5 $495,690 APPLICATIONS WITHDRAWN 0 $0 2 $482,500 FILES CLOSED FOR INCOMPLETENESS 0 $0 0 $0
Aggregated Statistics For Year 2008(Based on 9 full and 5 partial tracts) A) Conventional B) Refinancings C) Non-occupant Loans on Number Average Value Number Average Value Number Average Value
LOANS ORIGINATED 19 $407,537 8 $425,070 2 $391,780 APPLICATIONS APPROVED, NOT ACCEPTED 16 $468,723 10 $504,037 1 $506,000 APPLICATIONS DENIED 5 $328,200 3 $390,743 1 $215,060 APPLICATIONS WITHDRAWN 1 $495,000 1 $275,000 1 $495,000 FILES CLOSED FOR INCOMPLETENESS 0 $0 1 $404,000 0 $0
Aggregated Statistics For Year 2007(Based on 8 full and 4 partial tracts) A) Conventional B) Refinancings C) Non-occupant Loans on Number Average Value Number Average Value Number Average Value
LOANS ORIGINATED 13 $447,904 8 $536,632 1 $368,560 APPLICATIONS APPROVED, NOT ACCEPTED 3 $532,813 9 $509,540 2 $399,515 APPLICATIONS DENIED 1 $314,500 0 $0 0 $0 APPLICATIONS WITHDRAWN 0 $0 2 $499,480 0 $0 FILES CLOSED FOR INCOMPLETENESS 0 $0 0 $0 0 $0
Aggregated Statistics For Year 2006(Based on 2 full and 5 partial tracts) A) Conventional B) Refinancings C) Non-occupant Loans on Number Average Value Number Average Value Number Average Value
LOANS ORIGINATED 0 $0 4 $469,010 0 $0 APPLICATIONS APPROVED, NOT ACCEPTED 1 $644,000 2 $469,655 1 $644,000 APPLICATIONS DENIED 0 $0 2 $582,005 0 $0 APPLICATIONS WITHDRAWN 0 $0 1 $722,890 0 $0 FILES CLOSED FOR INCOMPLETENESS 0 $0 0 $0 0 $0
Aggregated Statistics For Year 2005(Based on 4 full and 4 partial tracts) A) Conventional B) Refinancings C) Non-occupant Loans on Number Average Value Number Average Value Number Average Value
LOANS ORIGINATED 5 $430,716 7 $446,374 1 $332,500 APPLICATIONS APPROVED, NOT ACCEPTED 2 $484,995 0 $0 0 $0 APPLICATIONS DENIED 0 $0 0 $0 0 $0 APPLICATIONS WITHDRAWN 0 $0 0 $0 0 $0 FILES CLOSED FOR INCOMPLETENESS 0 $0 0 $0 0 $0
Aggregated Statistics For Year 2004(Based on 9 full and 5 partial tracts) A) Conventional B) Refinancings C) Non-occupant Loans on Number Average Value Number Average Value Number Average Value
LOANS ORIGINATED 14 $419,199 6 $282,637 2 $369,450 APPLICATIONS APPROVED, NOT ACCEPTED 5 $395,756 3 $428,330 0 $0 APPLICATIONS DENIED 1 $500,000 0 $0 0 $0 APPLICATIONS WITHDRAWN 1 $333,000 0 $0 0 $0 FILES CLOSED FOR INCOMPLETENESS 0 $0 0 $0 0 $0
Aggregated Statistics For Year 2003(Based on 10 full and 5 partial tracts) A) Conventional B) Refinancings C) Non-occupant Loans on Number Average Value Number Average Value Number Average Value
LOANS ORIGINATED 29 $319,389 14 $308,314 2 $120,305 APPLICATIONS APPROVED, NOT ACCEPTED 11 $280,047 9 $326,286 1 $123,150 APPLICATIONS DENIED 2 $437,235 1 $411,950 0 $0 APPLICATIONS WITHDRAWN 3 $287,617 2 $288,210 1 $429,000 FILES CLOSED FOR INCOMPLETENESS 0 $0 0 $0 0 $0
Aggregated Statistics For Year 2002(Based on 8 full and 5 partial tracts) A) Conventional B) Refinancings C) Non-occupant Loans on Number Average Value Number Average Value Number Average Value
LOANS ORIGINATED 64 $272,232 36 $278,261 7 $146,290 APPLICATIONS APPROVED, NOT ACCEPTED 22 $261,963 17 $298,536 1 $153,660 APPLICATIONS DENIED 3 $286,673 1 $368,000 1 $102,310 APPLICATIONS WITHDRAWN 10 $386,075 6 $296,207 3 $210,743 FILES CLOSED FOR INCOMPLETENESS 0 $0 1 $255,000 0 $0
Aggregated Statistics For Year 2001(Based on 8 full and 5 partial tracts) A) Conventional B) Refinancings C) Non-occupant Loans on Number Average Value Number Average Value Number Average Value
LOANS ORIGINATED 79 $247,390 67 $248,073 5 $199,234 APPLICATIONS APPROVED, NOT ACCEPTED 32 $210,983 19 $269,421 2 $109,470 APPLICATIONS DENIED 14 $208,630 3 $265,117 1 $373,010 APPLICATIONS WITHDRAWN 10 $179,644 2 $261,570 1 $275,000 FILES CLOSED FOR INCOMPLETENESS 0 $0 0 $0 0 $0
Aggregated Statistics For Year 2000(Based on 8 full and 5 partial tracts) A) Conventional B) Refinancings C) Non-occupant Loans on Number Average Value Number Average Value Number Average Value
LOANS ORIGINATED 99 $231,928 33 $233,057 5 $154,024 APPLICATIONS APPROVED, NOT ACCEPTED 31 $228,571 11 $205,347 1 $81,470 APPLICATIONS DENIED 10 $197,753 3 $172,497 0 $0 APPLICATIONS WITHDRAWN 1 $274,200 1 $253,000 0 $0 FILES CLOSED FOR INCOMPLETENESS 0 $0 0 $0 0 $0
Aggregated Statistics For Year 1999(Based on 9 full and 6 partial tracts) A) Conventional B) Refinancings C) Non-occupant Loans on Number Average Value Number Average Value Number Average Value
LOANS ORIGINATED 183 $222,734 73 $210,786 5 $235,564 APPLICATIONS APPROVED, NOT ACCEPTED 23 $216,515 33 $217,522 1 $178,700 APPLICATIONS DENIED 18 $224,059 8 $259,152 2 $232,105 APPLICATIONS WITHDRAWN 7 $196,710 5 $210,134 1 $212,000 FILES CLOSED FOR INCOMPLETENESS 6 $216,473 4 $242,062 0 $0
Fire-safe hotels and motels in Fountain Valley, California:
Residence Inn Fountain Valley, 9930 Slater Ave, Fountain Valley, California 92708 Phone: (714) 965-8000, Fax: (714) 962-3439
Days Inn And Suite Huntington Beachfountain Valley, 9125 Recreation Cir, Fountain Valley, California 92708 Phone: (714) 847-3388, Fax: (714) 842-4192
Ayres Hotel Fountain Valley, 17550 Brookhurst St, Fountain Valley, California 92708 Phone: (714) 861-5170, Fax: (714) 861-5175
All 3 fire-safe hotels and motels in Fountain Valley, California
Most common first names in Fountain Valley, CA among deceased individuals Name Count Lived (average)
Mary 225 79.3 years John 213 74.0 years Robert 170 71.8 years William 159 73.9 years James 123 72.0 years Dorothy 97 77.9 years Margaret 96 79.0 years Helen 93 79.7 years Charles 91 73.0 years George 88 75.1 years
Most common last names in Fountain Valley, CA among deceased individuals Last name Count Lived (average)
Nguyen 98 74.9 years Smith 65 73.1 years Johnson 47 75.2 years Miller 41 79.8 years Tran 37 80.4 years Brown 36 76.5 years Anderson 34 76.9 years Williams 29 76.7 years Jones 27 75.4 years Le 26 76.5 years
Fountain Valley compared to California state average:
Unemployed percentage significantly below state average. Black race population percentage significantly below state average. Hispanic race population percentage below state average. Median age significantly above state average. Renting percentage below state average. Length of stay since moving in significantly above state average. Number of rooms per house above state average. Percentage of population with a bachelor's degree or higher above state average. Fountain Valley on our top lists :
#10 on the list of "Top 101 cities with the most residents born in Vietnam (population 500+)"
#11 on the list of "Top 101 cities with largest percentage of females in industries: other services, except public administration (population 50,000+)"
#29 on the list of "Top 101 larger cities with the highest increase in house/condo value from 2000 (population 50,000+)"
#35 on the list of "Top 101 cities with the largest city-data.com crime index increase from 2011 to 2012 (population 50,000+)"
#39 on the list of "Top 101 cities with largest percentage of males in occupations: architecture and engineering occupations (population 50,000+)"
#41 on the list of "Top 101 cities where residents moved in more then 10 years ago (10,000+ households)"
#41 on the list of "Top 100 cities with highest median house value (pop. 50,000+)"
#50 on the list of "Top 100 cities with highest ratio of median house value to median household income (pop. 50,000+)"
#53 on the list of "Top 100 cities with oldest residents (pop. 50,000+)"
#57 on the list of "Top 101 cities with largest percentage of females in occupations: office and administrative support occupations (population 50,000+)"
#57 on the list of "Top 101 cities with the most residents born in South Eastern Asia (population 500+)"
#57 on the list of "Top 100 high-educated but low-earning cities (pop. 50,000+)"
#58 on the list of "Top 101 cities with the most cars per house, population 50,000+"
#61 on the list of "Top 101 cities with the most residents born in Taiwan (population 500+)"
#62 on the list of "Top 101 cities with the smallest percentage of unmarried partner households (population 50,000+)"
#65 on the list of "Top 101 cities with largest percentage of females in occupations: installation, maintenance, and repair occupations (population 50,000+)"
#67 on the list of "Top 101 cities with largest percentage of males in industries: retail trade (population 50,000+)"
#77 on the list of "Top 101 cities with the lowest number of police officers per 1000 residents (population 50,000+)"
#79 on the list of "Top 101 cities with largest percentage of males in occupations: sales and related occupations (population 50,000+)"
#80 on the list of "Top 101 cities with the smallest house values disparities (population 50,000+)"
#37 (92708) on the list of "Top 101 zip codes with the most offices of physicians in 2005"
#72 (92704) on the list of "Top 101 zip codes with the largest percentage of taxpayers using paid preparers for 2012 taxes (pop 5,000+)"
#4 on the list of "Top 101 counties with the highest total withdrawal of fresh water for public supply"
#5 on the list of "Top 101 counties with the most Catholic adherents"
#6 on the list of "Top 101 counties with the highest ground withdrawal of fresh water for public supply"
#7 on the list of "Top 101 counties with the most Evangelical Protestant adherents"
#8 on the list of "Top 101 counties with the highest Particulate Matter (PM2.5 ) Annual air pollution readings in 2012 (µg/m3 )"
Top Patent Applicants
Todd M. Heidelbaugh (53)
Chris Levesque (35)
Hoang Mong Nguyen (26)
James William Phillips (25)
Anthony A. Nobles (17)
Stephen Wu (16)
Tai D. Tieu (14)
Hung Vo (14)
Donald E. Bobo, Sr. (13)
Dustin J. Brekke (13)
Total of 802 patent applications in 2008-2024.

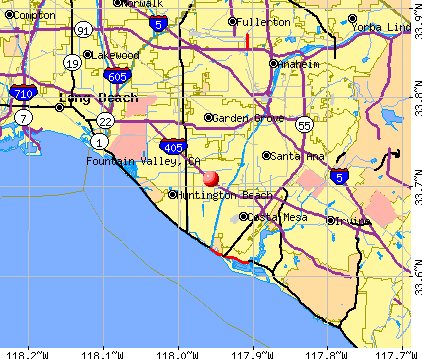


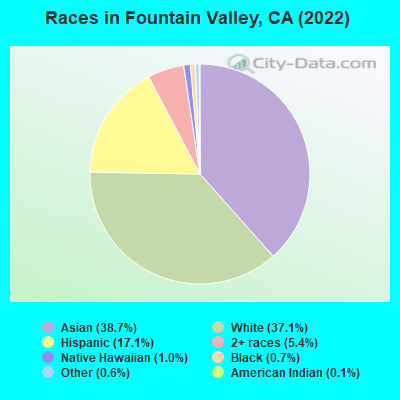
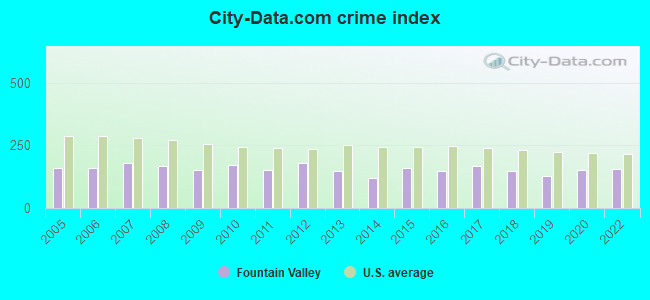
 Recent articles from our blog. Our writers, many of them Ph.D. graduates or candidates, create easy-to-read articles on a wide variety of topics.

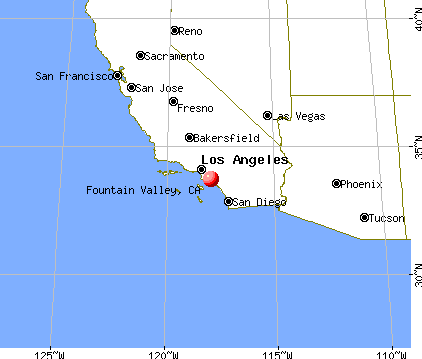
 , pop. 363,603).
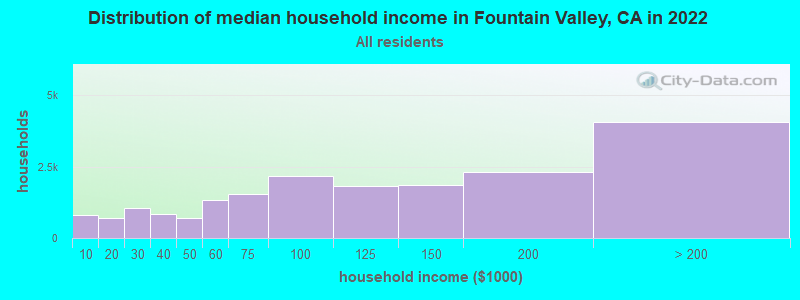
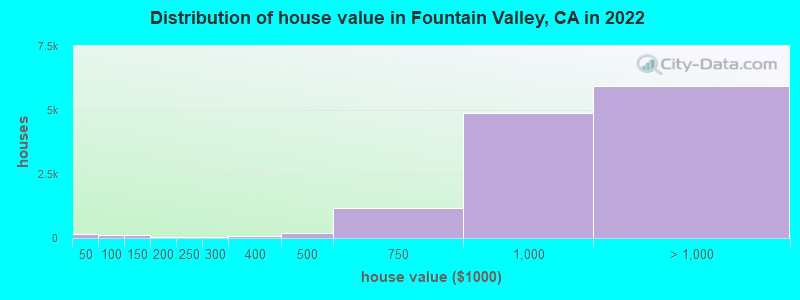
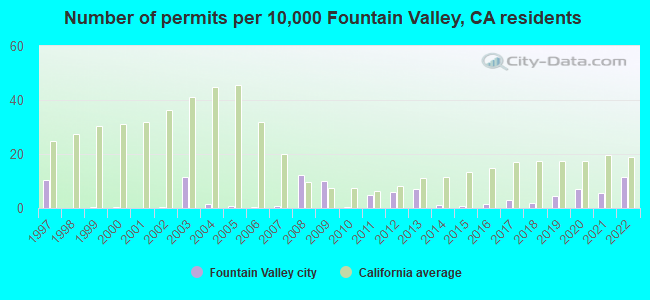
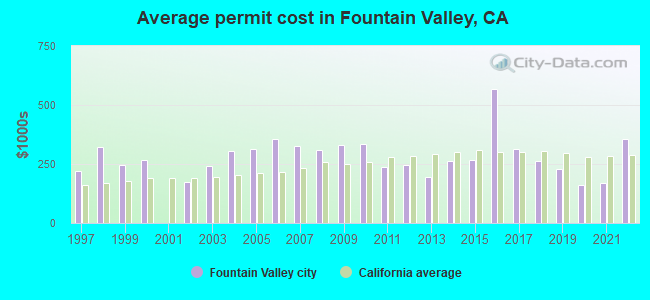
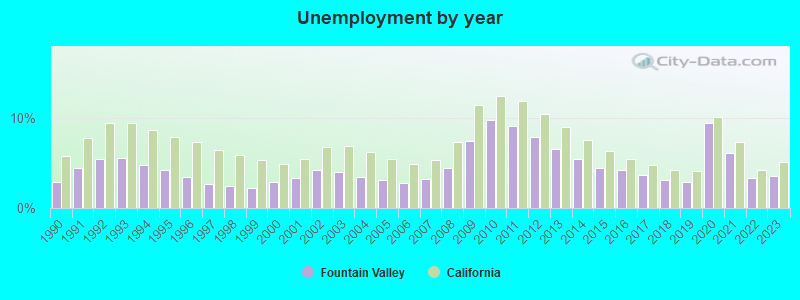
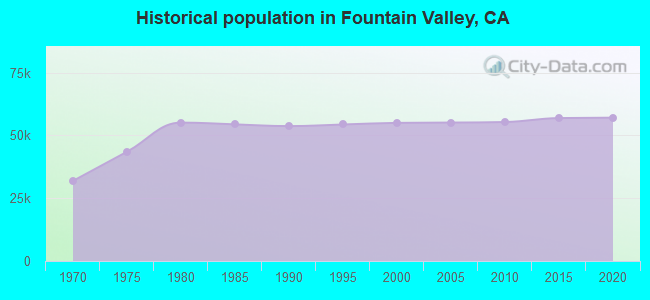
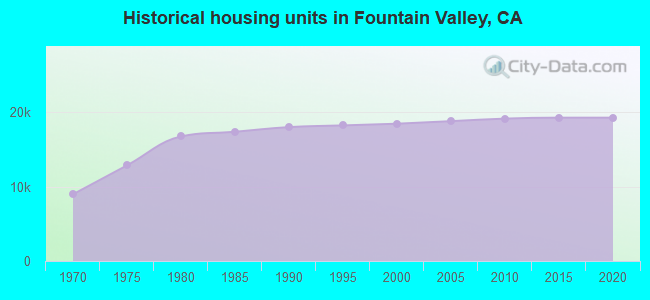
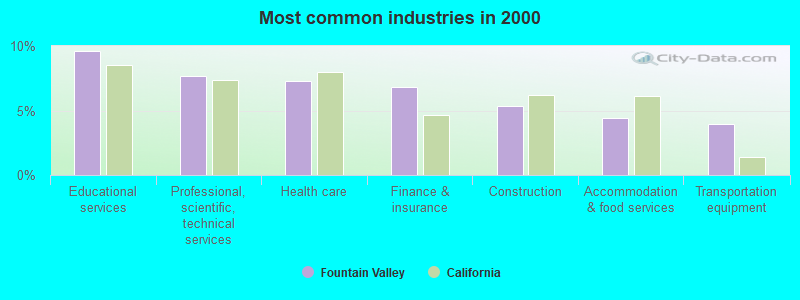
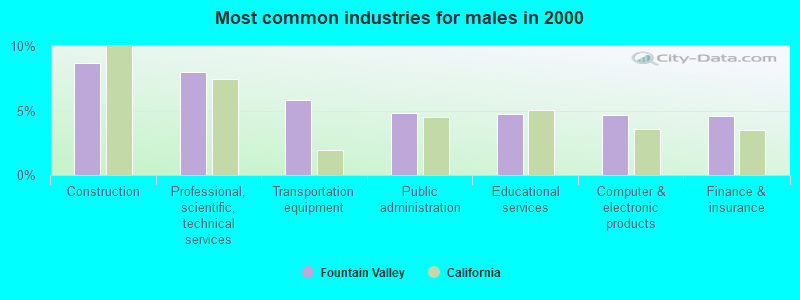
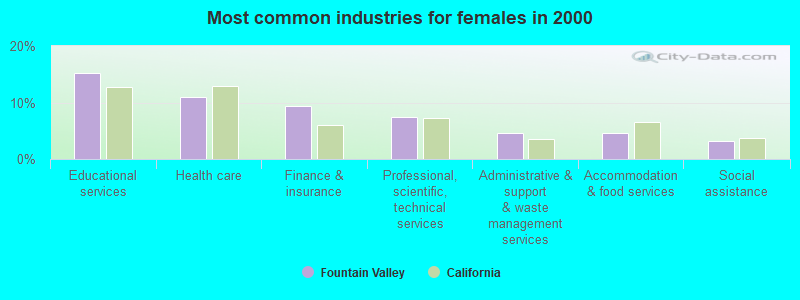
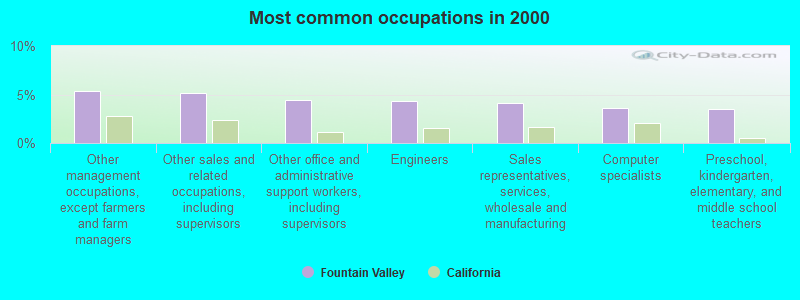
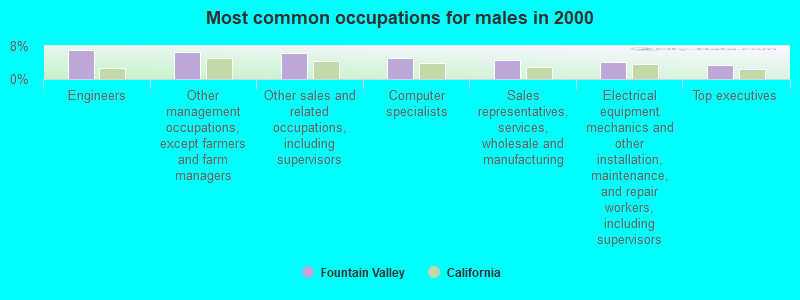
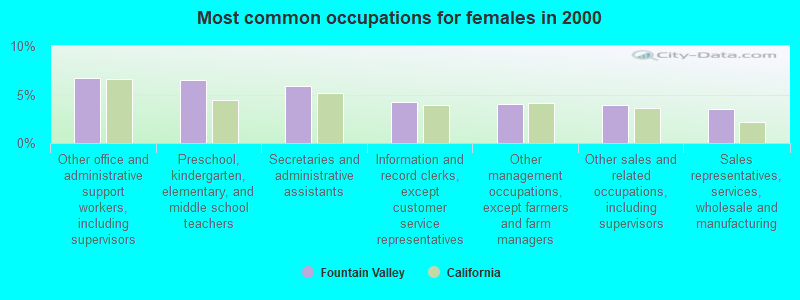
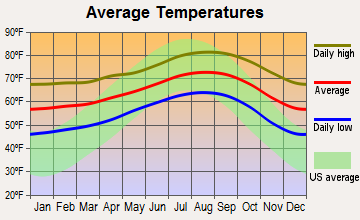
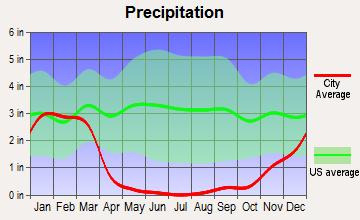
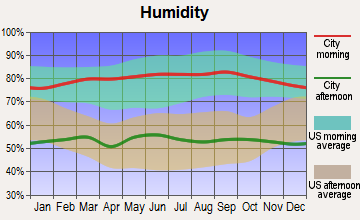
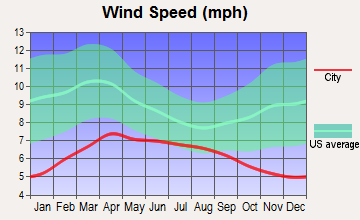
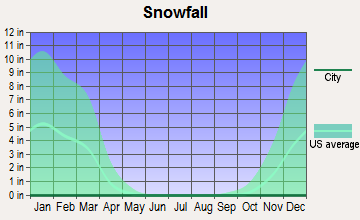
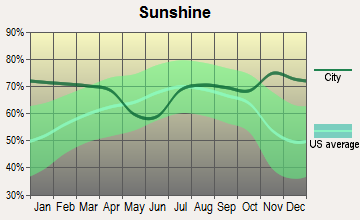
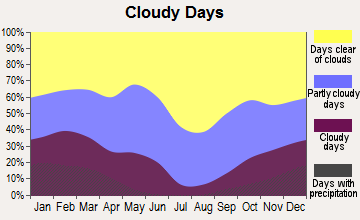
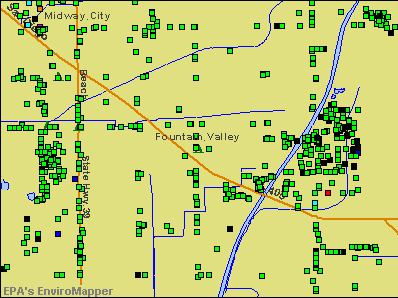

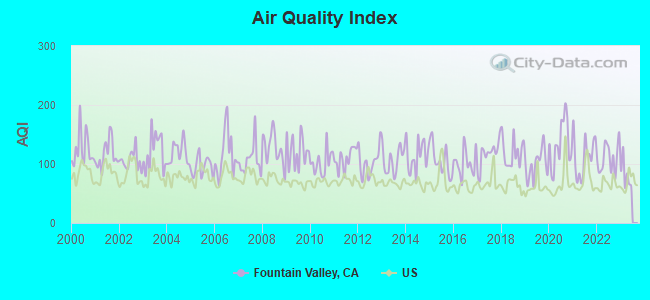
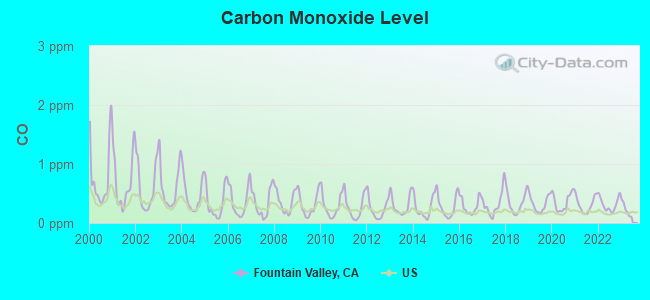
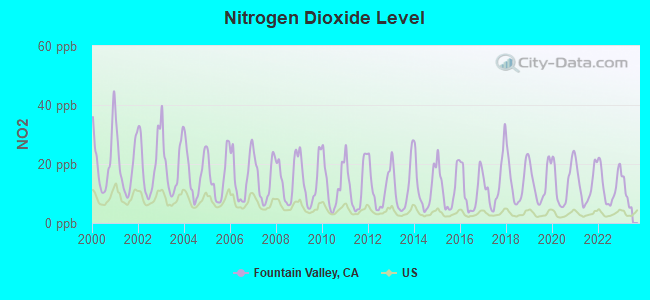
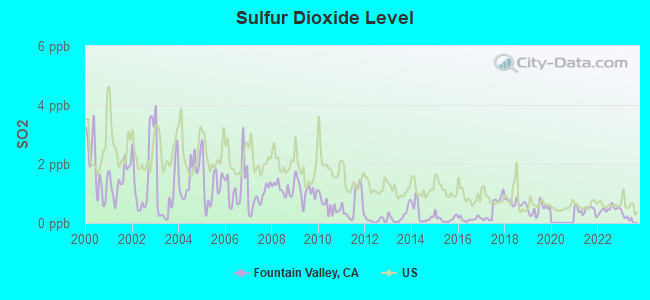
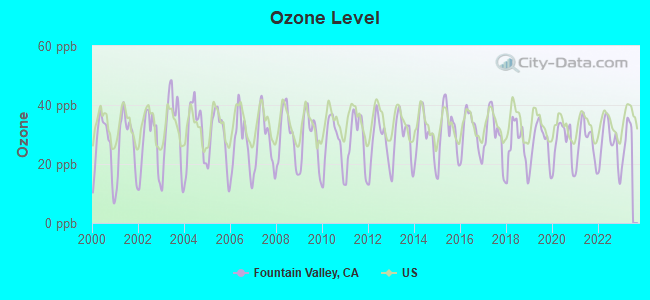
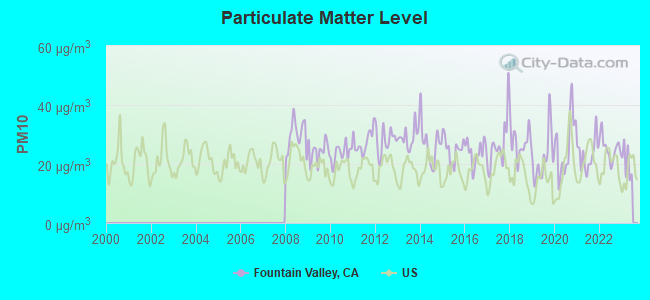
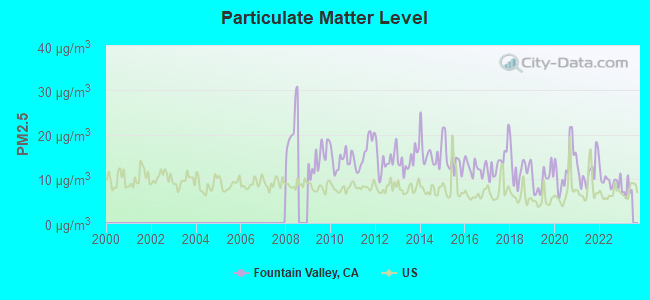

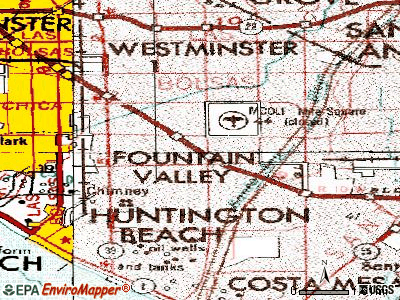
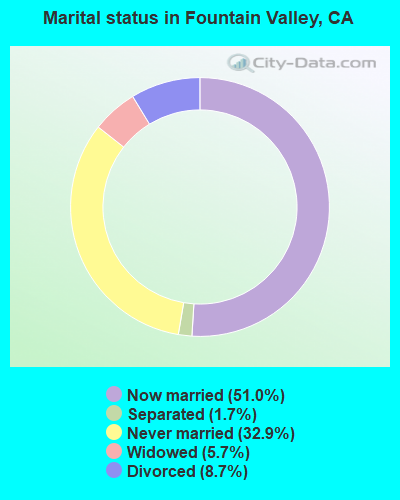
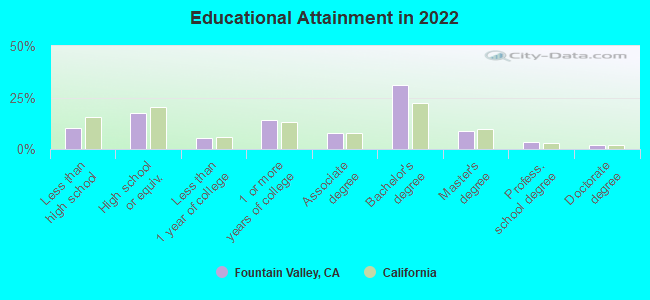
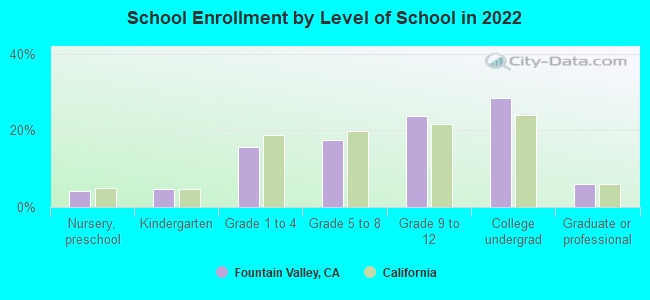
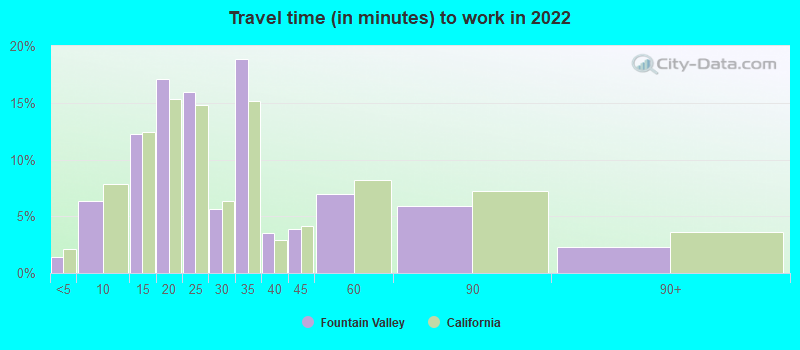
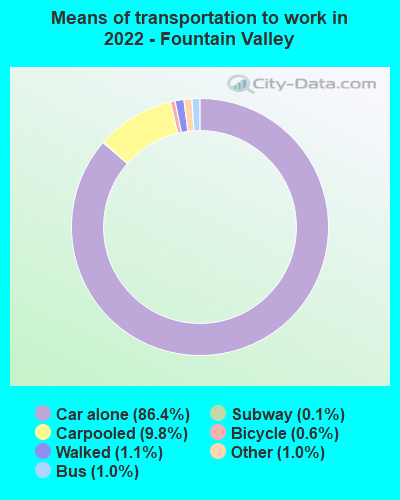


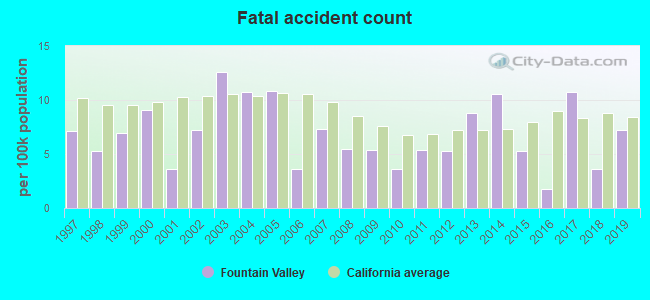
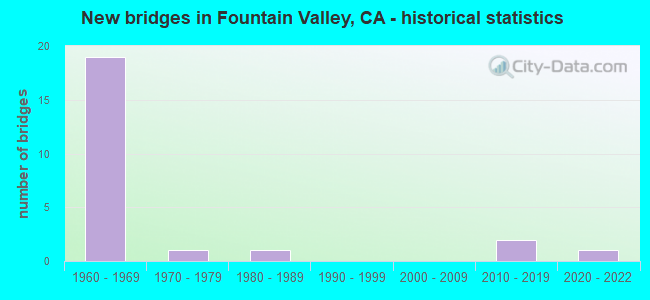
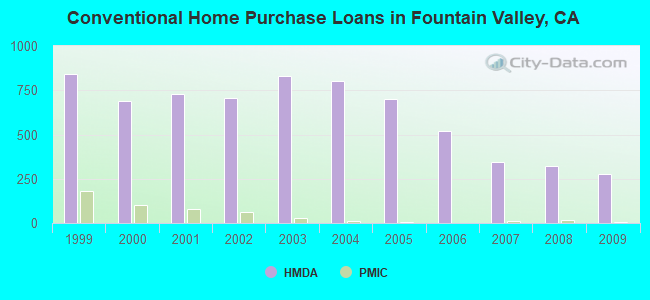
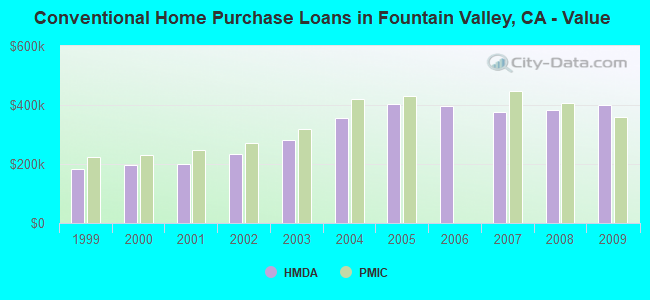
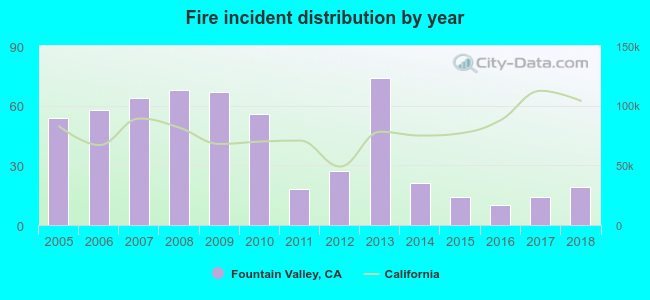 Based on the data from the years 2005 - 2018 the average number of fires per year is 40. The highest number of reported fires - 74 took place in 2013, and the least - 10 in 2016. The data has a dropping trend.
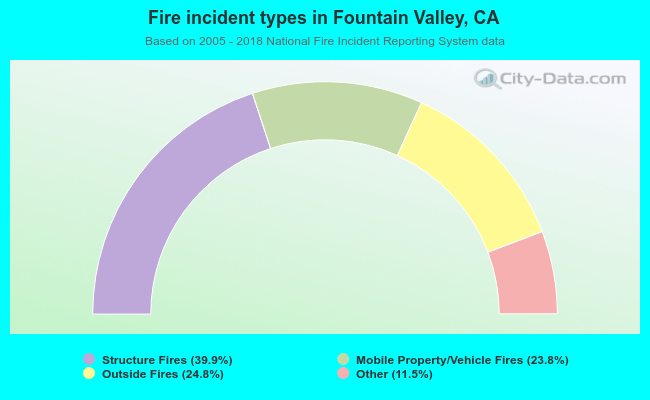 When looking into fire subcategories, the most incidents belonged to: Structure Fires (39.9%), and Outside Fires (24.8%).